Embed Size (px)
Citation preview

King’s Research Portal
Document VersionPeer reviewed version
Link to publication record in King's Research Portal
Citation for published version (APA):Wright, B. A. L., Peters, E. R., Ettinger, U., Kuipers, E. A., & Kumari, V. (2016). Effects of environmental noiseon cognitive (Dys)functions in schizophrenia: A pilot within-subjects experimental study. SchizophreniaResearch, 101-108.
Citing this paperPlease note that where the full-text provided on King's Research Portal is the Author Accepted Manuscript or Post-Print version this maydiffer from the final Published version. If citing, it is advised that you check and use the publisher's definitive version for pagination,volume/issue, and date of publication details. And where the final published version is provided on the Research Portal, if citing you areagain advised to check the publisher's website for any subsequent corrections.
General rightsCopyright and moral rights for the publications made accessible in the Research Portal are retained by the authors and/or other copyrightowners and it is a condition of accessing publications that users recognize and abide by the legal requirements associated with these rights.
•Users may download and print one copy of any publication from the Research Portal for the purpose of private study or research.•You may not further distribute the material or use it for any profit-making activity or commercial gain•You may freely distribute the URL identifying the publication in the Research Portal
Take down policyIf you believe that this document breaches copyright please contact [email protected] providing details, and we will remove access tothe work immediately and investigate your claim.
Download date: 03. Apr. 2020

Number of words in manuscript: 3324
Number of words in abstract: 249 Number of tables: 4 Number of figure: 2
Number of appendices: 1
Effects of Environmental Noise on Cognitive (Dys)functions in Schizophrenia: A Pilot Within-Subjects Experimental Study
Bernice Wright1, Emmanuelle Peters1, Ulrich Ettinger2, Elizabeth Kuipers1,3, Veena Kumari1,3*
1 King's College London, Institute of Psychiatry, Psychology and Neuroscience (IoPPN), Department of Psychology, London, UK; 2 University of Bonn, Department of Psychology, Bonn, Germany; 3 NIHR Biomedical Research Centre for Mental Health, South London and Maudsley NHS Foundation Trust, London, UK *To whom correspondence should be addressed at Department of Psychology (P077), Institute of Psychiatry, Psychology and Neuroscience, King’s College London, De Crespigny Park, London SE5 8AF, UK. Email: [email protected] Running Title: Environmental noise and cognition in schizophrenia
PUBLISHED IN SCHIZOPHRENIA RESEARCH

2
Abstract
Cognitive impairment, particularly in attention, memory and executive function domains, is commonly present
and associated with poor functional outcomes in schizophrenia. In healthy adults, environmental noise adversely
affects many cognitive domains, including those known to be compromised in schizophrenia. This pilot study
examined whether environmental noise causes further cognitive deterioration in a small sample of people with
schizophrenia. Eighteen outpatients with schizophrenia on stable doses of antipsychotics and 18 age and sex-
matched healthy participants were assessed on a comprehensive cognitive battery including measures of
psychomotor speed, attention, executive functioning, working memory, and verbal learning and memory under
three different conditions [quiet: ~30dB(A); urban noise: building site noise, 68-78 dB(A); and social noise:
background babble and footsteps from a crowded hall without any discernible words, 68-78dB(A)], 7-14 days
apart, with counter-balanced presentation of noise conditions across participants of both groups. The results
showed widespread cognitive impairment in patients under all conditions, and noise-induced impairments of
equal magnitude on specific cognitive functions in both groups. Both patient and healthy participant groups
showed significant disruption of delayed verbal recall and recognition by urban and social noise, and of working
memory by social noise, relative to the quiet condition. Performance under urban and social noise did not differ
significantly from each other for any cognitive measure in either group. We conclude that noise has adverse
effects on the verbal and working memory domains in schizophrenia patients and healthy participants. This may
be particularly problematic for patients as it worsens their pre-existing cognitive deficits.
Keywords: Cognition; Performance; Psychosis; Noise management; Urban Noise; Social Noise.

3
1. Introduction
Cognitive deficits are considered a central feature of schizophrenia (Reichenberg and Harvey, 2007) and predict
poor vocational functioning and everyday activities (Reichenberg et al., 2014; Strassnig et al., 2015). While many
studies have aimed at potential cognitive improvement, using pharmacological, psychological, or combination
methods (Harvey and Bowie, 2012), the removal of influences that may exacerbate existing cognitive deficits in
schizophrenia has received relatively less attention. It is possible that environmental factors, such as noise,
cause further cognitive impairment in people with schizophrenia (Wright et al., 2014), especially those living in
urban environments.
It has long been observed that schizophrenia patients report oversensitivity to sensory stimuli (Bowers
and Freeman, 1966) and this has been linked to problems maintaining selective attention (Braff et al., 1977) and
screening out irrelevant information (Sacuzzo and Braff, 1981). Previous research has shown that sensory
overload, invoked using a combination of excessive auditory and visual stimuli in a controlled environment,
causes an increase in manifestations of schizophrenia like behaviour (unusual thought content, social
withdrawal, and general cognitive decline) in healthy participants (Gottschalk et al., 1972). A number of studies
have already documented the adverse effects of noise, using ‘real-life’ noise stimuli (e.g. multiple conversations,
traffic noise), on certain cognitive functions, namely, attention, working memory and episodic recall in healthy
adults (Wright et al., 2014). To our knowledge, there is no previous study examining the impact of environmental
noise on these cognitive functions in people with schizophrenia.
Therefore, the primary aim of this pilot study was a preliminary investigation into the profile and magnitude of
noise effects on cognitive functioning of people with a diagnosis of schizophrenia. Based on the pattern of noise-
induced cognitive disruption seen in healthy adults (Wright et al., 2014), we hypothesised that noise would impair
the performance of both healthy participants and individuals with schizophrenia on tests of attention, working
memory and episodic recall. It was further hypothesised that performance of those with schizophrenia may be
more adversely affected than that of healthy participants, given recent observations of increased hemodynamic
response (Tregellas et al., 2009) and self-reported sensitivity to noise (Landon et al., in press), in addition to long
established sensory gating deficits (Braff, 2010; Patterson et al., 2008), in this clinical population. A secondary
aim was to explore possible differential effects of urban (e.g. building site) and social (e.g. bustling shopping
centre) noise in schizophrenia patients. Although previous studies have shown similar effects of urban and social

4
noise in cognitive performance of healthy adults (review, Wright et al., 2014), social noise may be relatively more
disruptive to cognitive performance of patients, given the association between positive symptoms and exposure
to social situations in this population (Freeman et al., 2015).
2. Methods
2.1 Participants and design
The study involved 18 outpatients who met ICD-10 criteria (World Health Organisation, 1992) for diagnosis of
schizophrenia and 18 age and sex-matched healthy participants. All participants were assessed on a cognitive
battery (Cognitive assessments) under three noise conditions (quiet, urban, and social; detailed under Noise
conditions), with a 1-2 weeks interval between any two assessments. The order of noise conditions (quiet-social-
urban, quiet-urban-social, urban-social-quiet, urban-quiet-social, social-quiet-urban, social-urban-quiet) was
counter-balanced across participants of both groups (each order used three times per group).
Patients were recruited from the outpatient clinical services of the South London and Maudsley NHS
Foundation Trust and local research registers. Healthy participants were recruited via King’s College London
circulars to staff and students and local advertisements, and screened to rule out a personal or family history of
an Axis I or II disorder. The inclusion criteria required all participants to (i) be aged 18-64, (ii) have normal-to-
corrected hearing and vision, (iii) be fluent in English, (iv) have no history of organic brain disorder or primary
ICD-10 diagnosis of substance abuse disorder, and (v) have IQ ≥ 80, assessed using the two subtest version of
the Wechsler Adult Scale of Intelligence (Wechsler, 1999). An additional exclusion criterion for patients was a
period of hospitalisation or a change in medication within 6 months prior to participation.
For sample characterisation purposes (Table 1), all participants were assessed on predicted IQ using
the National Adult Reading Test (NART, Nelson and Willison, 1991), handedness using the Edinburgh
Handedness Inventory (Oldfield, 1971), subjective sensitivity to noise using the Noise Sensitivity Questionnaire
(Schutte et al., 2007), sleep quality using the Pittsburgh Quality of Sleep Inventory (Buysse et al., 1989), and
paranoia occurrence using the Paranoia Checklist (Freeman et al., 2005). In addition, symptoms were rated
using the Positive and Negative Syndrome Scale (PANSS; Kay et al., 1987) and the age of onset of psychotic
symptoms and current medication recorded for those in the patient group.

5
*****Table 1 about here*****
The study was approved by the NHS Camden and Islington Research Ethics Committee (12/LO/0626).
All participants provided written informed consent after the study procedures had been explained to them.
2.2 Noise conditions
All sound generating equipment were kept hidden from participants’ view in an adjunct sound-proof room, with
the connecting door kept open throughout all testing sessions, and speakers (also hidden from participants’ view)
kept in the sound-proof testing room.
Quiet (No noise): This condition took place in a quiet [~30dB(A)] sound-proof laboratory.
Social noise: The social noise stimulus consisted of background babble and footsteps from a crowded hall
[68dB(A)] with louder peaks of indistinguishable social stimuli superimposed on top [78dB(A); loud enough to
cause annoyance but not damage hearing; Berglund et al., 1999]. No specific words could be discerned from the
babble but it mimicked a familiar social environment people encounter in cities.
Urban noise: This noise stimulus consisted of building site noise and did not include any social noise. The noise
intensity, time profile, and the number and duration of louder peaks were matched to that presented during the
social noise stimulus.
2.3 Cognitive assessments
The cognitive battery contained seven tests and included a total of ten measures of psychomotor speed,
attention, executive functioning, working memory, and verbal learning and memory (Table 2).
Selection of tests was based on ease and practicality of administration, high test-retest reliability, and
lack of practice effects or availability of alternate forms. As detailed in Table 2, alternate test forms for Beads
(Dudley et al., 1997), verbal fluency (Benton et al., 1983), and Hopkins verbal learning test-revised (HVLT-R;
Benedict et al., 1998) were used, with each form occurring equally often in the three experimental conditions
across participants of both groups. Prior to running this study, a third letter set (T, A and G) to assess verbal
phonemic fluency was created and validated against the existing two equivalent 3-letter sets (P, R, W and C, F,
L) (Appendix 1). The order of tests in the three experimental conditions was pseudo-randomized across
6
participants, with HVLT-R (Benedict et al., 1998) always in position 1-3 to allow delayed recall testing 25 minutes
later, and the remaining tests presented in a random order. The tasks were presented in the same order during
all three sessions for individual participants. The cognitive assessment session lasted approximately 40 minutes.
All sessions were conducted by the same experimenter (BW).
*****Table 2 about here*****
2.4 General procedure
Participants were told that the aim of the study was to investigate the effects of stress on cognitive function under
‘real life’ environments. They were requested to abstain from alcohol for at least 24 hours prior to the scheduled
testing sessions. Smokers (9 patients, 1 healthy participant) were allowed to smoke a cigarette up until 30
minutes prior to starting the testing session. All sessions began with one or more of the sample characteristic
assessments (lasting >30 minutes on each occasion) in a quiet environment. Then the experimenter activated
the noise stimuli. Following the start of noise exposure, there was a 5-minute (implicit) acclimatization break
before cognitive testing commenced to allow participants to get used to the noise. During this break, the
experimenter engaged the participants in general conversation. The quiet condition also had a similar 5-minute
break before commencing cognitive testing.
2.5 Data analysis
The schizophrenia and healthy participant groups were compared on sex distribution using χ2 and in age,
handedness score, IQ, noise sensitivity, sleep quality, and paranoia using independent sample t-tests. All
cognitive variables were first examined for missing/outlier values, their distribution properties and sphericity. The
effects of noise in the two groups were then examined by Group (patients, healthy participants) x Noise
Condition (quiet, urban noise, social noise) analysis of variance (ANOVA) with Group as the between-subjects
factor and Noise Condition as the within-subjects factor, performed separately for each cognitive variable,
followed by lower order ANOVAs and post-hoc mean comparisons as appropriate. Effect sizes for Group and
Noise Condition effects were estimated as Cohen’s f2. Bonferroni correction was applied to the post-hoc analysis
of significant Noise effects in each measure separately (corrected significance level of p=0.017 for three pairwise
t tests: quiet versus urban, quiet versus social, urban versus social) and Group x Noise interactions (corrected p

7
value of 0.0056 for the nine comparisons: quiet versus urban, quiet versus social, and urban versus social for the
two groups separately, and schizophrenia versus healthy participant group for each noise condition separately).
Bonferroni correction involving all tests was not applied as the a priori hypotheses planned to consider noise
effects in each cognitive domain separately, and pooling all tests would be overly conservative (resulting in a loss
of power/ increase in Type 2 errors). For a graphical display of Group and Noise effects (Figure 1), Z scores for
performance of both groups under urban and social noise (standardized using within-group quiet condition) were
computed to depict the magnitude of facilitation/ disruption caused by the different types of noise.
All analyses were performed using Statistical Package for Social Sciences (version 22). Alpha level for
testing significance of effects was maintained at p<0.05 unless stated otherwise.
3. Results
3.1 Demographic characteristics
The patient and healthy participant groups were comparable on sex distribution, age, handedness and subjective
noise sensitivity levels. Patients, on average, had significantly lower IQ, reduced sleep quality, and higher levels
of paranoia, compared to healthy participants (Table 1).
3.2 Group differences and the effect of noise on cognitive performance
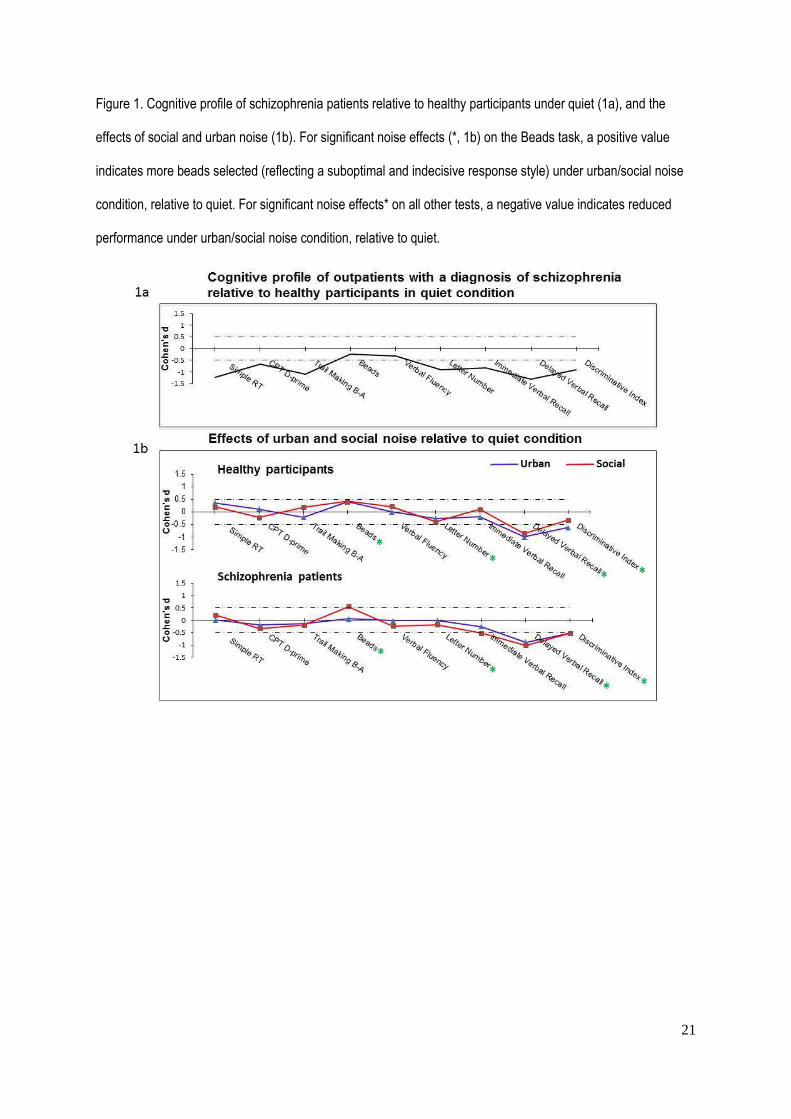
The cognitive profile of patients in the quiet condition, relative to healthy participants, is shown in Figure 1a. The
mean performance scores for both the patient and healthy participant groups under each noise condition are
presented in Table 3 and the results of Group x Noise ANOVAs and follow-up analyses are presented in Table 4.
The effects of noise on cognitive performance of healthy participants and patients, at the group level, are
displayed in Figure 1b. The cognitive change scores (quiet minus urban; quiet minus social) for individual
patients and healthy participants are displayed in Figure 2.
***** Tables 3 and 4 and Figures 1 and 2 about here*****
Group effects: Patient showed impaired performance, relative to healthy participants, across all noise
conditions as indicated by significant main effects of Group (Tables 3 and 4) in seven out of ten variables

8
analysed: psychomotor speed (simple reaction time), attention (CPT D-prime), executive function (time to
complete TMT Part B minus Part A), working memory (Letter Number scores), immediate and delayed verbal
recall, and recognition indices (HVLT-R). Patients’ verbal (phonemic) fluency performance was numerically, but
not significantly, lower (p=0.17) than that of healthy participants. The two groups did not differ in the number of
beads drawn (Tables 3 and 4; Figure 1a) or proportion of participants who did/did not jump-to-conclusions (JTC);
quiet JTC: patients 27.78%, healthy participants 16.67%, X21=0.64, p=0.42; urban noise JTC: patients 33.33%,
healthy participants 16.67%, X21=1.33, p=0.25; social noise JTC: patients 22.22%, healthy participants 22.22%,
X21=0.00, p=1.00. We defined JTC as requiring only two beads before making a decision in accordance with
previous studies (Garety et al., 2005). The pattern of results remained the same when we defined JTC as
requiring only one bead before making a decision following a recent study (Moritz et al., 2015).
Noise effects: The main effect of Noise was significant for three out of the ten measures examined: the
number of beads drawn (Beads), and delayed verbal recall and recognition (HVLT-R). Relative to the quiet
condition, more beads were drawn under social noise, and verbal recall and recognition scores were lower under
both social and urban noise conditions (Tables 3 and 4; Figure 1b). In addition, there was a trend level Noise
effect in working memory (Letter Number scores). Follow-up analysis indicated significant disruption of working
memory by social, but not urban, noise relative to the quiet condition.
Interaction effects: Group x Noise interaction did not reach formal significance for any of the ten measures
examined (Table 4). There was only a trend for a Group x Noise interaction in HVLT immediate recall (Table 4).
Follow-up analysis indicated this to be due to lower scores under social noise relative to quiet in patients (p=0.03;
Table 4), with no noise effects on this measure in healthy participants. However, this follow-up analysis did not
survive Bonferroni correction (required p≤.0.008).
4. Discussion
The main findings of this preliminary investigation demonstrated impairments in patients, relative to healthy
participants, on most cognitive domains across all conditions, and noise-induced impairments of equal
magnitude on specific cognitive functions in both groups. Specifically, we found: (i) significant impairments in
psychomotor speed, attention, executive function, working memory, immediate and delayed verbal recall and
recognition in patients, relative to healthy participants, across all noise conditions, (ii) significantly reduced

9
delayed verbal recall and recognition under both urban and social noise, and (iii) an indecisive response style on
a decision making task (Beads) and significantly reduced working memory, in both groups under social noise
relative to the quiet condition. Noise had similar effects in patients and healthy participants on all cognitive
measures except (at trend level) verbal immediate recall, which was disrupted (at the uncorrected-significance
level) by social noise in patients but not in healthy participants.
Our findings showing a range of cognitive impairment in patients are in line with previous literature
(Reichenberg and Harvey, 2007). Our study, however, did not show a significant JTC bias or a significant verbal
fluency deficit in patients, most likely because our patient sample was stable with relatively lower scores on
relevant symptoms, such as delusions (Garety et al., 2013; Bristow et al., 2014) and we assessed only phonemic
fluency in which schizophrenia patients are generally less impaired than semantic fluency (Bokat and Goldberg,
2003).
Noise effects were not apparent across all cognitive domains. However, the significant disruption of
delayed recall and recognition by urban as well as social noise, and of working memory by social noise (a non-
significant disruption also seen under urban noise), in both groups is in line with our first a priori hypothesis.
Social noise also affected performance on the Beads task, with both groups drawing more beads when tested
under noise, relative to the quiet condition. At least one participant in each group had drawn the maximum
possible number of beads when tested under noise, and this was not the case for any participant when tested in
quiet (Table 3). Our results thus suggest a sub-optimal and indecisive response style, rather than an impulsive
response style (i.e. fewer beads drawn before making a decision; i.e., increased JTC), under noise. In a recent
study (Moritz et al., 2015) that examined the effect of 75 dB building site noise on JTC bias using the Fish Task
(a variant of Beads task) in patients with acute delusional symptoms and healthy participants, there was no
difference between JTC of patients and healthy participants under the neutral condition but a significant
difference emerged during exposure to building site noise. This group difference, however, appears to have been
driven mainly by a change in performance of healthy participants, rather than patients, under noise (Figure 2 in
Moritz et al., 2015). The patient group in our study showed the same pattern of noise effects as the healthy group
on this (Beads) and other tasks, possibly because our patients had relatively low level of positive symptoms and
did not differ from healthy participants in subjective noise sensitivity (Table 1). There was no effect of noise on
CPT D-prime. This is in agreement with a previous report of no change in signal detection under noise in healthy

10
adults (Cornblatt et al., 1988). Noise may have stronger adverse effects on other measures of selective attention
(Wright et al., 2014). In this study, memory, but not attention and executive functions tasks, showed significant
disruption by noise, with delayed recall showing the strongest disruption in both groups (Figure 1b).
There was little support for our hypothesis of exacerbated noise effects in schizophrenia. Only one
measure, immediate verbal recall, that was not significantly affected by noise in healthy participants, showed
impairment, at the uncorrected-significance level, in patients under social noise. It remains to be determined
whether this finding represents a true effect of small size that would become significant with a larger sample [as
per G* power (Faul et al., 2009) analysis, 55 participants per group needed to have 90% power for detecting a
significant Noise x Group interaction at p<0.05], or a chance finding given that the observed effect size for a
Group x Noise interaction in other measures was even smaller (Table 4).
There was no evidence of social noise having significantly greater effect than urban noise either in
patients or healthy participants. Although some measures were significantly affected only by social noise (and
not by urban noise) relative to quiet, performance scores under urban and social noise conditions were not
significantly different from each other for any measure in line with previous findings in healthy people (review,
Wright et al., 2014). Our findings thus suggest that any association between positive symptoms and social
situations in patients (Freeman et al., 2015) did not translate into significantly greater disruption of cognitive
performance by social noise, than urban noise. However, the extent to which our 'social noise' condition was
analogous to a social situation remains unclear.
Despite a lack of significant differential effects of urban or social noise in the patient and healthy
participant groups, this pilot study demonstrates that noisy situations may further alter seemingly stable cognitive
deficits in people with schizophrenia. Given the association between cognitive function and functional outcomes,
noise management, such as reducing exposure to noise where feasible, may improve the lives of people with
psychotic disorders. Furthermore, cognitive assessment of clinical groups on noisy wards may lead to over-
estimation of cognitive deficits in domains that are sensitive to noise.
Strengths of the present study include the use of a within-subjects design along with the thorough
assessment of noise effects in a comprehensive cognitive battery. This design allowed a more coherent
interpretation of the effects of noise on different cognitive domains than previous studies (Wright et al., 2014).
There are also a number of limitations. Firstly, this pilot study involved only a small number of patients which

11
reduced the power of the study. Secondly, while efforts were taken to counterbalance the presentation of tasks, it
is possible that habituation to noise nearer the end of the cognitive battery dampened the magnitude of noise
effects, in line with Smith et al.’s (2010) finding of habituation for mental arithmetic after 10 minutes of noise.
Future studies should recruit a much larger sample and also examine the effects of task-related [e.g.
presentation order, nature (e.g. verbal versus non-verbal), difficulty level and duration of particular tasks], noise-
related (e.g. type, duration and intensity of noise exposure), and participant-related factors (e.g. age, sex,
smoking, medication and symptoms in patients) which may directly or indirectly affect the impact of noise on
cognitive performance. Finally, the study intervention could not be done double-blind as is generally the case for
this sort of design.
In conclusion, the present pilot study found preliminary evidence that noise impairs some cognitive
functions in both healthy people and those with schizophrenia. Although there was little evidence that
schizophrenia patients are more affected by noise than their healthy counterparts, environmental noise worsened
their pre-existing cognitive deficits, particularly in the verbal memory domain. Further studies should focus on
finding ways to improve noise management and/or reduce noise exposure, whenever possible.

12
References Benton, A.L., Hamsher, K.D.S., Sivan A.B., 1983. Multilingual aphasia examination (2nd ed.). AJA Associates,
Iowa City.
Benedict, R.H., Schretlen, D., Groninger, L., Brandt, J., 1998. Hopkins Verbal Learning Test–Revised: Normative
data and analysis of inter-form and test-retest reliability. Clin. Neuropsychol. 12, 43-55.
Berglund, B., Lindvall, T., Schwela, D. H., 1999. Guidelines for community noise. World Health Organisation:
Protection of the Human Environment.
Bokat, C.E., Goldberg, T.E., 2003. Letter and category fluency in schizophrenic patients: a meta-analysis.
Schizophr. Res. 64, 73-78.
Bowers, M.B., Freeman, D.X., 1966. “Psychedelic” experiences in acute psychosis. Arch. Gen. Psychiatry 15,
240-248.
Braff, D. L., Callaway, E., Naylor, H., 1977. Very short-term memory dysfuntion in schizophrenia. Defective short
time constant information prcessing in schizophrenia. Arch. Gen. Psychiatry 34:25-30.
Braff, D.L., 2010. Prepulse inhibition of the startle reflex: a window on the brain in schizophrenia. Curr. Top.
Behav. Neurosci. 4, 349-371.
Bristow, E., Tabraham, P., Smedley, N., Ward, T., Peters, E., 2014. Jumping to perceptions and to conclusions:
specificity to hallucinations and delusions. Schizophr. Res. 154, 68-72.
Buysse, D.J., Reynolds, C.F., Monk, T.H., Berman, S.R., Kupfer, D.J., 1989. The Pittsburgh Sleep Quality Index:
a new instrument for psychiatric practice and research. Psychiat. Res. 8, 193-213.
Cornblatt, B.A., Risch, N.J., Faris, G., Friedman, D., Erlenmeyer-Kimling, L., 1988. The Continuous Performance
Test, identical pairs version (CPT-IP): I. New findings about sustained attention in normal families.
Psychiat. Res. 26, 223-238.
Dudley, R., John, C.H., Young, A., Over, D., 1997. The effect of self‐referent material on the reasoning of people
with delusions. Br. J. Clin. Psychol. 36, 575-584.
Faul, F., Erdfelder, E., Buchner, A., Lang, A.G., 2009. Statistical power analyses using G*Power 3.1: Tests for
correlation and regression analyses. Behav. Res. Methods 41, 1149-1160.
Freeman, D., Emsley, R., Dunn, G., Fowler, D., Bebbington, P., Kuipers, E., Jolley, S., Waller, H., Hardy, A.,
Garety, P., 2015. The stress of the street for patients with persecutory delusions: a test of the

13
symptomatic and psychological effects of going outside into a busy urban area. Schiz. Bull. 41(4), 971-
979.
Freeman, D., Garety, P. A., Bebbington, P. E., Smith, B., Rollinson, R., Fowler, D., Kuipers, E., Katarzyna, R.,
Dunn, G., 2005. Psychological investigation of the structure of paranoia in a non-clinical population. Br.
J. Psychiatry 186(5), 427-435.
Freeman, D., Startup, H., Dunn, G., Černis, E., Wingham, G., Pugh, K., Cordwell, J., Mander, H., Kingdon, D.,
2014. Understanding jumping to conclusions in patients with persecutory delusions: working memory
and intolerance of uncertainty. Psychol. Med. 44, 3017-3024.
Garety, P.A., Freeman, D., 2013. The past and future of delusions research: from the inexplicable to the
treatable. Br. J. Psychiatry 203: 327-333.
Garety, P.A., Freeman, D., Jolley, S., Dunn, G., Bebbington, P.E., Fowler, D.G., Kuipers, E., Dudley, R., 2005.
Reasoning, emotions, and delusional conviction in psychosis. J. Abnorm. Psychol. 114(3), 373-384.
Gold, J.M., Carpenter, C., Randolph, C., Goldberg, T.E., Weinberger, D.R., 1997. Auditory working memory and
Wisconsin Card Sorting Test performance in schizophrenia. Arch. Gen. Psychiatry 54(2), 159-165.
Gottschalk, L.A., Haer, J.L., Bates,D.E., 1972. Effects of sensory overload on psychological state. Arch. Gen.
Psychiatry 27, 451-457.
Harvey, P.D., Bowie, C.R., 2012. Cognitive enhancement in schizophrenia: pharmacological and cognitive
remediation approaches. Psychiatr. Clin. North. Am. 35, 683-698.
Kay, S.R., Flszbein, A., Opfer, L.A., 1987. The positive and negative syndrome scale (PANSS) for schizophrenia.
Schiz. Bull. 13, 261-276.
Landon, J., Shepherd, D., McGarry, M., Theadom, A., Miller, R., In press. When it’s quiet, it’s nice: noise
sensitivity in schizophrenia. Am. J. Psychiat. Rehab.
Lunt, L., Bramham, J., Morris, R.G., Bullock, P.R., Selway, R.P., Xenitidis, K., David, A.S., 2012. Prefrontal
cortex dysfunction and ‘Jumping to Conclusions’: Bias or deficit? J. Neuropsychol. 6, 65-78.
Moritz, S., Köther, U., Hartmann, M., Lincoln, T.M., 2015. Stress is a bad advisor. Stress primes poor decision
making in deluded psychotic patients. Eur. Arch. Clin. Neurosci. 265(6), 461-469.
Nelson, H., Willison, J., 1971. National Adult Reading Test Manual: Windsor: Nfer-Nelson; 1991.21.

14
Oldfield RC: The assessment and analysis of handedness: the Edinburgh inventory. Neuropsychologia 9, 97-
113.
Patterson, J.V., Hetrick, W.P., Boutros, N.N., Jin, Y., Sandman, C., Stern, H., Potkin, S., Bunney, W.E., Jr., 2008.
P50 sensory gating ratios in schizophrenics and controls: a review and data analysis. Psychiat. Res.
158, 226-247.
Reichenberg, A., Feo, C., Prestia, D., Bowie, C.R., Patterson, T.L., Harvey, P.D., 2014. The course and
correlates of everyday functioning in schizophrenia. Schizophr. Res. Cogn. 1, e47-e52.
Reichenberg, A., Harvey, P.D., 2007. Neuropsychological Impairments in Schizophrenia: Integration of
Performance-Based and Brain Imaging Findings. Psychol. Bull. 133, 833-858.
Reitan, R.M., 1958. Validity of the Trail Making Test as an indicator of organic brain damage. Percept. Mot. Skills
8, 271-276.
Saccuzzo, D.P., Braff, D.L., 1981. Early information processing deficit in schizophrenia: New findings using
schizophrenic subgroups and manic control subjects. Arch. Gen. Psychaitry 38(2), 175-179.
Schutte, M., Marks, A., Wenning, E., Griefahn, B., 2007. The development of the noise sensitivity questionnaire.
Noise & Health 9, 15-24.
Smith, A., Waters, B., Jones, H., 2010. Effects of prior exposure to office noise and music on aspects of working
memory. Noise & Health 12, 235-243.
Strassnig, M.T., Raykov, T., O'Gorman, C., Bowie, C.R., Sabbag, S., Durand, D., Patterson, T.L., Pinkham, A.,
Penn, D.L., Harvey, P.D., 2015. Determinants of different aspects of everyday outcome in
schizophrenia: The roles of negative symptoms, cognition, and functional capacity. Schizophr. Res.
165(1), 76-82.
Tregellas, J.R., Ellis, J., Shatti, S., Du, Y.P., Rojas, D.C., 2009. Increased hippocampal, thalamic, and prefrontal
hemodynamic response to an urban noise stimulus in schizophrenia. Am. J. Psychiatry 166, 354-360.
Wechsler, D., 1999. Manual for the Wechsler abbreviated intelligence scale (WASI). San Antonio, Tex: The
Psychological Corporation.
World Health Organization, 1992. International classification of diseases and related health problems, 10th
revision. Geneva: World Health Organization.

15
Wright, B., Peters, E., Ettinger, U., Kuipers, E., Kumari, V., 2014. Understanding noise stress-induced cognitive
impairment in healthy adults and its implications for schizophrenia. Noise & Health 16(70),166-176.
16
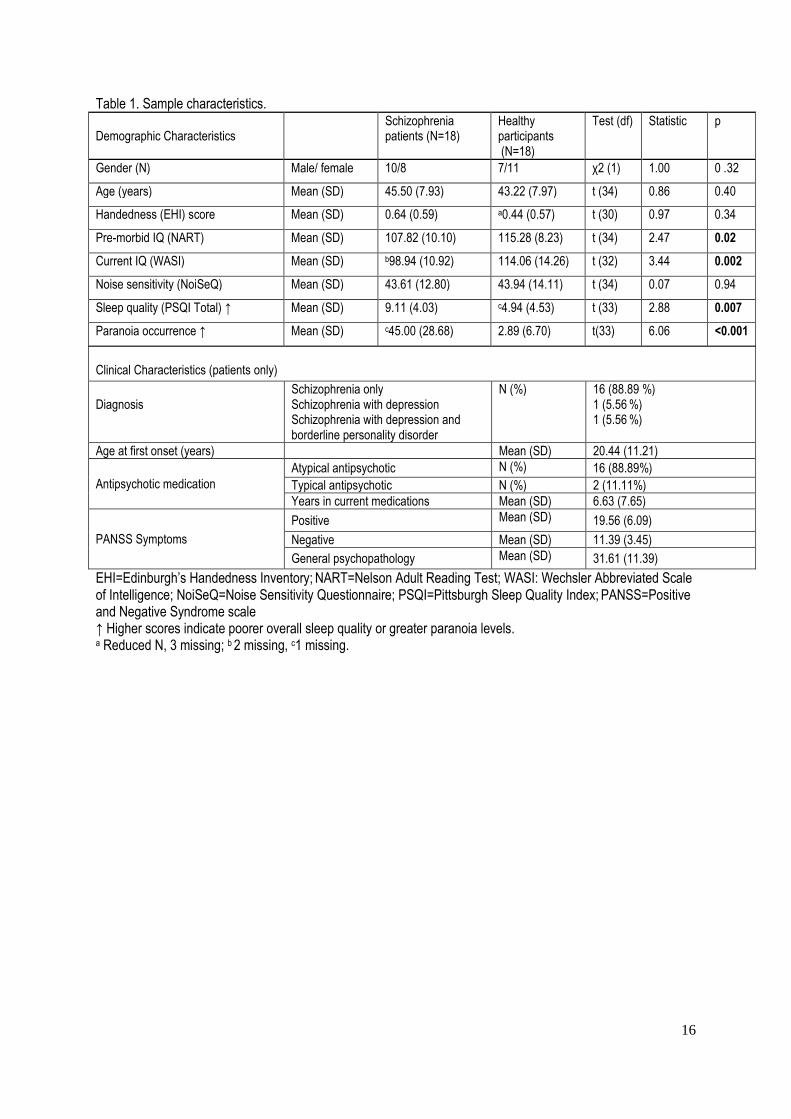
Table 1. Sample characteristics. Demographic Characteristics
Schizophrenia patients (N=18)
Healthy participants (N=18)
Test (df) Statistic p
Gender (N) Male/ female 10/8 7/11 χ2 (1) 1.00 0 .32
Age (years) Mean (SD) 45.50 (7.93) 43.22 (7.97) t (34) 0.86 0.40
Handedness (EHI) score Mean (SD) 0.64 (0.59) a0.44 (0.57) t (30) 0.97 0.34
Pre-morbid IQ (NART) Mean (SD) 107.82 (10.10) 115.28 (8.23) t (34) 2.47 0.02
Current IQ (WASI) Mean (SD) b98.94 (10.92) 114.06 (14.26) t (32) 3.44 0.002
Noise sensitivity (NoiSeQ) Mean (SD) 43.61 (12.80) 43.94 (14.11) t (34) 0.07 0.94
Sleep quality (PSQI Total) ↑ Mean (SD) 9.11 (4.03) c4.94 (4.53) t (33) 2.88 0.007
Paranoia occurrence ↑ Mean (SD) c45.00 (28.68) 2.89 (6.70) t(33) 6.06 <0.001
Clinical Characteristics (patients only)
Diagnosis
Schizophrenia only Schizophrenia with depression Schizophrenia with depression and borderline personality disorder
N (%) 16 (88.89 %) 1 (5.56 %) 1 (5.56 %)
Age at first onset (years) Mean (SD) 20.44 (11.21)
Antipsychotic medication Atypical antipsychotic N (%) 16 (88.89%) Typical antipsychotic N (%) 2 (11.11%) Years in current medications Mean (SD) 6.63 (7.65)
PANSS Symptoms
Positive Mean (SD) 19.56 (6.09)
Negative Mean (SD) 11.39 (3.45)
General psychopathology Mean (SD) 31.61 (11.39)
EHI=Edinburgh’s Handedness Inventory; NART=Nelson Adult Reading Test; WASI: Wechsler Abbreviated Scale of Intelligence; NoiSeQ=Noise Sensitivity Questionnaire; PSQI=Pittsburgh Sleep Quality Index; PANSS=Positive and Negative Syndrome scale ↑ Higher scores indicate poorer overall sleep quality or greater paranoia levels. a Reduced N, 3 missing; b 2 missing, c1 missing.

17
Table 2. Details of the cognitive battery. Cognitive Domain Tests Dependent Variables
Psychomotor Speed Computerised Simple Reaction Time (SRT) Average RT (ms) Attention Continuous Performance Test-Identical Pairs Version (CPT-IP) (Cornblatt et al., 1988) D-Prime (signal detection) Executive Function Trail Making Test (TMT) (Reitan, 1958) Time (s) taken to complete Part B minus Part A (cost of switching
between two tasks) Beads (60:40 ratio) (Dudley et al., 1997) Alternate forms: red and blue beads; green and black beads; yellow and black beads. Presented under executive function due to evidence of significant associations between Beads performance and working memory and cognitive flexibility (Freeman et al., 2015; Lunt et al., 2012)
Total number of beads selected Jumping to conclusion style (JTC; i.e., proportion making a decision after 2 beads or fewer) (Garety et al., 2005)
Phonemic Verbal Fluency (Benton et al., 1983) Alternate forms: P,R,W; C,F,L; T,A,G
Total correct number of words produced in 60 s (average of three letters)
Working Memory Letter Number Test (Gold et al., 1997) Total number of correct letter number strings
Verbal Learning and Memory Hopkins Verbal Learning Test – Revised. Alternate forms 1, 2 and 4) (Benedict et al., 1998)
Immediate recall Delayed recall Discriminative index for recognition
18
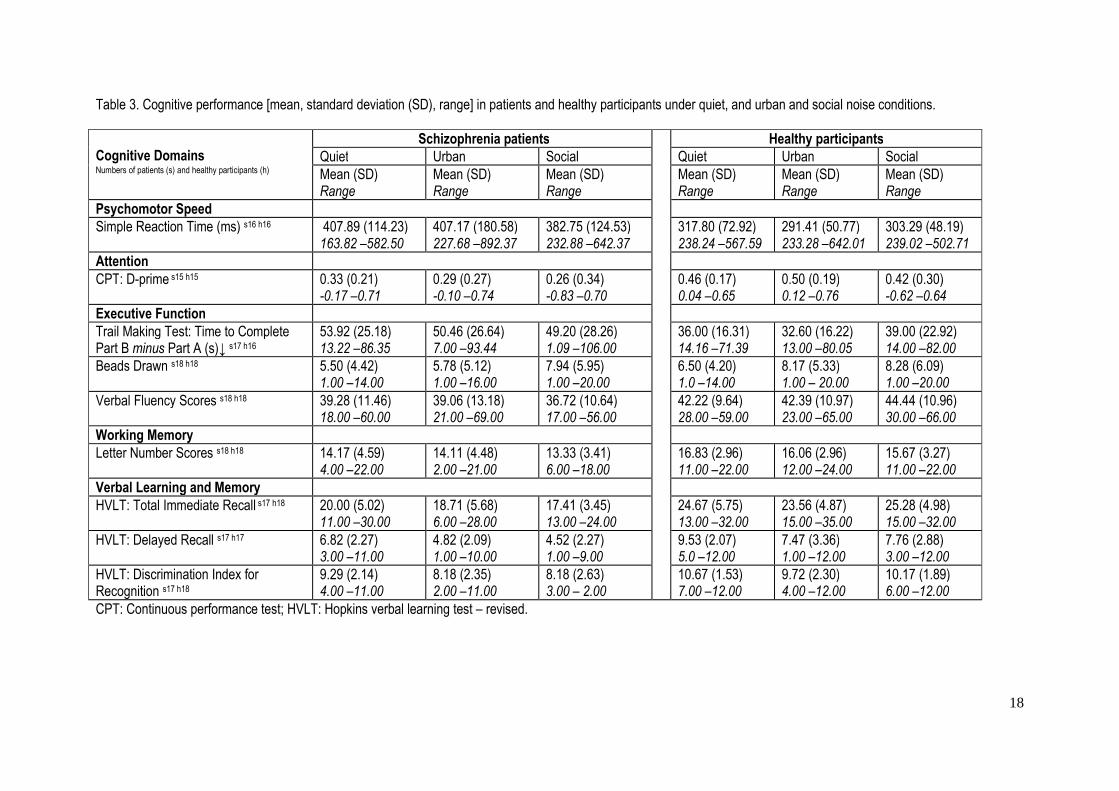
Table 3. Cognitive performance [mean, standard deviation (SD), range] in patients and healthy participants under quiet, and urban and social noise conditions.
Cognitive Domains Numbers of patients (s) and healthy participants (h)
Schizophrenia patients Healthy participants
Quiet Urban Social Quiet Urban Social Mean (SD) Range
Mean (SD) Range
Mean (SD) Range
Mean (SD) Range
Mean (SD) Range
Mean (SD) Range
Psychomotor Speed Simple Reaction Time (ms) s16 h16 407.89 (114.23)
163.82 –582.50 407.17 (180.58) 227.68 –892.37
382.75 (124.53) 232.88 –642.37
317.80 (72.92) 238.24 –567.59
291.41 (50.77) 233.28 –642.01
303.29 (48.19) 239.02 –502.71
Attention CPT: D-prime s15 h15 0.33 (0.21)
-0.17 –0.71 0.29 (0.27) -0.10 –0.74
0.26 (0.34) -0.83 –0.70
0.46 (0.17) 0.04 –0.65
0.50 (0.19) 0.12 –0.76
0.42 (0.30) -0.62 –0.64
Executive Function Trail Making Test: Time to Complete Part B minus Part A (s)↓ s17 h16
53.92 (25.18) 13.22 –86.35
50.46 (26.64) 7.00 –93.44
49.20 (28.26) 1.09 –106.00
36.00 (16.31) 14.16 –71.39
32.60 (16.22) 13.00 –80.05
39.00 (22.92) 14.00 –82.00
Beads Drawn s18 h18 5.50 (4.42) 1.00 –14.00
5.78 (5.12) 1.00 –16.00
7.94 (5.95) 1.00 –20.00
6.50 (4.20) 1.0 –14.00
8.17 (5.33) 1.00 – 20.00
8.28 (6.09) 1.00 –20.00
Verbal Fluency Scores s18 h18 39.28 (11.46) 18.00 –60.00
39.06 (13.18) 21.00 –69.00
36.72 (10.64) 17.00 –56.00
42.22 (9.64) 28.00 –59.00
42.39 (10.97) 23.00 –65.00
44.44 (10.96) 30.00 –66.00
Working Memory Letter Number Scores s18 h18 14.17 (4.59)
4.00 –22.00 14.11 (4.48) 2.00 –21.00
13.33 (3.41) 6.00 –18.00
16.83 (2.96) 11.00 –22.00
16.06 (2.96) 12.00 –24.00
15.67 (3.27) 11.00 –22.00
Verbal Learning and Memory HVLT: Total Immediate Recall s17 h18 20.00 (5.02)
11.00 –30.00 18.71 (5.68) 6.00 –28.00
17.41 (3.45) 13.00 –24.00
24.67 (5.75) 13.00 –32.00
23.56 (4.87) 15.00 –35.00
25.28 (4.98) 15.00 –32.00
HVLT: Delayed Recall s17 h17 6.82 (2.27) 3.00 –11.00
4.82 (2.09) 1.00 –10.00
4.52 (2.27) 1.00 –9.00
9.53 (2.07) 5.0 –12.00
7.47 (3.36) 1.00 –12.00
7.76 (2.88) 3.00 –12.00
HVLT: Discrimination Index for Recognition s17 h18
9.29 (2.14) 4.00 –11.00
8.18 (2.35) 2.00 –11.00
8.18 (2.63) 3.00 – 2.00
10.67 (1.53) 7.00 –12.00
9.72 (2.30) 4.00 –12.00
10.17 (1.89) 6.00 –12.00
CPT: Continuous performance test; HVLT: Hopkins verbal learning test – revised.

19
Table 4. The results of the repeated-measures analyses of variance (ANOVA) for cognitive performance. Cognitive Domains Numbers of patients (s) and healthy participants (h)
ANOVA Statistics
Effects (df) F p Effect size f2�
Psychomotor Speed *Simple Reaction Time↓ s16 h16 Group (1,30) 8.66 0.006 0.289
Slower simple reaction time in patients. Noise (2, 50) 0.63 0.51 0.021 Group x Noise (2,50) 0.53 0.59 0.017
Attention CPT: D-prime s15 h15 Group (1,28) 5.39 0.03 0.192
Poorer signal detection in patients. Noise (2,56) 0.70 0.50 0.025 Group x Noise (2,56) 0.22 0.81 0.008
Executive Function Trail MakingTest: Time to complete Part B minus Part A↓ s17 h16
Group (1,31) 4.70 0.04 0.152 Patients worse than healthy participants. Noise (2,62) 0.55 0.58 0.017 Group x Noise (2,62) 0.86 0.43 0.028
**Beads Drawn s18 h18
Group (1,34) 0.62 0.44 0.018 Noise (2,68) 5.30 0.007 0.156 More beads under social noise than quiet (t=2.96,df=35, p=0.006).
Group x Noise (2,68) 1.31 0.28 0.038 Verbal Fluency s18 h18
Group (1,34) 2.00 0.17 0.058 Noise (2,68) 0.02 0.98 0.001 Group x Noise (2,68) 1.68 0.20 0.049
Working Memory Letter Number Scores s18 h18
Group (1,34) 4.21 0.05 0.124 Lower scores in patients.
Noise (2,68) 2.96 0.06 0.087
Lower scores under social noise than quiet (t=2.96, df=35, p=0.006). Group x Noise (2,68) 0.38 0.68 0.011
Verbal Learning and Memory HVLT: Total Immediate Recall s17 h18 Group (1,33) 16.42 <0.001 0.497
Patients recalled fewer words.
Noise (2,66) 1.31 0.28 0.031 Group x Noise (2,66) 2.57 0.085 0.078 Noise effect in patients (2,32) Lower scores under social noise than quiet (t=2.36, df=16, p=0.03).
2.19 0.13 0.136
Noise effect in healthy participants (2,34) 1.50 0.24 0.087 Group effect in each noise condition (33) Patients recalled fewer words than healthy people in all conditions: quiet: t=2.55, p=0.02; urban noise: t=2.92, p=0.006; social noise: t=5.40, p<0.001.
HVLT: Delayed Recall s17 h17
Group (1,32) 14.03 0.001 0.439 Patients recalled fewer words. Noise (2,64) 21.31 0.001 0.667 Urban (t =5.36, df=33, p<0.001) and social (t=5.75, df=34, p<0.001) noise worse than quiet.
Group x Noise (2,64) 0.41 0.67 0.013 HVLT: Discrimination Index for Recognition s17 h18
Group (1,33) 6.48 0.02 0.196 Poor word discrimination in patients.
Noise (2,66) 6.46 0.003 0.196 Urban (t=3.50,df=34,p=0.001) and social (t=2.88,

20
�Cohen f2 effect sizes: small=0.02, medium=0.15, large=0.35. Bold p levels indicates significance at <0.05 or at trend level (p<0.09). *Greenhouse-Geisser correction applied as Mauchly’s W was significant (p=0.04) CPT: Continuous Performance Test; HVLT: Hopkins verbal learning test – revised. **The same pattern of results obtained if JTC defined as only requiring one bead following Moritz et al. (2015).
df=34, p=0.007) noise worse than quiet.
Group x Noise (2,66) 0.56 0.58 0.017
21
Figure 1. Cognitive profile of schizophrenia patients relative to healthy participants under quiet (1a), and the
effects of social and urban noise (1b). For significant noise effects (*, 1b) on the Beads task, a positive value
indicates more beads selected (reflecting a suboptimal and indecisive response style) under urban/social noise
condition, relative to quiet. For significant noise effects* on all other tests, a negative value indicates reduced
performance under urban/social noise condition, relative to quiet.

22
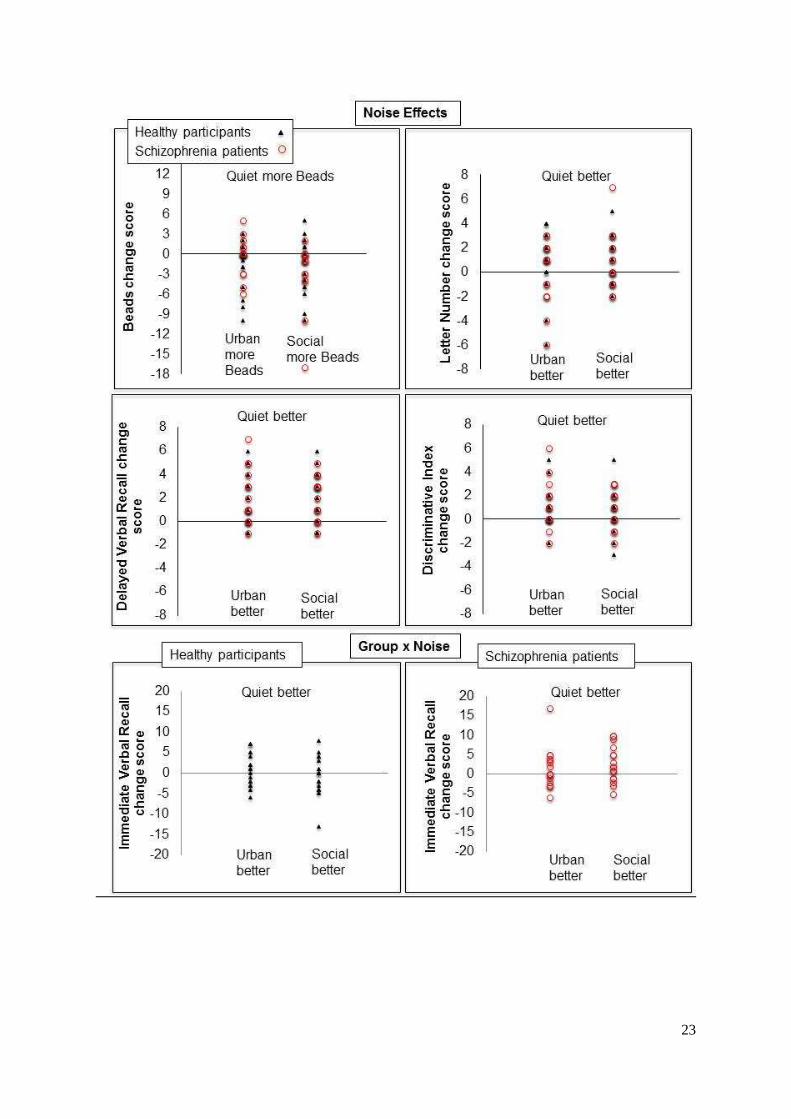
Figure 2. Cognitive change scores (quiet minus urban; quiet minus social) for variables displaying a significant
main effect of Noise (top two rows) or a Group x Noise trend for individual patients and healthy participants.
For quiet minus urban/social noise change scores on the Beads task, a negative value indicates more beads
selected, reflecting an indecisive response style, under urban/social condition, relative to quiet. For all other
tests, a negative value indicates reduced performance under urban/social noise condition, relative to quiet.
23

24
Appendix 1. Development and validation of a third subset (T,A,G) of verbal fluency letters comparable to the
existing two sets (P,R,W and C,F,L).
Phonemic VF is commonly used in clinical settings, with good-to-excellent test-retest correlations over 6 or 12
months periods for the same letters (F,A,S) (Basso et al., 1999) or alternative versions (C,F,L and P,W,R). Our
noise study, however, required retesting over a much shorter period and three equivalent sets. This led us to
create and validate a new 3-letter set (T,A,G). The letters T, A and G in the new set were chosen because of
their equivalent difficulty to the letters in P, W, R and C, F, L sets (Borkowski et al., 1967).To confirm equivalence
of the three 3-letter sets (C,F,L; P,W,R; T,A,G), 38 English speaking healthy participants (20 male, 18 female;
18-64 years old; none included in the noise study) were instructed to generate as many different words as they
could in 60 seconds for each of the nine letters (pseudo-randomised presentation across participants; each letter
presented 4 times in the same serial position). Perseverations (repetitions) and grammatical errors (changing the
ending of a root word) were recorded. The comparability of the three sets was established by a) lack of a
significant difference in the sum of words generated to the three letters in each set [mean (SD), C,F,L: 51.92
(10.55); P,W,R: 49.71 (9.61); T,A,G: 50.11 (9.16); repeated measure analysis of variance, F=1.43, df=2,74,
p>0.05)], and b) highly significant correlations (p<0.001) between the three 3-letter sets (P,R,W and C,F,L: r
=0.75; P,R,W and T,A,G: r=0.79; T,A,G and C,F,L: r=0.80). Very few errors were made for any of the three sets
[mean (SD), C,F,L: 1.45 (1.74); P,W,R: 1.42 (1.54); T-A-G: 1.66 (1.83)].
References
Basso, M.R., Bornstein, R.A., Lang, J.M., 1999. Practice effects on commonly used measures of executive
function across twelve months. Clin. Neuropsychol. 13, 283-292.
Borkowski, J.G., Benton, A.L., Preen, O., 1967. Word fluency and brain damage. Neuropsychologia 5, 135-140.