Embed Size (px)
Citation preview
King’s Research Portal
DOI:10.1371/journal.pgen.1006820
Document VersionPublisher's PDF, also known as Version of record
Link to publication record in King's Research Portal
Citation for published version (APA):Li, H., Reksten, T. R., Ice, J. A., Kelly, J. A., Adrianto, I., Rasmussen, A., ... Sivils, K. L. (2017). Identification of aSjögren's syndrome susceptibility locus at OAS1 that influences isoform switching, protein expression, andresponsiveness to type I interferons. PL o S Genetics, 13(6), [e1006820].https://doi.org/10.1371/journal.pgen.1006820
Citing this paperPlease note that where the full-text provided on King's Research Portal is the Author Accepted Manuscript or Post-Print version this maydiffer from the final Published version. If citing, it is advised that you check and use the publisher's definitive version for pagination,volume/issue, and date of publication details. And where the final published version is provided on the Research Portal, if citing you areagain advised to check the publisher's website for any subsequent corrections.
General rightsCopyright and moral rights for the publications made accessible in the Research Portal are retained by the authors and/or other copyrightowners and it is a condition of accessing publications that users recognize and abide by the legal requirements associated with these rights.
•Users may download and print one copy of any publication from the Research Portal for the purpose of private study or research.•You may not further distribute the material or use it for any profit-making activity or commercial gain•You may freely distribute the URL identifying the publication in the Research Portal
Take down policyIf you believe that this document breaches copyright please contact [email protected] providing details, and we will remove access tothe work immediately and investigate your claim.
Download date: 16. Jan. 2020

RESEARCH ARTICLE
Identification of a Sjogren’s syndrome
susceptibility locus at OAS1 that influences
isoform switching, protein expression, and
responsiveness to type I interferons
He Li1,2¤, Tove Ragna Reksten1,3, John A. Ice1, Jennifer A. Kelly1, Indra Adrianto1,
Astrid Rasmussen1, Shaofeng Wang1, Bo He1,2, Kiely M. Grundahl1, Stuart B. Glenn1,
Corinne Miceli-Richard4, Simon Bowman5, Sue Lester6, Per Eriksson7, Maija-
Leena Eloranta8, Johan G. Brun9,10, Lasse G. Gøransson11, Erna Harboe11, Joel
M. Guthridge1, Kenneth M. Kaufman12,13, Marika Kvarnstrom14, Deborah S. Cunninghame
Graham15, Ketan Patel16,17, Adam J. Adler1, A. Darise Farris1,2, Michael T. Brennan18,
James Chodosh19, Rajaram Gopalakrishnan20, Michael H. Weisman21,
Swamy Venuturupalli21, Daniel J. Wallace21, Kimberly S. Hefner22, Glen D. Houston23,24,
Andrew J. W. Huang25, Pamela J. Hughes16, David M. Lewis23, Lida Radfar26, Evan
S. Vista1,27, Contessa E. Edgar28, Michael D. Rohrer29, Donald U. Stone30, Timothy
J. Vyse15, John B. Harley12,13, Patrick M. Gaffney1, Judith A. James1,2,31, Sean Turner1,
Ilias Alevizos32, Juan-Manuel Anaya33, Nelson L. Rhodus34, Barbara M. Segal35, Courtney
G. Montgomery1, R. Hal Scofield1,31,36, Susan Kovats1, Xavier Mariette4, Lars Ronnblom8,
Torsten Witte37, Maureen Rischmueller6,38, Marie Wahren-Herlenius14, Roald Omdal11,
Roland Jonsson3,10, Wan-Fai Ng39, for UK Primary Sjogren’s Syndrome Registry¶,
Gunnel Nordmark8, Christopher J. Lessard1,2‡, Kathy L. Sivils1,2‡*
1 Arthritis and Clinical Immunology Research Program, Oklahoma Medical Research Foundation, Oklahoma
City, Oklahoma, United States of America, 2 Department of Pathology, University of Oklahoma Health
Sciences Center, Oklahoma City, Oklahoma, United States of America, 3 Broegelmann Research
Laboratory, Department of Clinical Science, University of Bergen, Bergen, Norway, 4 Universite Paris-Sud,
AP-HP, Hopitaux Universitaires Paris-Sud, INSERM U1012, Le Kremlin Bicêtre, France, 5 Rheumatology
Department, University Hospital Birmingham, Birmingham, United Kingdom, 6 The Queen Elizabeth
Hospital, Adelaide, South Australia, Australia, 7 Department of Rheumatology, Clinical and Experimental
Medicine, Linkoping University, Linkoping, Sweden, 8 Department of Medical Sciences, Rheumatology,
SciLIfeLab, Uppsala University, Uppsala, Sweden, 9 Department of Clinical Science, University of Bergen,
Bergen, Norway, 10 Department of Rheumatology, Haukeland University Hospital, Bergen, Norway,
11 Clinical Immunology Unit, Department of Internal Medicine, Stavanger University Hospital, Stavanger,
Norway, 12 Division of Rheumatology, Cincinnati Children’s Hospital Medical Center, Cincinnati, Ohio, United
States of America, 13 US Department of Veterans Affairs Medical Center, Cincinnati, Ohio, United States of
America, 14 Department of Medicine, Karolinska Institutet, Stockholm, Sweden, 15 Department of Medical
and Molecular Genetics, King’s College London, London, United Kingdom, 16 Division of Oral and
Maxillofacial Surgery, Department of Developmental and Surgical Science, University of Minnesota School of
Dentistry, Minneapolis, Minnesota, United States of America, 17 Department of Oral and Maxillofacial
Surgery, North Memorial Medical Center, Robbinsdale, Minnesota, United States of America, 18 Department
of Oral Medicine, Carolinas Medical Center, Charlotte, North Carolina, United States of America,
19 Massachusetts Eye and Ear Infirmary, Department of Ophthalmology, Harvard Medical School, Boston,
Massachusetts, United States of America, 20 Division of Oral Pathology, Department of Diagnostic and
Biological Sciences, University of Minnesota School of Dentistry, Minneapolis, Minnesota, United States of
America, 21 Division of Rheumatology, Cedars-Sinai Medical Center, Los Angeles, California, United States
of America, 22 Hefner Eye Care and Optical Center, Oklahoma City, Oklahoma, United States of America,
23 Department of Oral and Maxillofacial Pathology, University of Oklahoma College of Dentistry, Oklahoma
City, Oklahoma, United States of America, 24 Heartland Pathology Consultants, Edmond, Oklahoma, United
States of America, 25 Department of Ophthalmology and Visual Sciences, Washington University, St. Louis,
Missouri, United States of America, 26 Oral Diagnosis and Radiology Department, University of Oklahoma
College of Dentistry, Oklahoma City, Oklahoma, United States of America, 27 University of Santo Tomas
Hospital, Manila, The Philippines, 28 The Biology Department, Oklahoma Baptist University, Oklahoma City,
Oklahoma, United States of America, 29 Hard Tissue Research Laboratory, University of Minnesota School
PLOS Genetics | https://doi.org/10.1371/journal.pgen.1006820 June 22, 2017 1 / 29
a1111111111
a1111111111
a1111111111
a1111111111
a1111111111
OPENACCESS
Citation: Li H, Reksten TR, Ice JA, Kelly JA,
Adrianto I, Rasmussen A, et al. (2017)
Identification of a Sjogren’s syndrome
susceptibility locus at OAS1 that influences isoform
switching, protein expression, and responsiveness
to type I interferons. PLoS Genet 13(6): e1006820.
https://doi.org/10.1371/journal.pgen.1006820
Editor: Gosia Trynka, Gronigen University,
NETHERLANDS
Received: October 21, 2016
Accepted: May 14, 2017
Published: June 22, 2017
Copyright: This is an open access article, free of all
copyright, and may be freely reproduced,
distributed, transmitted, modified, built upon, or
otherwise used by anyone for any lawful purpose.
The work is made available under the Creative
Commons CC0 public domain dedication.
Data Availability Statement: All relevant data are
within the paper and its Supporting Information
files.
Funding: We would like to thank the following
funding agencies: this publication was made
possible by grants from NIH: P50AR0608040
(KLS, CJL, RHS, and ADF), 1R01AR065953 (CJL),
5R01DE015223 (KLS and JBH), 5RC2AR058959
(PMG), 5P01AR049084 (JBH), 5P30AR053483
(JAJ and JMG), 5U19AI082714 (KLS, JAJ, and
of Dentistry, Minneapolis, Minnesota, United States of America, 30 Department of Ophthalmology, Johns
Hopkins University, Baltimore, Maryland, United States of America, 31 Department of Medicine, University of
Oklahoma Health Sciences Center, Oklahoma City, Oklahoma, United States of America, 32 National
Institute of Dental and Craniofacial Research, NIH, Bethesda, Maryland, United States of America, 33 Center
for Autoimmune Diseases Research, Universidad del Rosario, Bogota, Colombia, 34 Department of Oral
Surgery, University of Minnesota School of Dentistry, Minneapolis, Minnesota, United States of America,
35 Division of Rheumatology, University of Minnesota Medical School, Minneapolis, Minnesota, United
States of America, 36 US Department of Veterans Affairs Medical Center, Oklahoma City, Oklahoma, United
States of America, 37 Clinic for Immunology and Rheumatology, Hannover Medical School, Hannover,
Germany, 38 The University of Adelaide, Adelaide, South Australia, Australia, 39 Institute of Cellular
Medicine & NIHR Newcastle Biomedical Research Centre, Newcastle University, Newcastle upon Tyne,
United Kingdom
¤ Current address: Institute for Genomic Medicine, University of California, San Diego, La Jolla, California,
United States of America
‡ These are joint senior authors on this work.
¶ Membership of UK Primary Sjogren’s Syndrome Registry is provided in S1 Text
Abstract
Sjogren’s syndrome (SS) is a common, autoimmune exocrinopathy distinguished by kerato-
conjunctivitis sicca and xerostomia. Patients frequently develop serious complications
including lymphoma, pulmonary dysfunction, neuropathy, vasculitis, and debilitating fatigue.
Dysregulation of type I interferon (IFN) pathway is a prominent feature of SS and is corre-
lated with increased autoantibody titers and disease severity. To identify genetic determi-
nants of IFN pathway dysregulation in SS, we performed cis-expression quantitative trait
locus (eQTL) analyses focusing on differentially expressed type I IFN-inducible transcripts
identified through a transcriptome profiling study. Multiple cis-eQTLs were associated
with transcript levels of 2’-5’-oligoadenylate synthetase 1 (OAS1) peaking at rs10774671
(PeQTL = 6.05 × 10⁻¹⁴). Association of rs10774671 with SS susceptibility was identified and
confirmed through meta-analysis of two independent cohorts (Pmeta = 2.59 × 10⁻⁹; odds
ratio = 0.75; 95% confidence interval = 0.66–0.86). The risk allele of rs10774671 shifts splic-
ing of OAS1 from production of the p46 isoform to multiple alternative transcripts, including
p42, p48, and p44. We found that the isoforms were differentially expressed within each
genotype in controls and patients with and without autoantibodies. Furthermore, our results
showed that the three alternatively spliced isoforms lacked translational response to type I
IFN stimulation. The p48 and p44 isoforms also had impaired protein expression governed
by the 3’ end of the transcripts. The SS risk allele of rs10774671 has been shown by others
to be associated with reduced OAS1 enzymatic activity and ability to clear viral infections,
as well as reduced responsiveness to IFN treatment. Our results establish OAS1 as a risk
locus for SS and support a potential role for defective viral clearance due to altered IFN
response as a genetic pathophysiological basis of this complex autoimmune disease.
Author summary
Sjogren’s syndrome (SS) is a common autoimmune condition where immune cells infil-
trate moisture-producing glands, leading to dryness typically in the eyes and mouth. SS
Variant that affects OAS1 splicing associates with Sjogren’s syndrome
PLOS Genetics | https://doi.org/10.1371/journal.pgen.1006820 June 22, 2017 2 / 29
CJL), U19AI056363 (ADF), 1R01DE018209 (KLS
and JBH), 5R01DE018209 (KLS), 8P20GM103456
(PMG, CJL, and IA), 1P30GM110766 (IA and
CGM), 1R03AR065786 (IA), 5R37AI024717 (JBH),
5P01AI083194 (KLS and JBH), 7S10RR027190-02
(JBH), 1U01AI101934 (JAJ and JMG),
U54GM104938 (JAJ), S10RR026735 (JAJ), and
5P30GM103510 (JAJ and JMG). The contents are
the sole responsibility of the authors and do not
necessarily represent the official views of the NIH.
Additional funding was obtained from Intramural
Research Program of the National Institute of
Dental and Craniofacial Research (GGI), US
Department of Veterans Affairs IMMA 9 (JBH),
USA Department of Defense PR094002 (JBH),
American College of Rheumatology Research and
Education Foundation/Abbott Health Professional
Graduate Student Preceptorship Award 2009 (CJL
and KLS), Oklahoma Medical Research Foundation
(CJL and KLS), Sjogren’s Syndrome Foundation
(HL, CJL, and KLS), Phileona Foundation (KLS),
French ministry of health: PHRC N˚2006-
AOM06133 and French ministry of research: ANR-
2010-BLAN-1133 (XM and CM), The Strategic
Research Program at Helse Bergen, Western
Norway Regional Health Authority (LGG, JGB, and
RJ), The Broegelmann Foundation (JGB and RJ),
Norwegian Foundation for Health and
Rehabilitation (EH), KFO 250 TP03, WI 1031/6-1
(TW), KFO 250, Z1 (TW), Medical Research
Council, UK G0800629 (WN and SB),
Northumberland, Tyne & Wear CLRN (WN), The
Swedish Research Council (MW and LR), The King
Gustaf the V-th 80-year Foundation (MW and LR),
Knut and Alice Wallenberg Foundation (LR), and
The Swedish Rheumatism Association (MW, GN,
LR, and PE). The funders had no role in study
design, data collection and analysis, decision to
publish, or preparation of the manuscript.
Competing interests: The authors have declared
that no competing interests exist.
patients also manifest debilitating fatigue as well as other diseases in liver, lung, kidney,
and skin. The cause of this complex disease is still not fully understood; however, an envi-
ronmental trigger, such as viral infections, in individuals with genetic risk factor(s) is
thought to contribute to the development of SS. Type 1 interferons (IFNs) are one of the
first defenders after viral infection and induce the expression of various virus-responding
genes. Perpetual elevation of type 1 IFN signaling has been observed in SS patients. Here,
we first replicated previously identified RNA transcripts contributing to the abnormal
type 1 IFN signaling in SS patients. We then identified a disease-associated genetic variant
in an IFN-inducible gene, OAS1. This variant governs splicing of OAS1, altering the tran-
script into multiple isoforms that lack protein expression and responsiveness to IFNs. The
results of this study may provide insight into the genetic basis of SS, as well as other auto-
immune disease with similar dysregulation in the type 1 IFN system.
Introduction
Sjogren’s syndrome (SS) is a common systemic autoimmune disease with a prevalence rate
(~0.7% of European Americans) second only to rheumatoid arthritis (RA) [1]. SS is distin-
guished by immune cell infiltration, functional destruction, and irreversible dysfunction of
exocrine glands, most notably salivary and lacrimal glands [2]. Secondary manifestations of
exocrine gland dysfunction may include severe dental decay and corneal scarring. Approxi-
mately one-third of patients experience extra-glandular manifestations of disease, such as
debilitating fatigue, a 16-fold increased risk of developing lymphoma, neuropathies, Raynaud’s
phenomenon, arthralgia, and dermatologic symptoms [2–6].
Both glandular dysfunction and extra-glandular manifestations are associated with autoan-
tibodies, a hallmark of autoimmunity [7–9]. Approximately 70% and 40% of SS patients
exhibit autoantibodies targeting ribonucleoproteins, Ro/SSA (Ro52 and Ro60) and La/SSB,
respectively [10]. These autoantibodies have the capacity to bind necrotic and apoptotic mate-
rial, thus creating RNA-immune complexes that can activate cells of the immune system and
aggravate autoinflammation [11]. Such RNA-containing immune complexes are taken up by
the Fc gamma receptor IIa on plasmacytoid dendritic cells (pDCs) [12], which activates intra-
cellular Toll-like receptors 7 and 9 and stimulates type I interferon (IFN) responsive loci [13].
The etiology of SS is still largely unknown, though it involves a complex interplay between
both genetic and environmental factors [14–16]. Viral infections, such as Epstein-Barr virus
(EBV) and cytomegalovirus [17–19], may initiate prolonged inflammation in glandular lesions
and formation of germinal center-like structures commonly linked to autoantibody produc-
tion in SS [14, 19]. Autoantibodies can be detected up to 18–20 years prior to diagnosis in 81%
of SS patients [20]. Indeed, cross-reactivity between antibodies against EBV and the Ro60 anti-
gen has previously been reported [21], and possible subclinical reactivation of the virus has
been associated with active joint involvement in SS [22]. Recently, the virus-like genomic
repeat element L1 was identified as an endogenous trigger of the IFN pathway, and its expres-
sion correlates with type I IFN expression and L1 DNA demethylation [23].
Type I IFNs are key antiviral immune mediators of innate immune responses in infected
cells, while at the same time enhancing antigen presentation and inducing production of pro-
inflammatory cytokines and chemokines [24], thus initiating adaptive immunity [25]. Overex-
pression of type I IFN-inducible genes, known as “the IFN signature”, is a common feature of
many autoimmune diseases [26, 27], including RA patients with poor clinical outcome [28–
30] and systemic lupus erythematosus [31, 32], where the predominant IFN producing cells,
Variant that affects OAS1 splicing associates with Sjogren’s syndrome
PLOS Genetics | https://doi.org/10.1371/journal.pgen.1006820 June 22, 2017 3 / 29
pDCs, are reduced in number in the blood but are abundant in skin and lymph nodes [33]. In
SS, the IFN signature is observed in both peripheral blood and salivary glands [12, 34–37], and
associates with systemic manifestations, greater disease severity, and autoantibody titers [8, 9].
It has been proposed that viral infections contribute to perpetual activation of type I IFN sig-
naling and the resulting dysregulation of innate immunity, ultimately resulting in activation of
the adaptive immune response and autoantibody production in SS and other autoimmune dis-
eases [34, 38].
Genome-wide association [GWA] studies in autoimmune diseases have identified multiple
genetic risk variants involved in type I IFN signaling pathways [39–41], including associations
of IRF5 and STAT4 with SS susceptibility [15, 42, 43]. Suggestive associations of FCGR2A,
PRDM1 (PR domain containing 1, regulated by IRF5) [44], and IRF8 with SS have also been
reported [15], along with two genes within the NF-κB pathway (TNIP1 and TNFAIP3), which
regulates early phase type I IFN production during viral infection [45]. Despite the evidence
indicating an important role of the type I IFN pathway in SS, no direct functional mechanisms
for SS-associated variants contributing to the substantial upregulation of IFN signature tran-
scripts have been described.
The vast majority of disease associated single-nucleotide polymorphisms (SNPs) identified
in GWA studies are non-coding [46] and are not likely to impact protein function directly,
thus requiring a combination of genetic studies and gene expression analyses to point towards
mechanisms that link genetics with functional effects [47]. Specifically, the extensive linkage
disequilibrium (LD) observed between associated polymorphisms renders it hard to identify
causal variant(s) of disease. Systemic evaluation of genome-wide functional elements by the
Encyclopedia of DNA Elements (ENCODE) project reveals that 80% of the human genome
has at least one biochemical function, and many of the genetic variants are within cis- or trans-regulatory sites that impact gene expression [48]. Furthermore, genome-wide cis-expression
quantitative trait locus (eQTL) mapping studies in different tissues have identified more than
3,000 genes associated with nearby genetic variants [49, 50].
Through combining GWA and gene expression data from SS patients, we sought to identify
and characterize SS-associated variants that influence the expression of genes within the IFN
signature by utilizing a genomic convergence approach (Fig 1). Through cis-eQTL analyses we
identified an association of a SNP rs10774671, located within the OAS1 gene locus, with SS.
Functional studies were performed to assess biological consequence of the OAS1 variants.
Results
IFN signature genes identified by transcriptome profiling analysis
To select candidate genes in the IFN signature, we first evaluated dysregulated transcripts in
SS through a microarray-based gene expression profiling study. Whole blood transcriptome
profiles from 115 anti-Ro/SSA positive SS cases and 56 healthy controls of European ancestry
were compared, as the IFN signature is enriched in SS patients seropositive for anti-Ro/SSA
[34]. After quality control (QC) and normalization, 13,893 probes (in 10,966 genes) remained,
for which Welch’s t-tests, false discovery rate (FDR)-adjusted P values (q values), and fold
changes (FC; the difference of the mean between log2-transformed values from cases and con-
trols) were calculated (see Methods for details). Differentially expressed genes were selected by
q< 0.05 and FC > 2 or < -2. We found 73 differentially expressed genes in our dataset,
among which 57 genes are regulated by type I IFNs (S1 Table). The majority of dysregulated
genes (66 out of 73) were overexpressed in SS patients and formed the IFN signature in cases
after unsupervised hierarchical clustering (Fig 2A). Of note, the IFN signature was observed in
most but not all anti-Ro/SSA positive SS cases, in accordance with our previous work [34], and
Variant that affects OAS1 splicing associates with Sjogren’s syndrome
PLOS Genetics | https://doi.org/10.1371/journal.pgen.1006820 June 22, 2017 4 / 29
the intensity of this feature was heterogeneous among patients (Fig 2B). These results suggest
that the expression of IFN signature genes might be influenced by genetic variants, which
could be identified through cis-eQTL analysis.
Identification of SNP-SS association with rs10774671 in the locus OAS1
We hypothesized that variants near the differentially expressed IFN signature genes may
potentially influence disease susceptibility through cis-regulatory mechanisms. We would,
however, expect to identify many cis-eQTLs in these regions regardless of whether they associ-
ate with disease susceptibility or not. Therefore, instead of performing cis-eQTL analyses for
all of the 73 dysregulated IFN signature genes, we first sought to identify variants that showed
a disease association of Passoc<0.05 for subsequent evaluation of their role in altering gene
expression. Genetic associations with SS susceptibility for 2,163 SNPs in regions of the 73 dif-
ferentially expressed genes were tested using a combined dataset (Dataset 1; Table 1) from
genome-wide genotyping arrays consisting of 765 SS cases and 3,825 population controls of
European ancestry. We identified suggestive associations (Passoc<1×10⁻⁴; this threshold was
determined by Bonferroni correction for independent variants with r2<0.2) of genetic variants
within the OAS1 region (top association at rs10774671, Passoc = 8.47×10⁻⁵), which is regulated
by type I IFNs (S1 Table). Furthermore, we identified suggestive associations in ARGN
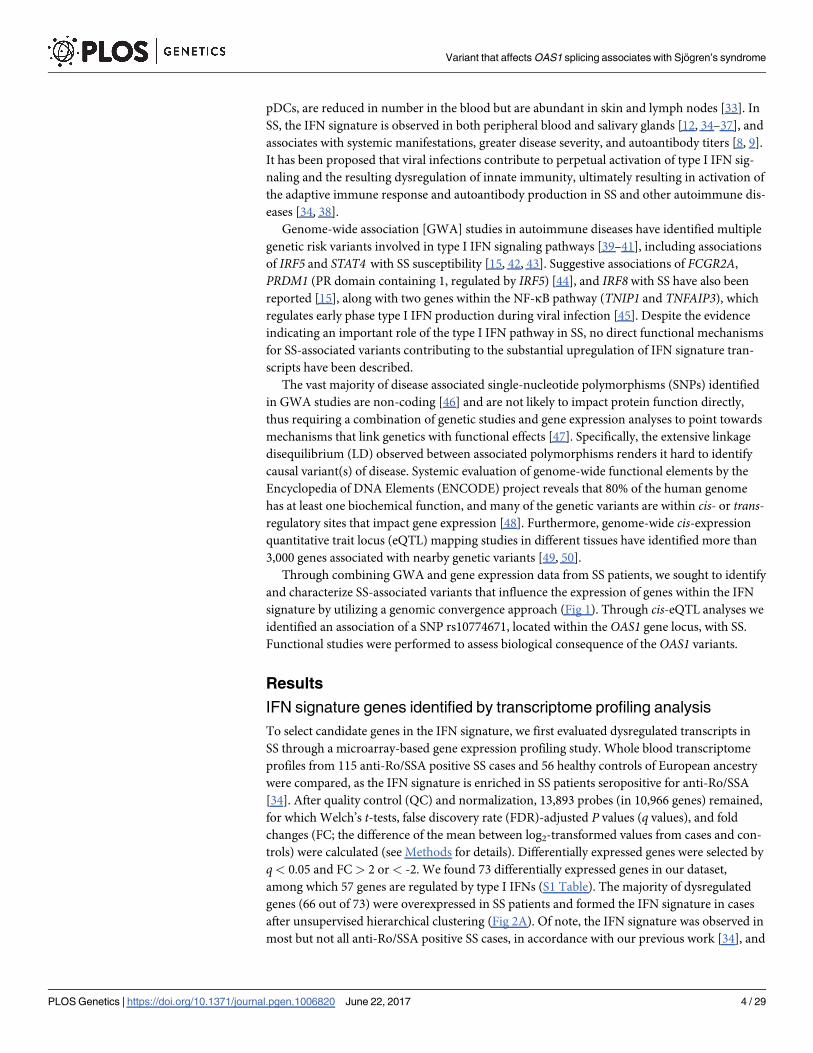
Fig 1. Study design. To evaluate genetic factors involved in the dysregulation of type I IFN signaling in SS, we first compared
transcriptional profiles between anti-Ro/SSA positive SS cases and controls to identify genes that make up the IFN signature in SS.
We then performed genetic association analysis for variants in the regions of the differentially expressed genes. By integrating
transcriptome data with genotype data, cis-eQTL analysis was performed for SS-associated SNPs to evaluate their role in gene
dysregulation. This genomic convergence approach resulted in increased power to identify and prioritize disease susceptibility genes
for further genetic replication and functional studies.
https://doi.org/10.1371/journal.pgen.1006820.g001
Variant that affects OAS1 splicing associates with Sjogren’s syndrome
PLOS Genetics | https://doi.org/10.1371/journal.pgen.1006820 June 22, 2017 5 / 29

(S1 Table) and observed nominal associations (1×10⁻⁴�Passoc<0.05) with SS susceptibility in
42 additional regions (S1 Table).
To determine whether these disease-associated genetic variants (Passoc<0.05) were related
to the altered expression levels of their nearby differentially expressed IFN signature genes, we
performed cis- and trans-eQTL analyses for all SNPs with Passoc<0.05 (173 SNPs in 44 regions;
S1 Table) using a linear model by integrating the transcriptome and genotype datasets in 178
European individuals (108 anti-Ro/SSA positive SS cases, 55 anti-Ro/SSA negative SS cases,
Fig 2. Differentially expressed transcripts between 115 anti-Ro/SSA positive SS cases and 56
controls identified through transcriptome profiling. (A) We identified 73 genes (represented by 83 probes
on the heatmap) differentially expressed between anti-Ro/SSA positive SS cases and healthy controls
(absolute FC >2 and q<0.05). Among the differentially expressed genes, 57 were type I IFN-regulated genes
(black bar on right) and formed an IFN signature where most genes were overexpressed in SS patients
(yellow indicates overexpressed genes compared to controls). (B) The 57 differentially expressed type I IFN-
regulated genes were re-clustered in anti-Ro/SSA positive SS cases using k-means (k = 3) algorithm and
heterogeneity of the IFN signature levels in anti-Ro/SSA positive SS cases was observed.
https://doi.org/10.1371/journal.pgen.1006820.g002
Variant that affects OAS1 splicing associates with Sjogren’s syndrome
PLOS Genetics | https://doi.org/10.1371/journal.pgen.1006820 June 22, 2017 6 / 29
and 15 healthy controls). Variants within and near OAS1 showed significant association with
OAS1 transcript expression (Fig 3A; S1 Table). In particular, three microarray probes targeting
OAS1 passed QC and were evaluated for cis-eQTLs (Fig 3B). The OAS1 transcript levels mea-
sured by all of the three probes were found to be associated with nearby genetic variants (Fig
3C). The most significant cis-eQTL for all the three probes targeting OAS1 was rs10774671
(PeQTL-Probe1 = 5.14×10⁻⁴, PeQTL-Probe2 = 2.86×10⁻⁶, and PeQTL-Probe3 = 6.05×10⁻¹⁴; Fig 3C). No
eQTL was detected in any other differentially expressed genes (S1 Table). We also determined
that none of these eQTL variants were associated with the two nearby genes, OAS2 and OAS3.
Additionally, no significant trans-eQTL was detected for OAS1. Therefore, we identified a vari-
ant associated with both SS susceptibility and gene expression in the IFN signature gene OAS1.
To fine map this disease-associated region, imputation was then performed for the SS-asso-
ciated OAS1 region to increase the informativeness of the genetic association and eQTL analy-
ses results. After imputation, the most significant association with SS in the OAS1 region
was at rs4767023 (Passoc = 3.82×10⁻⁵; r2 = 0.98 with the most significant genotyped SNP
rs10774671; Fig 4A), whereas the top eQTL remains at rs10774671 (Fig 3A). All the variants
with Passoc<1×10⁻⁴ in the OAS1 region were strongly correlated to each other (r2>0.9; Fig 4B)
and could explain the association of the whole region through conditional analyses (Fig 4C
and 4D). The top SS-associated variants and cis-eQTLs in the OAS1 region, including
rs10774671, were in strong LD (r2>0.9; Fig 4B), thus challenging the selection of potentially
functional variant(s) based on results from the association analyses. However, the top eQTL
variant, rs10774671, is an A/G substitution within the consensus sequence of a splice acceptor
site at the junction of the 5th intron and the 6th exon of OAS1 (Fig 3B), and is known to alter
normal splicing and induce isoform switching of OAS1 [51]. In addition, all other SS-associ-
ated variants (Passoc<1×10⁻⁴) in the OAS1 locus were either intronic or outside of coding
regions, lacking functional genomic elements mapped to the SNP as determined by the
ENCODE project [48, 52]. Also, we performed a co-localization analysis using eCAVIAR [53]
to identify the potential causal variant in the OAS1 region. We estimated colocalization poste-
rior probability (CLPP) scores for all the tested 453 variants, and rs10774671 has the highest
CLPP score among all the variants (S2 Table). Therefore, we prioritized this SS-associated cis-eQTL variant, rs10774671, for further replication and functional studies.
We replicated the genetic association of rs10774671 with SS susceptibility in an indepen-
dent dataset (Dataset 2; Table 1) consisting of 514 European SS cases and 3,466 European pop-
ulation controls (genotyped using TaqMan assays, Prep = 5.16×10⁻⁶; odds ratio = 0.71; 95%
confidence interval = 0.63–0.83). Meta-analysis was performed to combine the results between
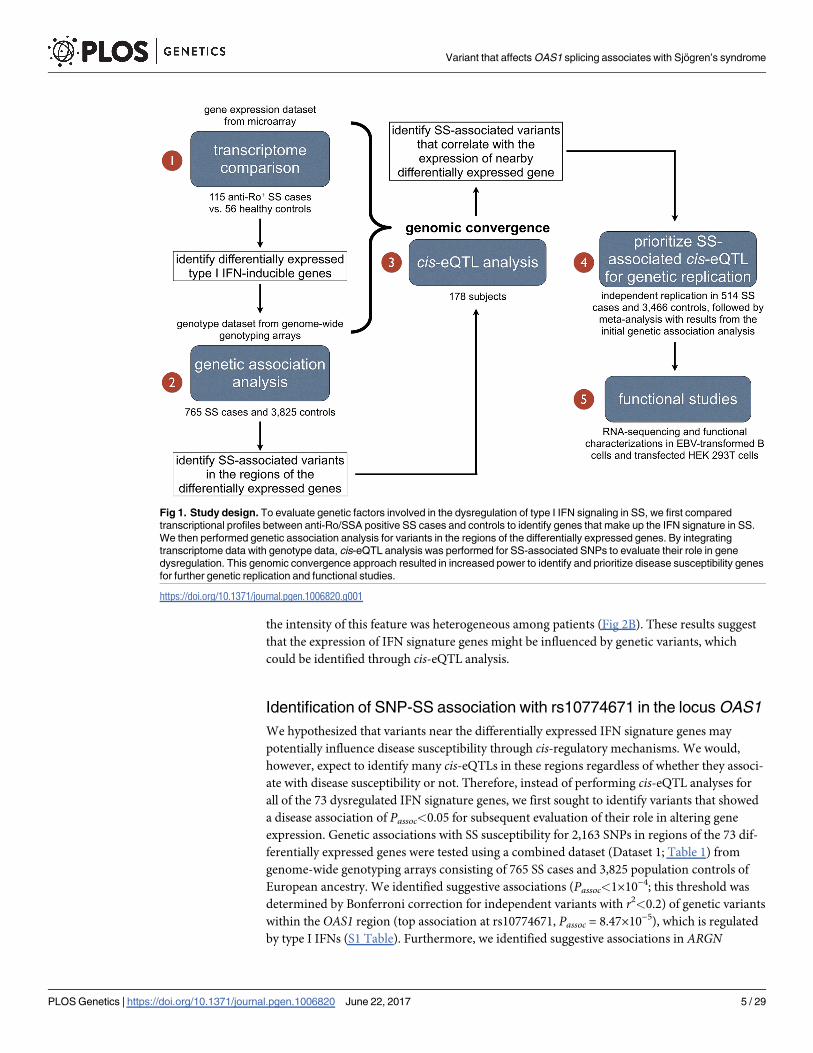
Table 1. Composition of independent cohorts used in the genetic association analyses.
Genotyping array Initial genetic association analysis
(Dataset 1)
Replication Dataset (Dataset 2)
Dataset 1A Dataset 1B
Illumina OMNI1-Quad
arrays (>1M SNPs)
Illumina
OmniExpress arrays
(>700K SNPs)
Taqman assay OMNI1-Quad arrays OmniExpress arrays
Sample size Case Control Case Control Case Control
Before QC 438 3,917 384 3,315 622 3,502
After QC 395 1,975a 370 1,850a 514 3,466
Anti-Ro/SSA in cases after QC Positive: 429, Negative: 154, No info: 182 Positive: 352, Negative: 126, No info: 36
a. Each SS case in the initial genetic association study was genetically matched to 5 controls prior to analysis. Dataset 1A and 1B were merged into Dataset
1 in the initial genetic association analysis
https://doi.org/10.1371/journal.pgen.1006820.t001
Variant that affects OAS1 splicing associates with Sjogren’s syndrome
PLOS Genetics | https://doi.org/10.1371/journal.pgen.1006820 June 22, 2017 7 / 29
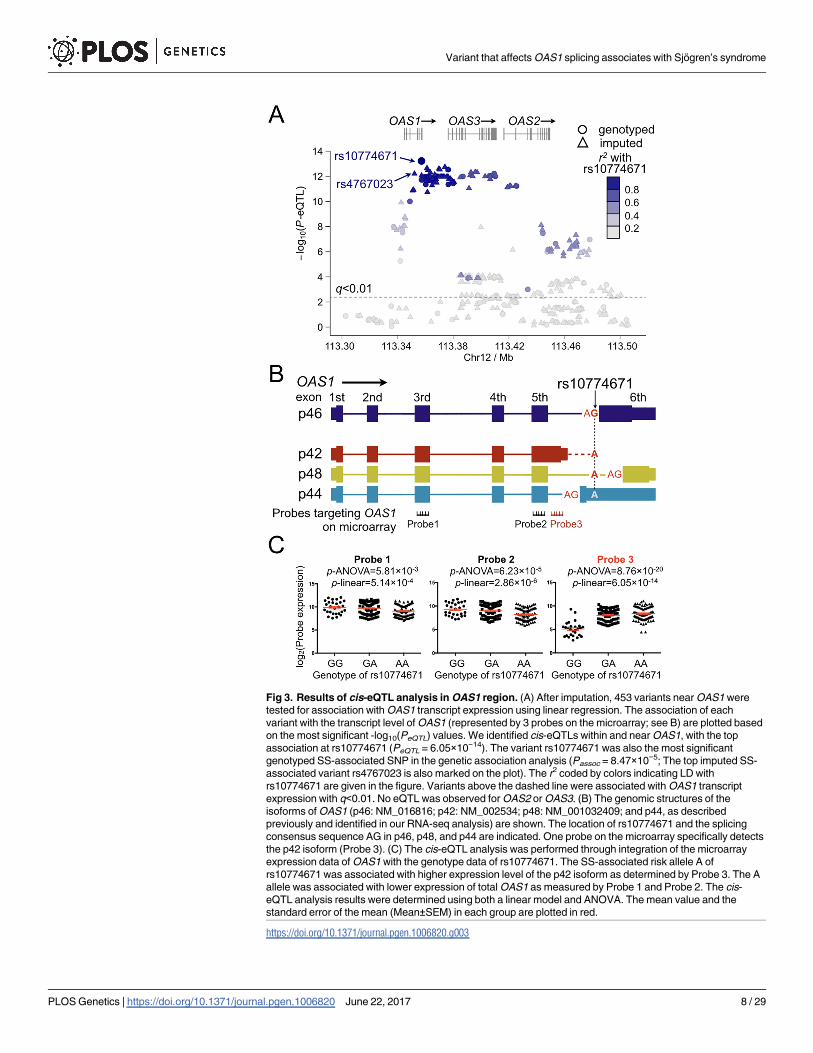
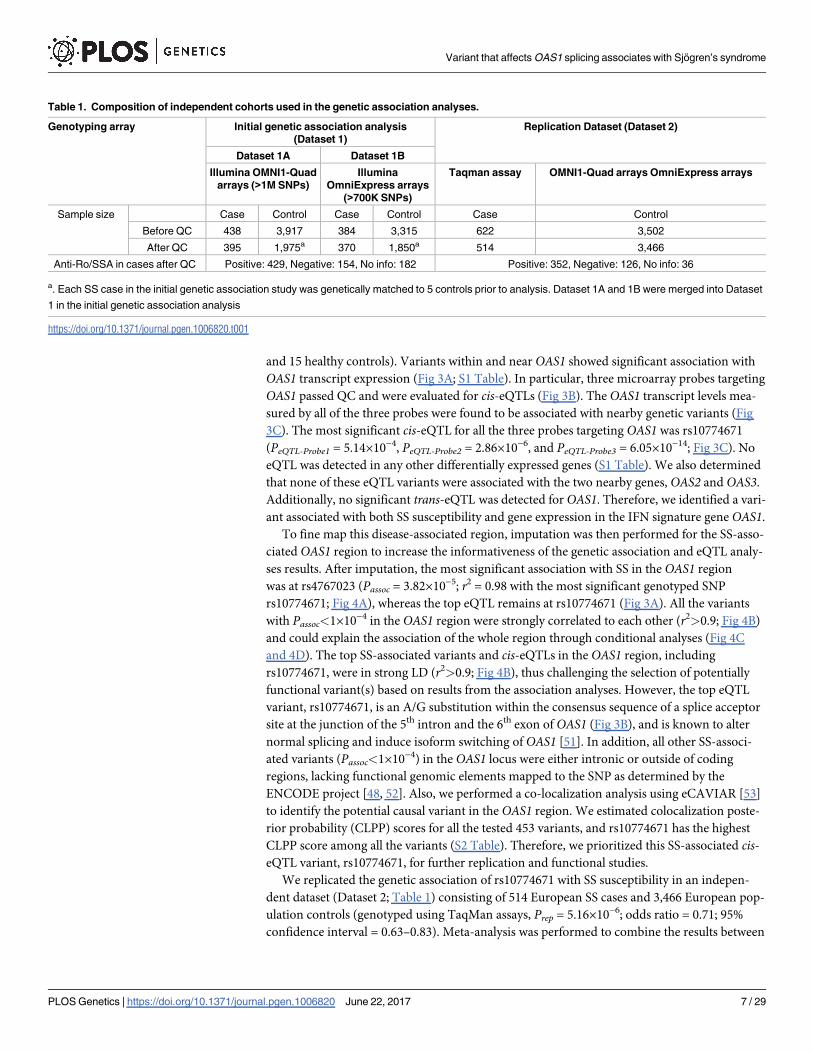
Fig 3. Results of cis-eQTL analysis in OAS1 region. (A) After imputation, 453 variants near OAS1 were
tested for association with OAS1 transcript expression using linear regression. The association of each
variant with the transcript level of OAS1 (represented by 3 probes on the microarray; see B) are plotted based
on the most significant -log10(PeQTL) values. We identified cis-eQTLs within and near OAS1, with the top
association at rs10774671 (PeQTL = 6.05×10⁻¹⁴). The variant rs10774671 was also the most significant
genotyped SS-associated SNP in the genetic association analysis (Passoc = 8.47×10⁻⁵; The top imputed SS-
associated variant rs4767023 is also marked on the plot). The r2 coded by colors indicating LD with
rs10774671 are given in the figure. Variants above the dashed line were associated with OAS1 transcript
expression with q<0.01. No eQTL was observed for OAS2 or OAS3. (B) The genomic structures of the
isoforms of OAS1 (p46: NM_016816; p42: NM_002534; p48: NM_001032409; and p44, as described
previously and identified in our RNA-seq analysis) are shown. The location of rs10774671 and the splicing
consensus sequence AG in p46, p48, and p44 are indicated. One probe on the microarray specifically detects
the p42 isoform (Probe 3). (C) The cis-eQTL analysis was performed through integration of the microarray
expression data of OAS1 with the genotype data of rs10774671. The SS-associated risk allele A of
rs10774671 was associated with higher expression level of the p42 isoform as determined by Probe 3. The A
allele was associated with lower expression of total OAS1 as measured by Probe 1 and Probe 2. The cis-
eQTL analysis results were determined using both a linear model and ANOVA. The mean value and the
standard error of the mean (Mean±SEM) in each group are plotted in red.
https://doi.org/10.1371/journal.pgen.1006820.g003
Variant that affects OAS1 splicing associates with Sjogren’s syndrome
PLOS Genetics | https://doi.org/10.1371/journal.pgen.1006820 June 22, 2017 8 / 29
the initial genetic association study (Dataset 1) and the replication cohorts (Dataset 2) and
established the association of rs10774671 with SS risk (Pmeta = 2.59×10⁻⁹; odds ratio = 0.75;
95% confidence interval = 0.66–0.86; risk allele [the A allele] frequency: case = 0.70, con-
trol = 0.64; with no heterogeneity between the two datasets as determined by I2 = 0). We also
performed a stratified analysis and a permutation analysis using merged samples from Dataset
1 and Dataset 2 to determine whether the observed genetic association was restricted to anti-
Ro/SSA positive or negative patients. We did not find any evidence to support the genetic
effect to be specific to any sub-group of the patients (S1 Fig). In summary, we identified a
potential causal variant, rs10774671, that was associated with SS susceptilibty, likely through
its impact on the expression of a key IFN signature gene, OAS1.
Impact of rs10774671 on OAS1 splicing
Following establishment of the association between rs10774671 and SS susceptibility, we fur-
ther determined the influence of different genotypes on the alternative splicing of OAS1. Four
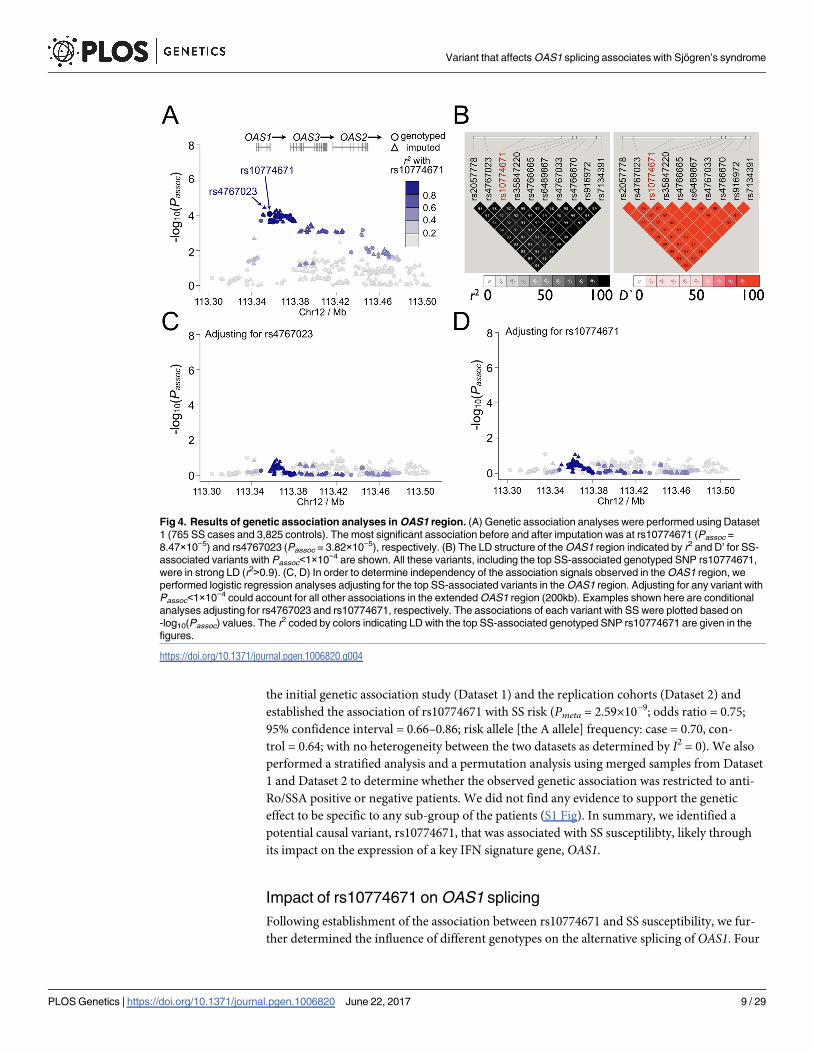
Fig 4. Results of genetic association analyses in OAS1 region. (A) Genetic association analyses were performed using Dataset
1 (765 SS cases and 3,825 controls). The most significant association before and after imputation was at rs10774671 (Passoc =
8.47×10⁻⁵) and rs4767023 (Passoc = 3.82×10⁻⁵), respectively. (B) The LD structure of the OAS1 region indicated by r2 and D’ for SS-
associated variants with Passoc<1×10⁻⁴ are shown. All these variants, including the top SS-associated genotyped SNP rs10774671,
were in strong LD (r2>0.9). (C, D) In order to determine independency of the association signals observed in the OAS1 region, we
performed logistic regression analyses adjusting for the top SS-associated variants in the OAS1 region. Adjusting for any variant with
Passoc<1×10⁻⁴ could account for all other associations in the extended OAS1 region (200kb). Examples shown here are conditional
analyses adjusting for rs4767023 and rs10774671, respectively. The associations of each variant with SS were plotted based on
-log10(Passoc) values. The r2 coded by colors indicating LD with the top SS-associated genotyped SNP rs10774671 are given in the
figures.
https://doi.org/10.1371/journal.pgen.1006820.g004
Variant that affects OAS1 splicing associates with Sjogren’s syndrome
PLOS Genetics | https://doi.org/10.1371/journal.pgen.1006820 June 22, 2017 9 / 29

isoforms of OAS1 are annotated in the NCBI Reference Sequence (RefSeq; http://www.ncbi.
nlm.nih.gov/refseq) database, of which we analyzed p46, p42, and p48, and p44, an un-anno-
tated isoform previously reported in RNA-sequencing (RNA-seq) studies [54–56] (Fig 3B).
The difference between these isoforms is confined to their 3’ end where rs10774671 influences
alternative splicing, yielding amino acid sequences of different lengths and composition. In the
microarray experiments, one probe targeting OAS1 specifically recognized the 3’ end of the
p42 isoform (Fig 3B). The risk allele A of rs10774671 was correlated with higher expression
levels of p42 (Fig 3C, right panel). However, we were not able to determine the influence of
rs10774671 on the expression of other isoforms due to lack of isoform-specific probes on the
microarray.
In order to determine the influence of rs10774671 on the expression of each alternatively
spliced isoform of OAS1 and compare OAS1 isoform composition, we performed RNA-seq on
whole blood from 57 SS cases and 27 healthy controls. After QC, the reads were aligned to
the human genome using TopHat [57] without gene annotation to facilitate the detection of
potentially novel isoforms of OAS1. The transcript level of each isoform was compared across
samples with different genotypes of rs10774671 based on the measurement of fragments per
kilobase of transcript per million mapped reads (FPKM) using Cufflinks [58]. Consistent with
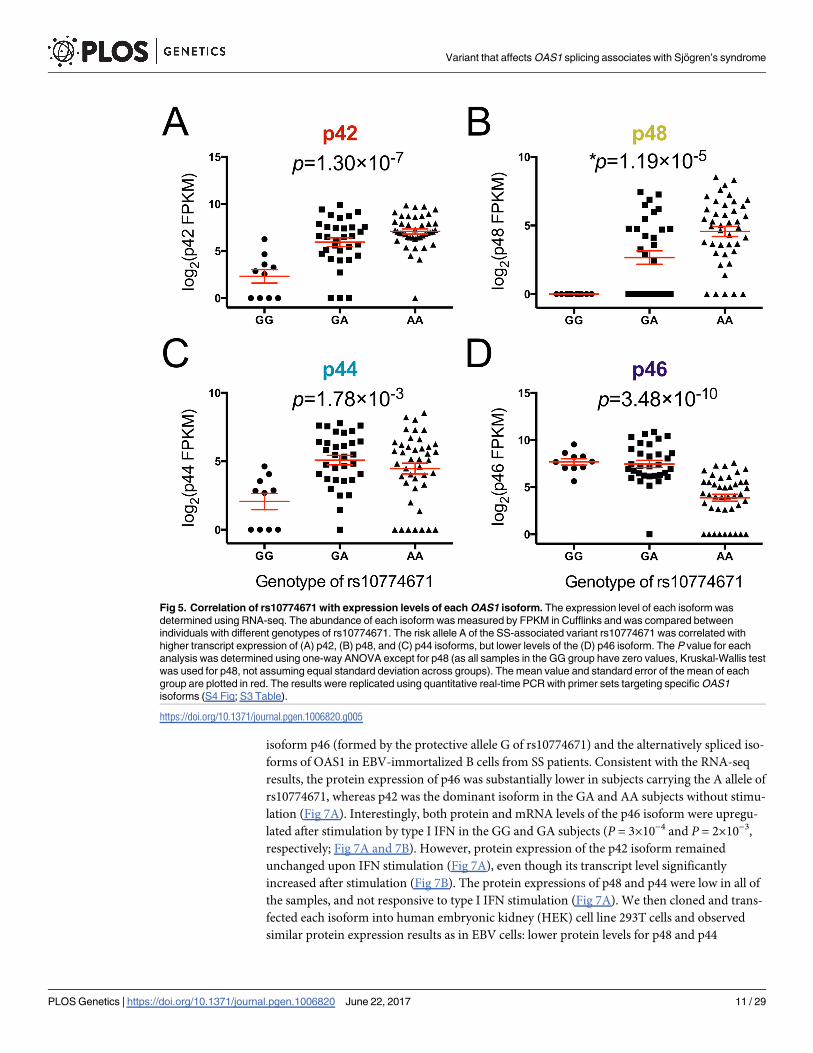
our microarray results, the SS risk allele A of rs10774671 was correlated with higher expression
levels of p42 (P = 1.30×10⁻⁷; Fig 5A). Increased production of other alternatively spliced iso-
forms of OAS1, including p48 and p44, was also observed in subjects with the SS risk geno-
types (GA and AA) of rs10774671 (Fig 5B and 5C). In contrast, transcript levels of the p46
isoform, was decreased in samples with the A allele (P = 3.48×10⁻¹⁰; Fig 5D), consistent with
previous reports that interruption of the splicing consensus sequence inhibit formation of the
p46 isoform [56]. These results were further confirmed by quantitative real-time PCR using
primer sets targeting the specific OAS1 isoforms (S2 Fig; S3 Table). Therefore, we found that
the SS-associated variant rs10774671 is a functional variant that influences alternative splicing
of OAS1.
Since OAS1 is part of the IFN signature and its expression levels are correlated with the
autoantibody status, we also performed a stratified eQTL analysis to investigate whether the
eQTL effects are specific to any sub-group of the SS patients based on their anti-Ro/SSA posi-
tivity. We stratified the SS case samples into anti-Ro/SSA positive patients (n = 27) and anti-
Ro/SSA negative patients (n = 30), and performed eQTL analyses on each of the OAS1 iso-
forms using linear regression while adjusting for sex. Despite reduced statistical power, we
identified significant eQTL results for the p46, p42, and p48 isoforms in both subsets of sam-
ples. By using the Z-test as described in S1 Fig, we did not find any significant difference of the
eQTL effects between the two sub-groups (S3 Fig).
Comparing the total OAS1 transcript level from the microarray study within each genotype
revealed significantly higher gene expression in SS patients as compared to control in the GA
group (Fig 6A). There is a trend towards higher total OAS1 transcripts in the AA and GG
groups of SS patients as well, though it is not statistically significant. Interestingly, the highest
transcript levels are seen in the anti-Ro/SSA positive cases (Fig 6B), significantly higher than
both anti-Ro/SSA negative cases and healthy controls. The same results were observed in the
RNA-seq data (S4 Fig), indicating that the total OAS1 transcript levels regardless of isoform
are also influenced by disease status or the presence of autoantibodies.
Functional characterizations of OAS1 isoforms
To further dissect the functional mechanism of rs10774671 in predisposing disease risk, we
utilized Western blots to evaluate the difference in protein levels of the normally spliced
Variant that affects OAS1 splicing associates with Sjogren’s syndrome
PLOS Genetics | https://doi.org/10.1371/journal.pgen.1006820 June 22, 2017 10 / 29
isoform p46 (formed by the protective allele G of rs10774671) and the alternatively spliced iso-
forms of OAS1 in EBV-immortalized B cells from SS patients. Consistent with the RNA-seq
results, the protein expression of p46 was substantially lower in subjects carrying the A allele of
rs10774671, whereas p42 was the dominant isoform in the GA and AA subjects without stimu-
lation (Fig 7A). Interestingly, both protein and mRNA levels of the p46 isoform were upregu-
lated after stimulation by type I IFN in the GG and GA subjects (P = 3×10⁻⁴ and P = 2×10⁻³,
respectively; Fig 7A and 7B). However, protein expression of the p42 isoform remained
unchanged upon IFN stimulation (Fig 7A), even though its transcript level significantly
increased after stimulation (Fig 7B). The protein expressions of p48 and p44 were low in all of
the samples, and not responsive to type I IFN stimulation (Fig 7A). We then cloned and trans-
fected each isoform into human embryonic kidney (HEK) cell line 293T cells and observed
similar protein expression results as in EBV cells: lower protein levels for p48 and p44
Fig 5. Correlation of rs10774671 with expression levels of each OAS1 isoform. The expression level of each isoform was
determined using RNA-seq. The abundance of each isoform was measured by FPKM in Cufflinks and was compared between
individuals with different genotypes of rs10774671. The risk allele A of the SS-associated variant rs10774671 was correlated with
higher transcript expression of (A) p42, (B) p48, and (C) p44 isoforms, but lower levels of the (D) p46 isoform. The P value for each
analysis was determined using one-way ANOVA except for p48 (as all samples in the GG group have zero values, Kruskal-Wallis test
was used for p48, not assuming equal standard deviation across groups). The mean value and standard error of the mean of each
group are plotted in red. The results were replicated using quantitative real-time PCR with primer sets targeting specific OAS1
isoforms (S4 Fig; S3 Table).
https://doi.org/10.1371/journal.pgen.1006820.g005
Variant that affects OAS1 splicing associates with Sjogren’s syndrome
PLOS Genetics | https://doi.org/10.1371/journal.pgen.1006820 June 22, 2017 11 / 29
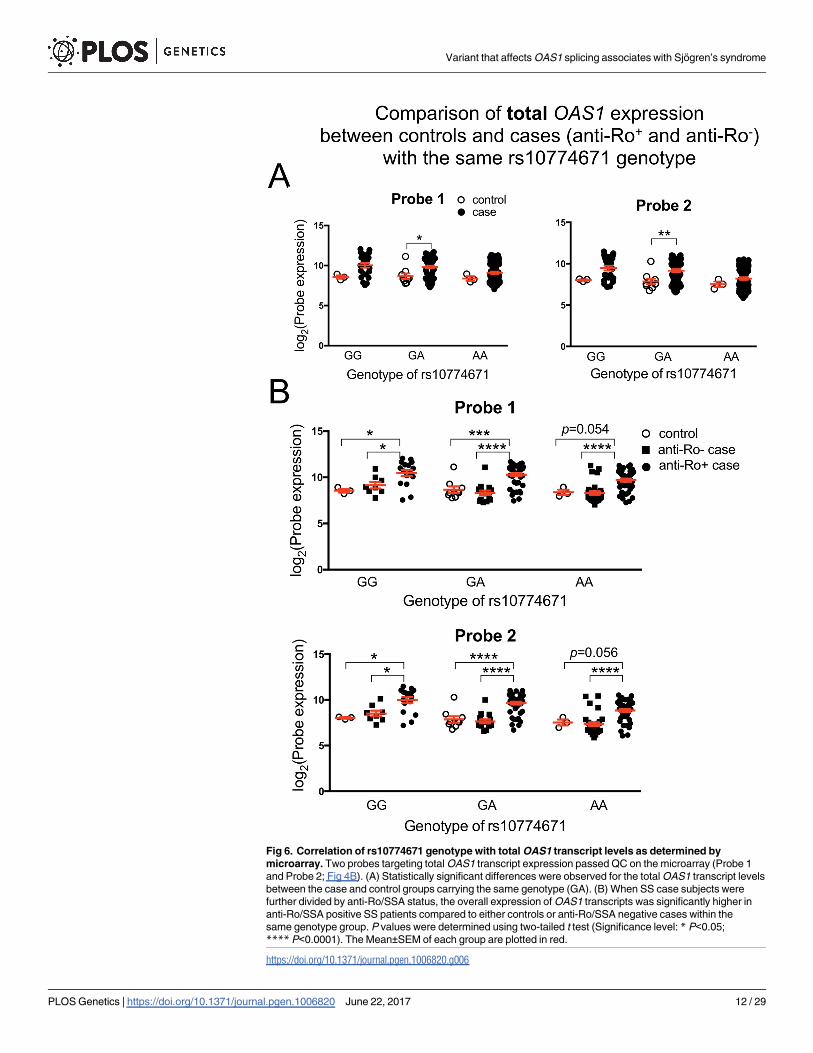
Fig 6. Correlation of rs10774671 genotype with total OAS1 transcript levels as determined by
microarray. Two probes targeting total OAS1 transcript expression passed QC on the microarray (Probe 1
and Probe 2; Fig 4B). (A) Statistically significant differences were observed for the total OAS1 transcript levels
between the case and control groups carrying the same genotype (GA). (B) When SS case subjects were
further divided by anti-Ro/SSA status, the overall expression of OAS1 transcripts was significantly higher in
anti-Ro/SSA positive SS patients compared to either controls or anti-Ro/SSA negative cases within the
same genotype group. P values were determined using two-tailed t test (Significance level: * P<0.05;
**** P<0.0001). The Mean±SEM of each group are plotted in red.
https://doi.org/10.1371/journal.pgen.1006820.g006
Variant that affects OAS1 splicing associates with Sjogren’s syndrome
PLOS Genetics | https://doi.org/10.1371/journal.pgen.1006820 June 22, 2017 12 / 29

compared to p46, even though their transcript levels were equivalent (Fig 7C). These results
suggest that the alternative isoforms of OAS1 that are associated with the disease risk variant of
rs10774671 fail to generate proteins after transcription.
The catalytic OAS1 domain is located at the N terminus, though the isoforms differ in their
C terminus. It has been suggested that these differences affect affinity of OAS1 protein for dif-
ferent viruses [59]. However, our data suggested that the alternatively spliced 3’-terminus
Fig 7. Functional characterizations of OAS1 isoforms. (A) Protein expression of OAS1 isoforms was evaluated in EBV-
transformed B cells from SS patients (four independent samples from each genotype group) using anti-OAS1 antibody targeting the
shared epitope of all the isoforms. The stimulated cells were treated with universal type I IFN (1500U/ml) for 24hrs. The p44 isoform
was not detectable using western-blot due to its low expression. The right panel shows quantified band intensity normalized to the
GAPDH in each sample. (B) The transcript levels of each OAS1 isoform from the same sets of cells described above were
determined using real-time PCR. Consistent with the RNA-seq results, the SS-associated risk allele A of rs10774671 was correlated
with decreased levels of p46 and increased expression of the p42, p48, and p44 isoforms (significance levels are shown at the
bottom). The transcript levels of all the isoforms significantly increased after IFN stimulation (two-tailed t test); however, only p46 had
increased protein production after IFN stimulation. (Significance level: ** P<0.01; *** P<0.001) (C) Individual isoforms of OAS1
tagged with Xpress epitope were cloned and transfected into HEK 293T cells for 48hrs. The p48 and p44 isoforms had impaired
protein expression compared to p46 and p42, although their transcript levels were equivalent as determined by real-time PCR (n = 4;
normalized to HMBS). (D) The full-length and truncated OAS1 p48 and p44 isoforms were cloned into HEK 293T cells. Western-blot
indicated the lack of expression of the full-length p48 and p44 isoforms, whereas the truncation of both isoform transcripts (T2 and
T4) was able to restore protein expression. (E) The 3’ alternatively spliced terminus of different OAS1 isoforms were linked to the 3’-
end of GFP to observe their influence on GFP protein expression in HEK 293T cells. The 3’-terminus from the p48 and p44 isoforms
resulted in decreased expression of GFP.
https://doi.org/10.1371/journal.pgen.1006820.g007
Variant that affects OAS1 splicing associates with Sjogren’s syndrome
PLOS Genetics | https://doi.org/10.1371/journal.pgen.1006820 June 22, 2017 13 / 29

influenced the lack of post-transcriptional expression of the p48 and p44 isoforms. To test this
hypothesis, we generated several truncated forms of p48 and p44 at the 3’-terminus and trans-
fected them into HEK 293T cells. The truncation of both p48 and p44 transcripts at the 3’-end
resulted in restoration of protein expression (Fig 7D). Our results demonstrated that the alter-
natively spliced 3’-end between 1,047 and 1,155 bp of the p48 isoform and the 3’-end between
1,083 and 1,137 bp of the p44 isoform were responsible for the impaired protein expression
(Fig 7D). In addition, we recombined the green fluorescent protein (GFP) transcript with the
3’-end from different OAS1 isoforms and expressed them in HEK 293T cells. The alternatively
spliced 3’-terminus of p48 and p44 resulted in reduced expression of GFP when linked to the
3’ end of GFP transcript (Fig 7E; S5 Fig). These results further confirmed the impact of the
alternatively spliced 3’-end of OAS1 on protein expression. Determining mechanisms for how
the 3’-terminus from the alternatively spliced OAS1 isoforms influences protein expression
and type I IFN responsiveness needs further study.
Discussion
Overexpression of genes in the IFN pathway is a distinctive feature of multiple autoimmune dis-
eases, though no evident mechanism has thus far been revealed. We identified and established
rs10774671 as a risk locus for SS. The A allele of rs10774671 is correlated with reduced OAS1
enzymatic activity in human peripheral blood mononuclear cells [51], and is associated with
increased susceptibility to West Nile virus [60] and chronic hepatitis C virus infections [61].
OAS1 is a member of the 2’-5’-oligoadenylate synthetase family, which is upregulated by type I
IFNs during innate immune responses to viral infection and activates latent RNase L, leading to
viral RNA degradation and clearance [62, 63]. The SS risk allele A of rs10774671 causes alterna-
tive transcript splicing and consequently less functional isoforms are activated by type I IFNs.
Failure to clear virus might lead to subclinical, chronic infection that drives the sustained
overexpression of IFN, but viral proteins may also indirectly cause IFN production through
adaptive immune responses. For example, antibodies generated towards EBV nuclear antigen-
1 cross-react with Ro/SSA [21], and anti-Ro/SSA antibodies may in turn form immune com-
plexes that stimulate type I IFNs [64]. As viruses evidently play a role in SS pathophysiology
[18], genetic variants affecting the antiviral properties of OAS1 might be a contributing factor.
A recent study showed that while the presence of antibodies to hepatitis D virus was equal in
SS patients and otherwise healthy controls, the virus itself was present in significantly more
patients [65], indeed suggesting that viral clearance is restrained. Epitope spreading [66, 67],
antibody cross-reaction [21], or molecular mimicry [68, 69] are likely consequences of subclin-
ical, chronic or recurrent infection.
The basal activity of OAS1, which varies greatly among individuals, is thought to be under
strong genetic control [51]. The enzyme activity in the GG genotype with predominantly the
p46 isoform is higher than GA (intermediate) and AA (low) [51]. OAS1 isoforms p42 and p46
have been detected at the protein level in human cells, whereas the p44a/p44b, p48, and p52
isoforms have been detected at mRNA levels [54, 70–72]. In addition to the RNase L activation
properties, the tetramer forming p48 isozyme also exhibits proapoptotic activity [73], a prop-
erty partly accredited to IFN-γ [74], and is shown to interact with Bcl-2 [75]. Bcl-2 is an anti-
apoptotic protein negatively regulated by Ro52 [76], and in salivary gland epithelial cells Bcl-2
is essential in regulation of IFN-γ induced apoptosis [77]. It has been postulated that p46 is a
more efficient synthetase than p48, explaining the increased basal activity of p46 [51].
Although there is no evidence showing that the differences in the C-terminus alter protein
function [78], our truncation experiments indicated that the alternatively spliced C-terminus
governs the post-transcriptional protein expression.
Variant that affects OAS1 splicing associates with Sjogren’s syndrome
PLOS Genetics | https://doi.org/10.1371/journal.pgen.1006820 June 22, 2017 14 / 29

Interestingly, we found lower protein expressions of p44 and p48 after type I IFN stimula-
tion despite equivalent transcript levels compared to p46. This indicates that p44 and p48 pro-
duction, which is governed by the A allele, is less responsive to IFN stimulation as compared
to p46. Lack of response to IFNs has also been seen in multiple sclerosis (MS), in which
patients carrying the homozygous rs10774671 GG genotype, a protective genotype in MS asso-
ciated with less active disease, were more responsive to IFN-β treatment than AA and AG
patients, as measured by time to first relapse [79].
We searched the Genotype-Tissue Expression (GTEx) database and confirmed the associa-
tion between rs10774671 and OAS1 expression in whole blood [80]. We also searched eQTL
for all our top variants in the 43 SS-associated genes (besides OAS1) as well as any variants in
LD with those top variants (r2>0.8). Out of the 614 variants we checked, two variants were
also eQTLs for their corresponding genes: the top SS-associated variant in ANKRD22(rs1147601, Passoc = 2.38×10⁻³, PeQTL-GTEx = 6.4×10⁻⁶) and the top SS-associated variant in
EPSTI1 (rs7323736, Passoc = 1.79×10⁻², PeQTL-GTEx = 2.6×10⁻⁶). However, both of these variants
were only nominally associated with SS susceptibility and did not pass our suggestive signifi-
cance threshold for disease association (Passoc<1×10⁻⁴). Nevertheless, these variants and genes
could be plausible targets for future replication studies to assess their disease associations.
The rs10774671 A/G variant is a common splice site variation, and there is a skewed distri-
bution of genotypes in autoimmune diseases like type I diabetes (T1D) [81] and MS [79]
despite ambiguous genetic association with disease: the alternative allele A renders risk to SS
and MS, whereas the reference allele G increases susceptibility to T1D. We hypothesized that
these opposite risk effects may be due to different functional isoform usages in different dis-
ease-relevant tissues. Through searching the GTEx database for rs10774671 eQTLs, we found
rs10774671 is a significant eQTL of OAS1 in 5 tissues (S6A Fig). Interestingly, the eQTL effect
in the Esophagus—Mucosa tissue is in the opposite direction compared to other tissues. In
whole blood, the p46 isoform is predominant, thus the A allele caused reduced expression of
OAS1 as a whole (S6B Fig); however, in Esophagus Mucosa, the isoform is p42 (S6C Fig) and
results in an opposite effect of rs10774671 on the total OAS1 expression. We propose that the
ambiguous genetic effects of rs10774671 on different diseases might be due to different func-
tional isoforms in disease-relevant tissues (not necessarily Esophagus—Mucosa). While
reduced expression of the functional isoform p46 in whole blood increases risk of SS and MS,
it protects individuals from T1D. The downstream differences of various isoforms in protein
levels, isoform expression, responsiveness to IFN, and basal activity between genotypes flag
OAS1 as a highly relevant protein in autoimmune diseases, despite no direct effect on IFN
expression.
OAS1 is one of several genes relevant in overall IFN response found to be disease associ-
ated in SS. Others include IL-12A [15], which can induce both type I and type II IFNs [82];
STAT4 [15], which, although not explicitly overexpressed in the IFN signature, plays an
important role in the cross-talk between type I and type II IFNs [83–85]; and IRF5 [15], a
transcription factor in the IFN pathway [86]. The rs10774671 is a known cis-eQTL and splic-
ing QTL, observed in whole blood [87] as in our study, in lymphoblastoid cells [88], and in
monocytes, both naïve CD14 and in cells stimulated with LPS and IFN-γ [89]; but no trans-eQTLs are known. It is possible that other variant(s) in high LD with rs10774671 could con-
tribute additional functional impact(s), such as the rs11352835 in exon 7 seen in MS [59].
Genomic editing approaches that introduce single point mutations or deletions in the OAS1region will further advance the dissection of the causal SS-associated variant in this haplo-
type. Animal models that express the risk isoforms due to the risk allele can also be used to
observe whether they spontaneously develop SS-like symptoms, and whether the chances for
developing such symptoms increase after exposure to viral infections. Our study also
Variant that affects OAS1 splicing associates with Sjogren’s syndrome
PLOS Genetics | https://doi.org/10.1371/journal.pgen.1006820 June 22, 2017 15 / 29

highlights the importance of utilizing genomic convergence to identify and prioritize suscep-
tibility genes for human complex disease. The complex mechanisms underlying the IFN sig-
nature in SS cannot be explained as a single eQTL driven overexpression. However, we have
in this study established OAS1 as a risk locus with functional consequences affecting isoform
composition, and that may play a fundamental role in dysregulation of both viral clearance
and apoptosis.
Materials and methods
Subjects
All patients in this study fulfilled the 2002 American-European Consensus Group (AECG) cri-
teria for primary SS [7]. Seropositivity of anti-Ro/SSA autoantibodies was determined by the
antibody index�1 using the Bio-Plex assay (Bio-Rad) following the manufacturer’s protocol.
The present study was approved by the Oklahoma Medical Research Foundation Institutional
Review Board (IRB#1—Biomedical), operation under Federalwide Assurance (FWA) #
00001389 and IRB # 00000114 under IORG 0000079 approved by the Office for Human
Research protection (OHRP), Department of Health and Human Services (DHHS). The
OMRF IRB is in compliance with local regulations and the regulations of the United States
Food and Drug Administration as described in 21 CFR Parts 50, 56 and 11, the International
Conference on Harmonization (ICH) E6, and the United States Department of Health and
Human Services at 45 CFR 46. The current study was approved under IRB#07–12 and all
patients provided written informed consent.
Transcriptome profiling study. SS patients were evaluated by expert clinicians at the
University of Minnesota or the Oklahoma Medical Research Foundation (OMRF) as described
previously [90]. Samples subjected to microarray-based transcriptome measurements included
182 patients with SS and 76 healthy controls. After QC assessments (see below), 115 anti-Ro/
SSA positive SS cases and 56 healthy controls were included in the transcriptome profiling
analysis. We assessed the distribution of the five main nucleated blood cell subpopulations
(granulocytes, lymphocytes, monocytes, basophils and eosinophils) derived from complete
blood cell counts from SS patients and healthy controls to evaluate whether differences in their
proportions might contribute to differential expression of transcriptional signatures (S7 Fig).
A total of 178 European subjects (108 anti-Ro/SSA positive SS cases, 55 anti-Ro/SSA negative
SS cases, and 15 healthy controls) for whom genotype data were also available were used in the
cis- eQTL analysis.
Genetic association study. All SS cases used in the genetic association analyses were col-
lected through the Sjogren’s Genetics Network and organized at the OMRF. Two datasets
(Dataset 1A and 1B) were combined for the initial genetic association analysis (Table 1). All
subjects in Dataset 1A have been previously described in a genome-wide association study
[15]. In Dataset 1B, 384 SS cases of European descent were genotyped and subjected to QC
measurements outlined below. The genotype data of 3,315 population controls in Dataset 1B
were obtained from the database of Genotypes and Phenotypes (dbGaP; http://www.ncbi.nlm.
nih.gov/gap). Each SS case was genetically matched to five population controls in Dataset 1A
and 1B, respectively, using the identity-by-state (IBS) to assess allele sharing as implemented
in PLINK v1.07 [91]. The remaining controls were used in the replication study (Dataset 2). A
total of 622 SS cases and 3,502 population controls were subjected to QC in the replication
phase (Dataset 2; Table 1).
RNA-seq study. For RNA-seq experiments, a total of 90 European subjects were evalu-
ated, including 27 anti-Ro/SSA positive SS cases, 33 anti-Ro/SSA negative SS cases, and 30
healthy controls.
Variant that affects OAS1 splicing associates with Sjogren’s syndrome
PLOS Genetics | https://doi.org/10.1371/journal.pgen.1006820 June 22, 2017 16 / 29
Microarray experiments and analyses
RNA processing and measurements. Total RNA was obtained by blood collection into
PAXGene tubes (BD Company) and extracted following manufacturer’s protocols (Qiagen).
Excess globin transcripts were removed using GLOBINclearTM (Ambion). RNA concentra-
tions were determined using a NanoDrop spectrophotometer (Thermo Scientific) based on
Optical Density values at A260. RNA quality was assessed by Agilent 2100 Bioanalyzer based
on 28S/18S ribosomal RNA ratio and RNA integrity number. Double stranded cDNA was syn-
thesized using a T7 promoter, and biotin-labeled cRNA was transcribed using the Illumina
TotalPrep RNA Amplification System (Ambion). Samples were hybridized to Human WG-6
v3.0 BeadChip microarrays (Illumina) containing 48,803 mRNA probes in 37,805 unique
genes per array. Microarrays were washed under high stringency and labeled with streptavi-
din-Cy3, and fluorescent intensity-based gene expression data were collected using Illumina’s
BeadStation 500 scanner or iScan.
QC and statistical analyses. Unless otherwise stated, all statistical analyses were per-
formed in the R Bioconductor suite. Microarray experiments were performed in two batches,
with 93 SS cases and 34 healthy controls in Batch 1 and 89 cases and 42 controls in Batch 2.
Raw intensity values for the two datasets were background subtracted separately using Illu-
mina BeadStudio software. Identification of outlier and poor-performing samples was accom-
plished by applying the package arrayQualityMetrics (AQM) [92] to log2-transformed
microarray data from each experiment. QC measures were applied to each dataset to filter out
transcripts expressed in<10% of the subjects (detection call threshold P<0.05) and probes
with differential missingness rates (P<0.001 by Fisher’s exact test) between the two datasets.
The remaining probes were then compared against data tables from the Re-annotation
and Mapping of Oligonucleotide Array Technologies (ReMOAT) [93], in which Illumina
BeadArray probe quality was extensively assessed and re-annotated. Each dataset was then
independently normalized using Robust Multiarray Average (RMA) [94], followed by log2
transformation and quantile normalization. The ComBat program was subsequently applied
to the combined dataset to adjust for non-biological experimental variation (i.e. batch effects)
[95]. Final re-annotation of un-annotated probes was performed manually using the NCBI
probe database (http://www.ncbi.nlm.nih.gov/probe) and UCSC Genome Browser alignment
(https://genome.ucsc.edu) [52]. Probes mapping to un-annotated genes or having inconsistent
results from the two databases were removed from the analysis. The results and pipeline of the
QC and normalization procedures applied to microarray data are summarized in (S8 Fig).
Gene expression comparisons were performed using Welch’s t-test between the mean expres-
sion values in SS cases and controls. The clustering of genes and samples was performed in
Cluster 3.0 [96] and visualized in Java TreeView [97]. Unless otherwise noted, unsupervised
hierarchical clustering was performed using centroid linkage with uncentered correlation for
both genes and samples.
Genetic association experiments and analyses
Genotyping and imputation. Genotyping for Dataset 1A was described previously [15].
Genotypes for Dataset 1B were obtained using the Illumina OmniExpress arrays at OMRF
following the manufacturer’s protocol. To increase informativeness, imputation was con-
ducted in subjects from the merged datasets (Dataset 1) for the OAS1 region (chr12:
113294739–113507712; hg19) meeting the criteria for suggestive association with SS
(Passoc<1×10⁻⁴). Imputation was performed using IMPUTE2 and the European Impute2
1000 Genomes Phase 1 April 2012 reference panel [98–100]. A probability threshold of 0.9
and information score of >0.5 were applied to the imputed genotypes in addition to the QC
Variant that affects OAS1 splicing associates with Sjogren’s syndrome
PLOS Genetics | https://doi.org/10.1371/journal.pgen.1006820 June 22, 2017 17 / 29
criteria described below for the association analyses. Genotypes for the replication study
(Dataset 2) were determined using TaqMan probes and reagents (Life Technologies) follow-
ing the manufacturer’s protocol.
QC process. Variants and samples in the genetic association analysis were subjected to a
strict QC procedure as described previously [15]: single-nucleotide polymorphism (SNP) call
rate>95% in all individuals; minor allele frequency >1%; Hardy-Weinberg proportion test
with a P>0.001 in controls; and P>0.001 for differential missingness between cases and con-
trols. Samples from Dataset 1A and Dataset 1B passing QC were retained if results showed:
>95% call rate for all variants; no excessive increased heterozygosity (>5 standard deviations
from the mean); and no relatedness determined by identity-by-descent (IBD) >0.4 using
PLINK v1.07 [91]. Population substructure was identified using EIGENSTRAT [101] with
independent genetic markers (r2<0.2 between variants). The resulting Eigenvectors were used
to distinguish the four continental ancestral populations with the following HapMap samples:
Africans (ASW, LWK, MKK, and YRI), Europeans (CEU and TSI), Hispanic and East Indians
(MEX and GIH), and Asians (CHB, CHD, and JPT) [102, 103]. The first two principal compo-
nents (PCs) output by EIGENSTRAT were plotted and used to identify samples outside the
European cluster [101, 102] (S9 Fig). Outliers from the European population were removed
from further analysis. Population stratification analysis was performed for the replication
cohort using genotype data from a previous study for the 622 SS cases [15] and genotype data
from the respective dbGaP studies.
Statistical analysis. A logistic regression model was used to test the association of genetic
variants with SS susceptibility in PLINK v1.07 [91]. The additive genetic model was calculated
for variants within and 50kb flanking the 73 differentially expressed transcripts while adjusting
for gender and the first three PCs as determined by the Scree test to evaluate the loading of
each PC for the amount of variance explained [104]. Meta-analysis of rs10774671 between the
initial genetic association analysis (Dataset 1) and the replication study (Dataset 2) were calcu-
lated using a Z-score weighted by the sample size of each dataset in METAL [105]. We tested
our logistic regression model for deviation from additivity using PLINK in both the discovery
dataset and replication dataset, and neither model shows significant deviation (p = 0.40 and
p = 0.31, respectively). Logistic regression adjusting for the most significant variants (condi-
tional analysis) was performed to determine independence of the association. LD and probable
haplotypes were determined using Haploview [106].
Cis- and trans-eQTL analysis
Quantitative levels of the differentially expressed transcripts from the microarray analysis were
used as phenotypic traits in 178 European subjects described above. Variants showing nominal
association with SS (Passoc<0.05) in the genetic association analysis were selected to test for cis-eQTLs, defined by variant-transcript pairs within 50kb of the target genes or trans-eQTLs for
variants at least 1Mb away. Association of genotype with transcript expression was evaluated
using both linear regression (adjusted for gender and disease status) and analysis of variance
(ANOVA) in Matrix-eQTL [107]. FDR-adjusted P values were calculated to determine the sig-
nificance of the eQTL. The results of the cis-eQTL analyses were plotted in Prism 6. We also
used a tool, PEER, based on a Bayesian framework to adjust for unknown non-genetic factors
in gene expression [108]. We transformed our expression values using all the genes that passed
QC by running PEER for 15 factors. We then used the PEER residuals from the 44 SS-associ-
ated (Passoc<0.05) IFN signature genes as quantitative traits to determine eQTL while adjusting
for other known potentially confounding factors: sex, disease status, anti-Ro/SSA status, and
age.
Variant that affects OAS1 splicing associates with Sjogren’s syndrome
PLOS Genetics | https://doi.org/10.1371/journal.pgen.1006820 June 22, 2017 18 / 29

In addition to additive genetic models, we also performed eQTL analyses using linear
regression by three other models: recessive (recode genotype from 0,1,2 [where 2 equals to
AA] to 0,0,1), dominant (0,1,1), and overdominant (0,1,0). We used the coefficient of determi-
nation (R2) to evaluate the goodness-of-fit in each of these models. As shown in S4 Table, both
the p42 and p48 isoforms fit the additive model best (highest R2), whereas the recessive model
outperformed in the p46 isoform regression (R2rec = 0.57 vs. R2add = 0.54). However, the differ-
ence of the R2 between the dominant and additive models in the p46 eQTL analysis is subtle.
Also, the outperformance of the recessive model cannot be confirmed by qPCR (where the
additive model has the highest R2). Therefore, we only reported the additive results in the
main text. However, the alternative genetic models for the eQTL effect observed in different
isoforms may reflect distinct disease mechanisms rendered by these isoforms, and thus
detailed contribution of different isoforms on disease susceptibility warrant further functional
study.
Co-localization analysis
The co-localization analysis between genetic association and cis-eQTL results in the OAS1region was performed using eCAVIAR [53]. We used the z-scores (calculated by β/standard
error) and the LD matrix (calculated using PLINK—r) from both the genetic association and
cis-eQTL results as input and assumed one causal variant to obtain colocalization posterior
probability (CLPP) scores for all the tested 453 variants in the OAS1 region.
RNA-seq experiments and analyses
Peripheral blood mRNA transcripts from 27 anti-Ro/SSA positive SS cases, 33 anti-Ro/SSA
negative SS cases, and 30 healthy controls were isolated and measured as described above.
RNA-seq was performed using the Illumina HiSeq 2000 employing standard procedures. Mul-
tiplexing of 6 samples per lane was utilized. Post sequence data were processed with Illumina
Pipeline software v.1.7. Quality of raw sequence data was assessed using FASTQC. We assessed
the quality of each sample using AQM [92] as described above. A total of 6 samples were
removed from analysis due to significantly different expression patterns revealed by PC analy-
sis. Raw FASTQ files were aligned to the human reference genome (hg19) using TopHat [57]
that aligns the reads across splicing junctions independent of gene annotations, which benefits
de novo detection of alternative splicing events. The total gene transcript level was determined
by normalized read counts (raw read counts divided by estimated size factor) in DESeq [109].
To determine alternative splicing events, the reference-independent construction of the
transcripts was performed using Cufflinks [58] to identify transcripts >1% of the most abun-
dant isoform in each sample. We only kept the transcripts that were detected in more than
10% of the samples for further analysis. The previously annotated isoforms (p46, p42 and p48)
and an un-annotated isoform identified across multiple samples (p44) were used as reference
to reconstruct the isoforms of OAS1. The novel identified isoforms of OAS1 were also checked
manually in the Integrative Genomics Viewer (IGV) [110] to confirm the transcripts and
cross-exon reads. The FPKM values calculated by Cufflinks were used to determine the expres-
sion levels of each isoform of OAS1.
OAS1 cloning and transfection
Total RNA was extracted using TRIzol reagents (Life Technologies) from EBV-immortalized
B cells pre-selected for the presence of target OAS1 isoforms based on the RNA-seq results
from whole blood. Following DNase treatment (Life Technologies) and cDNA synthesis
(iScript kit from Bio-Rad), full-length and truncated OAS1 transcripts were amplified from
Variant that affects OAS1 splicing associates with Sjogren’s syndrome
PLOS Genetics | https://doi.org/10.1371/journal.pgen.1006820 June 22, 2017 19 / 29
cDNA using primer sets specific for the different OAS1 isoforms and truncated forms (S3
Table). Each OAS1 isoform transcript was individually cloned into pcDNA3.1 (Invitrogen)
with an Xpress epitope tag at the 5’-terminus to facilitate the detection of transfected protein
using Western-blot with anti-Xpress antibody. The plasmid was transfected into the HEK
293T cells using FuGENE transfection reagents (Promega) following manufacturer’s
protocols.
OAS1 protein levels determination by Western blot
The protein expression of OAS1 isoforms was evaluated in EBV-immortalised B cells from
SS patients, four independent samples from each genotype group GG, GA and AA, treated
or not treated with type I interferon (universal type I IFN, 1500 U/mL, for 24 hours). The
cells were lysed in RIPA buffer and cell lysate protein concentration determined using the
Qubit Protein Assay kit (Thermo Fisher Scientific). A total of 30 μg protein from each cell
extract was separated on a 10% Bis-Tris gel (10% Criterion™ XT Bis-Tris Gel, BioRad, Cat #:
3450112) following the manufacturer’s instructions, the gels cut according to the weight of
the OAS1 protein, and simultaneously transferred to a single PVDF membrane, thus ensur-
ing the comparability of Western blot bands from all gels. The OAS1 isoforms were visual-
ized using an anti-OAS1 antibody targeting the shared epitope (Rabbit polyclonal anti-
human OAS1, Abcam, Cat #: ab86343) and ECL Prime Western Blotting Detection Reagents
(Amersham, Cat #: RPN2232).
Supporting information
S1 Fig. Test of anti-Ro/SSA-specific genetic effect of rs10774671 with SS. (A) We stratified
our SS case samples based on anti-Ro/SSA status and merged the samples from Dataset1 and
Dataset2 to boost statistical power. We performed a Z-test based on regression coefficients
where β1 and β2 correspond to the regression coefficients from anti-Ro/SSA positive and neg-
ative datasets, respectively, and SEβ1 and SEβ2 are standard errors of the regression coeffi-
cients. There is no significant difference of the genetic effects from rs10774671 on SS
susceptibility between results from the anti-Ro/SSA positive dataset and anti-Ro/SSA negative
dataset (p = 0.60). (B) Down-sampling tests for association of rs10774671 with SS in the anti-
Ro/SSA positive dataset. The bar plot shows the distribution of p values from 10,000 permuta-
tion tests when down-sampling the cases in the anti-Ro/SSA positive dataset to n = 280 to
match the case size in the anti-Ro/SSA negative dataset. The red line shows the p value of the
association of rs10774671 with SS in the anti-Ro/SSA negative dataset (Pneg = 1.28×10⁻²). We
calculated an empirical p value to compare Pneg with the down-sampled p values based on the
rank of the Pneg within the 10,000 permutation p values, and found Pneg is not significantly
deviated from the permutation tests from the anti-Ro/SSA positive dataset (Pemp = 0.22).
(TIF)
S2 Fig. Replication of RNA-seq results for the transcript levels of OAS1 isoforms using
quantitative real-time PCR. The transcript levels of each OAS1 isoform were determined by
real-time PCR using primer sets targeting the specific OAS1 isoform (S3 Table). The transcript
levels of OAS1 isoforms were normalized to the housekeeping gene HMBS. Consistent with the
RNA-seq results, the SS-associated risk allele A of rs10774671 was correlated with increased
expression of the (A) p42, (B) p48, and (C) p44 isoforms but decreased levels of (D) p46 (P val-
ues were determined using Kruskal-Wallis test not assuming equal standard deviation across
different groups). The error bar indicates standard error of the mean. There is no error bar in
the AA group from p48 or GG group from p44, as the transcripts were not detectable using
Variant that affects OAS1 splicing associates with Sjogren’s syndrome
PLOS Genetics | https://doi.org/10.1371/journal.pgen.1006820 June 22, 2017 20 / 29
real-time PCR in these samples. (GG: n = 6; GA: n = 7; AA: n = 9)
(TIF)
S3 Fig. Test of anti-Ro/SSA-specific eQTL effect of rs10774671. (A) we performed eQTL
analyses using the RNA-seq data in anti-Ro/SSA positive patients (n = 27) and anti-Ro/SSA
negative patients (n = 30) separately. We performed linear regression on the expression of the
four isoforms of OAS1 while adjusting for sex in the two subsets of samples. We performed a
Z-test to determine whether the eQTL effects are different between anti-Ro/SSA positive
group and anti-Ro/SSA negative group. We did not find any significant difference of the eQTL
effects between the two sub-groups. (B) we performed a linear regression analysis in all SS
patients (n = 57) using an interaction term (genotype � anti-Ro) as an independent variable
while adjusting for sex (expression ~ genotype � anti-Ro + sex). In the analyses for the p46,
p42, and p48 isoforms, both the autoantibody status and the genotype are significantly associ-
ated with OAS1 isoform expression. The OAS1 transcripts are part of the interferon signature,
which is well-documented to be correlated with auto-Ro/SSA status; however, the variation of
OAS1 isoform expression is explained more by the genotype of rs10774671 compared to anti-
Ro/SSA status. Also, none of the linear regression models is significant for the (genotype� anti-Ro) term, which indicates that the anti-Ro/SSA positivity does not influence the genetic
effect of rs10774671 on OAS1 isoform expression.
(TIF)
S4 Fig. Total transcript levels of OAS1 in RNA-seq from subjects with different genotypes
of rs10774671. The total OAS1 transcript levels regardless of the isoforms was determined
using the normalized read counts mapped to the OAS1 region from RNA-seq. (A) Statistically
significant differences were observed for the total OAS1 transcript expression between the case
and control groups carrying the same genotype (GA and AA group). (B) The overexpression
of total OAS1 in SS cases was explained by subjects who are anti-Ro/SSA positive, as significant
higher expression of total OAS1 was observed in anti-Ro/SSA positive cases compared to both
controls and anti-Ro/SSA negative cases in the GA and AA groups. P values were determined
using two-tailed t test (Significance level: � P<0.05; �� P<0.01; ��� P<0.001; ���� P<0.0001).
The Mean±SEM of each group are plotted in red.
(TIF)
S5 Fig. Influence of the 3’-terminus of each OAS1 isoform on protein expression. (A) The
3’ alternatively spliced terminus of different OAS1 isoforms (indicated by Δ) were linked to the
3’-end of GFP followed by transfection into HEK 293T cells. GFP was cloned into pcDNA3.1
first and then ligated with OAS1 3’ end cutting from the pBluescript II KS plasmid carrying
individual OAS1 isoform clones (S3 Table). (B) Normal expression of GFP was observed when
linked with the 3’-terminus from the normally spliced isoform p46 (GFP-Δp46); while the 3’-
terminus from the p48 and p44 isoforms resulted in decreased protein expression of GFP. (C)
Zoomed in photos show that while GFP-Δp46 was universally expressed, 3’-end of the three
alternatively spliced isoforms (p42, p48, and p44) due to the SS-associated risk allele A of
rs10774671 seem to alter GFP distribution into certain organelles of the cell (arrows). Further
detailed study is needed to investigate which specific organelle does each alternatively spliced
isoform is enriched in.
(TIF)
S6 Fig. Associations of rs10774671 with OAS1 expression from the GTEx database. (A) We
found significant eQTLs of rs10774671 on the expression of OAS1 in 5 tissues from the GTEx
database. (B,C) The eQTL effects of rs10774671 on the OAS1 expression in whole blood and
esophagus mucosa. The right part of the figure shows isoform expression of the p46 and p42
Variant that affects OAS1 splicing associates with Sjogren’s syndrome
PLOS Genetics | https://doi.org/10.1371/journal.pgen.1006820 June 22, 2017 21 / 29

isoforms in whole blood and esophagus mucosa.
(TIF)
S7 Fig. Comparison of blood cell type composition between SS patients and healthy con-
trols. In order to determine whether the overexpression of IFN signature genes in SS patients
was due to elevated numbers of immune cells in whole blood, we compared the results from
the differential cell counts derived from complete blood between SS patients and healthy con-
trols used in our gene expression study. Lymphocyte counts were the only immune cell type
with cell counts significantly different between SS patients and controls. As expected, the lym-
phocyte counts were lower in SS patients compared to controls; thus, they do not explain the
overexpression of IFN-inducible genes in patients. Lymphopenia has been observed in multi-
ple autoimmune diseases, including SS [111], likely through the mechanism of “two-hit model
of autoimmunity”, where both lymphopenia and the aberrant responsiveness of T cells to
TGF-β signaling are required to trigger the development of autoimmune disease [112, 113]. It
is unclear whether or how type I IFN signaling may be involved in this process as a link
between innate and adaptive immune responses. We propose that the IFN signatures are more
related to the mechanisms that involve viral infection and autoantibody production, rather
than influencing lymphocyte tolerance and homeostasis as proposed in the “two-hit model of
autoimmunity”. However, both mechanisms may interact with each other during the develop-
ment of autoimmune diseases.
(TIF)
S8 Fig. Pipeline and results of the QC and normalization procedures for the transcrip-
tome profiling study. (A) A stringent QC process was applied to the microarray data prior
to analyses. Quality assessments for both samples and probes were performed through a
series of processes using packages in the R suite. Normalization to the whole dataset was
performed as a routine procedure for whole transcriptome analysis. The differentially
expressed genes between SS cases and controls were identified using a significant cuff-off of
q<0.05 and absolute FC > 2 before the downstream clustering and cis-eQTL analyses. (B)
The expression levels of all probes (y-axis) in each individual (x-axis) were plotted for raw
data, after QC and normalization, and after removing the batch effect using the ComBat
program.
(TIF)
S9 Fig. Assessments of population stratification using principal component analysis. The
population ancestry was determined for each sample prior to analysis to keep only the samples
of European ancestry. Plots of PC2 vs. PC1 from the principal component analyses for (A) the
initial genetic association study (Dataset 1) and (B) replication study (Dataset 2) are shown.
The analyses were performed along with samples from the HapMap cohort. The final samples
used in the respective analyses are shown as black dots.
(TIF)
S1 Table. Results of transcriptome profiling, genetic association, and cis-eQTL analyses
for the dysregulated genes in SS.
(XLSX)
S2 Table. Results of co-localization analysis using eCAVIAR.
(XLSX)
S3 Table. Sequence of the primers used in this study.
(XLSX)
Variant that affects OAS1 splicing associates with Sjogren’s syndrome
PLOS Genetics | https://doi.org/10.1371/journal.pgen.1006820 June 22, 2017 22 / 29

S4 Table. Results of eQTL analyses for OAS1 isoforms using different genetic models.
(XLSX)
S5 Table. Microarray data. Microarray data that passed QC.
(TXT)
S6 Table. Microarray sample info. metadata information for samples in the microarray.
(TXT)
S7 Table. RNAseq data. Normalized OAS1 isoform expression.
(TXT)
S8 Table. Genotype OAS1. Genotypes of all the variants in the OAS1 region in the eQTL anal-
ysis.
(TXT)
S1 Text. Membership of UK Primary Sjogren’s Syndrome Registry.
(PDF)
Acknowledgments
We are grateful to all the individuals with Sjogren’s syndrome and those serving as healthy
controls who participated in this study. We would like to thank the following individuals for
their help in the collection and ascertainment of the samples used in this study: Erin Rothrock,
Judy Harris, Sharon Johnson, Sara Cioli, Nicole Weber, Dominique Williams, Wes Daniels,
Cherilyn Pritchett-Frazee, Kylia Crouch, Laura Battiest, Abu N. M. Nazmul-Hossain, Justin
Rodgers, James Robertson, Thuan Nguyen, Amanda Crosbie, Ellen James, Carolyn Meyer,
Amber McElroy, Eshrat Emamian, Julie Ermer, Kristine Rohlf, Joanlise Leon, Anita Petersen,
Danielle Hartle, Jill Novizke, Ward Ortman, Carl Espy, Beth Cobb, Rezvan Kiani, Marianne
Eidsheim and Joelle Benessiano Centre de Ressources Biologiques, Hopital Bichat, Paris,
France. We would also like to thank Jared Ning for the ongoing assistance in developing and
maintaining the computational infrastructure used to perform this study.
Author Contributions
Conceived and designed the experiments: HL CJL KLS.
Performed the experiments: HL SW BH KMK AJA ST.
Analyzed the data: HL JAI JAK IAd CGM CJL KLS.
Contributed reagents/materials/analysis tools: HL JAI JAK AR KMG SBG CMR SB SL PE
MLE JGB LGG EH JMG MK DSCG KP ADF MTB JC RG MHW SV DJW KSH GDH
AJWH PJH DML LRa ESV CEE MDR DUS TJV JBH PMG JAJ IAl JMA NLR BMS CGM
RHS SK XM LRo TW MR MWH RO RJ WFN GN CJL KLS.
Wrote the paper: HL TRR CJL KLS.
References1. Helmick CG, Felson DT, Lawrence RC, Gabriel S, Hirsch R, Kwoh CK, et al. Estimates of the preva-
lence of arthritis and other rheumatic conditions in the United States. Part I. Arthritis Rheum. 2008; 58
(1):15–25. https://doi.org/10.1002/art.23177 PMID: 18163481
2. Fox RI. Sjogren’s syndrome. Lancet. 2005; 366(9482):321–31. https://doi.org/10.1016/S0140-6736
(05)66990-5 PMID: 16039337
Variant that affects OAS1 splicing associates with Sjogren’s syndrome
PLOS Genetics | https://doi.org/10.1371/journal.pgen.1006820 June 22, 2017 23 / 29

3. Fox RI, Stern M, Michelson P. Update in Sjogren syndrome. Curr Opin Rheumatol. 2000; 12(5):391–
8. PMID: 10990175
4. Segal B, Thomas W, Rogers T, Leon JM, Hughes P, Patel D, et al. Prevalence, severity, and predic-
tors of fatigue in subjects with primary Sjogren’s syndrome. Arthritis Rheum. 2008; 59(12):1780–7.
https://doi.org/10.1002/art.24311 PMID: 19035421
5. Zintzaras E, Voulgarelis M, Moutsopoulos HM. The risk of lymphoma development in autoimmune dis-
eases: a meta-analysis. Arch Intern Med. 2005; 165(20):2337–44. https://doi.org/10.1001/archinte.
165.20.2337 PMID: 16287762
6. Theander E, Henriksson G, Ljungberg O, Mandl T, Manthorpe R, Jacobsson LT. Lymphoma and
other malignancies in primary Sjogren’s syndrome: a cohort study on cancer incidence and lym-
phoma predictors. Ann Rheum Dis. 2006; 65(6):796–803. https://doi.org/10.1136/ard.2005.041186
PMID: 16284097
7. Vitali C, Bombardieri S, Jonsson R, Moutsopoulos HM, Alexander EL, Carsons SE, et al. Classification
criteria for Sjogren’s syndrome: a revised version of the European criteria proposed by the American-
European Consensus Group. Ann Rheum Dis. 2002; 61(6):554–8. https://doi.org/10.1136/ard.61.6.
554 PMID: 12006334
8. Toker E, Yavuz S, Direskeneli H. Anti-Ro/SSA and anti-La/SSB autoantibodies in the tear fluid of
patients with Sjogren’s syndrome. Br J Ophthalmol. 2004; 88(3):384–7. https://doi.org/10.1136/bjo.
2003.028340 PMID: 14977774
9. Hernandez-Molina G, Leal-Alegre G, Michel-Peregrina M. The meaning of anti-Ro and anti-La anti-
bodies in primary Sjogren’s syndrome. Autoimmun Rev. 2011; 10(3):123–5. https://doi.org/10.1016/j.
autrev.2010.09.001 PMID: 20833272
10. Kyriakidis NC, Kapsogeorgou EK, Tzioufas AG. A comprehensive review of autoantibodies in primary
Sjogren’s syndrome: clinical phenotypes and regulatory mechanisms. J Autoimmun. 2014; 51:67–74.
https://doi.org/10.1016/j.jaut.2013.11.001 PMID: 24333103
11. Lovgren T, Eloranta ML, Bave U, Alm GV, Ronnblom L. Induction of interferon-alpha production in
plasmacytoid dendritic cells by immune complexes containing nucleic acid released by necrotic or late
apoptotic cells and lupus IgG. Arthritis Rheum. 2004; 50(6):1861–72. https://doi.org/10.1002/art.
20254 PMID: 15188363
12. Bave U, Nordmark G, Lovgren T, Ronnelid J, Cajander S, Eloranta ML, et al. Activation of the type I
interferon system in primary Sjogren’s syndrome: a possible etiopathogenic mechanism. Arthritis
Rheumatol. 2005; 52(4):1185–95.
13. Wiedeman AE, Santer DM, Yan W, Miescher S, Kasermann F, Elkon KB. Contrasting mechanisms of
interferon-alpha inhibition by intravenous immunoglobulin after induction by immune complexes ver-
sus Toll-like receptor agonists. Arthritis Rheum. 2013; 65(10):2713–23. https://doi.org/10.1002/art.
38082 PMID: 23840006
14. Nocturne G, Mariette X. Advances in understanding the pathogenesis of primary Sjogren’s syndrome.
Nat Rev Rheumatol. 2013; 9(9):544–56. https://doi.org/10.1038/nrrheum.2013.110 PMID: 23857130
15. Lessard CJ, Li H, Adrianto I, Ice JA, Rasmussen A, Grundahl KM, et al. Variants at multiple loci impli-
cated in both innate and adaptive immune responses are associated with Sjogren’s syndrome. Nat
Genet. 2013; 45(11):1284–92. https://doi.org/10.1038/ng.2792 PMID: 24097067
16. Li Y, Zhang K, Chen H, Sun F, Xu J, Wu Z, et al. A genome-wide association study in Han Chinese
identifies a susceptibility locus for primary Sjogren’s syndrome at 7q11.23. Nat Genet. 2013; 45
(11):1361–5. https://doi.org/10.1038/ng.2779 PMID: 24097066
17. Youinou P, Pers JO, Saraux A, Pennec YL. Viruses contribute to the development of Sjogren’s syn-
drome. Clin Exp Immunol. 2005; 141(1):19–20. https://doi.org/10.1111/j.1365-2249.2005.02827.x
PMID: 15958065
18. Igoe A, Scofield RH. Autoimmunity and infection in Sjogren’s syndrome. Curr Opin Rheumatol. 2013;
25(4):480–7. https://doi.org/10.1097/BOR.0b013e32836200d2 PMID: 23719365
19. Voulgarelis M, Tzioufas AG. Pathogenetic mechanisms in the initiation and perpetuation of Sjogren’s
syndrome. Nat Rev Rheumatol. 2010; 6(9):529–37. https://doi.org/10.1038/nrrheum.2010.118 PMID:
20683439
20. Theander E, Jonsson R, Sjostrom B, Brokstad K, Olsson P, Henriksson G. Prediction of Sjogren’s
Syndrome Years Before Diagnosis and Identification of Patients With Early Onset and Severe Disease
Course by Autoantibody Profiling. Arthritis Rheumatol. 2015; 67(9):2427–36. https://doi.org/10.1002/
art.39214 PMID: 26109563
21. Poole BD, Scofield RH, Harley JB, James JA. Epstein-Barr virus and molecular mimicry in systemic
lupus erythematosus. Autoimmunity. 2006; 39(1):63–70. https://doi.org/10.1080/
08916930500484849 PMID: 16455583
Variant that affects OAS1 splicing associates with Sjogren’s syndrome
PLOS Genetics | https://doi.org/10.1371/journal.pgen.1006820 June 22, 2017 24 / 29
22. Pasoto SG, Natalino RR, Chakkour HP, Viana Vdos S, Bueno C, Leon EP, et al. EBV reactivation
serological profile in primary Sjogren’s syndrome: an underlying trigger of active articular involvement?
Rheumatol Int. 2013; 33(5):1149–57. https://doi.org/10.1007/s00296-012-2504-3 PMID: 22955798
23. Mavragani CP, Sagalovskiy I, Guo Q, Nezos A, Kapsogeorgou EK, Lu P, et al. Long interspersed
nuclear element-1 retroelements are expressed in patients with systemic autoimmune disease and
induce type I interferon. Arthritis Rheumatol. 2016.
24. Reksten TR, Jonsson MV, Szyszko EA, Brun JG, Jonsson R, Brokstad KA. Cytokine and autoantibody
profiling related to histopathological features in primary Sjogren’s syndrome. Rheumatology (Oxford).
2009; 48(9):1102–6.
25. Ivashkiv LB, Donlin LT. Regulation of type I interferon responses. Nat Rev Immunol. 2014; 14(1):36–
49. https://doi.org/10.1038/nri3581 PMID: 24362405
26. Crow MK. Type I interferon in organ-targeted autoimmune and inflammatory diseases. Arthritis Res
Ther. 2010; 12 Suppl 1:S5.
27. Ronnblom L, Eloranta ML. The interferon signature in autoimmune diseases. Curr Opin Rheumatol.
2013; 25(2):248–53. https://doi.org/10.1097/BOR.0b013e32835c7e32 PMID: 23249830
28. van der Pouw Kraan TC, Wijbrandts CA, van Baarsen LG, Voskuyl AE, Rustenburg F, Baggen JM,
et al. Rheumatoid arthritis subtypes identified by genomic profiling of peripheral blood cells: assign-
ment of a type I interferon signature in a subpopulation of patients. Ann Rheum Dis. 2007; 66
(8):1008–14. https://doi.org/10.1136/ard.2006.063412 PMID: 17223656
29. van Baarsen LG, Wijbrandts CA, Rustenburg F, Cantaert T, van der Pouw Kraan TC, Baeten DL, et al.
Regulation of IFN response gene activity during infliximab treatment in rheumatoid arthritis is associ-
ated with clinical response to treatment. Arthritis Res Ther. 2010; 12(1):R11. https://doi.org/10.1186/
ar2912 PMID: 20096109
30. Raterman HG, Vosslamber S, de Ridder S, Nurmohamed MT, Lems WF, Boers M, et al. The inter-
feron type I signature towards prediction of non-response to rituximab in rheumatoid arthritis patients.
Arthritis Res Ther. 2012; 14(2):R95. https://doi.org/10.1186/ar3819 PMID: 22540992
31. Baechler EC, Batliwalla FM, Karypis G, Gaffney PM, Ortmann WA, Espe KJ, et al. Interferon-inducible
gene expression signature in peripheral blood cells of patients with severe lupus. Proc Natl Acad Sci U
S A. 2003; 100(5):2610–5. https://doi.org/10.1073/pnas.0337679100 PMID: 12604793
32. Bauer JW, Baechler EC, Petri M, Batliwalla FM, Crawford D, Ortmann WA, et al. Elevated serum lev-
els of interferon-regulated chemokines are biomarkers for active human systemic lupus erythemato-
sus. PLoS Med. 2006; 3(12):e491. https://doi.org/10.1371/journal.pmed.0030491 PMID: 17177599
33. Ronnblom L, Alm GV, Eloranta ML. Type I interferon and lupus. Curr Opin Rheumatol. 2009; 21
(5):471–7. https://doi.org/10.1097/BOR.0b013e32832e089e PMID: 19525849
34. Emamian ES, Leon JM, Lessard CJ, Grandits M, Baechler EC, Gaffney PM, et al. Peripheral blood
gene expression profiling in Sjogren’s syndrome. Genes & Immunity. 2009; 10(4):285–96.
35. Gottenberg JE, Cagnard N, Lucchesi C, Letourneur F, Mistou S, Lazure T, et al. Activation of IFN path-
ways and plasmacytoid dendritic cell recruitment in target organs of primary Sjogren’s syndrome. Proc
Natl Acad Sci U S A. 2006; 103(8):2770–5. https://doi.org/10.1073/pnas.0510837103 PMID:
16477017
36. Hjelmervik TO, Petersen K, Jonassen I, Jonsson R, Bolstad AI. Gene expression profiling of minor sal-
ivary glands clearly distinguishes primary Sjogren’s syndrome patients from healthy control subjects.
Arthritis Rheum. 2005; 52(5):1534–44. https://doi.org/10.1002/art.21006 PMID: 15880807
37. Perez P, Anaya JM, Aguilera S, Urzua U, Munroe D, Molina C, et al. Gene expression and chromo-
somal location for susceptibility to Sjogren’s syndrome. J Autoimmun. 2009; 33(2):99–108. https://doi.
org/10.1016/j.jaut.2009.05.001 PMID: 19523788
38. Li H, Ice JA, Lessard CJ, Sivils KL. Interferons in Sjogren’s Syndrome: Genes, Mechanisms, and
Effects. Front Immunol. 2013; 4:290. https://doi.org/10.3389/fimmu.2013.00290 PMID: 24062752
39. International Consortium for Systemic Lupus Erythematosus Genetics, Harley JB, Alarcon-Riquelme
ME, Criswell LA, Jacob CO, Kimberly RP, et al. Genome-wide association scan in women with sys-
temic lupus erythematosus identifies susceptibility variants in ITGAM, PXK, KIAA1542 and other loci.
Nat Genet. 2008; 40(2):204–10. https://doi.org/10.1038/ng.81 PMID: 18204446
40. Lessard CJ, Adrianto I, Ice JA, Wiley GB, Kelly JA, Glenn SB, et al. Identification of IRF8, TMEM39A,
and IKZF3-ZPBP2 as susceptibility loci for systemic lupus erythematosus in a large-scale multiracial
replication study. Am J Hum Genet. 2012; 90(4):648–60. https://doi.org/10.1016/j.ajhg.2012.02.023
PMID: 22464253
41. Stahl EA, Raychaudhuri S, Remmers EF, Xie G, Eyre S, Thomson BP, et al. Genome-wide associa-
tion study meta-analysis identifies seven new rheumatoid arthritis risk loci. Nat Genet. 2010; 42
(6):508–14. https://doi.org/10.1038/ng.582 PMID: 20453842
Variant that affects OAS1 splicing associates with Sjogren’s syndrome
PLOS Genetics | https://doi.org/10.1371/journal.pgen.1006820 June 22, 2017 25 / 29
42. Miceli-Richard C, Comets E, Loiseau P, Puechal X, Hachulla E, Mariette X. Association of an IRF5
gene functional polymorphism with Sjogren’s syndrome. Arthritis Rheum. 2007; 56(12):3989–94.
https://doi.org/10.1002/art.23142 PMID: 18050197
43. Nordmark G, Kristjansdottir G, Theander E, Eriksson P, Brun JG, Wang C, et al. Additive effects of the
major risk alleles of IRF5 and STAT4 in primary Sjogren’s syndrome. Genes & Immunity. 2009; 10
(1):68–76.
44. Lien C, Fang CM, Huso D, Livak F, Lu R, Pitha PM. Critical role of IRF-5 in regulation of B-cell differen-
tiation. Proc Natl Acad Sci U S A. 2010; 107(10):4664–8. https://doi.org/10.1073/pnas.0911193107
PMID: 20176957
45. Wang J, Basagoudanavar SH, Wang X, Hopewell E, Albrecht R, Garcia-Sastre A, et al. NF-kappa B
RelA subunit is crucial for early IFN-beta expression and resistance to RNA virus replication. J Immu-
nol. 2010; 185(3):1720–9. https://doi.org/10.4049/jimmunol.1000114 PMID: 20610653
46. Hindorff LA, Sethupathy P, Junkins HA, Ramos EM, Mehta JP, Collins FS, et al. Potential etiologic
and functional implications of genome-wide association loci for human diseases and traits. Proc Natl
Acad Sci U S A. 2009; 106(23):9362–7. https://doi.org/10.1073/pnas.0903103106 PMID: 19474294
47. Gupta RM, Musunuru K. Mapping novel pathways in cardiovascular disease using eQTL data: the
past, present, and future of gene expression analysis. Front Genet. 2012; 3:232. https://doi.org/10.
3389/fgene.2012.00232 PMID: 23755065
48. Encode Project Consortium. An integrated encyclopedia of DNA elements in the human genome.
Nature. 2012; 489(7414):57–74. https://doi.org/10.1038/nature11247 PMID: 22955616
49. Kabakchiev B, Silverberg MS. Expression quantitative trait loci analysis identifies associations
between genotype and gene expression in human intestine. Gastroenterology. 2013; 144(7):1488–
96, 96 e1–3. https://doi.org/10.1053/j.gastro.2013.03.001 PMID: 23474282
50. Kim Y, Xia K, Tao R, Giusti-Rodriguez P, Vladimirov V, van den Oord E, et al. A meta-analysis of gene
expression quantitative trait loci in brain. Transl Psychiatry. 2014; 4:e459. https://doi.org/10.1038/tp.
2014.96 PMID: 25290266
51. Bonnevie-Nielsen V, Field LL, Lu S, Zheng DJ, Li M, Martensen PM, et al. Variation in antiviral 2’,5’-oli-
goadenylate synthetase (2’5’AS) enzyme activity is controlled by a single-nucleotide polymorphism at
a splice-acceptor site in the OAS1 gene. Am J Hum Genet. 2005; 76(4):623–33. https://doi.org/10.
1086/429391 PMID: 15732009
52. Kent WJ, Sugnet CW, Furey TS, Roskin KM, Pringle TH, Zahler AM, et al. The human genome
browser at UCSC. Genome Res. 2002; 12(6):996–1006. https://doi.org/10.1101/gr.229102 PMID:
12045153
53. Hormozdiari F, Kostem E, Kang EY, Pasaniuc B, Eskin E. Identifying causal variants at loci with multi-
ple signals of association. Genetics. 2014; 198(2):497–508. https://doi.org/10.1534/genetics.114.
167908 PMID: 25104515
54. Kjaer KH, Pahus J, Hansen MF, Poulsen JB, Christensen EI, Justesen J, et al. Mitochondrial localiza-
tion of the OAS1 p46 isoform associated with a common single nucleotide polymorphism. BMC Cell
Biol. 2014; 15:33. https://doi.org/10.1186/1471-2121-15-33 PMID: 25205466
55. Lalonde E, Ha KC, Wang Z, Bemmo A, Kleinman CL, Kwan T, et al. RNA sequencing reveals the role
of splicing polymorphisms in regulating human gene expression. Genome Res. 2011; 21(4):545–54.
https://doi.org/10.1101/gr.111211.110 PMID: 21173033
56. Noguchi S, Hamano E, Matsushita I, Hijikata M, Ito H, Nagase T, et al. Differential effects of a common
splice site polymorphism on the generation of OAS1 variants in human bronchial epithelial cells. Hum
Immunol. 2013; 74(3):395–401. https://doi.org/10.1016/j.humimm.2012.11.011 PMID: 23220500
57. Trapnell C, Pachter L, Salzberg SL. TopHat: discovering splice junctions with RNA-Seq. Bioinformat-
ics. 2009; 25(9):1105–11. https://doi.org/10.1093/bioinformatics/btp120 PMID: 19289445
58. Trapnell C, Williams BA, Pertea G, Mortazavi A, Kwan G, van Baren MJ, et al. Transcript assembly
and quantification by RNA-Seq reveals unannotated transcripts and isoform switching during cell dif-
ferentiation. Nat Biotechnol. 2010; 28(5):511–5. https://doi.org/10.1038/nbt.1621 PMID: 20436464
59. Cagliani R, Fumagalli M, Guerini FR, Riva S, Galimberti D, Comi GP, et al. Identification of a new sus-
ceptibility variant for multiple sclerosis in OAS1 by population genetics analysis. Hum Genet. 2012;
131(1):87–97. https://doi.org/10.1007/s00439-011-1053-2 PMID: 21735172
60. Lim JK, Lisco A, McDermott DH, Huynh L, Ward JM, Johnson B, et al. Genetic variation in OAS1 is a
risk factor for initial infection with West Nile virus in man. PLoS Pathog. 2009; 5(2):e1000321. https://
doi.org/10.1371/journal.ppat.1000321 PMID: 19247438
61. Zhao Y, Kang H, Ji Y, Chen X. Evaluate the relationship between polymorphisms of OAS1 gene and
susceptibility to chronic hepatitis C with high resolution melting analysis. Clin Exp Med. 2013; 13
(3):171–6. https://doi.org/10.1007/s10238-012-0193-6 PMID: 22710942
Variant that affects OAS1 splicing associates with Sjogren’s syndrome
PLOS Genetics | https://doi.org/10.1371/journal.pgen.1006820 June 22, 2017 26 / 29
62. Hovanessian AG, Justesen J. The human 2’-5’oligoadenylate synthetase family: unique interferon-
inducible enzymes catalyzing 2’-5’ instead of 3’-5’ phosphodiester bond formation. Biochimie. 2007;
89(6–7):779–88. https://doi.org/10.1016/j.biochi.2007.02.003 PMID: 17408844
63. Silverman RH. A scientific journey through the 2-5A/RNase L system. Cytokine Growth Factor Rev.
2007; 18(5–6):381–8. https://doi.org/10.1016/j.cytogfr.2007.06.012 PMID: 17681844
64. Hung T, Pratt GA, Sundararaman B, Townsend MJ, Chaivorapol C, Bhangale T, et al. The Ro60 auto-
antigen binds endogenous retroelements and regulates inflammatory gene expression. Science.
2015; 350(6259):455–9. https://doi.org/10.1126/science.aac7442 PMID: 26382853
65. Weller ML, Gardener MR, Bogus ZC, Smith MA, Astorri E, Michael DG, et al. Hepatitis Delta Virus
Detected in Salivary Glands of Sjogren’s Syndrome Patients and Recapitulates a Sjogren’s Syn-
drome-Like Phenotype in Vivo. Pathog Immun. 2016; 1(1):12–40. PMID: 27294212
66. Ding M, Zhang J. Epitope spreading induced by immunization with synthetic SSB peptides. Exp Ther
Med. 2016; 12(1):147–50. https://doi.org/10.3892/etm.2016.3267 PMID: 27347030
67. Paisansinsup T, Deshmukh US, Chowdhary VR, Luthra HS, Fu SM, David CS. HLA class II influences
the immune response and antibody diversification to Ro60/Sjogren’s syndrome-A: heightened anti-
body responses and epitope spreading in mice expressing HLA-DR molecules. J Immunol. 2002; 168
(11):5876–84. PMID: 12023392
68. Szymula A, Rosenthal J, Szczerba BM, Bagavant H, Fu SM, Deshmukh US. T cell epitope mimicry
between Sjogren’s syndrome Antigen A (SSA)/Ro60 and oral, gut, skin and vaginal bacteria. Clin
Immunol. 2014; 152(1–2):1–9. https://doi.org/10.1016/j.clim.2014.02.004 PMID: 24576620
69. Albert LJ, Inman RD. Molecular mimicry and autoimmunity. N Engl J Med. 1999; 341(27):2068–74.
https://doi.org/10.1056/NEJM199912303412707 PMID: 10615080
70. Justesen J, Hartmann R, Kjeldgaard NO. Gene structure and function of the 2’-5’-oligoadenylate syn-
thetase family. Cell Mol Life Sci. 2000; 57(11):1593–612. PMID: 11092454
71. Imran M, Manzoor S, Khattak NM, Tariq M, Khalid M, Javed F, et al. Correlation of OAS1 gene poly-
morphism at exon 7 splice accepter site with interferon-based therapy of HCV infection in Pakistan.
Viral Immunol. 2014; 27(3):105–11. https://doi.org/10.1089/vim.2013.0107 PMID: 24673406
72. Bader El Din NG, Anany MA, Dawood RM, Ibrahim MK, El-Shenawy R, El Abd YS, et al. Impact of
OAS1 Exon 7 rs10774671 Genetic Variation on Liver Fibrosis Progression in Egyptian HCV Genotype
4 Patients. Viral Immunol. 2015; 28(9):509–16. https://doi.org/10.1089/vim.2015.0041 PMID:
26505957
73. Ghosh A, Sarkar SN, Guo W, Bandyopadhyay S, Sen GC. Enzymatic activity of 2’-5’-oligoadenylate
synthetase is impaired by specific mutations that affect oligomerization of the protein. J Biol Chem.
1997; 272(52):33220–6. PMID: 9407111
74. Mullan PB, Hosey AM, Buckley NE, Quinn JE, Kennedy RD, Johnston PG, et al. The 2,5 oligoadeny-
late synthetase/RNaseL pathway is a novel effector of BRCA1- and interferon-gamma-mediated apo-
ptosis. Oncogene. 2005; 24(35):5492–501. https://doi.org/10.1038/sj.onc.1208698 PMID: 15940267
75. Ghosh A, Sarkar SN, Rowe TM, Sen GC. A specific isozyme of 2’-5’ oligoadenylate synthetase is a
dual function proapoptotic protein of the Bcl-2 family. J Biol Chem. 2001; 276(27):25447–55. https://
doi.org/10.1074/jbc.M100496200 PMID: 11323417
76. Jauharoh SN, Saegusa J, Sugimoto T, Ardianto B, Kasagi S, Sugiyama D, et al. SS-A/Ro52 promotes
apoptosis by regulating Bcl-2 production. Biochem Biophys Res Commun. 2012; 417(1):582–7.
https://doi.org/10.1016/j.bbrc.2011.12.010 PMID: 22178074
77. Kamachi M, Kawakami A, Yamasaki S, Hida A, Nakashima T, Nakamura H, et al. Regulation of apo-
ptotic cell death by cytokines in a human salivary gland cell line: distinct and synergistic mechanisms
in apoptosis induced by tumor necrosis factor alpha and interferon gamma. J Lab Clin Med. 2002; 139
(1):13–9. PMID: 11873240
78. Rogozin IB, Aravind L, Koonin EV. Differential action of natural selection on the N and C-terminal
domains of 2’-5’ oligoadenylate synthetases and the potential nuclease function of the C-terminal
domain. J Mol Biol. 2003; 326(5):1449–61. PMID: 12595257
79. O’Brien M, Lonergan R, Costelloe L, O’Rourke K, Fletcher JM, Kinsella K, et al. OAS1: a multiple scle-
rosis susceptibility gene that influences disease severity. Neurology. 2010; 75(5):411–8. https://doi.
org/10.1212/WNL.0b013e3181ebdd2b PMID: 20679634
80. Consortium GT. The Genotype-Tissue Expression (GTEx) project. Nat Genet. 2013; 45(6):580–5.
https://doi.org/10.1038/ng.2653 PMID: 23715323
81. Field LL, Bonnevie-Nielsen V, Pociot F, Lu S, Nielsen TB, Beck-Nielsen H. OAS1 splice site polymor-
phism controlling antiviral enzyme activity influences susceptibility to type 1 diabetes. Diabetes. 2005;
54(5):1588–91. PMID: 15855350
Variant that affects OAS1 splicing associates with Sjogren’s syndrome
PLOS Genetics | https://doi.org/10.1371/journal.pgen.1006820 June 22, 2017 27 / 29
82. Miceli-Richard C, Gestermann N, Simoneta F, Boudaoud S, Nocturne G, Lecluze Y, et al. Interleukin
12 Is Involved in an Interferon Type I Signature Through Crosstalk of CD4+ T Cells and Plasmacytoid
Dendritic Cells. Arthritis Rheum. 2012; 64:Abstract 2321.
83. Cho SS, Bacon CM, Sudarshan C, Rees RC, Finbloom D, Pine R, et al. Activation of STAT4 by IL-12
and IFN-alpha: evidence for the involvement of ligand-induced tyrosine and serine phosphorylation. J
Immunol. 1996; 157(11):4781–9. PMID: 8943379
84. Nguyen KB, Watford WT, Salomon R, Hofmann SR, Pien GC, Morinobu A, et al. Critical role for
STAT4 activation by type 1 interferons in the interferon-gamma response to viral infection. Science.
2002; 297(5589):2063–6. https://doi.org/10.1126/science.1074900 PMID: 12242445
85. Lawless VA, Zhang S, Ozes ON, Bruns HA, Oldham I, Hoey T, et al. Stat4 regulates multiple compo-
nents of IFN-gamma-inducing signaling pathways. J Immunol. 2000; 165(12):6803–8. PMID:
11120802
86. Barnes BJ, Moore PA, Pitha PM. Virus-specific activation of a novel interferon regulatory factor, IRF-
5, results in the induction of distinct interferon alpha genes. J Biol Chem. 2001; 276(26):23382–90.
https://doi.org/10.1074/jbc.M101216200 PMID: 11303025
87. Westra H-J, Peters MJ, Esko T, Yaghootkar H, Schurmann C, Kettunen J, et al. Systematic identifica-
tion of trans eQTLs as putative drivers of known disease associations. Nat Genet. 2013; 45(10):1238–
43. https://doi.org/10.1038/ng.2756 PMID: 24013639
88. Pickrell JK, Marioni JC, Pai AA, Degner JF, Engelhardt BE, Nkadori E, et al. Understanding mecha-
nisms underlying human gene expression variation with RNA sequencing. Nature. 2010; 464
(7289):768–72. https://doi.org/10.1038/nature08872 PMID: 20220758
89. Fairfax BP, Humburg P, Makino S, Naranbhai V, Wong D, Lau E, et al. Innate immune activity condi-
tions the effect of regulatory variants upon monocyte gene expression. Science. 2014; 343
(6175):1246949. https://doi.org/10.1126/science.1246949 PMID: 24604202
90. Rasmussen A, Ice JA, Li H, Grundahl K, Kelly JA, Radfar L, et al. Comparison of the American-Euro-
pean Consensus Group Sjogren’s syndrome classification criteria to newly proposed American Col-
lege of Rheumatology criteria in a large, carefully characterised sicca cohort. Ann Rheum Dis. 2014;
73(1):31–8. https://doi.org/10.1136/annrheumdis-2013-203845 PMID: 23968620
91. Purcell S, Neale B, Todd-Brown K, Thomas L, Ferreira MA, Bender D, et al. PLINK: a tool set for
whole-genome association and population-based linkage analyses. Am J Hum Genet. 2007; 81
(3):559–75. https://doi.org/10.1086/519795 PMID: 17701901
92. Kauffmann A, Gentleman R, Huber W. arrayQualityMetrics—a bioconductor package for quality
assessment of microarray data. Bioinformatics. 2009; 25(3):415–6. https://doi.org/10.1093/
bioinformatics/btn647 PMID: 19106121
93. Barbosa-Morais NL, Dunning MJ, Samarajiwa SA, Darot JF, Ritchie ME, Lynch AG, et al. A re-annota-
tion pipeline for Illumina BeadArrays: improving the interpretation of gene expression data. Nucleic
Acids Res. 2010; 38(3):e17. https://doi.org/10.1093/nar/gkp942 PMID: 19923232
94. Irizarry RA, Hobbs B, Collin F, Beazer-Barclay YD, Antonellis KJ, Scherf U, et al. Exploration, normali-
zation, and summaries of high density oligonucleotide array probe level data. Biostatistics. 2003; 4
(2):249–64. https://doi.org/10.1093/biostatistics/4.2.249 PMID: 12925520
95. Johnson WE, Li C, Rabinovic A. Adjusting batch effects in microarray expression data using empirical
Bayes methods. Biostatistics. 2007; 8(1):118–27. https://doi.org/10.1093/biostatistics/kxj037 PMID:
16632515
96. de Hoon MJ, Imoto S, Nolan J, Miyano S. Open source clustering software. Bioinformatics. 2004; 20
(9):1453–4. https://doi.org/10.1093/bioinformatics/bth078 PMID: 14871861
97. Saldanha AJ. Java Treeview—extensible visualization of microarray data. Bioinformatics. 2004; 20
(17):3246–8. https://doi.org/10.1093/bioinformatics/bth349 PMID: 15180930
98. International HapMap Consortium, Frazer KA, Ballinger DG, Cox DR, Hinds DA, Stuve LL, et al. A sec-
ond generation human haplotype map of over 3.1 million SNPs. Nature. 2007; 449(7164):851–61.
https://doi.org/10.1038/nature06258 PMID: 17943122
99. Howie BN, Donnelly P, Marchini J. A flexible and accurate genotype imputation method for the next
generation of genome-wide association studies. PLoS Genet. 2009; 5(6):e1000529. https://doi.org/
10.1371/journal.pgen.1000529 PMID: 19543373
100. Via M, Gignoux C, Burchard EG. The 1000 Genomes Project: new opportunities for research and
social challenges. Genome Med. 2010; 2(1):3. https://doi.org/10.1186/gm124 PMID: 20193048
101. Price AL, Patterson NJ, Plenge RM, Weinblatt ME, Shadick NA, Reich D. Principal components analy-
sis corrects for stratification in genome-wide association studies. Nat Genet. 2006; 38(8):904–9.
https://doi.org/10.1038/ng1847 PMID: 16862161
Variant that affects OAS1 splicing associates with Sjogren’s syndrome
PLOS Genetics | https://doi.org/10.1371/journal.pgen.1006820 June 22, 2017 28 / 29
102. McKeigue PM, Carpenter JR, Parra EJ, Shriver MD. Estimation of admixture and detection of linkage
in admixed populations by a Bayesian approach: application to African-American populations. Ann
Hum Genet. 2000; 64(Pt 2):171–86. https://doi.org/10.1017/S0003480000008022 PMID: 11246470
103. Halder I, Shriver M, Thomas M, Fernandez JR, Frudakis T. A panel of ancestry informative markers
for estimating individual biogeographical ancestry and admixture from four continents: utility and appli-
cations. Hum Mutat. 2008; 29(5):648–58. https://doi.org/10.1002/humu.20695 PMID: 18286470
104. Cattell RB. The Scree test for the number of factors. Multivariate Behav Res. 1966; 1(2):245–76.
https://doi.org/10.1207/s15327906mbr0102_10 PMID: 26828106
105. Willer CJ, Li Y, Abecasis GR. METAL: fast and efficient meta-analysis of genomewide association
scans. Bioinformatics. 2010; 26(17):2190–1. https://doi.org/10.1093/bioinformatics/btq340 PMID:
20616382
106. Barrett JC, Fry B, Maller J, Daly MJ. Haploview: analysis and visualization of LD and haplotype maps.
Bioinformatics. 2005; 21(2):263–5. https://doi.org/10.1093/bioinformatics/bth457 PMID: 15297300
107. Shabalin AA. Matrix eQTL: ultra fast eQTL analysis via large matrix operations. Bioinformatics. 2012;
28(10):1353–8. https://doi.org/10.1093/bioinformatics/bts163 PMID: 22492648
108. Stegle O, Parts L, Durbin R, Winn J. A Bayesian framework to account for complex non-genetic factors
in gene expression levels greatly increases power in eQTL studies. PLoS Comput Biol. 2010; 6(5):
e1000770. https://doi.org/10.1371/journal.pcbi.1000770 PMID: 20463871
109. Anders S, Huber W. Differential expression analysis for sequence count data. Genome Biol. 2010; 11
(10):R106. https://doi.org/10.1186/gb-2010-11-10-r106 PMID: 20979621
110. Thorvaldsdottir H, Robinson JT, Mesirov JP. Integrative Genomics Viewer (IGV): high-performance
genomics data visualization and exploration. Brief Bioinform. 2013; 14(2):178–92. https://doi.org/10.
1093/bib/bbs017 PMID: 22517427
111. Schulze-Koops H. Lymphopenia and autoimmune diseases. Arthritis Res Ther. 2004; 6(4):178–80.
https://doi.org/10.1186/ar1208 PMID: 15225363
112. Le Campion A, Gagnerault MC, Auffray C, Becourt C, Poitrasson-Riviere M, Lallemand E, et al. Lym-
phopenia-induced spontaneous T-cell proliferation as a cofactor for autoimmune disease develop-
ment. Blood. 2009; 114(9):1784–93. https://doi.org/10.1182/blood-2008-12-192120 PMID: 19561321
113. Zhang N, Bevan MJ. TGF-beta signaling to T cells inhibits autoimmunity during lymphopenia-driven
proliferation. Nat Immunol. 2012; 13(7):667–73. https://doi.org/10.1038/ni.2319 PMID: 22634866
Variant that affects OAS1 splicing associates with Sjogren’s syndrome
PLOS Genetics | https://doi.org/10.1371/journal.pgen.1006820 June 22, 2017 29 / 29