Embed Size (px)
Citation preview

KINETICS OF MUTATION INDUCTION BY ULTRAVIOLET LIGHT IN EXCISION-DEFICIENT YEAST
FRIEDERIKE ECKARDT* AND R. H. HAYNES
Department of Biology, York University, Toronto, Canada M3.l lP3
Manuscript received August 13, 1976 Revised copy received November 5, 1976
ABSTRACT
We have measured the frequency of UV-induced reversions (locus plus sup- pressor) for the ochre alleles ade2-I and lys2-I and forward mutations ( d e 2 adex double auxotrophs) in an excision-deficient strain of Saccharomyces cereviyiae (rad2-20). For very low UV doses, both mutational systems exhibit linear induction kinetics. However, as the dose increases, a strikingly different response is observed: in the selective reversion system a transition to higher order induction kinetics occurs near 9 ergs/mm2 (25% survival), whereas in the nonselective forward system the mutation frequency passes through a maxi- mum near 14 ergs/mm2 (4.4% survival) and then declines. This contrast in kinetics cannot be explained in any straightforward way by current models of induced mutagenesis, which have been developed primarily on the basis of bac- terial data. The bacterial models are designed to accommodate the quadratic induction kinetics that are frequently observed in these systems. We have derived a mathematical expression for mutation frequency that enables us to fit both the forward and reversion data on the assumptions that mutagenesis is basically a “single event” Poisson process, and that mutation and killing are not necessarily independent of one another. In particular, the dose-response relations are consistent with the idea that the sensitivity of the revertants is about 25% less than that of the original cell population, whereas the sensitivity of the forward mutants is about 29% greater than the population average. We argue that this relatively small differential sensitivity of mutant and non- mutant cells is associated with events that take place during mutation expres- sion and clonal growth.
INDUCED mutagenesis in microorganisms is a complex, multi-step process initiated by physicochemical attack on cells by radiations or chemical muta-
gens to form various types of stable premutational lesions in DNA. W-induced pyrimidine dimers are a well-known class of such lesions. Normally a large frac- tion of these dimers, which are also potentially lethal, are removed soon after irradiation by some mode of “error-free” DNA repair. Premuta tional lesions which escape error-free repair may undergo a process of fixation or conversion to informationally altered DNA base sequences, presumably through some mode of error-prone repair and/or recombination for which replication or pratein syn- thesis may be required. Expression of the mutant base sequence is initiated by
* Present address Department of Biology, Free University of Berlin, D 1000 Berlin 33, Habelschwerdter Allee 30, Germany
Genetics 85: 225-247 February, 1977
Dow
nloaded from https://academ
ic.oup.com/genetics/article/85/2/225/5991872 by guest on 17 February 2022
226 F. ECKARDT AND R. H. HAYNES
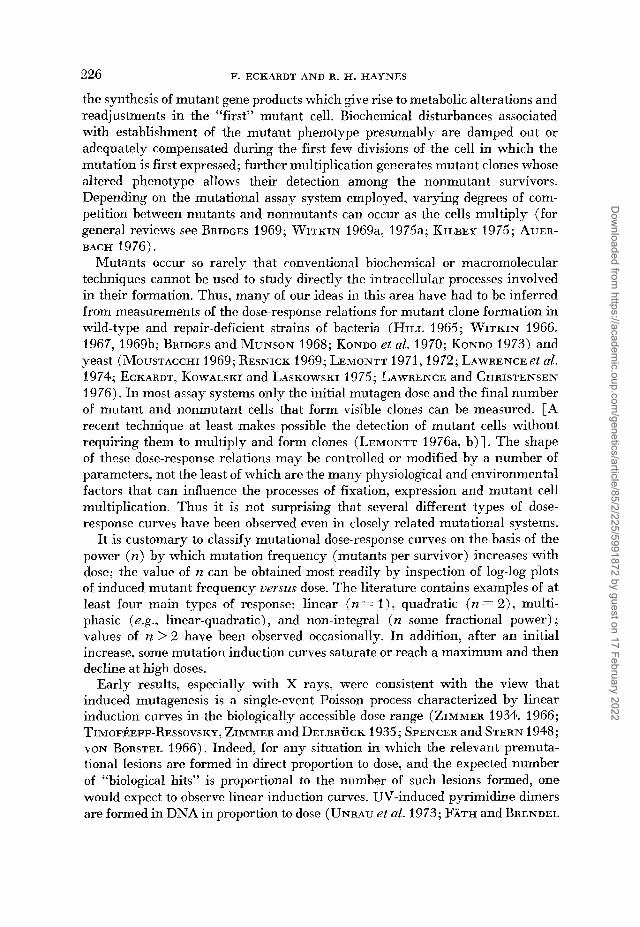
the synthesis of mutant gene products which give rise to metabolic alterations and readjustments in the “first” mutant cell. Biochemical disturbances associated with establishment of the mutant phenotype presumably are damped out or adequately compensated during the first few divisions of the cell in which the mutation is first expressed; further multiplication generates mutant clones whose altered phenotype allows their detection among the nonmutant survivors. Depending on the mutational assay system employed, varying degrees of com- petition between mutants and nonmutants can occur as the cells multiply (for general reviews see BRIDGES 1969; WITKIN 1969a, 1975a; KILBEY 1975; AUER- BACH 1976).
Mutants occur so rarely that conventional biochemical or macromolecular techniques cannot be used to study directly the intracellular processes involved in their formation. Thus, many of our ideas ic this area have had to be inferred from measurements of the dose-response relations for mutant clone formation in wild-type and repair-deficient strains of bacteria (HILL 1965; WITKIN 1966, 1967, 1969b; BRIDGES and MUNSON 1968; KONDO et al. 1970; KONDO 1973) and yeast (MOUSTACCHI 1969; RESNICK 1969; LEMONTT 1971,1972; LAWRENCE& d. 3 974; ECKARDT, KOWALSKI and LASKOWSKI 1975; LAWRENCE and CHRISTENSEN 1976). In most assay systems only the initial mutagen dose and the final number of mutant and nonmutant cells that form visible clones can be measured. [A recent technique at least makes possible the detection of mutant cells without requiring them to multiply and form clones (LEntoNTT 1976a, b)]. The shape of these dose-response relations may be controlled or modified by a number of parameters, not the least of which are the many physiological and environmental factors that can influence the processes of fixation, expression and mutant cell multiplication. Thus it is not surprising that several different types of dose- response curves have been observed even in closely related mutational systems.
It is customary to classify mutational dose-response curves on the basis of the power ( n ) by which mutation frequency (mutants per survivor) increases with dose; the value of ra can be obtained most readily by inspection of log-log plots of induced mutant frequency uersus dose. The literature contains examples of at least four main types of response: linear ( n = 1). quadratic ( n = 2) , multi- phasic (e.g., linear-quadratic) , and non-integral ( n some fractional power) ; values of IZ > 2 have been observed occasionally. In addition, after an initial increase, some mutation induction curves saturate or reach a maximum and then decline at high doses.
Early results, especially with X rays, were consistent with the view that induced mutagenesis is a single-event Poisson process characterized by linear induction curves in the biologically accessible dose range (ZIMMER 1934, 1966; TIMOF~EFF-RESSOVSKY, ZIMMER and DELBRUCK 1935 ; SPENCER and STERN 1948; VON BORSTEL 1966). Indeed, for any situation in which the relevant premuta- tional lesions are formed in direct proportion to dose, and the expected number of “biological hits” is proportional to the number of such lesions formed, one would expect to observe linear induction curves. UV-induced pyrimidine dimers are formed in DNA in proportion to dose (UNRAU et al. 1973; FATH and BRENDEL
Dow
nloaded from https://academ
ic.oup.com/genetics/article/85/2/225/5991872 by guest on 17 February 2022

KINETICS O F INDUCED MUTAGENESIS 22 7
1975) and linear induction kinetics for UV mutagenesis have been reported in a number of systems (DEMEREC 1951; NOVICK 1955; DRAKE 1966; BRIDGES and HUCKLE 1970; CLEAVER 1976).
In recent years, however, quadratic (“dose-squared”) induction curves have been reported frequently for UV mutagenesis in E. coli (BRIDGES, DENNIS and MUNSON 1967; WITKIN and GEORGE 1973; WITKIN 1974; DOUBLEDAY, BRIDGES and GREEN 1975; SKAVRONSKAYA and SMIRNOV 1975) and yeast (LAWRENCE et al. 1974). If it is assumed that quadratic kinetics reveal the nature of the initial steps in the mutational pathway, then at least three ‘Ltwo-event” processes could be imagined to be at work at the level of premutational-lesion formation and fixa- tion (BRIDGES 1975). First, there are models that postulate the interaction or cooperation of two lesions (DOUDNEY and YOUNG 1962; BRIDGES 1966; MENNIG- MANN 1972; DOUDNEY 1975) or the overlap of two repair events (BRESLER 1975; BRESLER et al. 1975; SEDGWICK 1975a) to prcduce the mutant base sequence. The second postulates an enhanced inhibition of error-free, as compared with error- prone, repair as dose increases, thereby increasing the relative number of pre- mutational lesions available for fixation (BRIDGES 1975). The third postulates a requirement for two pyrimidine dimers, one to serve as a premutational lesion, the other to stimulate induction of the error-prone repair system (the ‘Lone lesion 4- SOS induction” hypothesis) (WITKIN and GEORGE 1973; RADMAN 1974; WITKIN 1974,1975b). Recently, biochemical experiments have strengthened the plausibility of the repair-induction hypothesis in E. coli ( GUDAS and PARDEE 1975; SEDGWICK 197513, c) and evidence indicating the existence of possibly related processes in Ustilago (HOLLIDAY 1971, 1975) has also appeared; so far no direct evidence for UV-induced repair in yeast has been reported.
From a theoretical standpoint the above suggestions are limited by one problem in common: as presented they account only for quadratic induction curves. Dif- ferent assumptions must be made to explain the more complex responses that have also been reported in microorganisms. First, curves which rise with values of n between one and two have been found (AUERBACH and RAMSAY 1968; CHANG, LENNOX and TUVESON 1968; DAVIES and LEVIN 1968). Second, biphasic, linear-quadratic curves have been reported for certain E. coli mutants ( WITKIN and GEORGE 1973; WITKIN 1974,1975a) and, in at least one instance, for a wild- type strain (BRIDGES, MOTTERSHIELD and COLLELA 1973) ; similar biphasic kinet- ics have been described in yeast (ECKARDT 1974; ECKARDT and HAYNES 1976) and can be read out of data reported for radiation-sensitive diploid strains (LAW- RENCE and CHRISTENSEN 1976). Third, biphasic curves which rise linearly to a maximum and decline at high doses have been found for bacteria (KAPLAN 1956) and yeast (ABBANDANDOLO and SIMI 1971; HANNAN, DUCK and NASIM 1976; ECKARDT and HAYNES 1977). Curves of this latter type are particularly difficult to explain on the basis of any of the above-mentioned hypotheses.
We are faced with the question of whether these different kinetic patterns reflect diff erent molecular mechanisms at the level of premutational lesion formation and fixation, as seems to be assumed in the models described above; or whether they might be attributed to various metabolic and other factors which
Dow
nloaded from https://academ
ic.oup.com/genetics/article/85/2/225/5991872 by guest on 17 February 2022

228 F. ECKARDT A N D R. H. H A Y N E S
come into play during expression and clonal growth, to modify what is basically a linear induction process. This latter possibility has been raised by SWANSON (1955) and discussed at length by AUERBACH and RAMSAY (1968) , AUERBACH and KILBEY (1971) and AUERBACH (1976), who cite instances in which the genetic background of particular strains and the conditions of irradiation and growth, among other factors, influence the shape of the mutational dose-response curves. Factors which act on the level of expression and cell multiplication to influence the probability of mutant clone formation might be expected to lead to different survival probabilities for mutant and nonmutant cells. On this basis, mutation and killing cannot be regarded as statistically independent processes, and any mathematical treatment of mutational dose-response curves should be general enough to take account of this possibility. In this paper we present such an analysis for the theoretically simple case of UV-induced mutagenesis in excision-deficient strains of yeast.
We measured mutation induction frequencies for certain nutritional markers in a haploid excision-deficient (rad2) strain of Saccharomyces cereuisiae over a rather wide range of cell survival. We used a selective reversion system in which we scored locus and suppressor mutants of the ochre alleles ade2-l and lys2-1, as well as a nonselective forward system in which we scored ade2 adex double auxotrophs. Two essentially opposite types of induction curves were found in this one strain: biphasic linear-quadratic curves were obtained with the selective reversion systems, but linear induction curves rising to a maximum were found in the nonselective forward system. Qualitatively similar data, to be reported later, were obtained in RAD wild-type strains. These results led to our derivation of a general equation for induced mutation frequency as a function of dose based 011 the assumption that mutation and killing need not be independent processes. The equation provides a good fit for the two types of induction curves found in our experiments. More particularly. it emphasize; that in addition to modifying factors which work at the level of mutagenic lesion formation and fixation, account must be taken of those which act during expression and cell multiplica- tion. We conclude that these latter factors may be more important determinants of mutation frequencies than has hitherto been realized.
MATERIALS A N D METHODS
Strain: Saccharomyces cereuisiae haploid strain 2105-15, originally constructed by S . KOWAL- SKI (1971), was used in all experiments reported here. Its genotype is (a, ade2-2, Zys2-2, hk3, ural, rad2-20). The reversion experiments were carried out in Berlin (ECKARDT 1974), whereas the forward mutation experiments were carried out in Toronto in 1976. The UV LD,, expo- sure dose for this strain as measured in Berlin was 6.2 ergs/mmZ; in Toronto it proved to he 4.0 ergs/mmz (Figure 1). We attribute this difference in UV sensitivity primarily to the dif- ferent techniques of UV exposure and dosimetry used in the two laboratories, although slight biological differences among the clones used as stock cultures cannot be excluded.
Media: The following media were employed: YPD: 1% yeast extract, 2% peptone, 2% dex- trose, 2% agar (all Difco); YPD,,: similar to YPD but having 10% rather than 2% dextrose; MM: a minimal synthetic medium composed of 0.67% yeast nitrogen base without amino acids, 2% agar (all Difco), with the addition of the following substances (given in the final concen-
Dow
nloaded from https://academ
ic.oup.com/genetics/article/85/2/225/5991872 by guest on 17 February 2022

KINETICS OF INDUCED MUTAGENESIS 229
F
2-20
IO 20 30 40 50 U v DOSE (ergs/mm2/
FIGURE 1.-UV survival curve for the haploid rad2-20 strain of S. cerevisiae used in the for- ward mutation measurements reported here; the points are average values from four independent experiments. The LD,, dose for this strain as measured in Toronto is 4 ergs/mm2. Different samples of the same strain used in the reversion experiments carried out in Berlin had an LD,, dose of 6.2 ergd-2.
tration) 10 mg/l adenine, 50 mg/l lysine-HC1, 10 mgJl histidine-HCl, 10 mg/l uracil; omission media: MM-ade or MM-lys, minimal synthetic medium minus adenine or lysine, respectively (used in scoring revertants).
Prepmation of cell suspensions: Cells were grown on YPD agar for 4-6 days to stationary phase; they were then washed off the agar, spun down at 3000 rpm for 3 minutes, and washed twice by centrifugation at 1000 rpm for 2.5 minutes; the top 3-5 ml of this latter suspension was retained for experimental use. The cell suspensions always contained fewer than 5% double cells. In the reversion experiments, the cells were sonicated for 30 seconds with a Branson sonifier S 75 immediately after being washed off the agar to enhance further the fraction of single cells; no cell killing or significant change in survival curve shape is caused by this treatment, although the magnitude of the resistant “tail” is reduced.
Irradiation: In Berlin, a low pressure mercury vapor lamp HNS 12 (Osram) was used; the dose rate incident on the cell suspensions was measured as 4.0 ergs/mm2 per second with the dosimeter constructed by SCHAARSCHMIDT (1970). In Toronto, a GE 15 watt germicidal lamp was used; the incident dose rate was adjusted t o either 1.14 or 0.57 ergsJmm2 per second as measured with a Latarjet dosimeter calibrated in Paris. All experiments were carried out under yellow light to avoid photoreactivation, and the cell suspensions were agitated during irradiation.
Reversion experiments: The reversion experiments were carried out using the ochre alleles
Dow
nloaded from https://academ
ic.oup.com/genetics/article/85/2/225/5991872 by guest on 17 February 2022

230 F. ECKARDT A N D R. H. H A Y N E S
ade2-I and Zys2-I. A detailed description of the assay procedures used to measure reversions has already been published (ECKARDT, KOWALSKI and LASKOWSKI 1975), and only the main points are summarized here. 4-ml suspensions of 108 stationary phase cells per ml were irradiated with various UV doses. Adenine and lysine revertants were scored on omission media (107 cells per plate; 5-10 plates per point) whereas survivors, appropriately diluted after irradiation according to the expected yield of viable clones, were scored on MM medium (3 plates per point). The plates were incubated for 7 days at 30”. Unlike bacteria, a period of growth on supplemented medium immediately after irradiation is not found to be necessary in yeast for expression of UV-induced revertants; the reason for this difference in mutational response is not known.
The effective dose received by cells in a suspension of 108 per ml is less than the physically measured dose because of the cell “shading effect” in such moderately concentrated suspensions. We corrected for the shading effect according to the method of HAEFNER and LASKOWSKI (1963). Under our experimental conditions the effect is negligible for suspensions of 105 cells per ml or less. Therefore, we measured survival curves for suspensions of l o 5 as well as 108 cells per ml on MM medium in all experiments. For each level of survival, a dose-modifying factor for the shading effect was obtained from these two curves and applied to the physically measured dose corresponding to each reversion frequency. Shading effects can be avoided by the more laborious procedure of irradiating the cells on plates The validity and accuracy of our shading effect cor- rection was confirmed by measuring a few induction curves on plates.
Forward experiments: The forward-mutation system first established by ROMAN (1956) makes use of the red pigmentation of ade2 clones and allows scoring of mutations in any one of the six genes which precede the ade2 gene in the adenine pathway (WOODS and JACKSON 1973). The double auxotrophs appear as white clones. Suspensions appropriately diluted to yield 300 clones per plate were irradiated, plated on YPD,, and incubated at 30” for five days. The maximum titer used was 10s cells per ml for which the dose-modifying factor for shading is only 1.10. The total number of surviving clones for each dose was counted, together with the number of white mutant colonies (pure plus sectored clones) among the survivors. Since ADE+ proto- trophs and ade2 petites also produce white colonies, appropriate scoring procedures were adopted to eliminate such clones from the count of forward (ade.2 adez) white double auxotrophs. A more detailed description of these techniques is published elsewhere (ECKARDT and HAYNES 1977).
Calculation of induced mutation frequencies: In order to obtain a correct estimate of the induced mutation frequency, the contribution of surviving spontaneous mutants from the initially irradiated suspension must be subtracted from the actual mutant count. Thus, the induced mutation frequency M for each UV dose z was calculated from the formula,
where N , and N , are, respectively, the number of induced mutants and the number of survivors for any dose z; N,, is the number of mutant colonies actually counted at dose z; N,, is the num- ber of spontaneous mutants; and N o is the number of viable cells in the initial unirradiated suspension.
THEORY
Consider a homogeneous suspension of No single, initially viable cells (or macrocolony-forming units) per unit volume that is uniformly irradiated with various incident UV doses, z (ergs/mmz). After each UV dose, every cell in the irradiated population is scored either as a mutant or a nonmutant, and also as a survivor or a nonsurvivor. To be detected, a mutant must also be a survivor. Because of the all-or-none character of the end-points scored, single-event Poisson statistics are applicable to the calculation of both mutation and survival. We assume that the primary lethal or mutational lesions (e.g. , pyrimidine dimers in
Dow
nloaded from https://academ
ic.oup.com/genetics/article/85/2/225/5991872 by guest on 17 February 2022

KINETICS OF I N D U C E D MUTAGENESIS 23 1
DNA) accumulate independently and at random in the relevant macromolecular targets in direct proportion to dose. On this basis we can derive formal mathemati- cal expressions for two related quantities, the induced mutant frequency (mutants per survivor) and the yield of mutants per cell plated. In this paper we consider only the case of repair-deficient mutants with essentially exponential survival curves such as those found for most excision-deficient mutants of S. cerevisiae. This enables us to introduce the simplifying assumption that the sensitivity of the cells to killing is a constant independent of dose.
Using the symbols introduced above, the surviving fraction of cells is given by S(z) = N, /N, , the induced mutant frequency is M ( x ) = N,/N,, and the yield of induced mutants per cell plated is Y (x) ="/No, where N , is corrected for the number of surviving spontaneous mutants initially present in the suspension (equation 1). Note that Y ( x ) = M ( x ) .S(z).
Let k be the sensitivity to killing and m be the sensitivity to UV-induced muta- tion of the cells; let k, be the sensitivity of those cells that ultimately form induced mutant clones. For excision-deficient strains with exponential survival curves, k is a constant independent of dose, and we assume that k, is also a constant for any given strain, mutational locus and assay procedure. If mutation and killing are statistically independent processes, then k, = k (ENGELBERG 1962). However, here we wish to consider a more general case in which km is not necessarily equal to k, that is, the expression and/or detection of mutation and lethality are allowed to be dependent upon one another. On the basis of these assumptions we can write the following probabilities:
(i) (ii) (iG) Probability of an induced mutant surviving = e-k.." The probability of actually detecting a mutant is the joint prolbability of muta-
tion and survival which, from (ii) and (iii) is given by e-k"(l - cmZ). Thus, the induced mutation frequency can be written in the form,
Probability of survival of a typical non-mutant cell = e-kx Probability of mutation = I-e-nzz
The number of mutants is always a small fraction of the number of survivors in the experimentally accessible dose rsnge, and so no significant error is introduced by expressing the total number of sur?rivors (nonmutants plus mutants) in the form N o e*. If we denote the ratio of the mutant to Eonmutant sensitivities to killing by the parameter 6 = k,/k, then equation (2) can be rewritten in the form
M ( 2 ) = g(l-G)Rz(l-e*s) ( 3 )
If the mutant and nonmutant sensitivities are identical ( k , = k, or 6 = 1) then the induced mutation frequency is given simply by
M(s;6=1) = I-eaz = mx - m2z2J2 + . . . (4)
For the very low mutant frequencies that normally occur (mz<<l) one would
Dow
nloaded from https://academ
ic.oup.com/genetics/article/85/2/225/5991872 by guest on 17 February 2022

232 F. ECKARDT AND R. H. HATNES
not expect to observe any departure from linear induction kinetics because the quadratic and higher order terms in equation (4) remain vanishingly small at the highest UV exposures that can be employed experimentally. However, departures from linearity frequently are observed and such departures can arise in two, not mutually exclusive, ways: (i) mutant and nonmutant cells might have different probabilities of survival (6 # 1 ) ; and/or (ii) cell mutability might be dose-dependent, that is, m may not be a constant. As reported in this paper and elsewhere, both pmitiue and negatiue departures from linearity are observed. A positive departure from linearity means that M ( x ) increases at a rate greater than the first power of dose; a negative departure from linearity means that M ( x ) changes at a rate less than the first power of dose. From equation ( 3 ) it can be shown that positive departures arise if 6 < 1 and/or if m increases with dose; negative departures arise if S > 1 and/or if m decreases with dose.
The way in which the parameters 6 and m can affect the shape of mutation induction curves may be seen by writing out the first few terms of the power series expansion of equation (3) , viz.,
M ( x ) = [l + (1-6)kz + . . .] [mx - m2x2/2 + . . .] Neglecting cubic and higher order terms we have,
M ( x ) = mx + (1-6) mkx2 - m2x2/2 + . . . The third term on the right hand side of equation (6) is small in comparison with the second since normally mx < < 1 and m < < k.
On the basis of equation (6) with constant m, mutation induction is linear at sufficiently low doses, but as dose increases the curves depart either positively or negatively from linearity accordingly as 6 is less or greater than unity. This behavior is shown in Figure 2. The curves were calculated from equation ( 3 ) for m = 10+ (ergs/mm2)-l and k = 0.1 (ergs/mm2)-l. Normalization to other typical m / k ratios does not affect the general shape of these curves. The curve for 6 = 1 remains sensibly linear on such a log-log plot for all values of M (z) up to and even beyond frequencies of 10-l. It is important to note that if the mutants are as little as 10% more or less sensitive than the nonmutants ( 6 = 1.1 or 0.9) , even this small percentage shift from unity in the value of 6 can produce dramatic changes in the magnitude and dose-dependence of the induced mutation frequency.
For the case 6 < 1 it is clear from equation (6) and Figure 2 that the induction curves first rise linearly with dose, then become quadratic, and ultimately increase at even greater powers of dose as the cubic and higher order terms con- taining m and k become significant. An arbitrary but graphically convenient definition of the transition from linear to quadratic kinetics is the dose, on a plot of log M uersus log x, at which the extrapolated linear portion of the curve intersects the line tangent to the curve at the point of slope 2. Determining d M / d x from equation 3 and solving d(log M)/d(log x ) = ( z / M ) d M / d z = 2 for x (with approximations suitable to n << 1) yields the dose corresponding to the point
Dow
nloaded from https://academ
ic.oup.com/genetics/article/85/2/225/5991872 by guest on 17 February 2022

KINETICS O F INDUCED MUTAGENESIS 233
uv DOSE (ergs/mm2)
FIGURE 2.-Theoretical induced mutation frequency curves, M (z), calculated from equation (3) for m = 10-6 and k = 0.1 (ergs/mmZ)-' for various values of 6. The curve for 6 = 1 saturates as M ( z ) + 1. The curves for 6 > I lie below those for 6 < 1 merely because a single, fixed value of m was used to calculate all curves.
on the curve of slope 2, namely r= 1/(1- 6)k . I t is then simple to determine that the two straight lines intersect at log xt = -log( 1 - 6) ke, so that
1 k( l -S )e
xt ==
0.53 m M t = mxtQ/e ___- ( 1 . - S ) k
where xt is the 'transition-point' dose and M t is the induced mutant frequency a t this dose. (&It is determined from equation 3, not equation 6; see Appendix for further details.) For sufficiently small values of 6 the position of the transi- tion point could be low enough for the linear region to escape detection experimentally.
For the case -6 > 1, induction also begins linearly but reaches a maximum which can be determined from equation 3 to be
m M,,, =: mx,,, t+ = k(6-1)e
Dow
nloaded from https://academ
ic.oup.com/genetics/article/85/2/225/5991872 by guest on 17 February 2022

234 F. ECKARDT A N D R. H. H A Y N E S
These formulae allow rough estimates of the values of m and 6 to be made if k and the position of M,,, are known.
If 6 = 1, departures from linearity could be associated with dose-dependent changes in m. Indeed, curves identical to those shown in Figure 2 can be gen- erated by assuming that m increases exponentially with dose for positive depar- tures from linearity or that m decreases exponentially with dose for negative departures from linearity.
If mutation induction is, for whatever reason, a ‘two-event’ process and 6 = 1, then induction curves should have no linear region, even at the lowest UV doses, and they should depart (negatively) from a quadratic dose dependence near the Poissonian asymptote as M ( z ) 3 1 ; under these circumstances, additional assumptions would be required to account for induction curves with maxima such as those associated with values of 6 > 1.
RESULTS
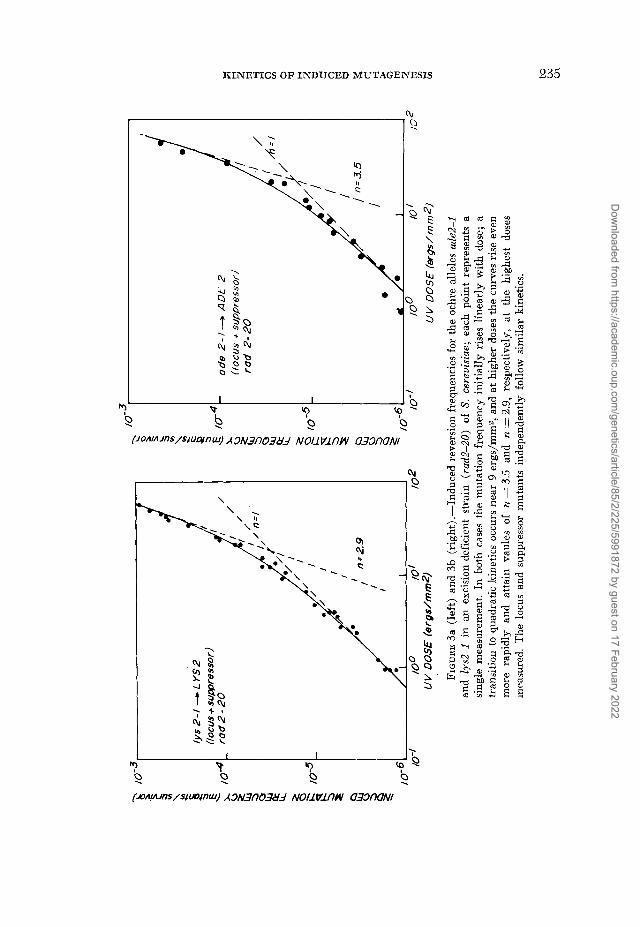
Log-log plots of our measurements of UV-induced reversion (locus plus sup- pressor) frequencies for the ochre alleles ade2-I and Zys2-I are shown in Figure 3a, b; a similar plot of the total forward (pure plus sectored clones) frequency of ade2-1 adex double auxotrophs is shown in Figure 4. For very low doses, muta- tion induction frequencies in all three systems increase linearly with dose. Beyond this initial region, the reversion frequencies rise more rapidly than the first power of dose, and for the highest doses measured n attains approximate values of 3.5 and 2.9 for the adenine and lysine revertants, respectively. The for- ward mutation results reveal an essentially opposite type of response: after the initial linear increase the curve approaches a maximum, and finally declines at high doses.
The curves drawn in Figures 3 and 4 were calculated from equation (3) ; the values of the parameters (m, k and 6) used to fit the mutant frequency data are given in Table 1 together with the coordinates of the ‘transition point’ (equation 7) and the point at which the forward frequency reaches a maximum (equa- tion 8). The surviving fraction of cells at xt and x,,, are also shown in the table. The value of k is determined from the LD,, dose read off from the UV survival curves of the cells; the value of m is determined directly from the initial linear part of the frequency curves. Thus, 6 is the only truly adjustable parameter used in fitting the data to equation 3, and even here there are constraints on the range of values that could be considered plausible. I t should be noted that 8 does not appear alone, but is part of the exponential coefficient ( 1 - 6) k in equation (3) ; the empirical value of this coefficient is determined by the nonlinear part of the induction curve. On general radiobiological grounds the value of 8 should not differ too much from unity. The fact that values of 8, obtained from the coeffi- cient ( 1 - 8) k and the measured values of k, are close to unity therefore lends a degree of internal credibility to our analysis. Thus equation (3) provides a use- ful empirical representation for two very different categories of mutational response, even if the biological interpretation we attach to the parameters m and 8 is misconstrued.
Dow
nloaded from https://academ
ic.oup.com/genetics/article/85/2/225/5991872 by guest on 17 February 2022
UV
DO
SE
(er
gs/
mm
2)
od
e 2
-1-
AD
E 2
(lo
cus
+ su
pp
ress
or)
ra
d 2
- 20
8 /*-6,
d/
0
I
a Io
-' I0
0
IO
I
UV
DO
SE
(e
rgs/
mm
ZI
FIG
UR
E
3a (
left
) an
d 3b
(ri
ght)
.-In
duce
d re
vers
ion
freq
uenc
ies
for
the
ochr
e al
lele
s ad
e2-I
and
lys2
-I
in a
n ex
cisi
on-d
efic
ient
str
ain
(rad
2-20
) of
S.
cere
uisi
ae;
each
poi
nt r
epre
sent
s a
sing
le m
easu
rem
ent.
In b
oth
case
s th
e m
utat
ion
freq
uenc
y in
itia
lly
rise
s li
near
ly w
ith
dose
; a
tran
sitio
n to
qua
drat
ic k
inet
ics
occu
rs n
ear
9 er
gs/m
m2,
and
at h
ighe
r do
ses
the
curv
es r
ise
even
m
ore
rapi
dly
and
atta
in v
ades
of n =
3.5
and n =
2.9,
res
pect
ivel
y,
at t
he h
ighe
st
dose
s m
easu
red.
The
loc
us a
nd s
uppr
esso
r m
utan
ts i
ndep
ende
ntly
fol
low
sim
ilar
kin
etic
s.
3
Dow
nloaded from https://academ
ic.oup.com/genetics/article/85/2/225/5991872 by guest on 17 February 2022

236
to-2-
L
2 3 0 k.
? 6 3-
2 5
2 10- t?
3 Q 5
I ode2-t--rode 2-t ode X
- lpures c sectors)
rod 2-20
I I I I I I I I I I I I I 1 1 1 1 1 I I I I I I l l
10 to uv- DOSE l e r g s / m m Z I
to 0
FIGURE 4.-Forward mutation frequencies for induction of the double auxotroph ade2 adez in an excision-deficient strain (rad2-20) of S. cereuisiate; the points are averaged from three independent experiments, and the average probable error per point is zk 10%. The curve begins linearly and goes through a maximum near 14 ergs/mm2. For the point at 16 ergs/mm2, only the contribution of pure mutant clones (1.55 ~ 1 0 - 3 ) was measured; the contribution of sectors (1.1 x 10⁻³) had to be interpolated hom measurements at neighboring doses. Pure mutant clones and sectors independently follow similar kinetics.
It is instructive to emphasize the following points in connection with these results. First, the reversion system is necessarily selective and the prototrophic revertants are scored amongst IO7 auxotrophs plated on omission medium, whereas in the survival assay the cells are plated at a variable density chosen to allow growth of approximately 200 viable clones on supplemented minimal medium after irradiation. Therefore, in this, as in most reversion assay systems, mutants and survivors are grown and scored under significantly different biologi- cal conditions. On the other hand, the forward ade2 adex system is nonselective and both mutants and survivors are scored on the same plates under identical growth conditions; precautions were taken to ensure that all white clones scored as mutants were authentic ade2 adex double auxotrophs (ECKARDT and HAYNES 1977).
Second, in Figure 3 total reversion frequencies (locus plus suppressor) are given. Preliminary experiments have shown that both locus and suppressor reversions are induced according to biphasic kinetics that are initially linear, but then rise as the square and even higher powers of dose in the high-dose range (ECKARDT 1974). In Figure 4, the total mutation frequency (pure clones plus sectors) is plotted. Again, other experiments have shown that both pure clones and sectors independently follow linear induction curves which rise to a maxi- mum and then decline at high doses (ECKARDT and HAYNES 1977). The simi- larity of induction kinetics for locus and suppressor revertants on the one hand,
Dow
nloaded from https://academ
ic.oup.com/genetics/article/85/2/225/5991872 by guest on 17 February 2022

E 3
TA
BL
E 1
Para
mei
ers
of m
utan
t fr
eque
ncy
curv
es*
2
Cur
ve f
itti
ng p
aram
eter
s C
urve
ihar
acte
rist
ics
t: m
1 /k
6 Z
t S(
r,)
Mt
%ax
S(
5”
f%”
0 r
Mut
ants
x~
led
(e
rgs/
mm
?)-’
(e
rgs/
”?)
(erp
/mm
2)
( erg
s/m
m2)
-
2 LY
S re
vert
ants
1.
6 x
10-6
6.
2 0.
752
9.2
0.25
2.
1 x
10-5
- -
_-
2 13
.7
0.04
4 3.
0 x
10-3
E 3
max
imum
. z
AD
E re
vert
ants
0.
62 x
10-
6 6.
2 0.
750
9.1
0.25
8.
1 X
10-
6 --
M U
ade2
ade
x fo
rwar
ds
6.0
x 10
-4
4.0
1.29
-
__
-_
_
* S(x
t) an
d M
, den
ote
the
surv
ivin
g fr
actio
n of
cel
ls a
nd th
e in
duce
d re
vers
ion
freq
uenc
ies
for
the
tran
sitio
n po
int
dose
xt;
S(x,,)
and
M,,
deno
te t
he s
urvi
ving
fra
ctio
n of
ce
lls a
nd t
he i
nduc
ed f
orw
ard
mut
atio
n fr
eque
ncy
for
the
dose
at
whi
ch t
he f
orw
ard
freq
uenc
y at
tain
s it
s > 0
M Y v)
Dow
nloaded from https://academ
ic.oup.com/genetics/article/85/2/225/5991872 by guest on 17 February 2022

238 F. ECKARDT A N D R. H. HAYNES
and for pure and sectored forward mutations on the other, ensures that it is appropriate to use equation (3) in fitting total frequency data for both muta- tional systems.
Third, the spontaneous mutation rate for the add-I allele, as determined in a fluctuation test proved to be (2.3f0.2) x lo-? per cell (calculated according to KONDO 1972). This rate is substantially lower than the lowest measured induced frequency for this allele. The spontaneous background was found to vary in different cell populations; the experiments retained for analysis always were those in which the spontaneous background was low and an absolute increase was observed in the number of mutants after small doses of radiation. Since stationary phase cells are plated on unsupplemented omission medium, it is unlikely that new spontaneous mutants appear during the plating assay.
Finally, it should be pointed out that the apparently more sensitive cells used in the forward mutation studies in Toronto showed essentially the same biphasic dose-response curve in a reversion experiment as did the original cells used in the Berlin experiments. Thus, we can rule out the possibility that the apparent change in sensitivity of the strain as measured in the two laboratories had any influence on the two types of mutation induction kinetics observed.
DISCUSSION
In this paper we report two essentially opposite types of mutational dose- response curves found in one and the Same excision-deficient strain of S. cereuisiae (rad2-20). We measured induced mutant frequencies over the same dose and survival range (1 to 60 ergs/mm2; minimum survival 0.1 %) for both revertants and forward mutations. In the selective reversion system we obtained biphasic induction kinetics which are linear in the low dose range, gradually become quadratic, and, in the lowest survival range measured, increase with even higher powers of dose ( n = 3.5 and n = 2.9 for the adenine and lysiEe revertants, respec- tively). On the other hand, in the nonselective forward system we found linear induction curves at low doses which rise to a maximum and then decline at high doses.
Both types of response can be described by an equation based on Poisson statis- tics and the assumption that mutation and killing are not necessarily statistically independent processes (equation 3). The equation is derived here for the case of mutants which exhibit exponential UV survival curves. The existence of a resistant “tail” on the particular rad2 strain used in the experiments has no theoretically significant effect on our analysis or conclusions. In deriving equa- tion (3) we assume that sensitivity to mutation is given by a constant m, and sensitivity to killing by a constant k. Statistical dependence of mutation and kill- ing is then introduced by assigning a sensitivity k, to the mutant cells; the ratio of mutant to nonmutant sensitivity, kJk, is denoted by the parameter S. Equa- tion (3) can be used to fit equally well both the reversion and forward data under two, not mutally exclusive, conditions: first 6 # 1 and m is constant €or any given strain, locus or allele; second, 8 = 1 and m is not constant as initially assumed but
Dow
nloaded from https://academ
ic.oup.com/genetics/article/85/2/225/5991872 by guest on 17 February 2022

KINETICS O F INDUCED MUTAGENESIS 239
rather is considered to be some appropriate function of dose, m (2). We discuss both possibilities independently and make comparisons with the various ‘two-hit’ and ‘heterogeneous population’ models which have been used to interpret muta- tion kinetics.
Models which postulate some necessary interaction, cooperation or overlap of neighboring lesions (BRIDGES 1966; BRESLER 1975, SEDGWICK 1975a) are hard to reconcile with linear kinetics. Also, a rough estimate indicates our reversion frequencies in the nonlinear region are 1 O-fold higher than expected statistically for two-bit kinetics. [This estimate assumes an average yield of 23 dimers/erg/ mm2 in a haploid genome composed of 1.4 X IO‘ base pairs (UNRAU et al. 1973; FATH and BRENDEL 1975) and an interaction distance of up to IO3 base pairs between dimers.] Other models, which assume a more indirect interaction of premutational lesions (MENNIGMANN 1972, DOUDNEY 1975, WITKIN 1975c), could be invoked to explain the reversion data, but they fail to account for the forward mutation kinetics which do not have any positive quadratic component.
Mutational dose-response curves which go through a maximum are sometimes takefi as evidence that the treated population is heterogenous with respect to mutability, that is, with increasing dose a population more resistant to mutation is assumed to be selected (KAPLAN 1956). If the problem of demonstrating the existence of the required population heterogeneity is overlooked, such a model could explain the decreasing mutation frequency in the forward data, but it could not simultaneously explain the increasing frequency of reversions in the same dose range, unless the mutabilities of the assumed subpopulations are arbitrarily reversed from one system to the other.
If it is assumed that 6 = 1, m can be calculated from equation (3) for each point on the dose-response curves shown in Figures 3 and 4. The data indicate that m(z ) would have to be either a positive or negative exponential function. Over the dose range from 1 to 60 ergs/mm2. m(z) increases by a factor 10 (posi- tive exponential) for the reversion data, but decreases by a factor 60 (negative exponential) for the forward data. On the basis of current thinking, an increase of m with dose could indicate induction (or activation) of some error-prone repair system; a decrease in m could be interpreted as inactivation or destruction of gene products involved in error-prone repair. But again, if our reversion and forward data are interpreted in these two distinct ways, one still has the problem that a model which explains one type of kinetics must be turned about to explain the other; and simultaneous induction and destruction of gene products involved in mutagenesis seems unlikely to occur at the same time in the same cell, depend- ing on the type of mutation chosen for assay.
The possibility that mutant and nonmutant cells in the same population have different probabilities o’f clone formation has been examined experimentally in different organisms and with various mutagenic agents (GRIGG 1952; KAPLAN 1959; HAEFNER and LASKOWSKI 1963; AUERBACH and RAMSAY 1968). The gen- eral conclusion is quite clear; mutants and nonmutants can have different prob- abilities of survival but such differences arise in a variety of ways. First, a mutant can be either inhibited or supported in growth, depending on the genetic back-
Dow
nloaded from https://academ
ic.oup.com/genetics/article/85/2/225/5991872 by guest on 17 February 2022

240 F. ECKARDT AND R. H. HAYNES
ground and physiology of the nonmutant cells (GRIGG 1952; KAPLAN 1959). It should be noted that revertants to wild type (GRIGG 1952) as well as mutations to auxotrophy (KAUDEWITZ, MOEBUS and KNESER 1963; SCHIMMER and LOPPES 1975) can be influenced by surrounding parental cells. The reasons for such effects are not clear. Second, whether mutant cell growth is supported or inhibited can depend on the density at which treated cells are plated. If the same titre of cells is plated for the various doses used, a different number of viable, and pos- sibly competing, cells grow on the plates along with the mutants (e.g. BRIDGES, MOTTERSHIELD and COLLELA 1973; SIMMONS 1974; SCHIMMER and LOPPES 1975; VAN ZEELAND and SIMONS 1976). Third, the composition of the plating medium can influence the yield of mutants (DEMEREC and LATARJET 1946; HAEFNER and LASKOWSKI 1963; SIMONS 1974; DOUBLEDAY, BRIDGES and GREEN 1975; VAN
ZEELAND and SIMMONS 1976) and such conditions also would beexpected to affect induction kinetics. Mutation frequency decline in bacteria, that is, the rapid ‘loss’ of certain mutants if cells are plated under nongrowing conditions (WITKIN 1966) , is thought to arise from the elimination of premutational lesions by error- free repair (WITKIN 1966; SETLOW 1966; GEORGE and WITKIN 1975) ; this process cannot take place, or is much less efficient, under conditions which allow immediate protein synthesis. Also, it has been found that medium conditions which affect the number of detected mutants do not change the number of pre- mutational lesions formed, but rather influence the mutational process at the level of expression and cell multiplication ( DOUBLEDAY, BRIDGES and GREEN 1975). Finally, studies on nitrite mutagenesis in E. coli have shown that cells from auxotrophic clones compete with wild-type cells during growth, but that freshly induced auxotrophs are at a disadvantage (KAUDEWITZ 1960; KAUDEWITZ, MOEBUS and KNESER 1963). This indicates that reconstruction experiments which normally are carried out to check the possibility of differential survival do not always reflect accurately the conditions of the assay procedure.
The results cited above lend credibility to the notion that the differential sensi- tivity of mutant and nonmutant cells, which we describe mathematically by the parameter 6, can play a decisive role in determining the shape of mutational dose- response curves. Further plausibility is lent to this idea when one comiders that in the mutational systems used here, the reversions and forward mutations are scored under very different qrowth conditions, but the values of 6 required to account for the two essentially opposite types of dose-response relation are close to unity.
It remains to ask why 6 is greater than one in some cases but less than one in others. We also need more information that would reveal at what level in the mutational pathway the factors that cause 6 to differ from unity are most likely to act. Unfortunately, we cannot provide clear answers at present, but we feel that further study of the many factors capable oi modifying expression and clonal growth will shed light on both questions. In particular, it would be helpful to develop a nonselective system for scoring reversions, as it is by no means clear whether the 6 < 1 kinetics are associated with reversion per se or merely with the fact that the assay systems are selective (and vice versa for the forward sys-
Dow
nloaded from https://academ
ic.oup.com/genetics/article/85/2/225/5991872 by guest on 17 February 2022

KINETICS O F INDUCED MUTAGENESIS 241
tem) . It should be possible to distinguish between factors that act during expres- sion, as compared with those acting during clonal growth, by exploiting systems of the type recently developed by LEMONTT (1976a, b). However, it must be emphasized that a value of 8 different from unity and a dose-dependent mutabil- ity are not mutually exclusive a priori. Thus, it remains possible that in yeast, the effect of some mode of induced error-prone repair could be masked by differ- ential survival of mutant and nonmutant cells in different assay systems.
The mathematical acalvsis developed here can be extended in various ways. Fjrqt, we have found that repair-proficient RAD wild-type strains exhibit muta- tion induction kinetics qualitatively similar to those of the rad2 strain in equiva- lent assay systems. The mathematical analysis of these data is more complicated, since dose-dependent renair functions must be taken into account (HAYNES 1975; WHEATCROFT, Cox and HAWNES 1975) ; this work will be reported subsequently. Second, it should be pointed out that a similar type of analysis could be develoDed for different genetic endpoints, as wcll as for different mutagenic agents. For example, it might be noted that in diploid strains of S. cerevisiae, non-selectively scored intergenic recombinants exhibit induction kinetics smilar to those found for the forward system examined here; whe-eas selectively scored intraeenic recombinants show the kinetics of the reversion type (KOWALSKI and LASKOWSKI 1975). It would be desirable also to analyse chromosomal events, since the tradi- tioval hypothesis that deletions and certah other types of chromosomal aberra- tions are caused by two-hit processes is not as clearly established as one might wjsh (WOLFF 1967; BREWEN and BROCK 1968; AUERBACH and KILBEY 1971). A variety of dose-response relations are found also for X-ray mutagenesis. Linear kinetics have been reported frequently (e.g.. OLIVER 1932; SPENCER and STERN 1948; WEBBER and DE SERRES 1965; MORTIMER. BRUSTAD and CORMACK 1965; CLEAVER Z 976; CONKLING, GRUNAU and DRAKE 1976) ; however. in Neurospora quadratic curves have been found for induction of deletions at high dose rates (1000 rads/min) (WEBBER and DE SERRES 1965) although at low dose rates (IO rads/min) the induction curve does possess a linear component at low doses (DE SERRES, MALLING and WEBBER 1967). Most data on chromosomal mutations of higher orgapisms can be fit best with a biphasic linear-quadratic equation (BREWEN et al. 1973; BREWEN and PRESTON 1974) ; the transition points occur at low doses, but exceptions exist (SWANSON 1942; BREWEN and BROCK 1968; BREWEN and PRESTON 1974). Still more complex patterns have been found for mutation induction in stamen hairs of Tradescantia; here a linear increase in mutation frequency is observed at low doses, but this is followed in some cases by a quadratic region, as the curves approach a maximum, and finally by a decrease (SPARROW, UNDERBRINK and ROW 1972; SPARROW, SCHATER and VILLALOBOS- PIETRINI 1974; NAUMANN, UNDERBRINK and SPARROW 1975).
Finally, it is possible to use equatioll (3) as a basis for the mathematical defini- tion of coefficients of mutability, which should be of practical use in grading the mutagenicity of various agents for a given locus, or the relative mutability of ' different loci (in the same organism) for the same agent.
Dow
nloaded from https://academ
ic.oup.com/genetics/article/85/2/225/5991872 by guest on 17 February 2022

242 F. ECKARDT AND R. H. HAYNES
The reversion studies reported here were carried out as part of a Ph.D. thesis in the Freie Universitat Berlin. We wish to thank M s . M. BROSE for technical assistance and Ms. SOO-JEET TEH for her careful measurements of the forward mutation frequencies. DR. JOHN W. DRAKE worked well beyond the normal call of duty as editor in helping us to clarify some of the more esoteric bits of mathematics in this paper. The research was supported by grants from the Deutsche Forschungsgemeinschaft (to F.E.) and the National Research Council of Canada.
LITERATURE CITED
ABBONDANDOLO, A. and S. SIMI, 1971
AUERBACH, C., 1976 Mutation Research. Chapman and Hall, Ltd., London. AUERBACH, C. and B. J. KILBEY, 1971 AUERBACH, C. and D. RAMSEY, 1968
BRESLER, S. E., 1975 BRESLER, S. E., V. L. KALININ, Y. I. KOPYLOVA, A. S. KRIVISKY, V. N. RYBCHIN and V. N.
SHELEGEDIN, 1975 Study of genetic effects of high energy radiations with different ionizing capacities on extracellular phages. Mutation Res. 29: 1-20.
BREWEN, J. G. and R. D. BROCK, 1968 The exchange hypothesis and chromosome-type aberra- tions. Mutation Res. 6: 245-255.
BREWEN, J. G. and R. J. PRESTON, 1974 Cytogenetic effects of environmental mutagens in mammalian cells and the extrapolation to man. Mutation Res. 26: 297-305.
BREWEN, J. G., R. J. PRESTON, K. P. JONES and D. G. GOSSLEE, 1973 Genetic hazards of ionizing radiations: cytogenetic extrapolations from mouse to man. Mutation Res. 17: 245-254.
BRIDGES, B. A., 1966 A note on the mechanism of UV-mutagenesis in E. coli. Mutation Res. 3: 273-279. -, 1969 Mechanisms of radiation mutagenesis in cellular and sub-cellular systems. Ann Rev. Nucl. Sci. 19: 139-178. -, 1975 Genetic effects of UV on Escheri- chia coli-a model for prokaryotes. pp. 626-631. In: Proceedings of the 5th International Congress of Radiation Research. Edited by 0. F. NYGAARD, H. I. ADLER, W. K. SINCLAIR. Academic Press, New York.
Differential induction and repair of ultraviolet damage leading to true reversions and external suppressor mutations of an ochre codon in Escherichia coli B/r WP2. Genetics 57: 897-908.
BRIDGES, B. A. and J. HUCKLE, 1970 Mutagenesis of cultured mammalian cells by X-radiation and ultraviolet light. Mutation Res. 10: 141-151.
BRIDGES, B. A., R. P. Mottershield and C. Collela, 1973 Induction of forward mutations to colicin E, resistance in repair deficient strains of Escherichia coli: experiments with ultra- violet light and captan. Mutation Res. 21: 303-313.
Mutagenesis in E. coli: Evidence for the mechanism of base change mutation by UV in a strain deficient in excision repair. Proc. Roy. SOC. B 171: 213-226.
Induced mutation in UV sensitive mu-
Gamma-ray mutagenesis in bacterio-
UV-induced reversion to prototrophy in three strains of
Studies on the streptomycin resistance system of mutations in Escherichia
Mosaicism and lethal sectoring in GI cells of Schizo- saccharomyces pombe. Mutation Res. 12 : 143-150.
Mutation in Eukaryotes. Ann. Rev. Genet. 5 : 163-218. Analysis of a case of mutagen specificity in Neurospora
crassa. I. Dose response curves. Molec. Gen. Genet. 103: 72-104. Theory of misrepair mutagenesis. Mutation Res. 29: 467-472.
BRIDGES, B. A., R. E. DENNIS and R. J. MUNSON, 1967
BRIDGES, B. A. and R. J. MUNSON, 1968
CHANG, L. T., J. E. LENNOX and R. W. TUVESON, 1968
CONKLING, M. A., J. A. GRUNAU and J. W. DRAKE, 1976
DAVIES, D. R. and S. LEVIN, 1968
DEMEREC, M., 1951
tants of Aspergillus nidulans and Neurospora crassa. Mutation Res. 5 : 21 7-224.
phage T4. Genetics 82: 565-575.
Chalmydomonas reinhardi differing in dark repair capacity. Mutation Res. 5 : 231-236.
coli. Genetics 36: 585-597.
Dow
nloaded from https://academ
ic.oup.com/genetics/article/85/2/225/5991872 by guest on 17 February 2022

KINETICS O F INDUCED MUTAGENESIS 243
Mutations in bacteria induced by radiations. Cold Spring Harbor Symp. Quant. Biol. 11 : 38-49.
Dose-rate effects on inactivation and mutation induction in Neurospora crassa. Brookhaven Symp. Biol. 20 : 56-76.
Mutagenic DNA repair in Escheri- chia coli. 11. Factors affecting loss of photoreversibility of UV-induced mutations. Molec. Gen. Genet. 140: 221-230.
The two-lesion hypothesis for UV-induced mutation in relation to recov- ery of capacity for DNA replication. In: Molecular Mechanisms for Repair of DNA. pp. 389-392, Part A. Edited by P. C. HANAWALT and R. B. SETMW. Plenum Press, New York.
DOUDNEY, C. 0. and C. S. YOUNG, 1962 Ultraviolet light induced mutation and deoxyribonucleic acid replication in bacteria. Genetics 47: 1125-1138.
DRAKE, J. W., 1966 Ultraviolet mutagenesis in bacteriophage T4. I. Irradiation of extracellular phage particles. J. Bacteriol. 91 : 1775-1780.
ECKARDT, F., 1974 Spontane und UV-induzierte Mutabilitat von drei UV-sensiblen Saccharo- myces-Mutaten. Ph.D. Thesis, Freie Universitat Berlin.
ECKARDT, F., S. KOWALSKI and W. LASKOWSKI, 1975 The effects of three rad genes on UV- induced mutation rates in haploid and diploid Saccharomyces cells. Molec. Gen. Genet. 136: 261-272.
Kinetics of UV-induced mutagenesis in yeast. Biophys. J. 16: 181a. -- , 1377 Induction of pure and sectored mutant clones in excision profi- cient and deficient strains of yeast. Mutation Res. (In press).
Analysis of a radiation-induced mutation in E. coli. J. Theoret. Biol. 2:
UV-induction of thymine-containing dimers in Saccharo-
Ultraviolet light-induced responses of a mfd mutant of
DEMEREC, M. and R. LATARJET, 1946
DE SERRES, F. J., H. V. MALLING and B. B. WEBBER, 1967
DOUBLEDAY, 0. P., B. A. BRIDGES and M. H. L. GREEN, 1975
DOUDNEY, C. 0. 1975
ECKARDT, F. and R. H. HAYNES, 1976
ENGELBERG, J., 1962
FATH, W. W. and M. BRENDEL, 1975
GEORGE, D. L. and E. M. WITKIN, 1975
GRIGG, G. W., 1952 GUDAS, L. J. and A. B. PARDEE, 1975
HAEFNER, K. and W. LASKOWSKI, 1963
312-325.
myces cerevisiae. Z. Naturforschg. 30c: 811-817.
Escherichia coli B/r having a slow rate of dimer excision. Mutation Res. 28: 347-354.
Back mutation assay method in microorganisms. Nature 169: 98-100. Model for regulation of Escherichia coli DNA repair
functions. Proc. Natl. Acad. Sci. U.S.A. 72: 2330-2334.
Zur Induktion prototropher Saccharomyces-mutanten durch ultraviolettes Licht in Abhangigkeit von Dosis und Nachbehandlung. Z. Naturforschg.
HANNAN, M. A., P. DUCK and A. NASIM, 1976 UV-induced lethal sectoring and pure mutant clones in yeast. Mutation Res. 36: 11 7-1 77.
HAYNES, R. H., 1975 The influence of repair processes ox radiobiological survival curves. pp. 197-208. Edited by T. ALPER. In: Cell Survival after Low Doses of Radiation. John Wiley and Sons Ltd., London.
Ultraviolet induced lethality and reversion to prototrophy in Escherichia coli strains with normal and reduced dark repair ability. Photochem. Photobiol. 4: 563-568.
Biochemical measure of the time and frequency of radiation-induced allelic recombination in Ustilago. Nature 232: 233-236. -, 1975 Further evidence for an inducible recombination repair system in Ustilago maydis. Mutation Res. 29: 149-153.
Dose-effect curves of s-mutation and killing in Serratia marcescens. Arch. Mikrobiol. 24 : 60-79. -, 1959 Studien iiber die UV-Mutabilitat verschiedener Stamme von Serratia und uber die Natur der Farbungsmutationen. Arch. Mikrobiol. 32:
18b: 301-309.
HILL, R., 1965
HOLLIDAY, R., 1971
KAPLAN, R. W., 1956
138-1 60.
Dow
nloaded from https://academ
ic.oup.com/genetics/article/85/2/225/5991872 by guest on 17 February 2022

244 F. ECKARDT AND R. H. HAYNES
KAUDEWITZ, F., 1960
KAUDEWITZ, F., K. MOEBUS and H. KNESER, 1963
Inaktivierung und Mutagenese von Escherichia coli durch Inkubation mit Natriumnitrit. Abhandlg. Deut. Akad. Wiss. (Berlin), K1. Med. 1: 86-91.
Mischkolonien auxotropher und Wild-type- Zellen nach Behandlung von Escherichia coli-Zellen mit salpetriger Saure. Z. Naturforschg. 18b: 245-252.
KILBEY, B. F., 1975 Mutagenesis in yeast. pp. 209-231. In: Methods in Cell Biology. Edited by D. M. PRESCOTT. Academic Press, New York.
KONDO, S., 1972 A theoretical study on spontaneous mutation rate. Mutation Res. 14: 365-374. c_ , 1973 Evidence that mutations are induced by errors in repair and replication. Genetics (suppl.) 73: s109-122.
Base-change mutagenesis and prophage in- duction in strains of Escherichia coli with different repair capacities. Genetics 66: 187-217.
Herstellung und Charakterisierung von auxotroph-strahlensensiblen Sac- charomyces-Stammen. Diplomarbeit, Freie Universitat Berlin.
The effect of three rad genes on survival, inter- and intragenic mitotic recombination in Saccharomyces. I. UV irradiation without photoreactiva- tion or liquid-holding post-treatment. Molec. Gen. Genet. 136: 75-86.
LAWRENCE, C. W., J. W. STEWART, F. SHERMAN and R. CHRISTENSEN, 1974 Specificity and fre- quency of ultraviolet-induced reversion of an iso-1-cytochrome c ochre mutant in radiation- sensitive strains of yeast. J. Mol. Biol. 85: 137-162.
UV mutagenesis in radiation sensitive strains of yeast. Genetics 82: 207-232.
Mutants of yeast defective in mutation induced by ultraviolet light, Genetics 68: 21-33. --, 1972 Induction of forward mutations in mutationally defec- tive yeast. Molec. Gen. Genet. 119: 27-42. -- , 1976a Induced mutagenesis in Ustilago maydis. T. Isolation and characterization of a radiation revertible allele of the structural gene for nitrate reductase. Molec. Gen. Genet. 145: 125-132. -- , 1976b Induced muta- genesis in Ustilago maydis. 11. An in vivo biochemical assay. Molec. Gen. Genet. 145: 133-143.
Pyrimidine dimers as pre-mutational lesions in Escherichia coli
Influence of linear energy transfer and oxygen tension on the effectiveness of ionizing radiations for induction of mutations and lethality in Saccharomyces cerevisiae. Radiation Res. 26 : 465-482.
Cytoplasmic and nuclear events induced by UV-light in strains of Sac- charomyces cerevisiae with different UV-sensitivities. Mutation Res. 7: 171-185.
Influence of radiation dose rate on somatic mutation induction in Tradescantia stamen hairs. Radiation Res. 62: 79-96.
KONDO, S., H. ICHIKAWA, K. Iwo and T. KATO, 1970
KOWALSKI, S., 1971
KOWALSKI, S. and W. LASKOWSKI, 1975
LAWRENCE, C. W. and R. CHRISTENSEN, 1976
LEMONTT, J. F., 1971
MENNIGMANN, H. D., 1972
MORTIMER, R. K., T. BRUSTAD and D. V. CORMACK: 1965 WP2 h c r . Molec. Gen. Genet. 117: 167-186.
MOUSTACCFII, E., 1969
NAUMANN, C. H., A. G. UNDERBRINK and A. H. SPARROW, 1975
NOVICK, A., 1955
OLIVER, C. P., 1932
Mutagens and antimutagens. Brookhaven Symp. Biol. 8 : 201-215.
An analysis of the effect of varying the duration of X-ray treatment upon the frequency of mutations. Z. indukt. Abstamm. U. Vererb. Lehre 61 : M7-488.
Phenomenology of an inducible mutagenic DNA-repair pathway in Escher- ichia coli: SOS repair hypothesis. pp. 128-142. In: Molecular and Environmental Aspects of Mutagenesis. Edited by M. MILLER. Thomas, Springfield, Ill.
Induction of mutations in Saccharomyces cerevisiae by ultra-violet light. Mutation Res. 7: 315-332.
A system selective for mutations affecting the synthesis of adenine in yeast. C. R. Lab. Carlsberg, Ser. Physiol. 26: 299-315.
RADMAN, M., 1974
RESNICK, M. A., 1969
ROMAN, H., 1956
Dow
nloaded from https://academ
ic.oup.com/genetics/article/85/2/225/5991872 by guest on 17 February 2022

K I N E T I C S OF I N D U C E D MUTAGENESIS 245
Eine einfache Methode zur Bestimmung des Quantenflusses von Bestrahlungslampen im Wellenlangenbereich 2400 A bis 6000 A. Z. Naturforschg. 2'5b :
Forward mutations induced by nitrosoguanidine during the synchronized cell cycle of Chlamydomonas reinhardi. Molec. Gen. Genet. 138: 25-31.
Genetic and kinetic evidence for different types of post-replication repair in Escherichia coli B. J. Bacteriol. 123: 154-161. - , 1975b Inducible error- prone repair in Escherichia coli. Proc. Natl. Acad. Sci. U.S.A. 72: 2753-2757.-, 1 9 7 5 ~ Ultraviolet inducible protein associated with error-prone repair in E. coli B. Nature 255:
The molecular basis of biological effects of ultraviolet irradiation. pp. 195-248. In: Current Topics in Radiation Research, Vol. 11. Edited by M. EBERT and A. HOWARD. North Holland, Amsterdam.
Dose-response relationships for mutants in mammalian somatic cells in uitro. Mutation Res. 25: 219-227.
Reversions of the two missense and one non- sense try-mutations induced by UV-light or methyl methanesulfonate in E . coli wild-type and its pol AI and uurE502 mutants. Mutation Res. 28: 311-322.
Mutations induced in Tradescantia by small doses of X-rays and neutrons: analysis of dose-response curves. Science 176:
Comparison of somatic mutation rates in Tradescantia by chemical and physical mutagens. Mutation Res. 26: 265-276.
Experiments to test the validity of the linear r-dose/ mutation frequency relation in Drosophila at low dosage. Genetics 33: 43-74.
The effects of ultraviolet and X-ray treatment on the pollen tube chromo- somes of Tradescantia. Genetics 27: 491-503. -, 1955 The effect of ultraviolet radia- tion on the genes and chromosomes of higher organisms. pp. 249-284. In: Radiation Biology, Vol. 11. Edited by A. HOLLAENDER. McGraw-Hill Book Company, New York.
TIMOF~EF-RESSOVSKY, N. W., K. G. ZIMMER and M. DELBRUCK, 1935 Uber die Natur der Gen- mutation und der Genstruktur. Nachr. Ges. Wiss. Gottingen 1: 189-245.
UNRAU, P., R. WHEATCROBT, B. Cox and R. OLIVE, 1973 The formation of pyrimidine dimers in the DNA of fungi and bacteria. Biochim. Biophys. Acta 312: 626-632.
VAN ZEELAND, A. A. and J. W. I. M. SIMONS, 1976 The use of correction factors in the deter- mination of mutation frequencies in populations of human diploid skin fibroblasts. Mutation Res. 34: 149-158.
VON BORSTEL, R. C., 1966 Effects of radiation on cells. pp. 60-125. In: The Biologica2 Basis of Radiation Therapy. Edited by E. E. SCHWARTZ. G. B. Lippincott, Philadelphia.
WEBBER, B. B. and F. J. DE SERRES, 1965 Induction kinetics and genetic analysis of X-ray induced mutations in the ad3 region of Neurospora crassa. Proc. Natl. Acad. Sci. U.S.A. 53: 430-437.
Repair of UV-induced DNA damage and
Radiation-induced mutations and their repair. Science 152 : 1345-1352. - , 1967 Mutation-proof and mutation-prone modes of survival in derivatives of E . coli B differing in sensitivity to ultraviolet light. Brookhaven Symp. Biol. 20: 17-53. -, 1969a Ultraviolet-induced mutation and DNA repair. Ann. Rev. Genet. 3: 525-552. - , 1969b The mutability toward ultraviolet light of recombination deficient strains
SCHAARSCHMIDT, B., 1970
330-331. SCHIMMER, 0. and R. LOPPES, 1975
SEDGWICK, S. G., 1975a
349-350. SETLOW, J. K., 1966
SIMONS, J. W. I. M., 1974
SKAVRONSKAYA, A. G. and G. B. SMIRNOV, 1975
SPARROW, A. H., A. G. UNDERBRINK and H. H. RON, 1972
91 6-91 8. SPARROW, A. H., L. A. SCHAIER and R. VILLALOBOS-PIETRINI, 1974
SPENCER, W. P. and C. STERN, 1948
SWANSON, C. P., 1942
WHEATCROFT, R., B. S. Cox and R. H. HAYNES, 1975
WITKIN, E. M., 1966
survival in yeast. I. Dimer excision. Mutation Res. 30: 209-218.
Dow
nloaded from https://academ
ic.oup.com/genetics/article/85/2/225/5991872 by guest on 17 February 2022
246 F. ECKARDT A N D R. H. H A Y N E S
of E. coli. Mutation Res. 8: 9-14. __ , 1974 Thermal enchancement of ultraviolet mutability in a tif-1 uvrA derivative of Escherichia coli B/r: evidence that ultraviolet muta- genesis depends upon an inducible function. Proc. Natl. Acad. Sci. U.S.A. 71: 1930-1934. - , Relationship among repair, mutagenesis and survival: overview. pp. 347-353. In: Molecular Mechanisms for Repair of DNA, Part A. Edited by P. C. HANAWALT and R. B. SETLOW. Plenum Press, New York. - , 1975b Elevated mutability of polA and uvrA poZA derivatives of Escherichia coli B/r at sublethal doses of ultraviolet light: evidence for an inducible error-prone repair system “SOS” repair and its anomalous expression in these strains. Genetics (suppl.) 79: s199-213. -, 1975c Persistence and decay of thermu- inducible error-prone repair activity in non-filamentous derivatives of tif-1 Escherichia coli B/r: The timing of some critical events in ultraviolet mutagenesis. Molec. Gen. Genet. 142 :
Ultraviolet mutagenesis in polA and uvrA polA derivatives of Escherichia coli B/r. Evidence for an inducible error-prone repair system. Genetics (suppl.) 73: s91-108.
Radiation genetics. Ann. Rev. Genet. 1 : 221-244.
1975a
87-103.
WITKIN, E. M. and D. L. GEORGE, 1973
WOLFF, SHELDON, 1967 WOODS, R. and J. JACKSON, 1973
ZIMMER, K. G., 1934
The accumulation of glycineamide ribotide by ade3 and ade8 mutants of Saccharomyces cerevisiae. Biochem. Biophys. Res. Comm. 53 : 787-793.
Ein Beitrag zur Frage nach der Beziehung zwischen Rontgenstrahlendosis und dadurch ausgeloster Mutationsrate. Strahlentherapie 51 : 179-185. - , 1966 Some unusual topics in radiation biology. Radiation Res. 28: 830-843.
Corresponding editor: J. W. DRAKE
10-3
I I
IO0 I O / I02 IO U V DOSE (ergs /mm2)
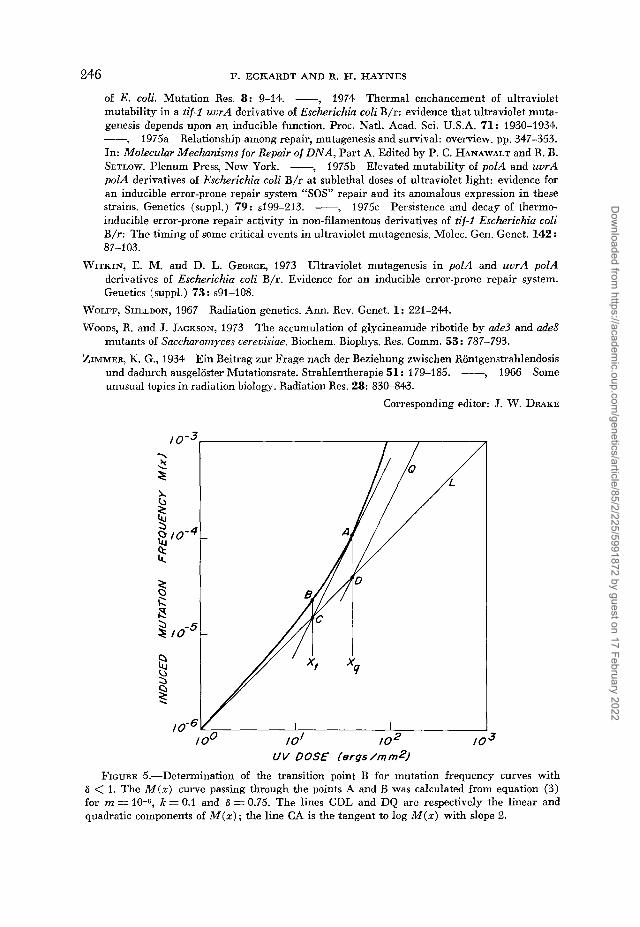
FIGURE 5.-Determination of the transition point B for mutation frequency curves with 6 < 1. The M ( z ) curve passing through the points A and B was calculated from equation (3) for m = 10-6, k = 0.1 and 8 = 0.75. The lines CDL and DQ are respectively the linear and quadratic components of M ( z ) ; the line CA is the tangent to log M ( z ) with slope 2.
Dow
nloaded from https://academ
ic.oup.com/genetics/article/85/2/225/5991872 by guest on 17 February 2022

KINETICS OF I N D U C E D MUTAGENESIS 24 7
A P P E N D I X
Definition and Calculation of Transition Point Coordinates
For cases in which -6 < 1 , the mutation frequency M ( r ) as given by equation (3) is a mono- tonically increasing function that initially rises as the first, and then higher, powers of dose ..IS z increases (Figures 2 and 5). Because these M ( x ) curves bend smoothly upward, the defini- tion of a ‘transition point’ from linear to quadratic kinetics involves an essentially arbitrary choice of some point where the slope of the log M versus log z curves lies between 1 and 2. The abscissa of such a point, that in practice can be determined easily and unambiguously, is given by the intersection of the extrapolated linear component of log M ( z ) and the tangent to the log M ( x ) curve whose slope is 2; these are the lines CDL and CA respectively in Figure 5 and they intersect at the point C. The transition point defined in this way is at B, and its abscissa may be calculated by solving simultaneously the equations for the lines CDL and CA. Since the slopes of CDL and CA are 1 and 2 respectively, we need o n l y determine the coordinates of a point on each of these lines in order to write down their equations; two such points whose coordinates are easy to find are D and A, and we proceed with the calculation as follows:
The value of z at which the slope of the tangent to the log M ( z ) curve is 2 is given by
-----=2 d (IogM) - z dM d (logz) M dx
Differentiating equation (3) to obtain dM/& and making appropriate substitutions and approxi- mations in the above equation, we find that the abscissa of the points A and D is given approximately by 1/(1-8)k, which we denote by zq; the ordinate of A is therefore M ( x , ) nre./(l-S)k. Since the point D lies on the extrapolated linear component of M, it is obvious from the first term of equation (6) that its ordinate is m/( l -S)k . Having thus obtained the coordinates of A and D and denoting the coordinates of C by (log xt, y ) , we can write the equations of the lines CA and CDL in appropriate log-log form, viz.,
me CA: y - log -__-
( 1 - 4 ) k
Eliminating y and solving for log xt, we find that log zt = -log (1-8) ke from which the coordinates of B as given by equations (7) in the text above are derived immediately.
I t should be noted that zo. is also the abscissa of the point at which the linear and quadratic components of M ( z ) are equal (the line DQ is a plot of the quadratic component of M , the second term of equation 6), and that for z > zq. M ( z ) rises at powers greater than the square of the dose.
Two interesting properties of the transition point B are that, first, the ratio of the quadratic to linear components of M at zt is l / e . Secondly, a t zt the power of dose with which M increases ( i s . , the slope of the log M versus log z curve at z t ) is approximately 1 l/e; more generally, the value of z at which M increases with power n is given by (n-l)/(l--a)k for m << k.
Dow
nloaded from https://academ
ic.oup.com/genetics/article/85/2/225/5991872 by guest on 17 February 2022