Embed Size (px)
Citation preview
JCK(Wiley) LEFT INTERACTIVE
shortstandardlong
Kinetics of HydrogenPeroxide Decompositionwith Complexed and “Free”Iron CatalystsG. TACHIEV1, J. A. ROTH2, A. R. BOWERS1
1Department of Civil and Environmental Engineering,2Department of Chemical Engineering, Vanderbilt University, Nashville, TN 37235
Received 10 August 1998; accepted 15 September 1999
ABSTRACT: The hydrogen peroxide decomposition kinetics were investigated for both “free”iron catalyst [Fe(II) and Fe(III)] and complexed iron catalyst [Fe(II) and Fe(III)] complexed withDTPA, EDTA, EGTA, and NTA as ligands (L). A kinetic model for free iron catalyst was derivedassuming the formation of a reversible complex (Fe–HO2), followed by an irreversible decom-position and using the pseudo-steady-state hypothesis (PSSH). This resulted in a first-orderrate at low H2O2 concentrations and a zero order rate at high H2O2 concentrations. The rateconstants were determined using the method of initial rates of hydrogen peroxide decom-position. Complexed iron catalysts extend the region of significant activity to pH 2–10vs. 2–4 for Fenton’s reagent (free iron catalyst). A rate expression for Fe(III) complexes wasderived using a mechanism similar to that of free iron, except that a L–Fe–HO2 complex wasreversibly formed, and subsequently decayed irreversibly into products. The pH plays a majorrole in the decomposition rate and was incorporated into the rate law by considering themetal complex specie, that is, EDTA–Fe–H, EDTA–Fe–(H2O), EDTA–Fe–(OH), or EDTA–Fe–(OH)2, as a separate complex with its unique kinetic coefficients. A model was then developedto describe the decomposition of H2O2 from pH 2–10 (initial rates � 1 � 10�4 to 1 � 10�7 M/s).In the neutral pH range (pH 6–9), the complexed iron catalyzed reactions still exhibited sig-nificant rates of reaction. At low pH, the Fe(II) was mostly uncomplexed and in the free form.The rate constants for the Fe(III)–L complexes are strongly dependent on the stability con-stant, KML, for the Fe(III)–L complex. The rates of reaction were in descending order NTA �EGTA � EDTA � DTPA, which are consistent with the respective log KMLs for the Fe(III) com-plexes. Because the method of initial rates was used, the mechanism does not include thesubsequent reactions, which may occur. For the complexed iron systems, the peroxide alsoattacks the chelating agent and by-product-complexing reactions occur. Accordingly, themodel is valid only in the initial stages of reaction for the complexed system. � 2000 John Wiley
& Sons, Inc. Int J Chem Kinet 32: 24–35, 2000
INTRODUCTION
Hydrogen peroxide is a common chemical oxidanthaving a variety of applications in industrial and en-
Correspondence to:J. A. Roth� 2000 John Wiley & Sons, Inc. CCC 0538-8066/00/010024-12
vironmental processes [1]. Different catalysts havebeen utilized for hydrogen peroxide decompositionand/or reaction with organic substrates. These includeFe(II) and Fe(III) in the “free” form (Fenton’s reagent,FeSO4) and iron complexes, such as, ethylenedinitrilo-tetraacetic acid [2,4]. While Fenton’s reaction is ef-fective in many cases, Fe(II) catalyzed hydrogen per-oxide decomposition has a restricted pH range (3–4)
HYDROGEN PEROXIDE DECOMPOSITION WITH IRON CATALYSTS 25
JCK(Wiley) RIGHT INTERACTIVE
shortstandardlong
where the activity is significant [3]. By comparisoncomplexed forms of iron are active over a much widerpH range [2,5]. There have been numerous studies ofthe reaction between hydrogen peroxide and free orcomplexed iron ions in aqueous solution. Two differ-ent reaction mechanisms for these metal-catalyzed ox-idation reactions have been proposed. The first hy-pothesis considers the generation of hydroxyl radicals.This classical mechanism of the Fenton’s reaction wasproposed by Haber and Weiss [6].
Hydroxyl radicals are formed as an active inter-mediate via the oxidation of the ferrous iron from hy-drogen peroxide.
Fe(II) � H2O2 � H� !:�Fe(III) � H O � OH (1)2
Other investigators have suggested the intermediategeneration of highly reactive ferryl ion (Fe4�) [7–12].At pH above 4–5, the reaction does not proceed be-cause the iron precipitates.
By adding a strong complex forming agent, such asEDTA, DTPA, or NTA, the reaction pH range is ex-tended to the neutral pH range (6–9 or higher). Similarto Fenton’s reaction, two reactive intermediates havebeen proposed. Rahhal and Richter [9], in a study ofFe(II)–DTPA, suggested that the pH of the system isthe determining factor as to whether hydroxyl radicalsor ferryl ions are generated. They proposed that in acidmedia, the hydroxyl radical could be the reac-�(OH )tive species. However, current work of Bossman et al.[13] showed that, at low pH, electron transfer reactionsinstead of hydroxyl radicals could explain the H2O2
reaction products. At pH 7.0, the oxidizing specie inthe Fe(II)–DTPA system is not the hydroxyl radicalbut an iron-oxo specie such as ferryl ion, Fe4�. TheFe(II)–DTPA complex was oxidized to Fe(III)–DTPA. The reaction was pseudo-first order with re-spect to Fe(II)–DTPA3� with H2O2 in excess andpseudo-first order with respect to H2O2 when Fe(II)–DTPA3� was in excess. Further, it was demonstratedthat methanol added as a hydroxyl radical scavengerdid not affect the reaction rate in the excess H2O2 ex-periments, supporting the hypothesis that free radicalswere not involved [13].
The complexing properties of the iron play a sig-nificant role in the reaction mechanism. Walling et al.[3,14] demonstrated experimentally and also sup-ported with thermodynamic considerations, that a per-oxy complex is formed between the iron and hydrogenperoxide. Its formation is a result of complexationwithHO2
�. They characterized the system Fe(III)–EDTAin the presence of hydrogen peroxide and reported thatthe Fe(III)–EDTA purple peroxy complex is a catalystfor both the decomposition of hydrogen peroxide and
oxidation of organic substrates including bound andfree EDTA. Oakes and Smith [4,15] reported that thecomplex Fe(III)–EDTA–H2O2 is seven coordinatedat pH 6. It has six bonds with EDTA and one withwater. The NMR structural studies of the peroxy com-plex and the number of hydroxy species formed inalkaline media showed that, for the peroxy complex,the hydroxy group is likely to be displaced by the per-oxide group:
[Fe3�–EDTA(OH)]2� � HO2� VJ
[Fe3�–EDTA(O2)]3� � H2O (2)
[Fe3�–EDTA(OH)2]3� � HO2� VJ
[Fe3�–EDTA(OH)(O2)]4� � H2O (3)
However, NMR studies carried out by Francis etal. [2] demonstrated that HO2� displaces a carboxygroup instead of a water molecule. Additionally,[Fe3�–EDTA(OH)]2� peroxy complexes may react toform [Fe3�–EDTA(OH)(HO2)]3�. The following in-termediate steps in the decomposition of the hydrogenperoxide and formation of free radicals were proposed:
�3� 2� �Fe –EDTA(OH) � HO VJ2�)3� (4)�2�Fe –EDTA(OH)(HO2
Fe2�–EDTA(OH)(HO2�)3� VJ�
Fe2�–EDTA(OH)3� � O2� � H� (5)�
Whether or not hydroxyl radicals or ferryl ion in-termediates are produced is still not clear. However, itis demonstrated that complex formation between theiron catalyst and hydrogen peroxide is most likely therate-determining step [2,16,17]. Therefore, a kineticmodel of the hydrogen peroxide decomposition, cat-alyzed by free and complexed iron, over the pH rangefrom 3 to 10, is proposed in this investigation.
EXPERIMENTAL METHODS
All experiments were carried out in batch reactors. Er-lenmeyer flasks (250 ml) were charged with 100 mlsolution and agitated in a circular shaker (Innova1000) running at 250 rpm.
Reagents
Hydrogen peroxide was prepared as 50,000 mg/dm3
stock solution (5%) from reagent grade H2O2 (FisherScientific). Reagent grade ferrous sulfate (FeSO4·6H2O) and ferric sulfate (Fe2 (SO4)3·6H2O) were usedto prepare 0.01 M stock solutions. The DTPA, EDTA,EGTA, and NTA were reagent grade (Aldrich GoldLabel); and were prepared as 0.025 M stock solutions.
26 TACHIEV, ROTH, AND BOWERS
JCK(Wiley) LEFT INTERACTIVE
shortstandardlong
The initial concentrations of hydrogen peroxide,Fe(II), Fe(III), Fe(II)–L, Fe(III)–L were varied overa range of pH. During each experimental run the con-centration of hydrogen peroxide and the total organiccontent were measured. The pH was controlled within�0.25 pH units by addition of HCl or NaOH. Allreactions were run at ambient temperature (22.5�1�C).
Catalysis by Free Iron
First, 50–70 ml of distilled water was added to a 100-ml volumetric flask. Next, the required amount of ironstock solution was added. Additional distilled waterwas added and the pH was adjusted to the requiredstarting value. Finally, H2O2 was added, initializingthe reaction, and the reaction mixture was transferredto the flasks.
Catalysis by Complexed Iron
First, 50–70 ml of distilled water was added to a 100-ml volumetric flask. Next, the required amount ofcomplex-forming stock solution was added, followedby the appropriate iron stock solution. Distilled waterwas added and the pH was adjusted to the requiredstarting value. Finally, H2O2 was added, initializingthe reaction, and the reaction mixture was transferredto the flasks.
Analytical Methods
Hydrogen peroxide was measured using the Ti(IV)–H2O2 complex. A Hitachi D100 spectrophotometerwas used to measure the absorbance of the complex at400 nm. The samples were premixed with excess ti-tanium sulfate solution in sulfuric acid (0.01 N). Otherinvestigators have used this method and a detectionlimit of 2 mg/liter (extinction coefficient� 754 dm3
M�1 cm�1) has been reported [2,18]. Dilutions wereused to bring the samples into the linear range (2–30mg/liter). Interference at 400 nm was not observed forFe(II)/Fe(III) or any of the Fe–L complexes used,based on analysis of samples spiked with the com-plexes.
The mineralization of the complexed ligand cata-lysts, such as EDTA, was measured by loss of dis-solved total organic carbon (TOC) using a ShimadzuTOC-500 analyzer.
MODEL DEVELOPMENT AND RESULTS
Kinetic models were developed for the reactions offree and complexed iron species, respectively. A va-
riety of oxidation products form as the reaction pro-ceeds, including various oxidation states of iron andother forms of the complex-forming agents. Therefore,the method of initial rates was used to determine thehydrogen peroxide decomposition kinetic constants.The time concentration data were numerically differ-entiated using a three-point formula based on a Taylorseries expansion [19]. The formulas were modified fornonequally spaced points.
Reactions of Hydrogen Peroxide with FreeIron, Fe(II), and Fe(III)
The results from the experiments showed that the re-actions between ferrous ions and hydrogen peroxidefollowed pseudo-first-order kinetics. The results areconsistent with those of other investigators [2,5,9,11].The radical mechanism originally proposed by Haberand Weiss [6] is based on the concept of hydroxylradicals generated as intermediates in the process ofreaction. The alternative mechanism suggests thatcomplexes between Fe(III) and H2O2 are formed andhypervalent forms of iron occur as the intermediatesin the hydrogen peroxide decomposition reaction. Theinteractions between iron and hydrogen peroxide inaqueous solution are key factors in understanding thekinetics. Complexes between iron and hydrogen per-oxide are thermodynamically possible and stabilityconstants are reported in the literature [2,3].
The mechanism proposed by other investigators[2,12,16,17] is
k1Fe(II) � H O IRJ Fe(II) � H O (6)2 2 2 2
k2
k3Fe(II) � H O 99: products� Fe (7)2 2
The rate law as proposed by previous investigators[2,12,16,17] is
d[H O ] k [Fe(II)][H O ]2 2 3 2 2� r � � � (8)dt k � [H O ]m 2 2
k � (k � k )/k (9)m 2 3 1
and, by inversion
1 k 1m� � (10)r r [H O ] rmax 2 2 max
where
r � k [Fe(II)] (11)max 3
HYDROGEN PEROXIDE DECOMPOSITION WITH IRON CATALYSTS 27
JCK(Wiley) RIGHT INTERACTIVE
shortstandardlong
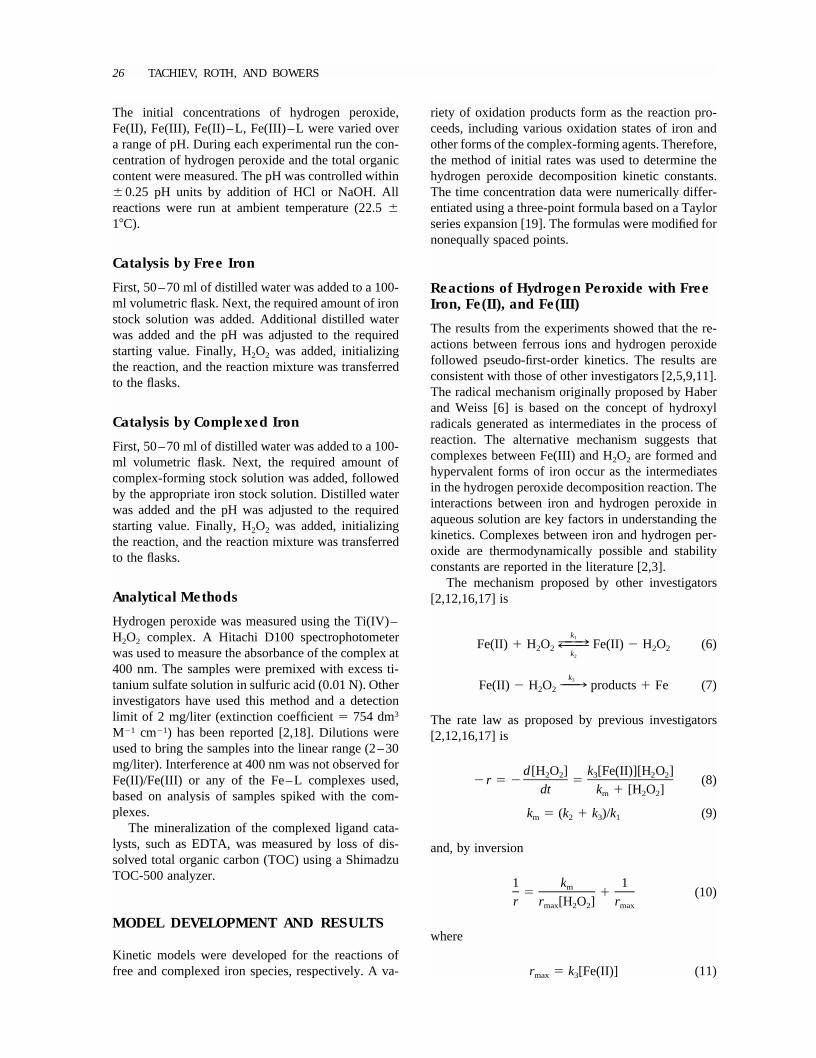
Figure 1 Initial hydrogen peroxide decomposition rate asfunction of [H2O2]0; pH � 3.5, [Fe(II)]0 � 0.00446 M.
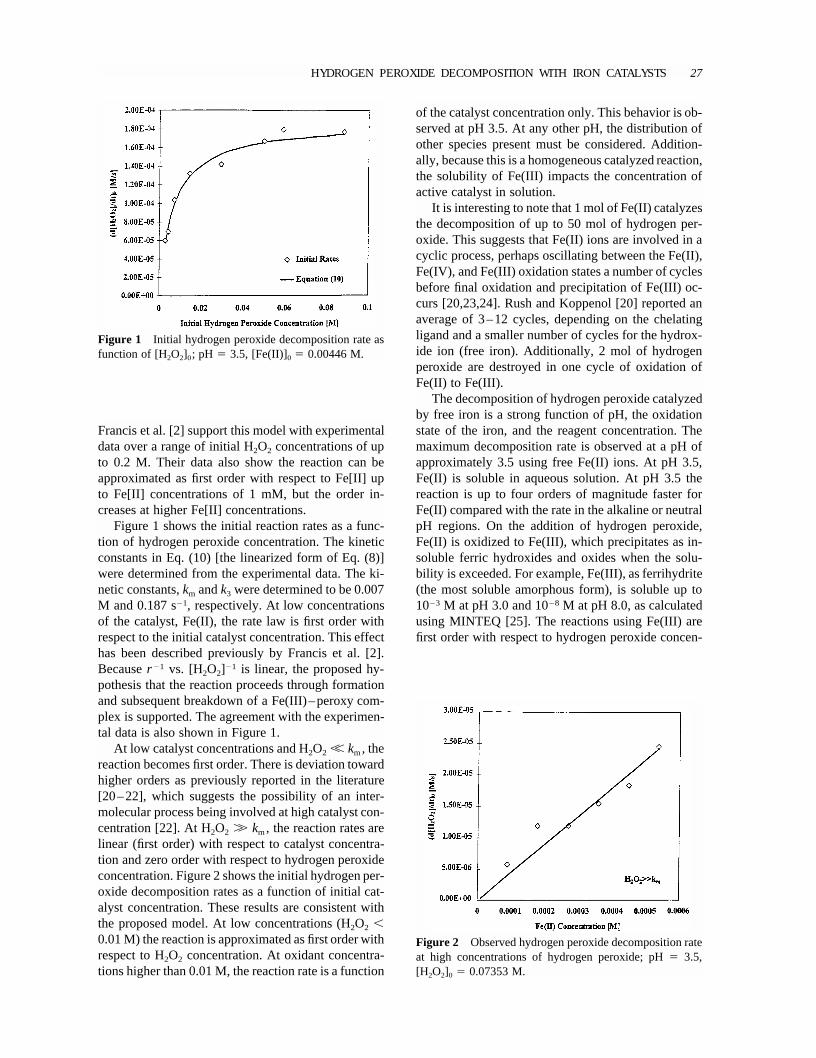
Figure 2 Observed hydrogen peroxide decomposition rateat high concentrations of hydrogen peroxide; pH� 3.5,[H2O2]0 � 0.07353 M.
Francis et al. [2] support this model with experimentaldata over a range of initial H2O2 concentrations of upto 0.2 M. Their data also show the reaction can beapproximated as first order with respect to Fe[II] upto Fe[II] concentrations of 1 mM, but the order in-creases at higher Fe[II] concentrations.
Figure 1 shows the initial reaction rates as a func-tion of hydrogen peroxide concentration. The kineticconstants in Eq. (10) [the linearized form of Eq. (8)]were determined from the experimental data. The ki-netic constants,km andk3 were determined to be 0.007M and 0.187 s�1, respectively. At low concentrationsof the catalyst, Fe(II), the rate law is first order withrespect to the initial catalyst concentration. This effecthas been described previously by Francis et al. [2].Becauser �1 vs. [H2O2]�1 is linear, the proposed hy-pothesis that the reaction proceeds through formationand subsequent breakdown of a Fe(III)–peroxy com-plex is supported. The agreement with the experimen-tal data is also shown in Figure 1.
At low catalyst concentrations and H2O2 �� km, thereaction becomes first order. There is deviation towardhigher orders as previously reported in the literature[20–22], which suggests the possibility of an inter-molecular process being involved at high catalyst con-centration [22]. At H2O2 �� km, the reaction rates arelinear (first order) with respect to catalyst concentra-tion and zero order with respect to hydrogen peroxideconcentration. Figure 2 shows the initial hydrogen per-oxide decomposition rates as a function of initial cat-alyst concentration. These results are consistent withthe proposed model. At low concentrations (H2O2 �0.01 M) the reaction is approximated as first order withrespect to H2O2 concentration. At oxidant concentra-tions higher than 0.01 M, the reaction rate is a function
of the catalyst concentration only. This behavior is ob-served at pH 3.5. At any other pH, the distribution ofother species present must be considered. Addition-ally, because this is a homogeneous catalyzed reaction,the solubility of Fe(III) impacts the concentration ofactive catalyst in solution.
It is interesting to note that 1 mol of Fe(II) catalyzesthe decomposition of up to 50 mol of hydrogen per-oxide. This suggests that Fe(II) ions are involved in acyclic process, perhaps oscillating between the Fe(II),Fe(IV), and Fe(III) oxidation states a number of cyclesbefore final oxidation and precipitation of Fe(III) oc-curs [20,23,24]. Rush and Koppenol [20] reported anaverage of 3–12 cycles, depending on the chelatingligand and a smaller number of cycles for the hydrox-ide ion (free iron). Additionally, 2 mol of hydrogenperoxide are destroyed in one cycle of oxidation ofFe(II) to Fe(III).
The decomposition of hydrogen peroxide catalyzedby free iron is a strong function of pH, the oxidationstate of the iron, and the reagent concentration. Themaximum decomposition rate is observed at a pH ofapproximately 3.5 using free Fe(II) ions. At pH 3.5,Fe(II) is soluble in aqueous solution. At pH 3.5 thereaction is up to four orders of magnitude faster forFe(II) compared with the rate in the alkaline or neutralpH regions. On the addition of hydrogen peroxide,Fe(II) is oxidized to Fe(III), which precipitates as in-soluble ferric hydroxides and oxides when the solu-bility is exceeded. For example, Fe(III), as ferrihydrite(the most soluble amorphous form), is soluble up to10�3 M at pH 3.0 and 10�8 M at pH 8.0, as calculatedusing MINTEQ [25]. The reactions using Fe(III) arefirst order with respect to hydrogen peroxide concen-
28 TACHIEV, ROTH, AND BOWERS
JCK(Wiley) LEFT INTERACTIVE
shortstandardlong
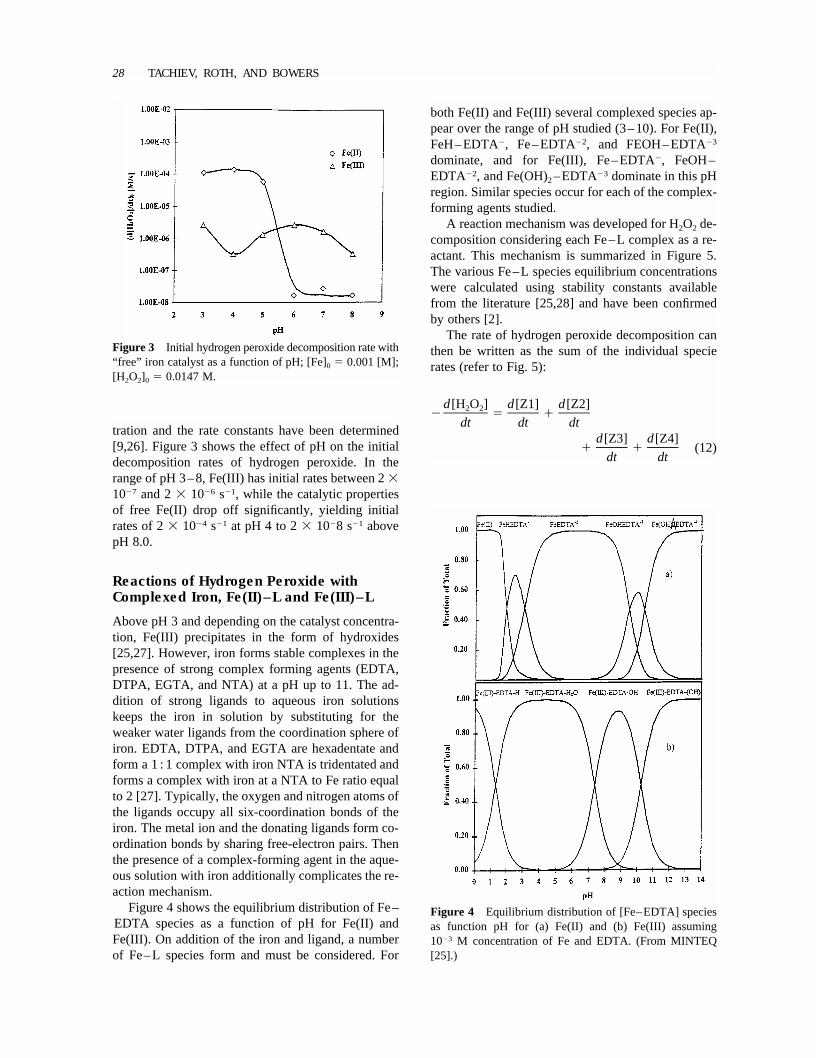
Figure 4 Equilibrium distribution of [Fe–EDTA] speciesas function pH for (a) Fe(II) and (b) Fe(III) assuming10�3 M concentration of Fe and EDTA. (From MINTEQ[25].)
Figure 3 Initial hydrogen peroxide decomposition rate with“free” iron catalyst as a function of pH; [Fe]0 � 0.001 [M];[H2O2]0 � 0.0147 M.
tration and the rate constants have been determined[9,26]. Figure 3 shows the effect of pH on the initialdecomposition rates of hydrogen peroxide. In therange of pH 3–8, Fe(III) has initial rates between 2�10�7 and 2� 10�6 s�1, while the catalytic propertiesof free Fe(II) drop off significantly, yielding initialrates of 2� 10�4 s�1 at pH 4 to 2� 10�8 s�1 abovepH 8.0.
Reactions of Hydrogen Peroxide withComplexed Iron, Fe(II)–L and Fe(III)–L
Above pH 3 and depending on the catalyst concentra-tion, Fe(III) precipitates in the form of hydroxides[25,27]. However, iron forms stable complexes in thepresence of strong complex forming agents (EDTA,DTPA, EGTA, and NTA) at a pH up to 11. The ad-dition of strong ligands to aqueous iron solutionskeeps the iron in solution by substituting for theweaker water ligands from the coordination sphere ofiron. EDTA, DTPA, and EGTA are hexadentate andform a 1 : 1 complex with iron NTA is tridentated andforms a complex with iron at a NTA to Fe ratio equalto 2 [27]. Typically, the oxygen and nitrogen atoms ofthe ligands occupy all six-coordination bonds of theiron. The metal ion and the donating ligands form co-ordination bonds by sharing free-electron pairs. Thenthe presence of a complex-forming agent in the aque-ous solution with iron additionally complicates the re-action mechanism.
both Fe(II) and Fe(III) several complexed species ap-pear over the range of pH studied (3–10). For Fe(II),FeH–EDTA�, Fe–EDTA�2, and FEOH–EDTA�3
dominate, and for Fe(III), Fe–EDTA�, FeOH–EDTA�2, and Fe(OH)2–EDTA�3 dominate in this pHregion. Similar species occur for each of the complex-forming agents studied.
A reaction mechanism was developed for H2O2 de-composition considering each Fe–L complex as a re-actant. This mechanism is summarized in Figure 5.The various Fe–L species equilibrium concentrationswere calculated using stability constants availablefrom the literature [25,28] and have been confirmedby others [2].
The rate of hydrogen peroxide decomposition canthen be written as the sum of the individual specierates (refer to Fig. 5):
d[H O ] d[Z1] d[Z2]2 2� � �dt dt dt
d[Z3] d[Z4]� � (12)
dt dt
Figure 4 shows the equilibrium distribution of Fe–EDTA species as a function of pH for Fe(II) andFe(III). On addition of the iron and ligand, a numberof Fe–L species form and must be considered. For
HYDROGEN PEROXIDE DECOMPOSITION WITH IRON CATALYSTS 29
JCK(Wiley) RIGHT INTERACTIVE
shortstandardlong
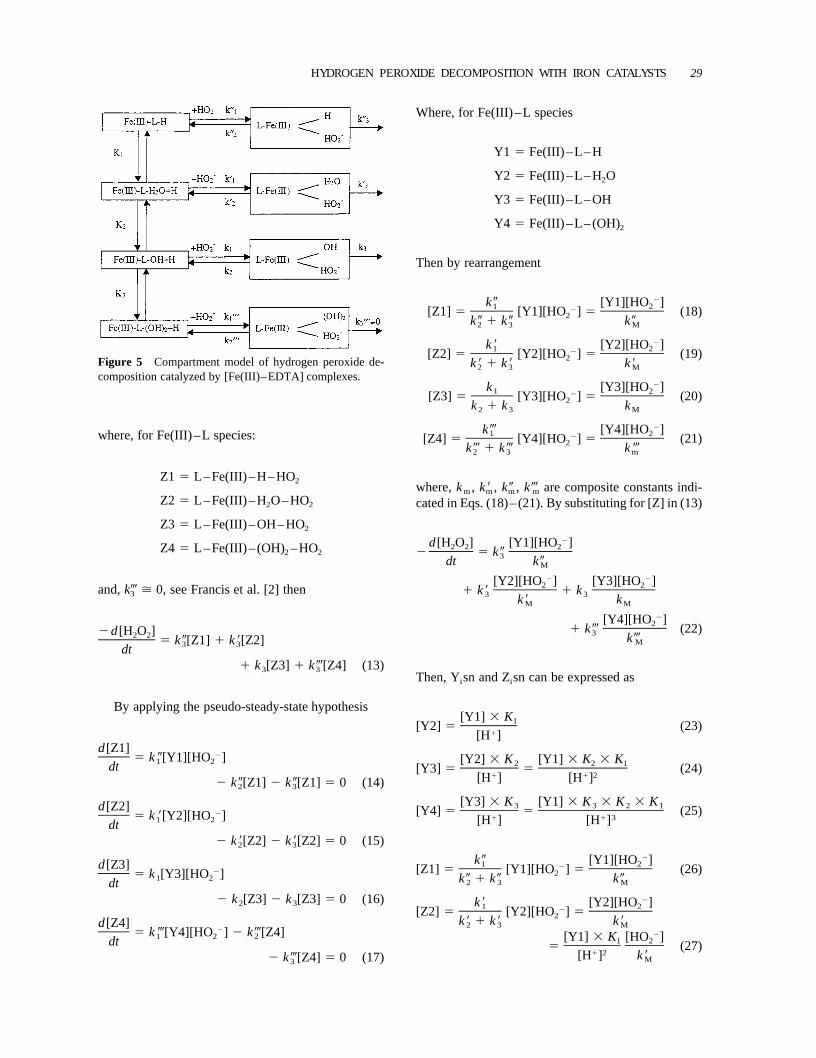
Figure 5 Compartment model of hydrogen peroxide de-composition catalyzed by [Fe(III)–EDTA] complexes.
where, for Fe(III)–L species:
Z1 � L–Fe(III)–H–HO2
Z2 � L–Fe(III)–H O–HO2 2
Z3 � L–Fe(III)–OH–HO2
Z4 � L–Fe(III)– (OH) –HO2 2
and,k3� � 0, see Francis et al. [2] then
�d[H O ]2 2 � k[Z1] � k[Z2]3 3dt� k [Z3] � k�[Z4] (13)3 3
By applying the pseudo-steady-state hypothesis
d[Z1]�� k [Y1][HO ]1 2dt� k[Z1] � k[Z1] � 0 (14)2 3
d[Z2]�� k [Y2][HO ]1 2dt� k[Z2] � k[Z2] � 0 (15)2 3
d[Z3]�� k [Y3][HO ]1 2dt� k [Z3] � k [Z3] � 0 (16)2 3
d[Z4]�� k �[Y4][HO ] � k�[Z4]1 2 2dt
� k�[Z4] � 0 (17)3
Where, for Fe(III)–L species
Y1 � Fe(III)–L–H
Y2 � Fe(III)–L–H O2
Y3 � Fe(III)–L–OH
Y4 � Fe(III)–L–(OH)2
Then by rearrangement
�k [Y1][HO ]1 2�[Z1] � [Y1][HO ] � (18)2k � k k2 3 M
�k [Y2][HO ]1 2�[Z2] � [Y2][HO ] � (19)2k � k k2 3 M
�k [Y3][HO ]1 2�[Z3] � [Y3][HO ] � (20)2k � k k2 3 M
�k� [Y4][HO ]1 2�[Z4] � [Y4][HO ] � (21)2k� � k� k �2 3 m
where,km, km, km, k�m are composite constants indi-cated in Eqs. (18)–(21). By substituting for [Z] in (13)
�d[H O ] [Y1][HO ]2 2 2� � k3dt kM� �[Y2][HO ] [Y3][HO ]2 2� k � k3 3k kM M
�[Y4][HO ]2� k� (22)3 k�M
Then, Yisn and Zisn can be expressed as
[Y1] � K1[Y2] � (23)�[H ]
[Y2] � K [Y1] � K � K2 2 1[Y3] � � (24)� � 2[H ] [H ]
[Y3] � K [Y1] � K � K � K3 3 2 1[Y4] � � (25)� � 3[H ] [H ]
�k [Y1][HO ]1 2�[Z1] � [Y1][HO ] � (26)2k � k k2 3 M
�k [Y2][HO ]1 2�[Z2] � [Y2][HO ] �2k � k k2 3 M�[Y1] � K [HO ]1 2� (27)
� 2[H ] kM
30 TACHIEV, ROTH, AND BOWERS
JCK(Wiley) LEFT INTERACTIVE
shortstandardlong
�k [Y3][HO ]1 2�[Z3] � [Y3][HO ] �2k � k k2 3 M
�[Y1] � K � K [HO ]2 1 2� (28)� 2[H ] kM
�k� [Y4][HO ]1 2�[Z4] � [Y4][HO ] �2k� � k� k�2 3 M
�[Y1] K � K � K [HO ]3 2 1 2� (29)� 3[H ] k�M
The total amount of catalyst, FeT, is then equal tothe sum of the Fe(III) species
Fe � Y1 � Y2 � Y3 � Y4T
� Z1 � Z2 � Z3 � Z4 (30)
By expressing all species as a function of Y1,we get
�[Y1] � K [Y1] � K � K [Y1] � K � K � K [Y1][HO ]1 2 1 3 2 1 2Fe � Y1 � � � �T � � 2 � 3[H ] [H ] [H ] kM
(31)� � �[Y1] � K [HO ] [Y1] � K � K [HO ] [Y1] � K � K � K [HO ]1 2 2 1 2 3 2 1 2� � �
� 2 � 2 � 3[H ] k [H ] k [H ] k�M M M
Then Y1 can be expressed as
Y1 �
FeT� � �K K � K K � K � K [HO ] K [HO ] K � K [HO ] K � K � K1 2 1 3 2 1 2 1 2 2 1 2 3 2 11 � � � � � � �
� � 2 � 3 � 2 � 2 � 3[H ] [H ] [H ] k [H ] k [H ] k [H ]M M M
(32)�[HO ]2�
k�m
The reaction law can be expressed using the totalconcentration of catalyst FeT, substituting for Y1, anddefining the following:
K K � K K � K � K1 2 1 3 2 1A � 1 � � � (33)� � 2 � 3[H ] [H ] [H ]
� �[HO ] K [HO ]2 1 2B � ��k [H ] kM M
� �K � K [HO ] K � K � K [HO ]2 1 2 3 2 1 2� � (34)� 2 � 3[H ] k [H ] k�M m
k K k K � K k3 1 3 2 1 3C � � � (35)� � 2k [H ] k [H ] kM M M
Based on acid–base equilibrium the HO2� concen-
tration can be approximated at pH� 10 �(pKH O2 2
11.65 [29]) as
K � [H O ]H O 2 22 2�[HO ] � (36)2 �[H ]
Then
d[H O ] CFe [H O ] K2 2 T 2 2 H O2 2� (37)� ��dt K [H ]H O2 2A � B[H O ]2 2 �[H ]
By multiplying the denominator and numerator ofEq. (37) by H�/K :H O2 2
d[H O ] CFe [H O ]2 2 T 2 2r � � � (38)�dt [H ]
A � B[H O ]2 2KH O2 2
Then, by multiplying the denominator and numer-ator by 1/B, Eq. (38) becomes
CFe [H O ]T 2 2B
r � (39)�A [H ]
� [H O ]2 2B KH O2 2
HYDROGEN PEROXIDE DECOMPOSITION WITH IRON CATALYSTS 31
JCK(Wiley) RIGHT INTERACTIVE
shortstandardlong
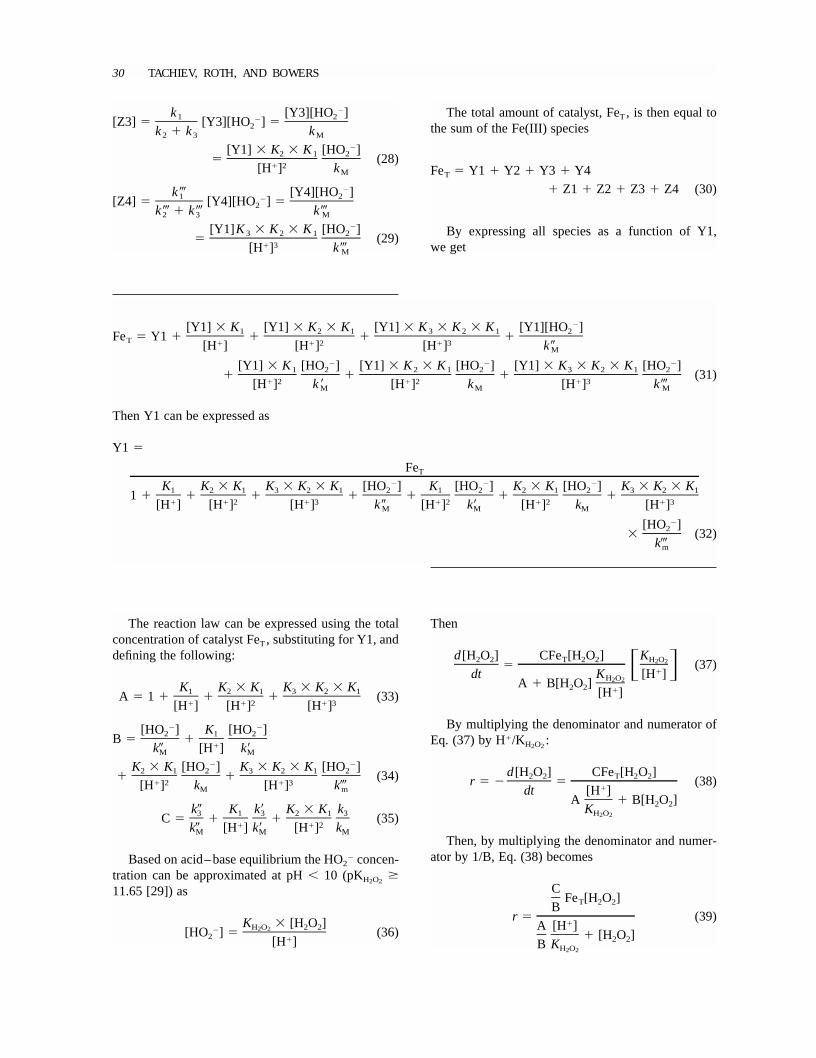
Figure 6 Initial rates of hydrogen peroxide decompositionvs. [H2O2]0 at pH 5, and comparison with the model [Eq.(42)], [Fe(II)–L]0 � 0.001 M.
Figure 7 Initial rates of hydrogen peroxide decompositionvs. [H2O2]0 at pH 9 and comparison with the model [Eq.(42)] [Fe(III)–L]0 � 0.001 M.
Figure 8 Initial rates of hydrogen peroxide decompositionvs. [H2O2]0 at pH 10 and comparison with the model [Eq.(42)] [Fe(III)–L]0 � 0.001 M.
Additionally, the following substitutions are intro-duced.
C� � (40)
B
�A [H ]� � (41)
B KH O2 2
Then
d[H O ] �Fe [H O ]2 2 T 2 2r � � � (42)dt � � [H O ]2 2
As the concentration of the substrate increases, the rateapproaches a maximum
r � �Fe (43)max T
By inverting Equation (42), the following expres-sion was used to obtain the values for� and�:
1 � 1� �
r �Fe [H O ] �Fe0 T 2 2 T
� 1� � (44)
r [H O ] rmax 2 2 max
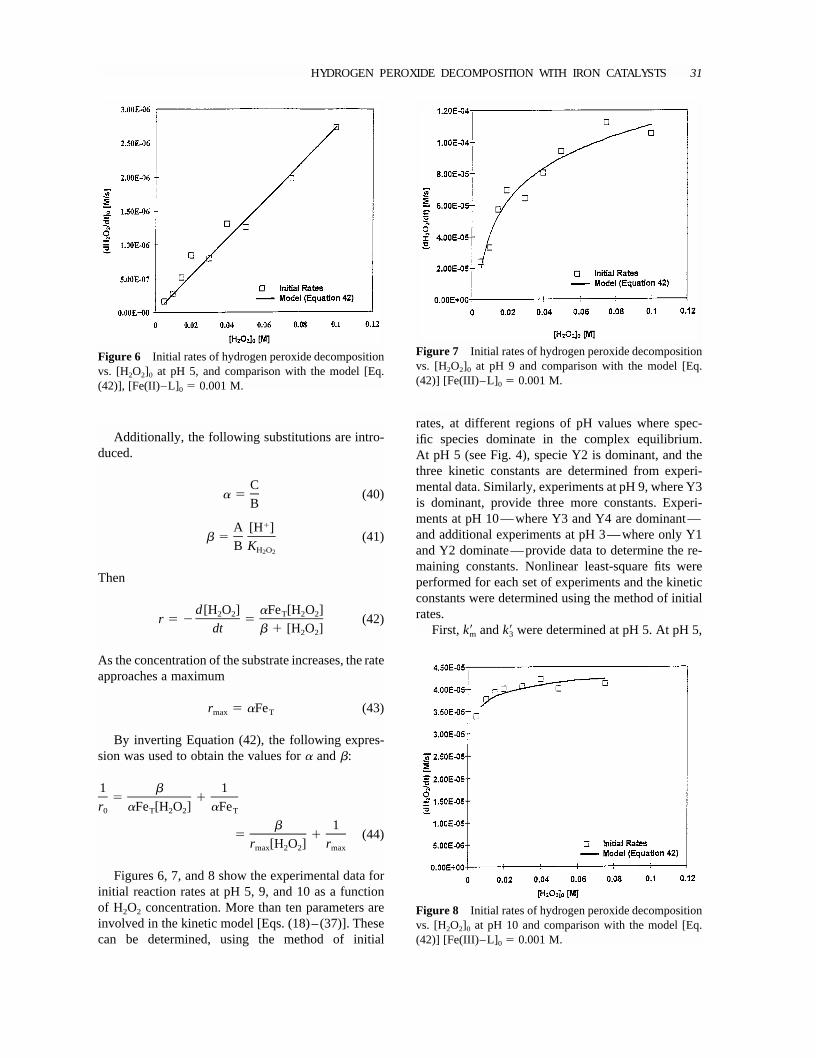
Figures 6, 7, and 8 show the experimental data forinitial reaction rates at pH 5, 9, and 10 as a functionof H2O2 concentration. More than ten parameters areinvolved in the kinetic model [Eqs. (18)–(37)]. Thesecan be determined, using the method of initial
rates, at different regions of pH values where spec-ific species dominate in the complex equilibrium.At pH 5 (see Fig. 4), specie Y2 is dominant, and thethree kinetic constants are determined from experi-mental data. Similarly, experiments at pH 9, where Y3is dominant, provide three more constants. Experi-ments at pH 10—where Y3 and Y4 are dominant—and additional experiments at pH 3—where only Y1and Y2 dominate—provide data to determine the re-maining constants. Nonlinear least-square fits wereperformed for each set of experiments and the kineticconstants were determined using the method of initialrates.
First,km andk3 were determined at pH 5. At pH 5,
32 TACHIEV, ROTH, AND BOWERS
JCK(Wiley) LEFT INTERACTIVE
shortstandardlong
Table I Summary of Experimentally Determined Rate Constants at pH 7 for Complexed Iron Catalysis Comparedwith Fe(III)–L Stability Constants [26]
NTA EDTA EGTA DTPA
log KmLa 15.9 25.1 20.5 28
k3 0.37 0.13 0.15 0.12k3 0.5 0.20 0.26 0.09k3 0.8 0.3 0.513 0.15km 3E-05 1E-03 7E-04 0.007km 8E-07 2E-06 1E-06 8E-07km 7E-09 3E-09 1E-08 3E-07k�m 1E-05 2.65E-5 1.64E-5 3.33E-5
aEquilibrium stability constants for formation of Fe(III)–LL species [28]; KML � [Fe(III)–EDTA]/([Fe(III)][EDTA]).
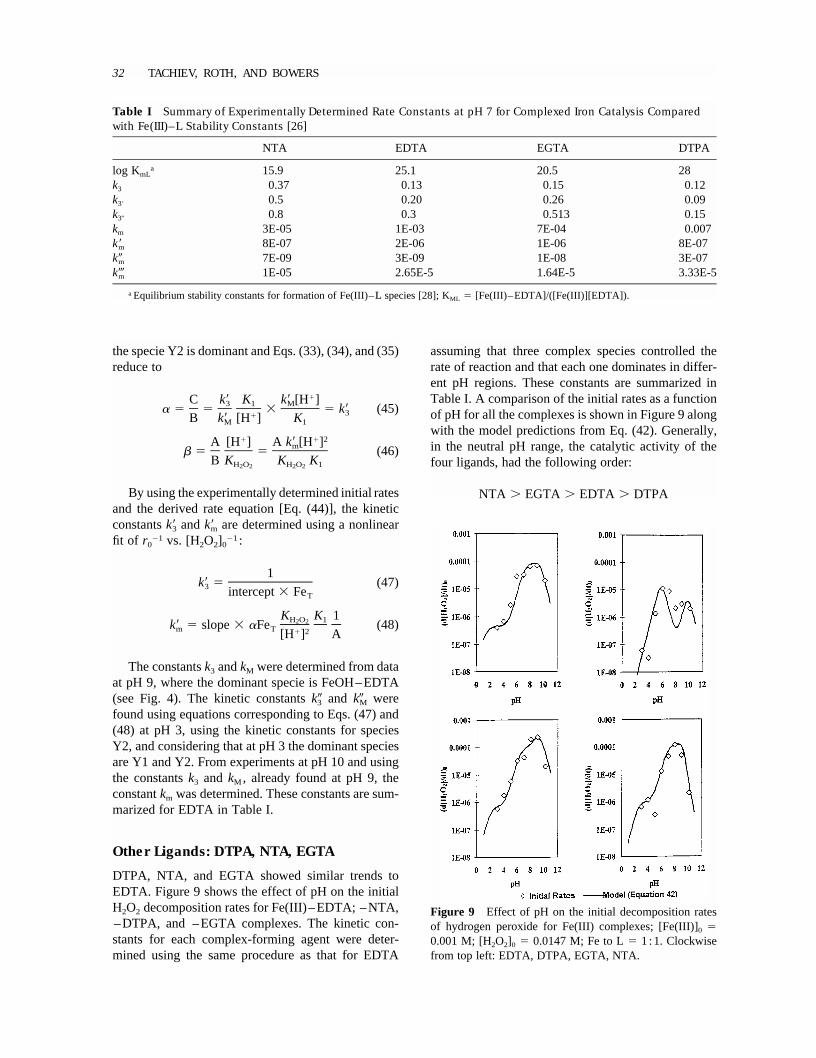
Figure 9 Effect of pH on the initial decomposition ratesof hydrogen peroxide for Fe(III) complexes; [Fe(III)]0 �0.001 M; [H2O2]0 � 0.0147 M; Fe to L� 1 :1. Clockwisefrom top left: EDTA, DTPA, EGTA, NTA.
the specie Y2 is dominant and Eqs. (33), (34), and (35)reduce to
�C k K k [H ]3 1 M� � � � � k (45)3�B k [H ] KM 1
� � 2A [H ] A k [H ]m� � � (46)B K K KH O H O 12 2 2 2
By using the experimentally determined initial ratesand the derived rate equation [Eq. (44)], the kineticconstantsk3 andkm are determined using a nonlinearfit of r0�1 vs. [H2O2]0�1:
1k � (47)3 intercept� FeT
K K 1H O 12 2k � slope� �Fe (48)m T � 2[H ] A
The constantsk3 andkM were determined from dataat pH 9, where the dominant specie is FeOH–EDTA(see Fig. 4). The kinetic constantsk3 and kM werefound using equations corresponding to Eqs. (47) and(48) at pH 3, using the kinetic constants for speciesY2, and considering that at pH 3 the dominant speciesare Y1 and Y2. From experiments at pH 10 and usingthe constantsk3 and kM , already found at pH 9, theconstantkm was determined. These constants are sum-marized for EDTA in Table I.
Other Ligands: DTPA, NTA, EGTA
DTPA, NTA, and EGTA showed similar trends toEDTA. Figure 9 shows the effect of pH on the initialH2O2 decomposition rates for Fe(III)–EDTA; –NTA,–DTPA, and –EGTA complexes. The kinetic con-stants for each complex-forming agent were deter-mined using the same procedure as that for EDTA
assuming that three complex species controlled therate of reaction and that each one dominates in differ-ent pH regions. These constants are summarized inTable I. A comparison of the initial rates as a functionof pH for all the complexes is shown in Figure 9 alongwith the model predictions from Eq. (42). Generally,in the neutral pH range, the catalytic activity of thefour ligands, had the following order:
NTA � EGTA � EDTA � DTPA
HYDROGEN PEROXIDE DECOMPOSITION WITH IRON CATALYSTS 33
JCK(Wiley) RIGHT INTERACTIVE
shortstandardlong
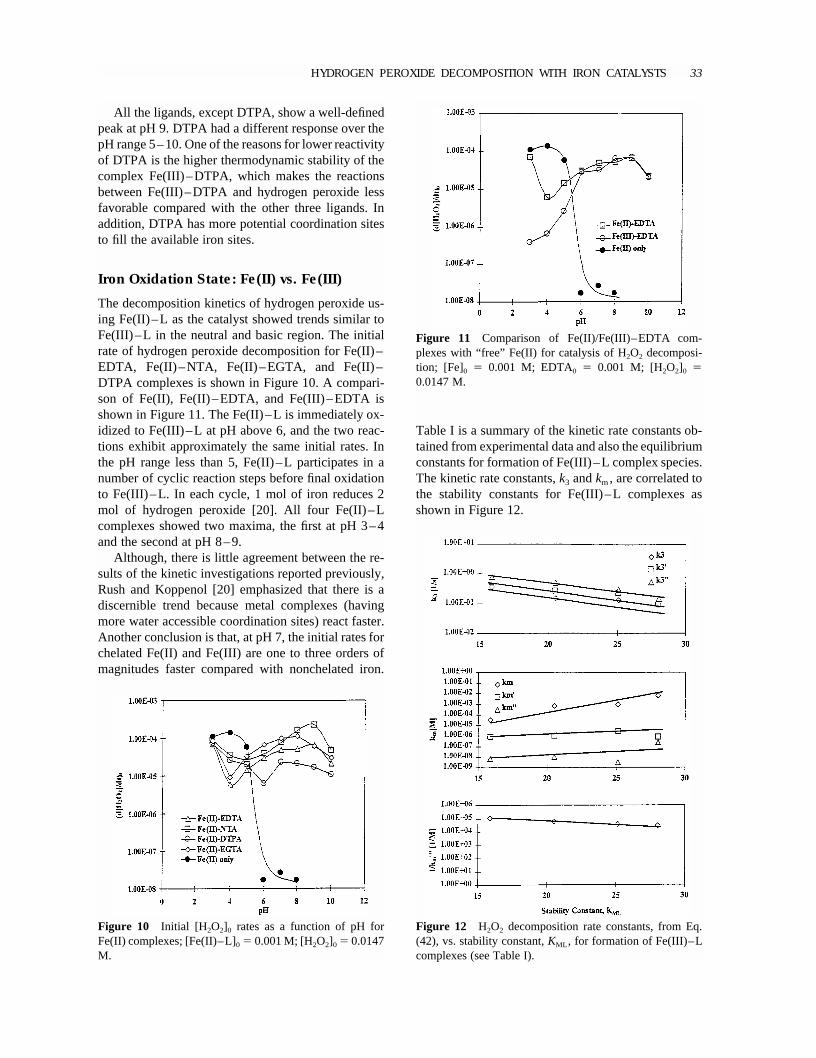
Figure 11 Comparison of Fe(II)/Fe(III)–EDTA com-plexes with “free” Fe(II) for catalysis of H2O2 decomposi-tion; [Fe]0 � 0.001 M; EDTA0 � 0.001 M; [H2O2]0 �0.0147 M.
Figure 12 H2O2 decomposition rate constants, from Eq.(42), vs. stability constant,KML , for formation of Fe(III)–Lcomplexes (see Table I).
Figure 10 Initial [H2O2]0 rates as a function of pH forFe(II) complexes; [Fe(II)–L]0 � 0.001M; [H2O2]0� 0.0147M.
All the ligands, except DTPA, show a well-definedpeak at pH 9. DTPA had a different response over thepH range 5–10. One of the reasons for lower reactivityof DTPA is the higher thermodynamic stability of thecomplex Fe(III)–DTPA, which makes the reactionsbetween Fe(III)–DTPA and hydrogen peroxide lessfavorable compared with the other three ligands. Inaddition, DTPA has more potential coordination sitesto fill the available iron sites.
Iron Oxidation State: Fe(II) vs. Fe(III)
The decomposition kinetics of hydrogen peroxide us-ing Fe(II)–L as the catalyst showed trends similar toFe(III)–L in the neutral and basic region. The initialrate of hydrogen peroxide decomposition for Fe(II)–EDTA, Fe(II)–NTA, Fe(II)–EGTA, and Fe(II)–DTPA complexes is shown in Figure 10. A compari-son of Fe(II), Fe(II)–EDTA, and Fe(III)–EDTA isshown in Figure 11. The Fe(II)–L is immediately ox-idized to Fe(III)–L at pH above 6, and the two reac-tions exhibit approximately the same initial rates. Inthe pH range less than 5, Fe(II)–L participates in anumber of cyclic reaction steps before final oxidationto Fe(III)–L. In each cycle, 1 mol of iron reduces 2mol of hydrogen peroxide [20]. All four Fe(II)–Lcomplexes showed two maxima, the first at pH 3–4and the second at pH 8–9.
Although, there is little agreement between the re-sults of the kinetic investigations reported previously,Rush and Koppenol [20] emphasized that there is adiscernible trend because metal complexes (havingmore water accessible coordination sites) react faster.Another conclusion is that, at pH 7, the initial rates forchelated Fe(II) and Fe(III) are one to three orders ofmagnitudes faster compared with nonchelated iron.
Table I is a summary of the kinetic rate constants ob-tained from experimental data and also the equilibriumconstants for formation of Fe(III)–L complex species.The kinetic rate constants,k3 andkm, are correlated tothe stability constants for Fe(III)–L complexes asshown in Figure 12.
34 TACHIEV, ROTH, AND BOWERS
JCK(Wiley) LEFT INTERACTIVE
shortstandardlong
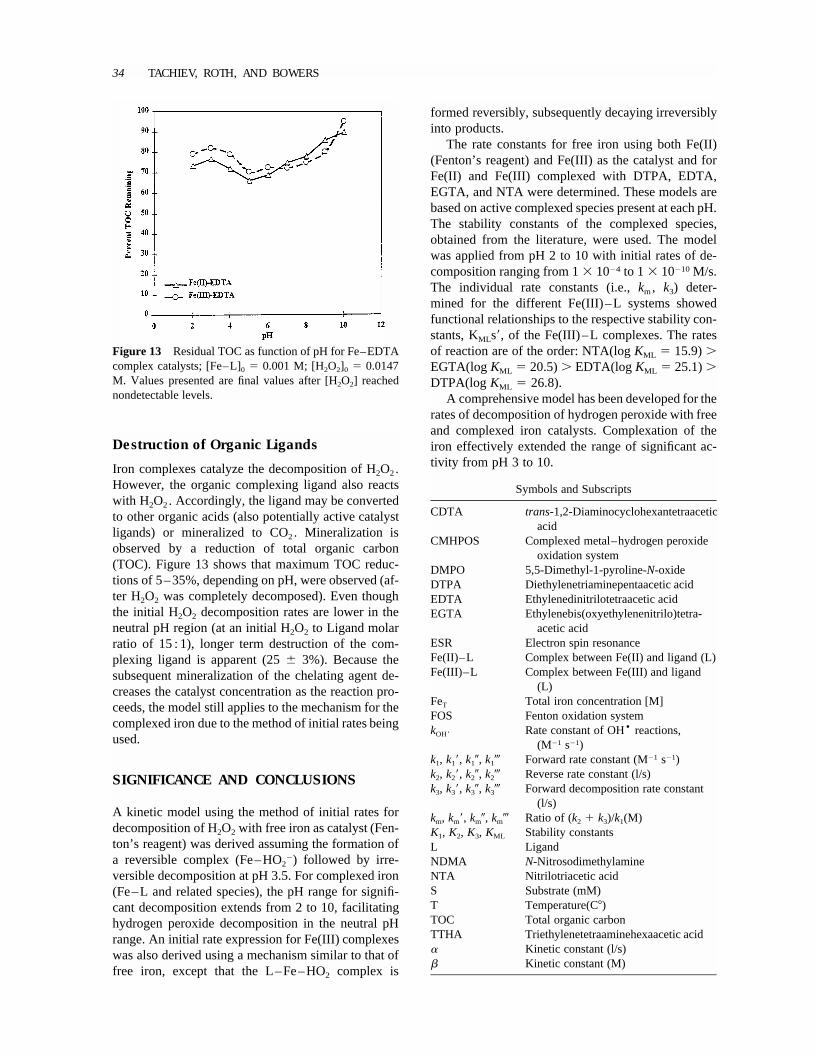
Figure 13 Residual TOC as function of pH for Fe–EDTAcomplex catalysts; [Fe–L]0 � 0.001 M; [H2O2]0 � 0.0147M. Values presented are final values after [H2O2] reachednondetectable levels.
Destruction of Organic Ligands
Iron complexes catalyze the decomposition of H2O2.However, the organic complexing ligand also reactswith H2O2. Accordingly, the ligand may be convertedto other organic acids (also potentially active catalystligands) or mineralized to CO2. Mineralization isobserved by a reduction of total organic carbon(TOC). Figure 13 shows that maximum TOC reduc-tions of 5–35%, depending on pH, were observed (af-ter H2O2 was completely decomposed). Even thoughthe initial H2O2 decomposition rates are lower in theneutral pH region (at an initial H2O2 to Ligand molarratio of 15 : 1), longer term destruction of the com-plexing ligand is apparent (25� 3%). Because thesubsequent mineralization of the chelating agent de-creases the catalyst concentration as the reaction pro-ceeds, the model still applies to the mechanism for thecomplexed iron due to the method of initial rates beingused.
SIGNIFICANCE AND CONCLUSIONS
A kinetic model using the method of initial rates fordecomposition of H2O2 with free iron as catalyst (Fen-ton’s reagent) was derived assuming the formation ofa reversible complex (Fe–HO2�) followed by irre-versible decomposition at pH 3.5. For complexed iron(Fe–L and related species), the pH range for signifi-cant decomposition extends from 2 to 10, facilitatinghydrogen peroxide decomposition in the neutral pHrange. An initial rate expression for Fe(III) complexeswas also derived using a mechanism similar to that offree iron, except that the L–Fe–HO2 complex is
formed reversibly, subsequently decaying irreversiblyinto products.
The rate constants for free iron using both Fe(II)(Fenton’s reagent) and Fe(III) as the catalyst and forFe(II) and Fe(III) complexed with DTPA, EDTA,EGTA, and NTA were determined. These models arebased on active complexed species present at each pH.The stability constants of the complexed species,obtained from the literature, were used. The modelwas applied from pH 2 to 10 with initial rates of de-composition ranging from 1� 10�4 to 1� 10�10M/s.The individual rate constants (i.e.,km, k3) deter-mined for the different Fe(III)–L systems showedfunctional relationships to the respective stability con-stants, KMLs, of the Fe(III)–L complexes. The ratesof reaction are of the order: NTA(logKML � 15.9)�EGTA(logKML � 20.5)� EDTA(logKML � 25.1)�DTPA(logKML � 26.8).
A comprehensive model has been developed for therates of decomposition of hydrogen peroxide with freeand complexed iron catalysts. Complexation of theiron effectively extended the range of significant ac-tivity from pH 3 to 10.
Symbols and Subscripts
CDTA trans-1,2-Diaminocyclohexantetraaceticacid
CMHPOS Complexed metal–hydrogen peroxideoxidation system
DMPO 5,5-Dimethyl-1-pyroline-N-oxideDTPA Diethylenetriaminepentaacetic acidEDTA Ethylenedinitrilotetraacetic acidEGTA Ethylenebis(oxyethylenenitrilo)tetra-
acetic acidESR Electron spin resonanceFe(II)–L Complex between Fe(II) and ligand (L)Fe(III)–L Complex between Fe(III) and ligand
(L)FeT Total iron concentration [M]FOS Fenton oxidation systemk DOH Rate constant of OH� reactions,
�1 �1(M s )k1, k1, k1, k1� Forward rate constant �1 �1(M s )k2, k2, k2, k2� Reverse rate constant (l/s)k3, k3, k3, k3� Forward decomposition rate constant
(l/s)km, km, km, km� Ratio of (k2 � k3)/k1(M)K1, K2, K3, KML Stability constantsL LigandNDMA N-NitrosodimethylamineNTA Nitrilotriacetic acidS Substrate (mM)T Temperature(C�)TOC Total organic carbonTTHA Triethylenetetraaminehexaacetic acid� Kinetic constant (l/s)� Kinetic constant (M)
HYDROGEN PEROXIDE DECOMPOSITION WITH IRON CATALYSTS 35
JCK(Wiley) RIGHT INTERACTIVE
shortstandardlong
BIBLIOGRAPHY
1. Bowers, A. R.; Chemical Oxidation of Toxic, Inhibi-tory, and Refractory Organics, In: Toxicity Reductionin Industrial Effluents; Eckenfelder, Jr. W. W.; Lank-ford, P. W. Eds., Van Nostrand Reinhold: New York,1990.
2. Francis, K. C.; Cummins, D.; Oakes, J. J Chem SocDalton Trans 1985, 493–501.
3. Walling, C. Acc Chem Res 1975, 8, 125–131.4. Oakes, J.; Smith, E. G. J Chem Soc Dalton Trans 1983,
601.5. Rush, J. D.; Maskos, Z.; Koppenol, W. H. Methods En-
zymol 1990, 186, 148–156.6. Haber, F.; Weiss, J. 1934, Proc R Soc A, 147, 332–351.7. Barb, W. G.; Baxendale, J. H.; George, P.; Hargrave,
H. G. Trans Faraday Soc 1951, 47, 591.8. Rush, J. D.; Koppenol, W. H. J Am Chem Soc 1988,
110, 4957–4963.9. Rahhal, S.; Richter, W. H. J Am Chem Soc 1988, 110,
3126–3133.10. Kremer, M. L.; Stein, G. Trans Farady Soc 1959, 55,
595–602.11. Kremer, M. L. Int J Chem Kin 1985, 17, 1299–1314.12. Croft, S.; Gilbert, B. C.; Smith, J. R. L.; Whitwood,
A. C. Free Rad Res Comm 1992, 17(1), 21–39.13. Bossman, S. H.; Oliveros, E.; Go¨b, S.; Siegvart, S.;
Dahlen, E. P.; Payawan, L.; Wo¨rner, M.; Braun, A. M.J Phys Chem 1998, 102, 5542–5550.
14. Walling, C.; Kurz, M.; Schugar, H. J. Inorg Chem 1970,9(4), 931–937.
15. Oakes, J.; Smith, E. G. J Chem Soc Faraday Trans 11983, 2, 543.
16. Wink, D. A.; Wink, C. B.; Nims, R. W.; Ford, P. C.Environ Health Perspectives 1994, 102(S3), 11–15.
17. Wink, D. A.; Nims, R. W.; Desrosiers, M. F.; Ford,P. C.; Keefer, L. K. Chem Res Toxicol 1991, 4(5), 510–512.
18. Eisenberg, G. M. Ind Eng Chem 1943, 15(5), 327–328.19. Fogler, H. S. Elements of Chemical Reaction Engineer-
ing; Prentice Hall: New York, 1992.20. Rush, J. D.; Koppenol, W. H. J Am Chem Soc 1988,
110, 4957–4963.21. Koppenol, W. H. Free Radical Damage and Its Control;
Elsevier: New York, 1994.22. Rush, J. D.; Maskos, Z.; Koppenol, W. H. Methods En-
zymol 1990, 186, 148–156.23. Winterbourn, C. C. Free Radical Biol 1991, 11, 353–
360.24. Winterbourn, C. C. Toxicol Lett 1995, 82(3), 969–974.25. Allison, J. D.; Brown, D. S.; Novo-Gradac, K. J. MIN-
TEQA2/PRODEFA2-A Geochemical Model for Envi-ronmental Systems, USEPA, Athens, GA, EPA/600/3-91/021, 1991.
26. Abbott, J.; Brown, D. G. Int J Chem Kin 1990, 22, 963–974.
27. Cotton, F. A.; Wilkinson, G. Advanced InorganicChemistry, 5th ed.; John Wiley & Sons: New York,1988.
28. NIST Standard Reference Data, Gaithersburg, MD20899, 1993.
29. Smith, R. M.; Martell, A. E. Critical Stability Constants,Vol. 4; Plenum Press: New York, 1981.