Embed Size (px)
Citation preview
An-Najah National University Faculty of Graduate Studies
Kinetics Of Groundwater Nitrate (NO3-1) In Soil
Leachate In Tulkarem City Using Soil Columns
By Osama Zaki Mohammed Naser
Supervised By Dr. Shehdeh Jodeh
Prof. Marwan Haddad
Submitted in Partial Fulfillment of the Requirement for the Degree of Master of science in Chemistry, Faculty of Graduate Studies, at An-Najah National University, Nablus, Palestine
2011

III
Dedication
To my mother, soul of my father God bless him, wife, children and to all my family and to everyone who helped and supported me in my research.
IV
Acknowledgement
First of all, thanks Allah for his care and grace during my work for my thesis. Allah gave me the protection during my travel crossing the dangerous check points. In hard moments, he donated me the life, and granting me the power and courage to finish my work.
Actually this thesis could not be accomplished without the faithful help of many people. First of all, I would like to deliver my deep gratitude and appreciation to my supervisors Dr. Shehdeh Jodeh for his guidance and support during my research work, as well as for his help in my thesis writing . I would like to thank Prof. Marwan Haddad in my first step in choosing the correct title and giving me the main lines for my research.
I would also like thank Dr. Riad Abed Al-Kareem Auad, Dr. Shukrey Khalaf, Prof. Basem Shorida, Ms. Ashraf Al- Salman chemical technician and all technicians in the Chemistry Department for their help and support.
I also would like to thank all technicians in the water and environment institute in the university for their help and support. I also would like to thank all technicians in the civil engineering department for their help in soil texture analysis.
Special deep gratitude and thanks to Dr. Sameer Alhasan for his encouragement and support during my study and working in thesis.
V
إقرار
:إنا الموقع أدناه مقدم الرسالة التي تحمل عنوان
Kinetics Of Groundwater Nitrate (NO3-1) In Soil
Leachate In Tulkarem City Using Soil Columns
دراسة حركة النترات باستخدام أعمدة التربة
في مياه اآلبار الجوفية لمدينة طولكرم سالة إنما هو نتاج جهدي الخاص ، باستثناء مـا تمـت اقر بان ما اشتملت عليه هذه الر
اإلشارة إليه حيثما ورد، وان هذه الرسالة ككل من أو جزء منها لم يقدم من قبل لنيل أية درجـة
.علمية أو بحث علمي أو بحثي لدى أية مؤسسة تعليمية أو بحثية أخرى
Dedication
The work provided in this thesis, unless otherwise referenced, is the
researcher's own work, and has been submitted elsewhere for any other
degree or qualification.
Student's name: ………………………………………… سم الطالب:
Signature: :التوقيع …………………………………………
Date: :التاريخ …………………………………………
VI
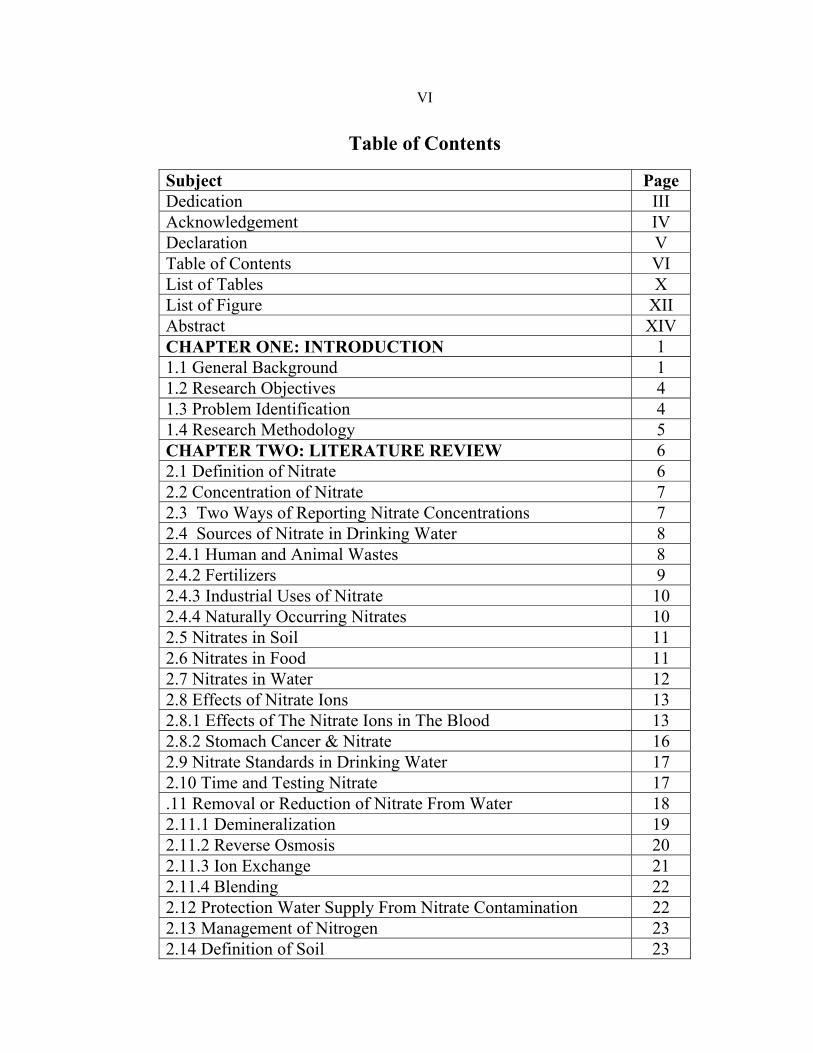
Table of Contents
Subject Page Dedication III Acknowledgement IV Declaration V Table of Contents VI List of Tables X List of Figure XII Abstract XIVCHAPTER ONE: INTRODUCTION 1 1.1 General Background 1 1.2 Research Objectives 4 1.3 Problem Identification 4 1.4 Research Methodology 5 CHAPTER TWO: LITERATURE REVIEW 6 2.1 Definition of Nitrate 6 2.2 Concentration of Nitrate 72.3 Two Ways of Reporting Nitrate Concentrations 7 2.4 Sources of Nitrate in Drinking Water 8 2.4.1 Human and Animal Wastes 82.4.2 Fertilizers 9 2.4.3 Industrial Uses of Nitrate 10 2.4.4 Naturally Occurring Nitrates 10 2.5 Nitrates in Soil 11 2.6 Nitrates in Food 11 2.7 Nitrates in Water 12 2.8 Effects of Nitrate Ions 13 2.8.1 Effects of The Nitrate Ions in The Blood 13 2.8.2 Stomach Cancer & Nitrate 16 2.9 Nitrate Standards in Drinking Water 17 2.10 Time and Testing Nitrate 17 .11 Removal or Reduction of Nitrate From Water 18 2.11.1 Demineralization 19 2.11.2 Reverse Osmosis 20 2.11.3 Ion Exchange 21 2.11.4 Blending 22 2.12 Protection Water Supply From Nitrate Contamination 22 2.13 Management of Nitrogen 23 2.14 Definition of Soil 23
VII
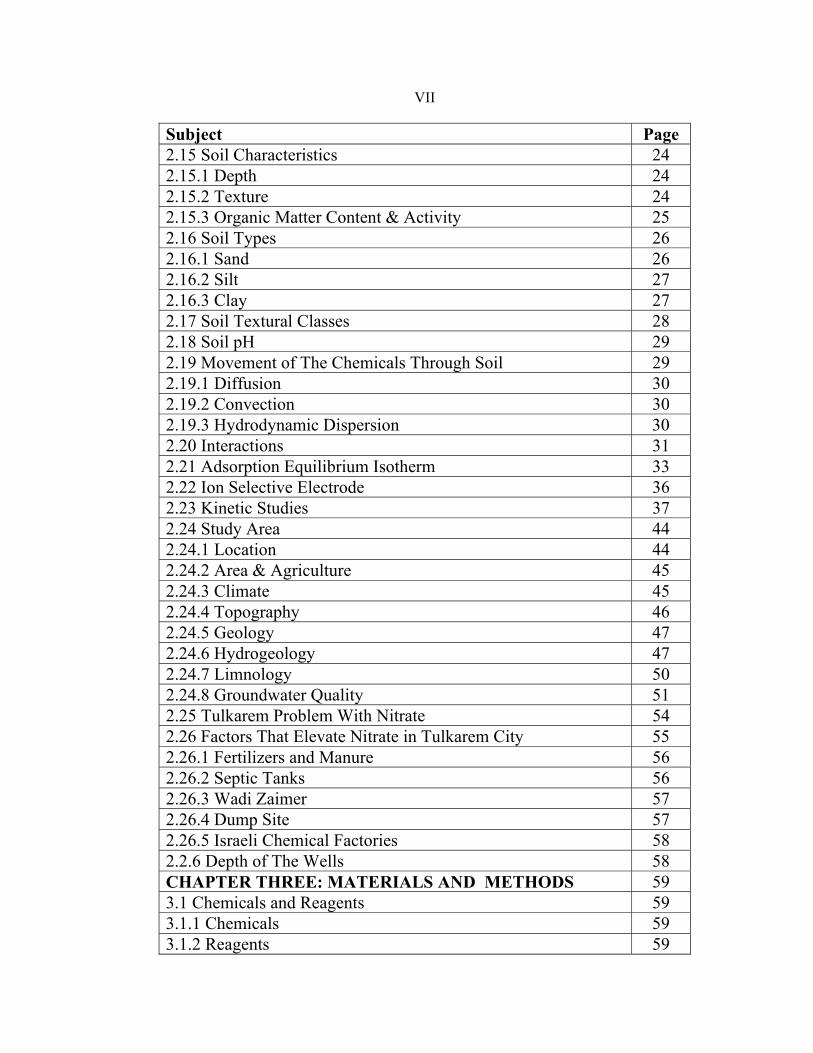
Subject Page 2.15 Soil Characteristics 24 2.15.1 Depth 24 2.15.2 Texture 242.15.3 Organic Matter Content & Activity 25 2.16 Soil Types 26 2.16.1 Sand 26 2.16.2 Silt 27 2.16.3 Clay 27 2.17 Soil Textural Classes 28 2.18 Soil pH 29 2.19 Movement of The Chemicals Through Soil 292.19.1 Diffusion 30 2.19.2 Convection 30 2.19.3 Hydrodynamic Dispersion 30 2.20 Interactions 31 2.21 Adsorption Equilibrium Isotherm 33 2.22 Ion Selective Electrode 36 2.23 Kinetic Studies 37 2.24 Study Area 442.24.1 Location 44 2.24.2 Area & Agriculture 45 2.24.3 Climate 452.24.4 Topography 46 2.24.5 Geology 47 2.24.6 Hydrogeology 47 2.24.7 Limnology 50 2.24.8 Groundwater Quality 51 2.25 Tulkarem Problem With Nitrate 54 2.26 Factors That Elevate Nitrate in Tulkarem City 55 2.26.1 Fertilizers and Manure 562.26.2 Septic Tanks 56 2.26.3 Wadi Zaimer 57 2.26.4 Dump Site 57 2.26.5 Israeli Chemical Factories 58 2.2.6 Depth of The Wells 58 CHAPTER THREE: MATERIALS AND METHODS 59 3.1 Chemicals and Reagents 59 3.1.1 Chemicals 59 3.1.2 Reagents 59
VIII
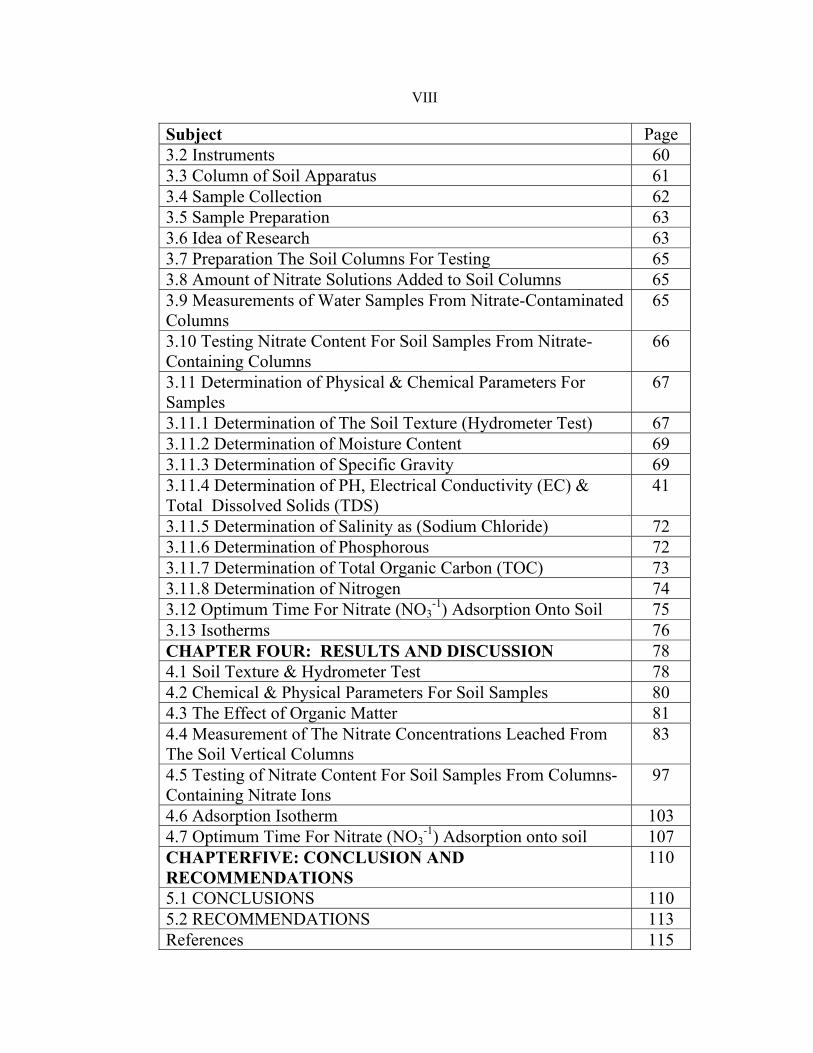
Subject Page3.2 Instruments 60 3.3 Column of Soil Apparatus 61 3.4 Sample Collection 623.5 Sample Preparation 63 3.6 Idea of Research 63 3.7 Preparation The Soil Columns For Testing 65 3.8 Amount of Nitrate Solutions Added to Soil Columns 65 3.9 Measurements of Water Samples From Nitrate-Contaminated Columns
65
3.10 Testing Nitrate Content For Soil Samples From Nitrate-Containing Columns
66
3.11 Determination of Physical & Chemical Parameters For Samples
67
3.11.1 Determination of The Soil Texture (Hydrometer Test) 67 3.11.2 Determination of Moisture Content 69 3.11.3 Determination of Specific Gravity 69 3.11.4 Determination of PH, Electrical Conductivity (EC) & Total Dissolved Solids (TDS)
41
3.11.5 Determination of Salinity as (Sodium Chloride) 723.11.6 Determination of Phosphorous 72 3.11.7 Determination of Total Organic Carbon (TOC) 73 3.11.8 Determination of Nitrogen 74 3.12 Optimum Time For Nitrate (NO3
-1) Adsorption Onto Soil 75 3.13 Isotherms 76 CHAPTER FOUR: RESULTS AND DISCUSSION 78 4.1 Soil Texture & Hydrometer Test 78 4.2 Chemical & Physical Parameters For Soil Samples 804.3 The Effect of Organic Matter 81 4.4 Measurement of The Nitrate Concentrations Leached From The Soil Vertical Columns
83
4.5 Testing of Nitrate Content For Soil Samples From Columns-Containing Nitrate Ions
97
4.6 Adsorption Isotherm 103 4.7 Optimum Time For Nitrate (NO3
-1) Adsorption onto soil 107 CHAPTERFIVE: CONCLUSION AND RECOMMENDATIONS
110
5.1 CONCLUSIONS 110 5.2 RECOMMENDATIONS 113 References 115

IX
Subject PageAppendices 127
Appendix 1.1 127 Appendix 1.2 133 Appendix 1.3 134
ب الملخص بالعربية
X
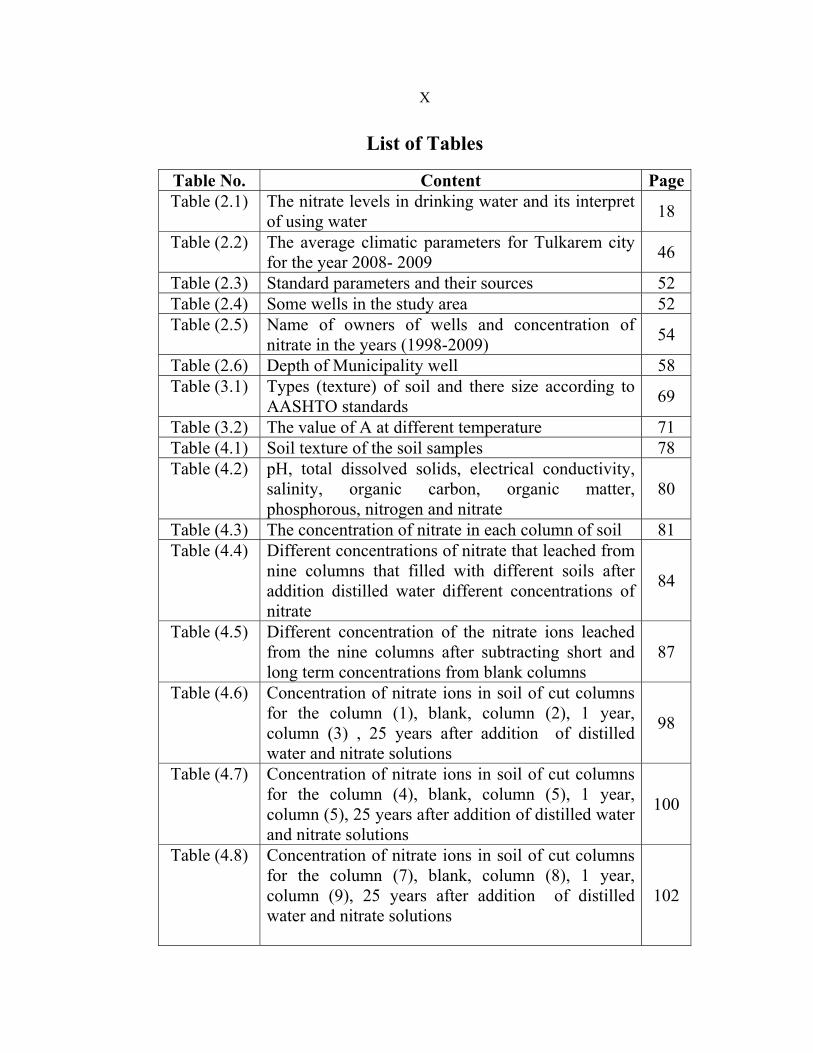
List of Tables
Table No. Content PageTable (2.1) The nitrate levels in drinking water and its interpret
of using water 18
Table (2.2) The average climatic parameters for Tulkarem city for the year 2008- 2009 46
Table (2.3) Standard parameters and their sources 52 Table (2.4) Some wells in the study area 52 Table (2.5) Name of owners of wells and concentration of
nitrate in the years (1998-2009) 54
Table (2.6) Depth of Municipality well 58 Table (3.1) Types (texture) of soil and there size according to
AASHTO standards 69
Table (3.2) The value of A at different temperature 71 Table (4.1) Soil texture of the soil samples 78 Table (4.2) pH, total dissolved solids, electrical conductivity,
salinity, organic carbon, organic matter, phosphorous, nitrogen and nitrate
80
Table (4.3) The concentration of nitrate in each column of soil 81 Table (4.4) Different concentrations of nitrate that leached from
nine columns that filled with different soils after addition distilled water different concentrations of nitrate
84
Table (4.5) Different concentration of the nitrate ions leached from the nine columns after subtracting short and long term concentrations from blank columns
87
Table (4.6) Concentration of nitrate ions in soil of cut columns for the column (1), blank, column (2), 1 year, column (3) , 25 years after addition of distilled water and nitrate solutions
98
Table (4.7) Concentration of nitrate ions in soil of cut columns for the column (4), blank, column (5), 1 year, column (5), 25 years after addition of distilled water and nitrate solutions
100
Table (4.8) Concentration of nitrate ions in soil of cut columns for the column (7), blank, column (8), 1 year, column (9), 25 years after addition of distilled water and nitrate solutions
102
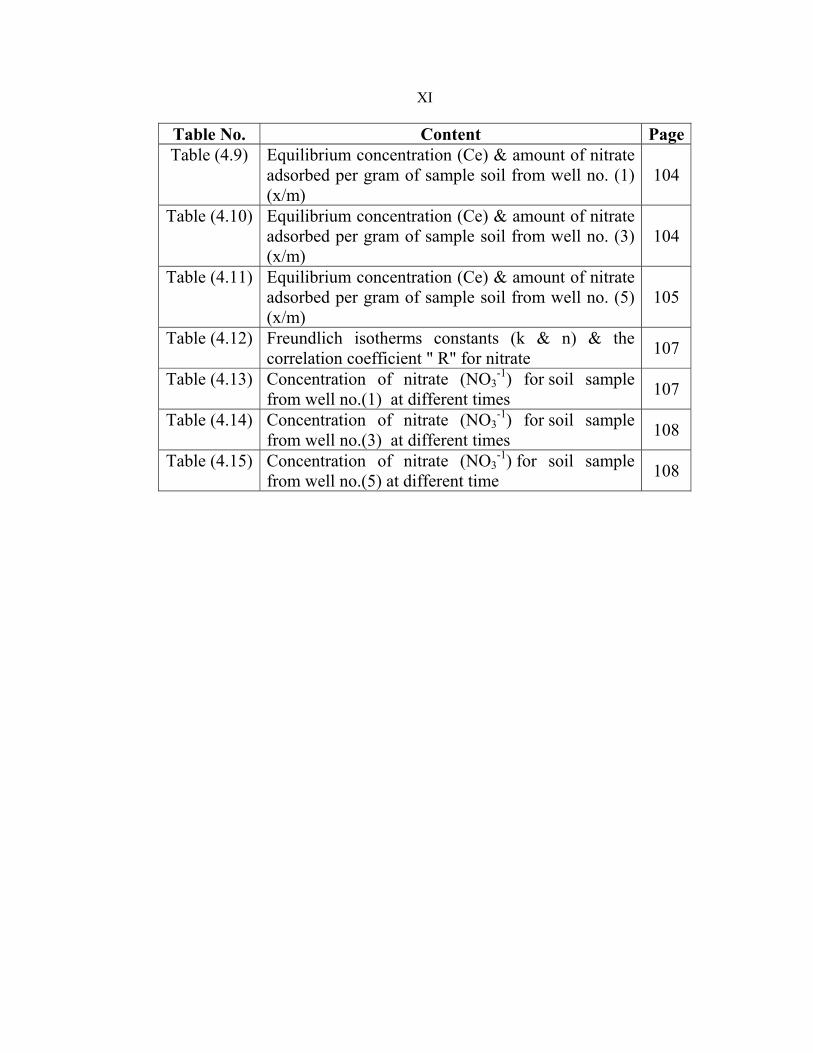
XI
Table No. Content PageTable (4.9) Equilibrium concentration (Ce) & amount of nitrate
adsorbed per gram of sample soil from well no. (1) (x/m)
104
Table (4.10) Equilibrium concentration (Ce) & amount of nitrate adsorbed per gram of sample soil from well no. (3) (x/m)
104
Table (4.11) Equilibrium concentration (Ce) & amount of nitrate adsorbed per gram of sample soil from well no. (5) (x/m)
105
Table (4.12) Freundlich isotherms constants (k & n) & the correlation coefficient " R" for nitrate 107
Table (4.13) Concentration of nitrate (NO3-1) for soil sample
from well no.(1) at different times 107
Table (4.14) Concentration of nitrate (NO3-1) for soil sample
from well no.(3) at different times 108
Table (4.15) Concentration of nitrate (NO3-1) for soil sample
from well no.(5) at different time 108
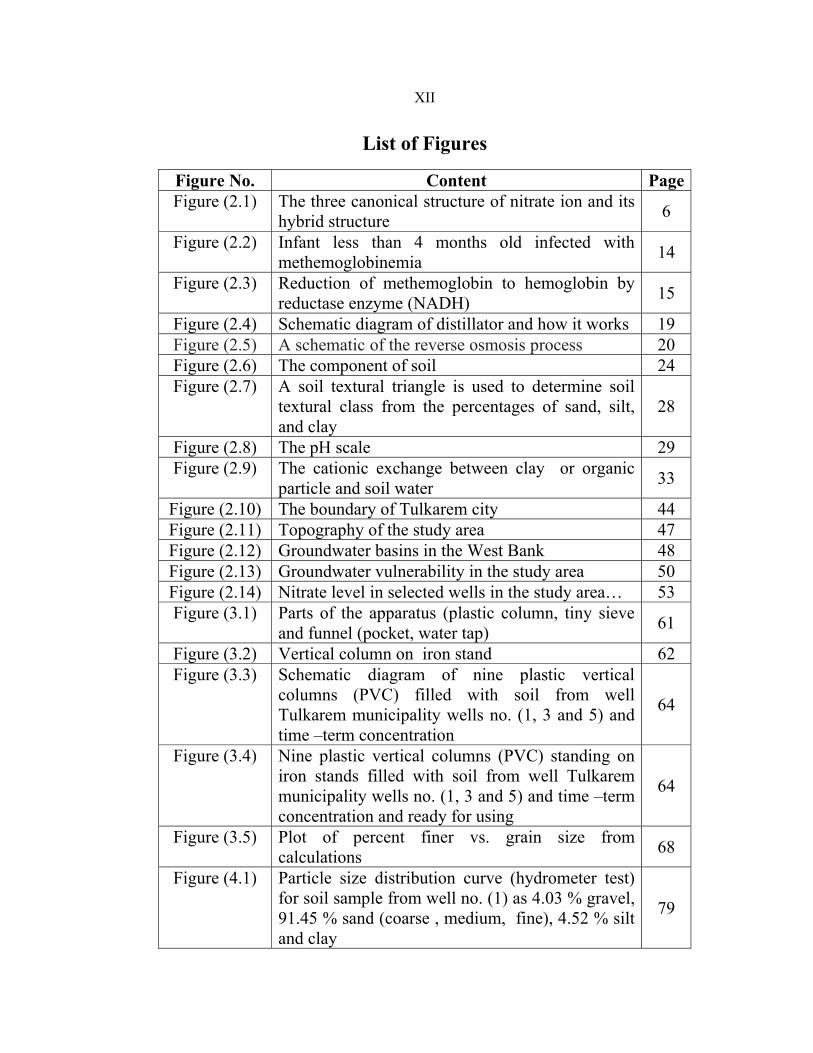
XII
List of Figures
Figure No. Content PageFigure (2.1) The three canonical structure of nitrate ion and its
hybrid structure 6
Figure (2.2) Infant less than 4 months old infected with methemoglobinemia 14
Figure (2.3) Reduction of methemoglobin to hemoglobin by reductase enzyme (NADH) 15
Figure (2.4) Schematic diagram of distillator and how it works 19 Figure (2.5) A schematic of the reverse osmosis process 20 Figure (2.6) The component of soil 24 Figure (2.7) A soil textural triangle is used to determine soil
textural class from the percentages of sand, silt, and clay
28
Figure (2.8) The pH scale 29 Figure (2.9) The cationic exchange between clay or organic
particle and soil water 33
Figure (2.10) The boundary of Tulkarem city 44 Figure (2.11) Topography of the study area 47 Figure (2.12) Groundwater basins in the West Bank 48 Figure (2.13) Groundwater vulnerability in the study area 50 Figure (2.14) Nitrate level in selected wells in the study area… 53 Figure (3.1) Parts of the apparatus (plastic column, tiny sieve
and funnel (pocket, water tap) 61
Figure (3.2) Vertical column on iron stand 62 Figure (3.3) Schematic diagram of nine plastic vertical
columns (PVC) filled with soil from well Tulkarem municipality wells no. (1, 3 and 5) and time –term concentration
64
Figure (3.4) Nine plastic vertical columns (PVC) standing on iron stands filled with soil from well Tulkarem municipality wells no. (1, 3 and 5) and time –term concentration and ready for using
64
Figure (3.5) Plot of percent finer vs. grain size from calculations 68
Figure (4.1) Particle size distribution curve (hydrometer test) for soil sample from well no. (1) as 4.03 % gravel, 91.45 % sand (coarse , medium, fine), 4.52 % silt and clay
79
XIII
Figure No. Content PageFigure (4.2) Particle size distribution curve (hydrometer test )
for soil sample from well no. (3) as 10.09 % gravel, 88.6 % sand (coarse, medium, fine) and 1.31 % silt and clay
79
Figure (4.3) Particle size distribution curve (hydrometer test ) for soil sample from well no. (5) as 24.23 % gravel, 75.06 % sand (coarse, medium, fine) and 0.71 % silt and clay
80
Figure (4.4) Concentration of nitrate leached from column (1), column (2), and column (3) vs. date (44 days) 89
Figure (4.5) Concentration of nitrate leached from column (4), column (5), and column (6) vs. date (44 days) 92
Figure (4.6) Concentration of nitrate leached from column (7), column (8), and column (9) vs. date (44 days) 95
Figure (4.7) Plot of x/m vs. Ce for nitrate for soil sample from well no. (1) 105
Figure (4.8) Plot of x/m vs. Ce for nitrate for soil sample from well no.(3) 105
Figure (4.9) Plot of x/m vs. Ce for nitrate for soil sample from well no.(5) 106
Figure (4.10) Plot of concentration of nitrate vs. time for soil sample from well no (1)… 108
Figure (4.11) Plot of concentration of nitrate vs. time for soil sample from well no (3) 109
Figure (4.12) Plot of concentration of nitrate vs. time for soil sample from well no (5) 109
XIV
Kinetics Of Groundwater Nitrate (NO3-1) In Soil
Leachate In Tulkarem City Using Soil Columns By
Osama Zaki Al-Shiekh Naser SUPERVISED BY Dr .Shehdeh Jodeh
Prof. Marwan Haddad
Abstract
As we know nitrate ions are considered to be global pollutant that
pollute water sources which include surface and ground water. This
pollution results mainly from nitrogen fertilizers in agricultural areas,
wastewaters and animals manure. World Health Organization (WHO)
standards of the nitrate ions concentration is put at 45 mg/l, hence any
source of water exceeding this value consider as contaminant and put in
focus for treatment. The method of vertical columns that are filled with
different types of soil taken from Tulkarem City is to study the effects of
soil on the groundwater if contaminated water with nitrate leaches through
the soil and its relationship with elevation of nitrate in these areas.
Three soil samples of different concentrations of nitrate will be
collected from near Tulkarm Municipality wells no (1, 3 and 5). These
samples will be put in nine vertical plastic tubes (PVC), then these tubes
will be divided into three parts designated as zero-short-long-term of
concentrations (0 year, 1 years, 25 years) for each soil sample. Three
different concentrations of nitrate-contaminated water will be added as
time-term of concentrations to nine columns daily.
For the columns, blank and short-term of time concentration (1
year), the high concentrations of nitrate ions concentrated in the bottom of
the columns while the lower concentration concentrated in the upper of the
XV
column. For the columns long-term of time of concentration (25 year) high
concentrations of nitrate ions concentrated in the upper of the columns
while the lower concentration concentrated in the bottom of the columns.
The results indicate that the texture of the soil is sandy to sandy
loam and contain high percentage of organic matter ranging from 3.71 %
to 4.25 %. It is found that the average concentration of nitrate ions in the
content of the soil samples (1, 3 and 5) is equal to 263.3 mg/L, 216.7 mg/L
and 799 mg/L respectively.
Kinetic studies (Freundlich adsorption isotherm) is applied to study
the adsorption of nitrate ions to the soil particles in the wells no. (1, 3 and
5). The results of adsorption study of wells 1, 3, and 5 are found to be
0.611, 0.779 and 0.821 respectively. These results are satisfactory where
the optimum time for adsorption of nitrate ions was after 24 hours.
1
CHAPTER ONE
Introduction:
1.1 General Background
Pollution nowadays is the most important subject for many countries
because pollution has major effects on all aspects of life and threatens
human health, animals, plants, and environment [1].
There are three major types of pollution: water pollution, air
pollution and soil pollution.
Water pollution is defined as anything done by humans to cause
harmful effects to the water bodies. This can include pollution of ground
water, lakes, rivers, and oceans pollution. Different manufacturing plants
such as factories are the major causes of water pollution, that they use seas
waters, rivers and oceans to carry away their wastes which may contain
nitrates, lead, phosphates, mercury and other harmful and toxic substances.
Waste chemicals and detergents poured into water, wastes of small boats
and large ships, oil spills into seas and oceans, and dropping untreated
poisoning and harmful sewage into these water are all considered
pollutants. These pollutants are carried away by waves or to other parts of
oceans and seas [2].
The water resources that are available to Palestinians are
groundwater, springs and rainwater. The Jordan River, is not a water
resource for the Palestinians in the West Bank because it is used by
Jordanians and Israelis only. The West Bank lies over two main aquifers,
the mountain aquifer and the coastal aquifer, which are shared with Israel.
2
The mountain aquifer is divided into the eastern aquifer, northern-eastern
aquifer, and western aquifer. Part of the northern-eastern aquifer and
eastern aquifer flow east towards the Jordan River. The western aquifer,
coastal aquifer and part of the northern-eastern aquifer all flow west
towards the Mediterranean Sea [3].
In the West Bank there are forty municipal wells that are used
partially or wholly by Palestinians and their annual yield is about 30
million m3 [4].
This is insufficient amount of water to meet water demand so the
deficiency is supplied mainly through springs or through Mekorot (the
Israeli Water Company) and by some agricultural wells. In the West Bank
there are more than 300 springs the total average annual yield of the springs
is about 60 million m3, where more than 100 spring are considered to have
substantial yields. Although springs are secondary water source in
Palestine, however, they are for important source of drinking water and for
some agricultural needs. Rainfall cisterns are also another source of water
that collects about 6.6 million m3 /year from rooftops [5].
The average consumption of water per capita is about 70 liters per
day. About 88 % of the total West Bank population and 55 % of towns and
villages in the West Bank have access to piped water supply systems [6].
Leachate from industrial and municipal wastes that entering an
aquifer is a major source of organic and inorganic pollution. Organic
pollution of groundwater in large scale is rarely, because organic wastes
usually cannot be easily introduced to the subsurface. The problem is
3
different with inorganic solutions (e.g. nitrate and chloride), since the
inorganic anions move easily through the soil. Once groundwater
contaminated then it is difficult and costly to treat [7].
High concentrations of nitrate ions are found throughout the West
Bank, these contamination of groundwater with nitrate is caused mainly by
percolating of fertilizers and raw sewage. A detailed study done on samples
for drinking water collected from wells in the Jordan Valley, Nablus, Jenin
, and Tulkarm district, found that the nitrate levels were above the World
Health Organization standard guideline values for drinking water which is
greater than 50 mg/L. These is found up to one-third of samples
collected[8].
There is a major concern of microbiological pollution in the
groundwater in the West Bank, since there are frequent outbreaks of
diarrhea among the Palestinian population. According to the data published
by Ministry of Health in 2001 showed that 600 of 2,721 samples including
water from both wells and tanks, failed to meet WHO bacteriological
standards for drinking water [9].
There is no developed treatment method of water in the West Bank
except using chlorine to disinfect municipal wells and some springs. This
is done by addition of sodium hypochlorite to the stream water, just before
its distribution from reservoirs. For springs and many private (domestic)
wells, disinfecting is not carried out in a regular way. In some municipal
wells, chlorination process was not always carried out in the acceptable
levels 0.1 mg/L to 0.5 mg/L [10].
4
1.2 Research Objectives:
The goals of this work is the followings:
1- Determination of nitrate (NO3-1) in drinking water of Tulkarm wells
due to tests that done by Palestinian Water Authority (PWA) and
ministry of health that shows high levels of nitrate in drinking water
above WHO standards.
2- Determination of nitrate (NO3-1) in different soils that are collected
from nearby different wells and other parameters such as acidity of
soil (pH), humidity, nitrogen (N), fertilizers that contain nitrogen,
total organic carbon (TOC), salinity, phosphorus, and adsorption
isotherm .
3- To improve our understanding, quantitatively and qualitatively, to
the issue of groundwater contamination.
4- To study the kinetics behavior of nitrate leachate to the ground water
through soil.
1.3 Problem Identification:
This research is done according to the reports released by PWA and
ministry of health that shows high concentration of nitrate in the Tulkarem
wells especially the wells belonging to the municipality. It noticed that the
nitrate concentration is high near Wadi Zaimer, located in the middle of
Tulkarem City, and near agricultural lands that use manure and chemical
fertilizers.
5
1.4 Research Methodology:
Three soil samples of different concentration of nitrate will be
collected from near Tulkarm Municipality wells numbered 1, 3 and 5.
These samples will be put in nine vertical plastic tubes (PVC), then these
tubes will be divided into three parts designated as zero-short-long-term of
concentrations (0 year, 1years, 25 years) for each soil sample. Three
different concentrations of nitrate-contaminated water will be added as
time-term of concentrations to nine columns daily. The concentration of
nitrate will be detected for resulting water and soil and kinetic studies will
be done for each column.
6
CHAPTER TWO
Literature Review:
2.1 Definition of Nitrate:
Nitrate ion is odorless, tasteless, and colorless anion [11], and
consist of a polyatomic ion with the molecular formula (NO3-1) and a
molecular weight of 62.0049. It is consisting of one nitrogen as central
atom surrounded by three identical oxygen atoms in a trigonal planar
arrangement. The formal charge for the nitrate ion is negative one, where
each oxygen atom carries a −2/3 charge while the nitrogen carries a +1
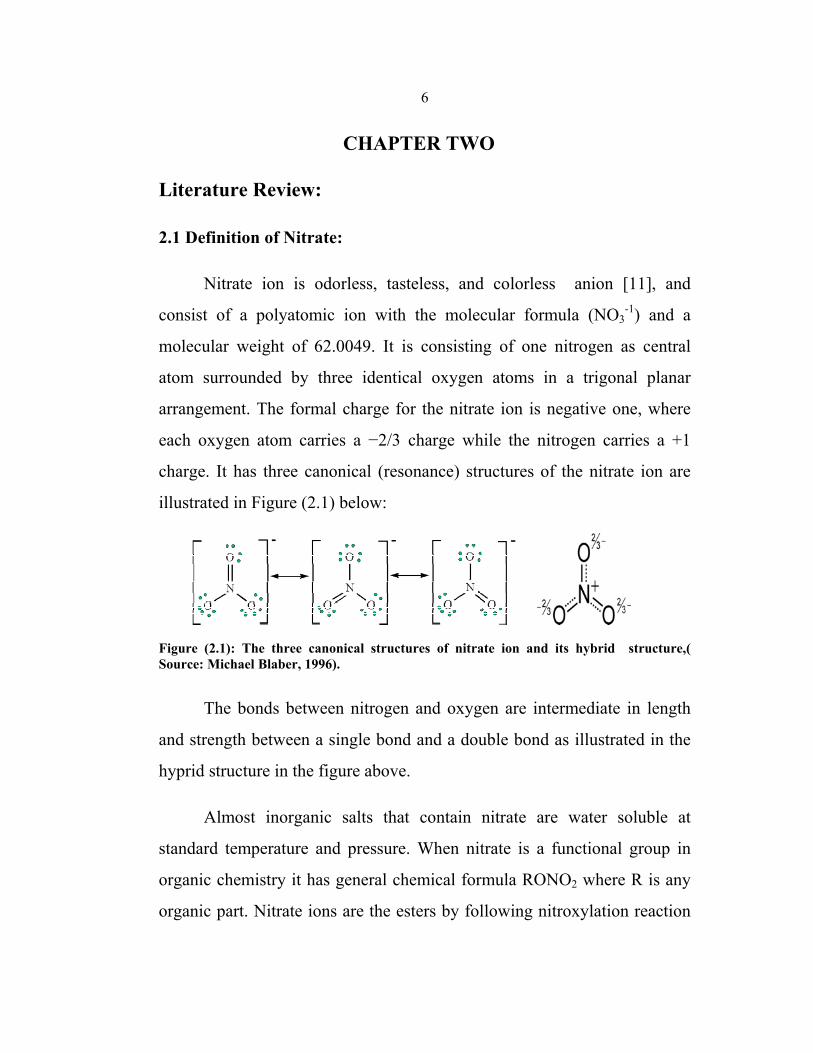
charge. It has three canonical (resonance) structures of the nitrate ion are
illustrated in Figure (2.1) below:
Figure (2.1): The three canonical structures of nitrate ion and its hybrid structure,( Source: Michael Blaber, 1996).
The bonds between nitrogen and oxygen are intermediate in length
and strength between a single bond and a double bond as illustrated in the
hyprid structure in the figure above.
Almost inorganic salts that contain nitrate are water soluble at
standard temperature and pressure. When nitrate is a functional group in
organic chemistry it has general chemical formula RONO2 where R is any
organic part. Nitrate ions are the esters by following nitroxylation reaction
7
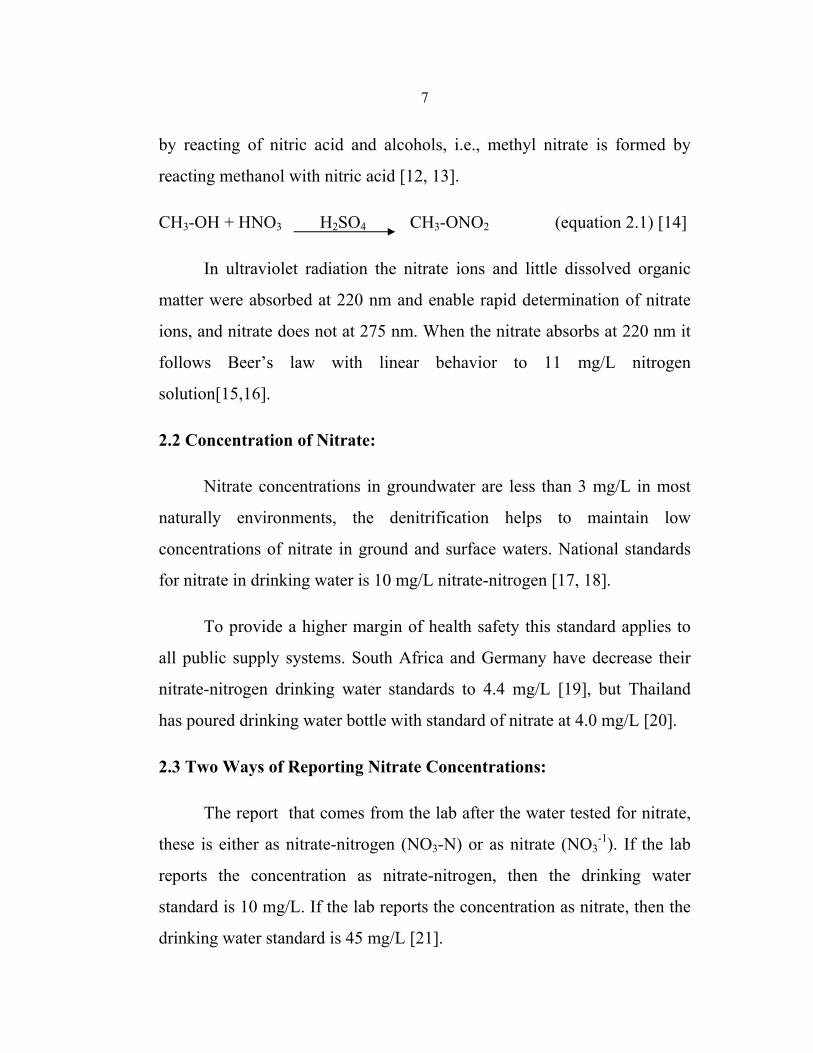
by reacting of nitric acid and alcohols, i.e., methyl nitrate is formed by
reacting methanol with nitric acid [12, 13].
CH3-OH + HNO3 H2SO4 CH3-ONO2 (equation 2.1) [14]
In ultraviolet radiation the nitrate ions and little dissolved organic
matter were absorbed at 220 nm and enable rapid determination of nitrate
ions, and nitrate does not at 275 nm. When the nitrate absorbs at 220 nm it
follows Beer’s law with linear behavior to 11 mg/L nitrogen
solution[15,16].
2.2 Concentration of Nitrate:
Nitrate concentrations in groundwater are less than 3 mg/L in most
naturally environments, the denitrification helps to maintain low
concentrations of nitrate in ground and surface waters. National standards
for nitrate in drinking water is 10 mg/L nitrate-nitrogen [17, 18].
To provide a higher margin of health safety this standard applies to
all public supply systems. South Africa and Germany have decrease their
nitrate-nitrogen drinking water standards to 4.4 mg/L [19], but Thailand
has poured drinking water bottle with standard of nitrate at 4.0 mg/L [20].
2.3 Two Ways of Reporting Nitrate Concentrations:
The report that comes from the lab after the water tested for nitrate,
these is either as nitrate-nitrogen (NO3-N) or as nitrate (NO3-1). If the lab
reports the concentration as nitrate-nitrogen, then the drinking water
standard is 10 mg/L. If the lab reports the concentration as nitrate, then the
drinking water standard is 45 mg/L [21].
8
2.4 Sources of Nitrate in Drinking Water
The higher concentrations of nitrate in groundwater that is higher
than 10 mg/L are attributed to the sources listed below.
2.4.1 Human and Animal Wastes
Humans and animals waste are major sources of nitrate in any area
that has high populations of humans or animals. For human waste, nitrate
originates mostly from individual septic tanks or from municipal
wastewater treatment plants. For septic tanks the effluent has 30 mg/L to
60 mg/L total nitrogen with ammonia making up the majority of the
nitrogen. The nitrogen content of this effluent varies widely depending
upon the condition of the individual septic tanks and the type of waste
being introduced in each one.
The majority of the population in the big cities is served by
municipal wastewater treatment systems, that is connecting all houses,
factories, schools, shops, and others to the sewerage network and these will
take wastewater for treatment in the wastewater treatment plant. Nitrogen
content of effluent from municipal systems will vary according to the
nature of the incoming waste stream and the type and condition of the
system. After treatment with activated sludge the total nitrogen in the
effluent is about 15 mg/L to 35 mg/L, in more advanced systems the total
nitrogen in the effluent is reduce to about 2 mg/L to 10 mg/L.
The effluent from wastewater treatment plants in western Australia is
currently disposed in ocean, although there are moves to use the effluent in
land-based applications, which has implications for groundwater quality.
9
Waste from open feedlots, dairies, confined feeding operations,
stockyards and other facilities for raising animals is also a potential source
of nitrate and other forms of nitrogen. The public concern in animal waste
includes such issues as flies, odor, and surface water impacts, these
facilities represent a massive source of nitrogen and other nutrient inputs to
groundwater. In 1998 the university of Nebraska Cooperative Extension
estimates that waste that are resulted from animal stock contains from
about 100 g to 400 g of nitrogen/kilogram of animal weight, so the total
nitrogen concentrations of dairy wastewater range from 150 mg/L to 500
mg/L.
2.4.2 Fertilizers:
The major component of fertilizer is nitrogen that use for agricultural
and in gardening. Normally two forms of nitrogen fertilize are present:
- Inorganic fertilizer.
- Animal waste.
In the last half of the twentieth century the inorganic fertilizer used
in Australia has become common with the presence of anhydrous ammonia,
urea, liquid nitrogen, and similar formulations of nitrogen that have greatly
increased crop yields.
In some conditions nitrogen fertilizer has been supplied in large
quantity to the soil, either out of ignorance of its impacts on the
environment, or for its relative inexpensive fertilizer.
10
For generations, animal waste has been applied to cropland, both as a
means of waste disposal or as fertilization.
Due to the high nitrate solubility and low sorptivity excess nitrate
ions or excess watering may allow nitrates to pass to groundwater
unabsorbed by plants. As a result, the groundwater would have high
concentration of nitrates in the heavily farmed areas.
Nowadays, they are focusing on reducing nitrates contamination of
groundwater by reducing the amounts of fertilizer used or by proper timing
of its application and irrigating.
2.4.3 Industrial Uses of Nitrate:
In industrial settings, nitrogen-containing compounds are used
extensively. Some of these compounds are: nitric acid, ammonium nitrate,
urea, and anhydrous ammonia.
World industry uses nitrates as raw material in the textile industry, or
as manufacturing of plastic, or in metal processing, or in paper and rubber
production, and household cleaners.
Contamination of nitrate may occur from bad handling and disposal
of these compounds in critical places that contain either surface or
groundwater so levels of contamination will depend on the source.
2.4.4 Naturally Occurring Nitrates
It is unusual for groundwater to accumulate more than 3 mg/L
nitrate. Some naturally processes may cause nitrate contamination in
groundwater.
11
During storm, lightning converts atmospheric nitrogen in the
presence of oxygen to nitrate which falls as rain, and this nitrate
concentration may be transported to the shallow aquifer where nitrate
concentrations can reach up to 60 mg/L.
The higher concentrations of nitrate ≥10 mg/L in groundwater may
be also caused by geologic formations. Sedimentary deposits with high
organic matter may release nitrogen [22].
2.5 Nitrates in Soil:
Nitrate is naturally occurring in water and soil. The primary source
of nitrogen for plants is nitrate (NO3-1) which is essential nutrient for
plants. cannot live without it and also can increase crop production. Plants
could not survive without nitrogen supplement. Nitrogen as food is
necessary for increasing crop production.
If more fertilizers containing nitrogen is added to the soil than the
plants can use, then the excess nitrate, cannot taken up by plant, will be
leached into groundwater and contaminate wells [23].
2.6 Nitrates in Food:
Vegetables account for more than 70 % of the nitrates in human diet,
and it is seldom source of acute toxicity. Collard green, spinach, broccoli,
cauliflower and root vegetables like carrot have naturally greater nitrate
content than other plant food do.
12
The reminder of the nitrate in our diet comes from drinking water
which is about 21 % and about 6 % from meat and meat products in which
sodium nitrite is used as preservatives [24].
2.7 Nitrates in Water:
Rural domestic wells that are shallow in depth are likely to be
contaminated with nitrates especially in the agricultural areas where
fertilizers that contain nitrogen are widespread used [25]. Contamination
with nitrate occurs when there is excess nitrate in the soil than plants can
use and when water can consume easily through the soil and underlying
rock.
The excess nitrate is taken through the soil into groundwater supplies
by rainwater, irrigation, and snowmelt. The leachate of nitrate to
groundwater occurs particularly where the soil is sandy, gravelly or shallow
over porous limestone bedrock.
Excess nitrate can accumulate in the soil in different ways:
- Applying fertilizer that contain nitrate to the soil more than a crop
can consume will increase levels of nitrate to higher level.
- Sewage and manure contain both ammonia and organic forms of
nitrogen. Organic nitrogen may be converted to ammonia in the soil
then ammonia is converted to nitrate by soil bacteria in a process
called nitrification.
- Some plants like soybeans and alfalfa can take nitrogen from the air
and put it into the ground through their root nodules and this process
13
is called nitrogen fixation. Finally small amounts of nitrate also
entering the soil with the help of rain during electrical storms into
soil and groundwater [23].
In the united states about 13 million households use private wells to
supply their drinking water. In agricultural areas fertilizers that contain
nitrogen are a major source of contamination with nitrate for shallow wells
that provide drinking water [26, 27]. According to recent geological survey
study showed that more than 8200 wells in all united states were
contaminated with nitrate levels above the standards which equal to 10
mg/L drinking. According to estimation done by Environment Protection
Agency (EPA) about 1.2 % of public wells and 2.4 % of private wells
exceed the nitrate standards[28, 29].
2.8 Effects of Nitrate Ions:
2.8.1 Effects of The Nitrate Ions in The Blood:
Pregnant or nursing women and infants are especially vulnerable to
health problems from drinking water with levels of nitrate above 10 mg/L.
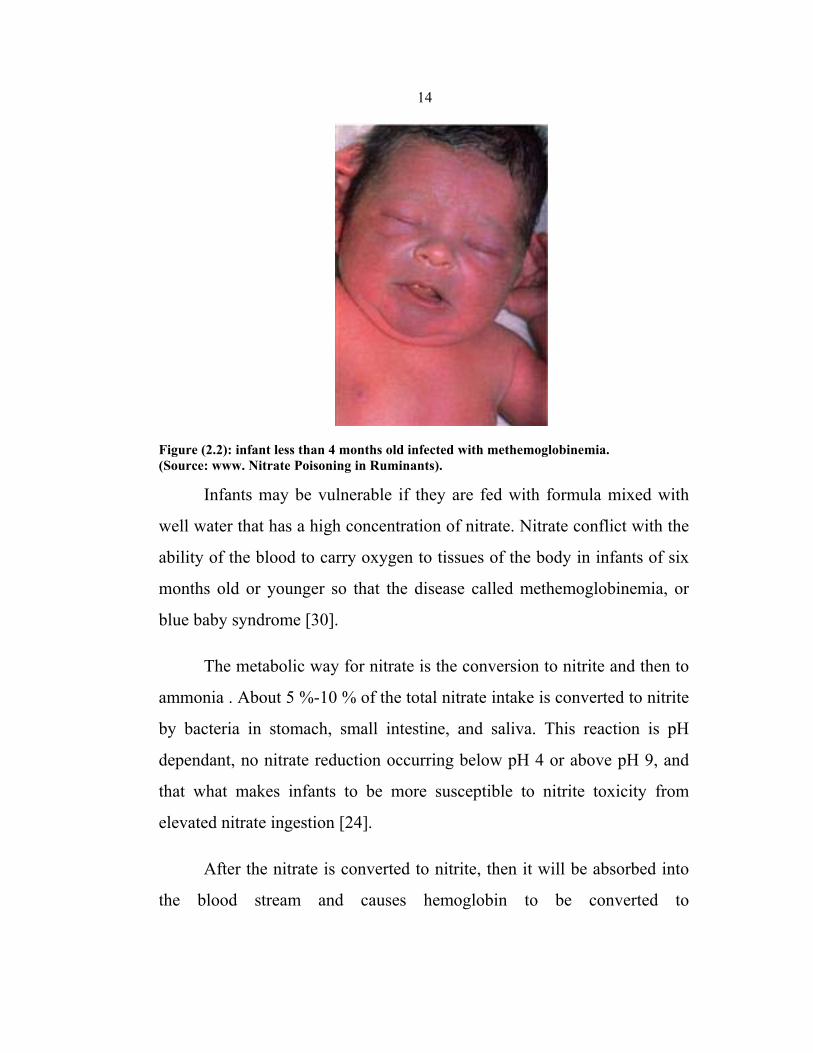
Figure (2.2) shows infant less than 4 months old infected with
methemoglobinemia.
14
Figure (2.2): infant less than 4 months old infected with methemoglobinemia. (Source: www. Nitrate Poisoning in Ruminants).
Infants may be vulnerable if they are fed with formula mixed with
well water that has a high concentration of nitrate. Nitrate conflict with the
ability of the blood to carry oxygen to tissues of the body in infants of six
months old or younger so that the disease called methemoglobinemia, or
blue baby syndrome [30].
The metabolic way for nitrate is the conversion to nitrite and then to
ammonia . About 5 %-10 % of the total nitrate intake is converted to nitrite
by bacteria in stomach, small intestine, and saliva. This reaction is pH
dependant, no nitrate reduction occurring below pH 4 or above pH 9, and
that what makes infants to be more susceptible to nitrite toxicity from
elevated nitrate ingestion [24].
After the nitrate is converted to nitrite, then it will be absorbed into
the blood stream and causes hemoglobin to be converted to
15
methemoglobin, which is unable to transport oxygen. Thus, when human
dies from nitrate poisoning, it is due to the lack of oxygen.
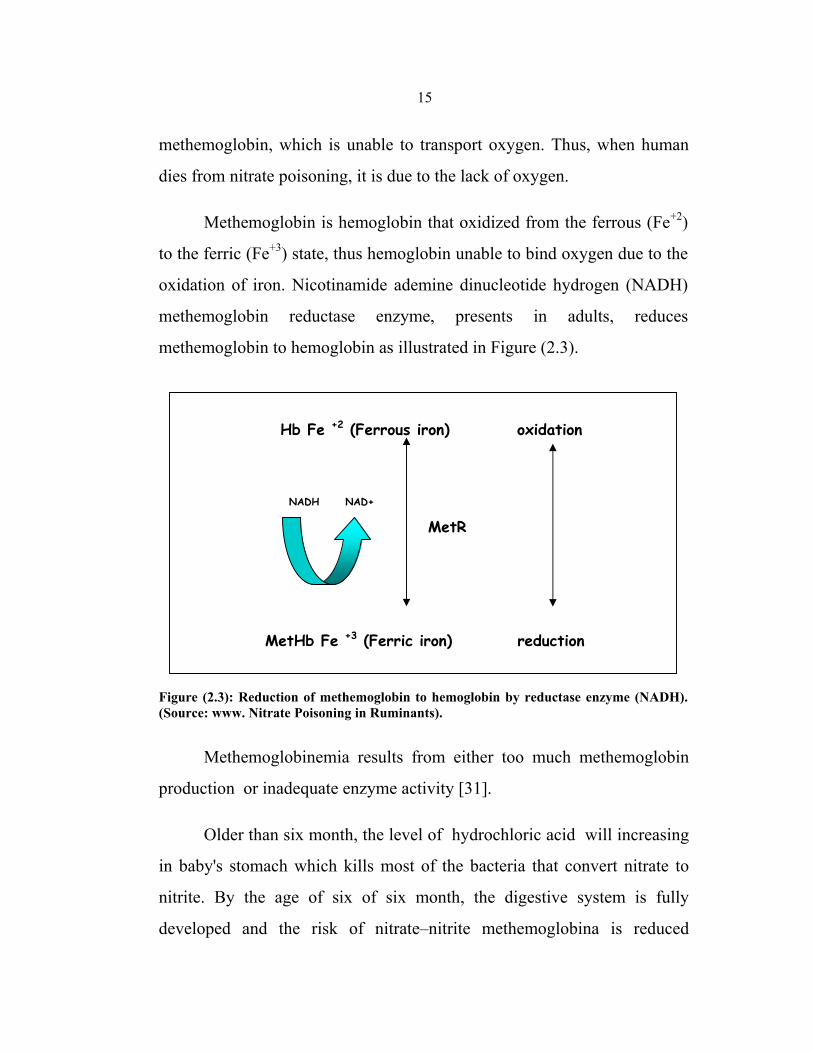
Methemoglobin is hemoglobin that oxidized from the ferrous (Fe+2)
to the ferric (Fe+3) state, thus hemoglobin unable to bind oxygen due to the
oxidation of iron. Nicotinamide ademine dinucleotide hydrogen (NADH)
methemoglobin reductase enzyme, presents in adults, reduces
methemoglobin to hemoglobin as illustrated in Figure (2.3).
Hb Fe +2 (Ferrous iron) oxidation
NADH NAD+
MetR
MetHb Fe +3 (Ferric iron) reduction
Figure (2.3): Reduction of methemoglobin to hemoglobin by reductase enzyme (NADH). (Source: www. Nitrate Poisoning in Ruminants).
Methemoglobinemia results from either too much methemoglobin
production or inadequate enzyme activity [31].
Older than six month, the level of hydrochloric acid will increasing
in baby's stomach which kills most of the bacteria that convert nitrate to
nitrite. By the age of six of six month, the digestive system is fully
developed and the risk of nitrate–nitrite methemoglobina is reduced
16
sharply because the digestive system naturally absorb and excrete the
nitrate [32].
Consuming drinking water with nitrate levels near the drinking
water standard does not normally increase the methemoglobin level of
humans.
Drinking water that contain nitrate begin its effect on the health of
the general populace at levels in the range of 100 mg/L to 200 mg/L, so
that the effect on any given person depends on many factors including
other sources of nitrate and nitrite in the diet [33].
2.8.2 Stomach Cancer & Nitrate:
Stomach cancer is the second largest number of deaths, lung cancer
kills more men and only breast cancer kills more women.
Stomach cancer is a painful and slow way to die, and the link to
nitrate in water that has been suggested is a serious matter. There are good
theoretical reasons for proposing such a link. Nitrite produced from nitrate
could react in the stomach with a secondary amine that result from the
decomposition of meat or other protein to produce an N-nitroso compound.
R1 R 1 N-H + NO2
-1 + H+1 N-N=O + H2O (equation 2.10) R 2 R 2
The N-nitroso compounds are carcinogenic material, hence, excess
nitrogen may will be the primary cause of stomach cancer due to the
formation of the nitroso-containing compounds [34].
17
2.9 Nitrate Standards in Drinking Water:
The concentration of nitrate up to 3 mg/L for well-drinking water is
generally believed to be occurring naturally and safe for drinking. The U.S.
Environmental Protection Agency puts standards for the concentration of
nitrate in drinking water (for public water supplies) 10 mg/L as nitrate-N,
or 45 mg/L as (NO3-1), so higher concentration of nitrate is put as
dangerous to people and animals, and for private wells there is no
standards.
2.10 Time and Testing Nitrate:
For the drinking water that comes from a public water like
municipalities, the drinking water must meet standards for nitrate so that
water must be tested every year and quarterly if the results go above 5
mg/L. The public supplier is required to send an annual report to all water
users about the tests that done by the Utah Department of Environmental
Quality, Division of Drinking Water illustrating the concentration of
nitrate and other contaminants found in these water. If water comes from a
private well like agricultural (domestic) wells, testing for nitrate is required
every five years. The following Table (2.1) showing the nitrate levels and
its interpreting of how using water.
18
Table (2.1): The nitrate levels in drinking water and its interpret of using water.
NITRATE LEVEL (NO3
-1)
INTERPRETATION
0-10 Safe for humans and livestock. However, concentrations of more than 4 mg/L are an indicator of possible pollution sources and could cause environmental problems.
11-20 Generally safe for human adults and livestock. Not safe for infants because their digestive systems cannot absorb and excrete nitrate.
21-40 Should not be used as a drinking water source but short-term use acceptable for adults and all livestock unless food sources are very high in nitrates.
41-100 Risky for adults and young livestock. Probably acceptable for mature livestock if feed is low in nitrates.
Over 100 Should not be used.
If the concentration of the nitrate is higher than standards in a well,
this indicates that the groundwater drawn from shallow depth, and
vulnerable to the types of contaminants moving through the soil, like
wastewater, fertilizers and animal manure [30].
2.11 Removal or Reduction of Nitrate From Water:
Nitrate is a very water soluble ion hence it is easy to dissolve in
water and difficult to remove from drinking water. The best solution for
these problem is either finding an alternative drinking water supply or
trying to reduce or remove nitrate contamination. Treatment of nitrates are
very complicated and expensive. There are four methods of reducing or
removing nitrate:
(1) Demineralization by distillation.
19
(2) Reverse osmosis.
(3) Ion exchange.
(4) Blending [21].
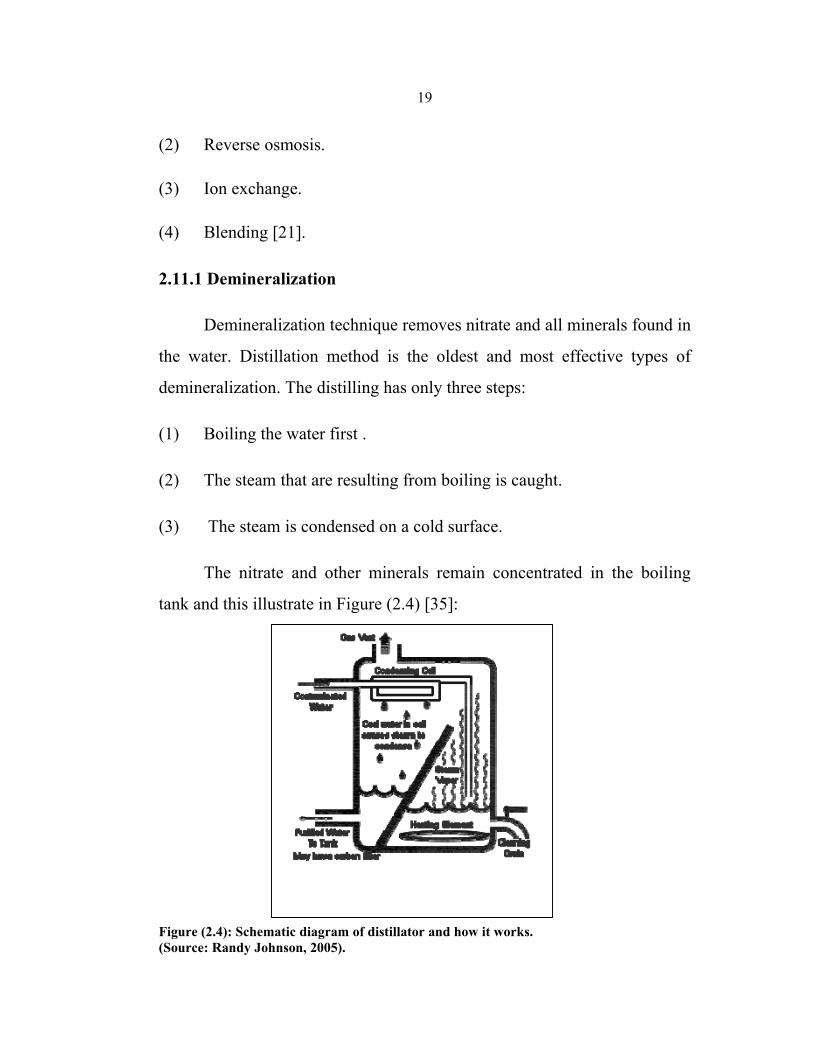
2.11.1 Demineralization
Demineralization technique removes nitrate and all minerals found in
the water. Distillation method is the oldest and most effective types of
demineralization. The distilling has only three steps:
(1) Boiling the water first .
(2) The steam that are resulting from boiling is caught.
(3) The steam is condensed on a cold surface.
The nitrate and other minerals remain concentrated in the boiling
tank and this illustrate in Figure (2.4) [35]:
Figure (2.4): Schematic diagram of distillator and how it works. (Source: Randy Johnson, 2005).
20
Volatile organic compound is a contaminant that will evaporate and
condense with the water vapor. The resulting vapor must filtrated by
carbon filter in the distiller to ensure the more complete removal of
contaminants [36].
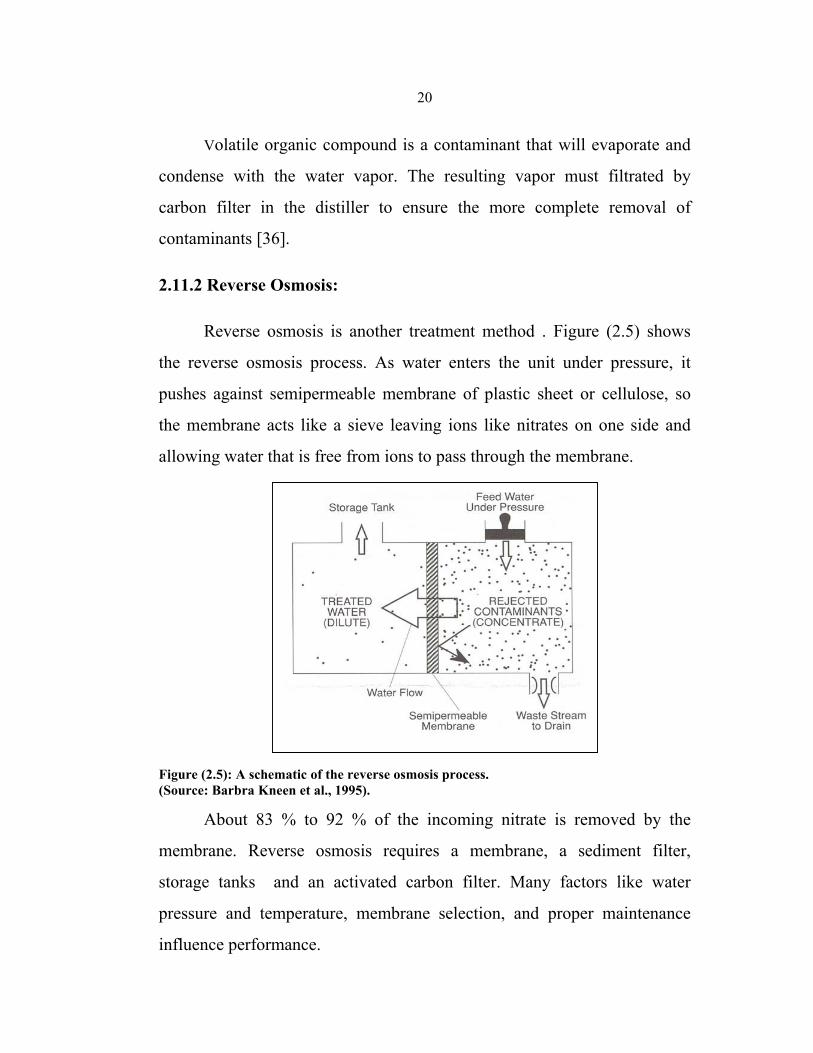
2.11.2 Reverse Osmosis:
Reverse osmosis is another treatment method . Figure (2.5) shows
the reverse osmosis process. As water enters the unit under pressure, it
pushes against semipermeable membrane of plastic sheet or cellulose, so
the membrane acts like a sieve leaving ions like nitrates on one side and
allowing water that is free from ions to pass through the membrane.
Figure (2.5): A schematic of the reverse osmosis process. (Source: Barbra Kneen et al., 1995).
About 83 % to 92 % of the incoming nitrate is removed by the
membrane. Reverse osmosis requires a membrane, a sediment filter,
storage tanks and an activated carbon filter. Many factors like water
pressure and temperature, membrane selection, and proper maintenance
influence performance.
21
The disadvantages of reverse osmosis the is that equipment is
expensive, initial costs ranging from 300 $ to 900 $, the high energy costs
for operation and slow inefficient process, sometimes producing only a few
gallons a day of purified water while wasting up to 90 percent of the
incoming water[37, 38].
2.11.3 Ion Exchange:
Ion exchange is the third method of water treatment for nitrate
contamination which based on nitrates trading places with other substances
such as chlorides, hence chloride ions exchange for nitrate ions. The ion
exchange unit is a tank filled with special resin beads that are charged with
chloride. As water-containing nitrate flows through the tank with the resin,
the resin takes up nitrate and exchanged the nitrate with chloride. The resin
can then be recharged by backwashing with sodium chloride and reused.
The advantage of ion exchange system can treat large volumes of
water and they are more appropriate than demineralization for treatment of
livestock water supplies. There are few setbacks of ion exchange systems
includes:
- The resin beads also take sulfate from the water in addition to nitrate
and exchange them with chloride so that the capacity of the resin to
take nitrate is reduced if the drinking water contain sulfate with
nitrate.
- The resin may also make the water corrosive so for this reason the
water must go through a neutralizing system after going through the
ion exchange unit.
22
2.11.4 Blending:
The fourth and most common method in reducing nitrates level in
the water is blending. Blending is to dilute the water that contain high level
of nitrate with water from another source that has low nitrate
concentrations. Therefore, blending the two waters produces water that is
low in nitrate concentration. Blended water is not safe for infants, but is
frequently used for livestock [35].
2.12 Protection Water Supply From Nitrate Contamination:
In selecting a new well position for drinking water, put in your mind
the possible sources of contamination and also the suitable depth that
prevent most pollutants to reach groundwater. So the longer time the water
move through soil, the safer it becomes as contaminants are diluted or
filtered in the soil. Nitrate is an exception of these contaminants. It is not
filtered out of water by the soil, so in choosing a new well location it must
be totally isolated from nitrate leaching to prevent contamination.
New and existing wells also need to be protected from surface
drainage by making properly cased and head cover from concreter to
prevent entering the pollutants to the groundwater and pollute it. If the well
is unprotected the contaminants can drain directly into the groundwater and
cause serious contamination.
Sinkholes are a direct route to the groundwater, and have them miles
far away from wells is the best way of preventing nitrate contamination.
Sinkholes can contribute to groundwater contamination by throwing in it
dead animals, garbage, chemical containers, leftover chemicals or other
23
forms of waste should never be thrown into a sinkhole or stored where
water might drain into a sinkhole.
2.13 Management of Nitrogen:
The only way to ensure a safe water supply from contamination of
nitrate and other contaminants, is to control the application of nitrogen to
the surface of the ground especially of manures or fertilizers. Hence the
key to good nitrogen management is to match the nitrogen application to
the needs of the crop by making tests for the soil to know the concentration
of nitrate, nitrite and nitrogen.
Manure application to the soil can also affect the leaching of nitrate
into the groundwater. For example, if the manure is applied before the plant
absorption, a large portion of the nitrate can be lost by leaching to the
groundwater [23].
2.14 Definition of Soil:
Soil is a natural body that consist of many layers of minerals of
variable thicknesses, which differ from the parent materials in their
physical, chemical, morphological and mineralogical characteristics. Soil is
composed of particles of broken rocks that have been changed by
environmental and chemical processes that include weathering and erosion.
Soil differs from its parent rocks due to interactions between
the hydrosphere, atmosphere, lithosphere and the biosphere. It is a mixture
of minerals and organics components that are in gaseous, solid, and
aqueous states. Soil particles are loosely packed, forming a soil structure
that filled with pore and spaces. These pores contain air (gas) and
24
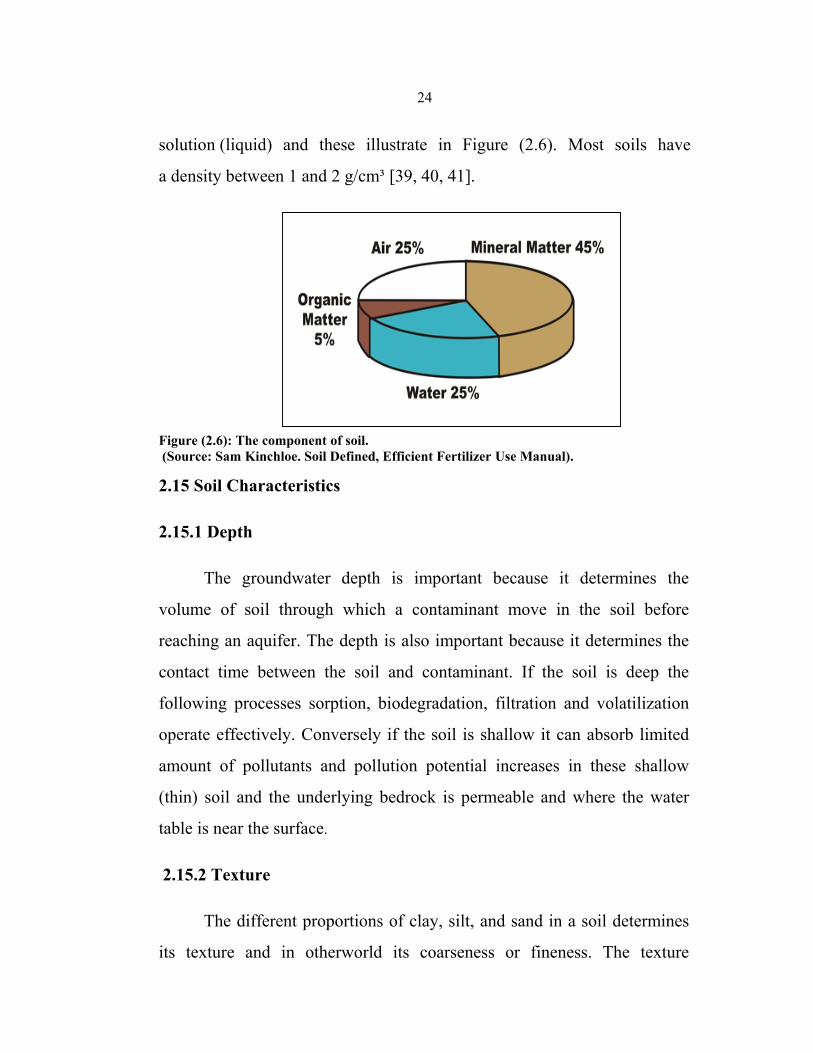
solution (liquid) and these illustrate in Figure (2.6). Most soils have
a density between 1 and 2 g/cm³ [39, 40, 41].
Figure (2.6): The component of soil. (Source: Sam Kinchloe. Soil Defined, Efficient Fertilizer Use Manual).
2.15 Soil Characteristics
2.15.1 Depth
The groundwater depth is important because it determines the
volume of soil through which a contaminant move in the soil before
reaching an aquifer. The depth is also important because it determines the
contact time between the soil and contaminant. If the soil is deep the
following processes sorption, biodegradation, filtration and volatilization
operate effectively. Conversely if the soil is shallow it can absorb limited
amount of pollutants and pollution potential increases in these shallow
(thin) soil and the underlying bedrock is permeable and where the water
table is near the surface.
2.15.2 Texture
The different proportions of clay, silt, and sand in a soil determines
its texture and in otherworld its coarseness or fineness. The texture
25
influences the movement of water and other pollutants through the soil by
effects of particles size and pores and total surface area for each type of
soil. Sandy soil has large pores and spaces between the particles and low
surface areas, which allows water to percolate through the soil rapidly.
The sand hills region is characterized by soils of sandy texture.
Clay soil has a large surface area on which sorption can take place.
As a result, leaching through the soil is less in clay soil. Most of the
piedmont region is characterized by soils with clay sub soils [42].
2.15.3 Organic Matter Content & Activity
Mineral particles is not originate in soil, it is modified, influenced,
and supplemented by living organisms. Animals and plants enrich the soil
with organic matters. These organic matters decomposed by the aid of
fungi and bacteria into a semi-soluble chemical called humus. Humus,
then vertically redistribute within the mineral matter found beneath the
surface of a soil by the effect of larger soil organisms like earthworms,
beetles, and termites. Humus makes the upper layers of the soil become
dark so it is colored dark brown to black. Humus benefits the soil in many
ways:
- It enhances soil's ability to hold and store moisture.
- It is the primary source of carbon and nitrogen required by plants for
their nutrition.
- It improves soil structure which is necessary for plant growth.
- It reduces the eluviations of soluble nutrients from the soil
profile[43].
26
- Well humified organic matter has a very large adsorptive capacity
for both inorganic and organic compounds including most pollutants.
For most soils organic matter is concentrated in the top soil and
these enhances the soil's capacity to serve as a filter [42].
2.16 Soil Types
One basic way to classify soil is by the size of the soil particles.
There are three major types of soil particles, sand, silt, and clay.
Most soil consists of a combinations of these three types. The soil
that contains all three types of particles in equal amounts is called loam.
There are many simple tests used to determine soil type such as, for
instance texture tests, suspension tests, and compaction test..
2.16.1 Sand
- Particle size: 0.5 mm to 2 mm.
- Texture: Gritty.
- Suspension: Sand particles generally settle first, when the soil is
suspended in water.
- Compaction: Low.
Sand particles are large and heavy and also has larger spaces among
particles as a result then have has small surface area, hence they are less
compact than silt or clay. Sandy soil is porous and usually holds less water
for plants than other soil types. Soil with large amounts of sand is not as
useful for growing most plants because of the property of dryness. The
27
particles of the sand tend to be weakly bonded together, so sandy soils are
easily affected by erosion.
2.16.2 Silt
- Particle size: 0.02 mm to 0.5 mm.
- Texture: Smooth and slippery.
- Suspension: Silt particles will settle after sand but before clay, when
soil is suspended in water.
- Compaction: Medium.
Silt particles are medium in size and weight, but they are heavier
than clay particles. Silty soil more easily eroded by both wind and water
because the bonds formed by the silt particles are weaker than those
formed by clay particles. Silty soil can hold both nutrients and water well,
which can make them good soils for to growing plants.
2.16.3 Clay
- Particle size: Less than 0.02 mm.
- Texture: Sticky.
- Suspension: Clay particles are generally the last to settle comparing
to the other two type, when soil is suspended in water.
- Compaction: High.
Clay particles are small and light, and have small pores and spaces
so the soil tends to bond together strongly, which is one of its
28
characteristics that makes clay useful for manufacturing pottery. Clay soil
is highly compact due to the little space among particles and large surface
area. It is difficult for many plants to survive in soil containing a high level
of clay, since it is harder for roots to grow and the for circulating air to
reach the roots. Clay soil can also tends to hold water [44].
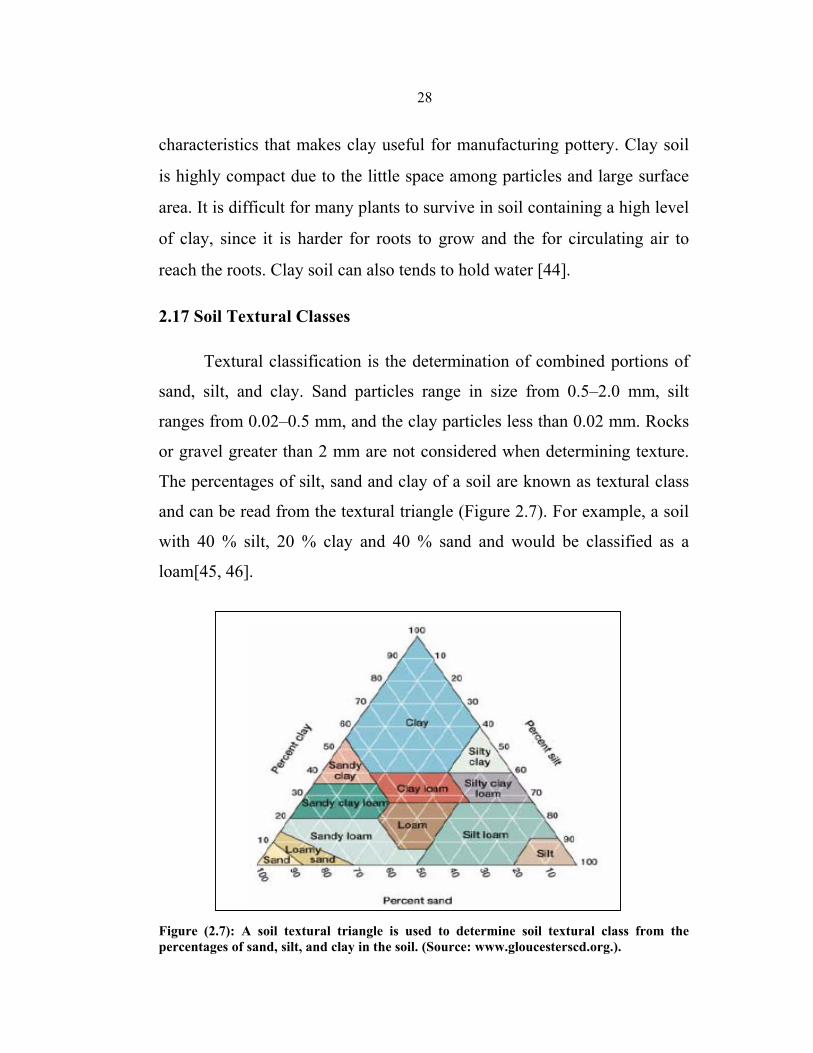
2.17 Soil Textural Classes
Textural classification is the determination of combined portions of
sand, silt, and clay. Sand particles range in size from 0.5–2.0 mm, silt
ranges from 0.02–0.5 mm, and the clay particles less than 0.02 mm. Rocks
or gravel greater than 2 mm are not considered when determining texture.
The percentages of silt, sand and clay of a soil are known as textural class
and can be read from the textural triangle (Figure 2.7). For example, a soil
with 40 % silt, 20 % clay and 40 % sand and would be classified as a
loam[45, 46].
Figure (2.7): A soil textural triangle is used to determine soil textural class from the percentages of sand, silt, and clay in the soil. (Source: www.gloucesterscd.org.).
29
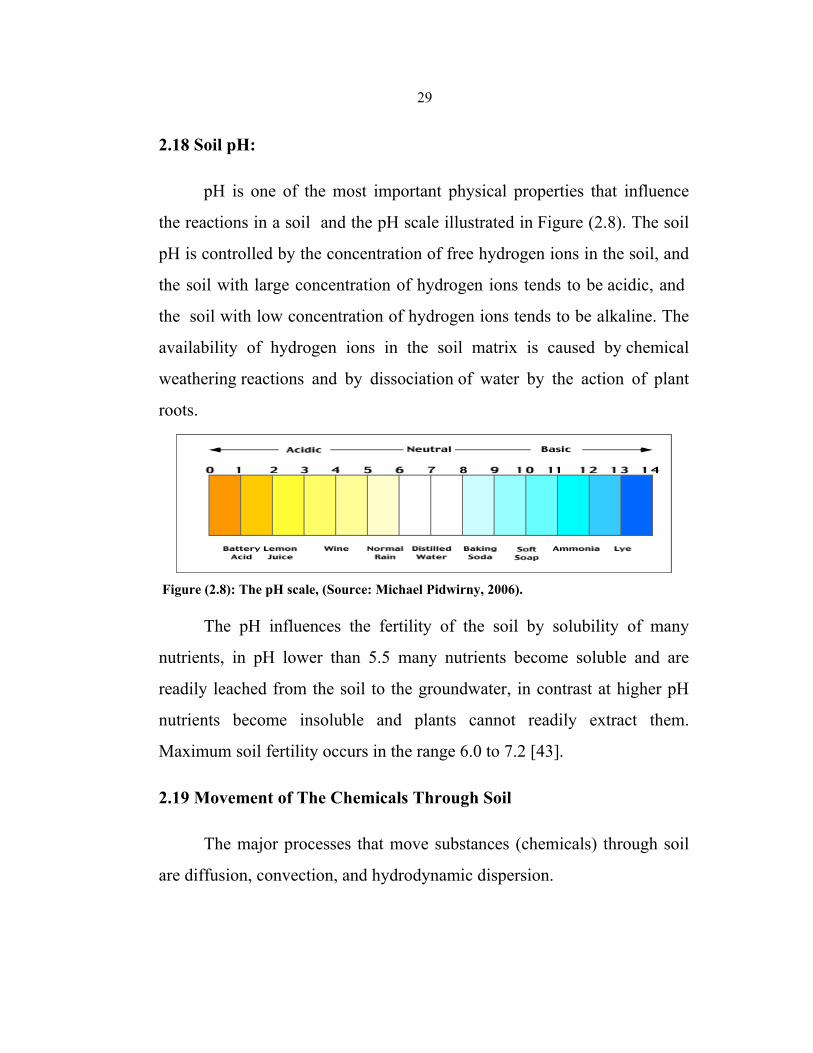
2.18 Soil pH:
pH is one of the most important physical properties that influence
the reactions in a soil and the pH scale illustrated in Figure (2.8). The soil
pH is controlled by the concentration of free hydrogen ions in the soil, and
the soil with large concentration of hydrogen ions tends to be acidic, and
the soil with low concentration of hydrogen ions tends to be alkaline. The
availability of hydrogen ions in the soil matrix is caused by chemical
weathering reactions and by dissociation of water by the action of plant
roots.
Figure (2.8): The pH scale, (Source: Michael Pidwirny, 2006).
The pH influences the fertility of the soil by solubility of many
nutrients, in pH lower than 5.5 many nutrients become soluble and are
readily leached from the soil to the groundwater, in contrast at higher pH
nutrients become insoluble and plants cannot readily extract them.
Maximum soil fertility occurs in the range 6.0 to 7.2 [43].
2.19 Movement of The Chemicals Through Soil
The major processes that move substances (chemicals) through soil
are diffusion, convection, and hydrodynamic dispersion.
30
2.19.1 Diffusion:
Diffusion is the movement of substances or molecules from the
regions of high concentration to the regions of low concentration, so
diffusion occurs due to the random movement of chemical molecules [47].
2.19.2 Convection:
Convection is heat transfer in which the fluid motion caused by
external forces like gravity and other electrostatic forces [48]. Movement
of water and chemicals in soil occurs due to differences in the gravity and
attractive forces associated with small pores between soil particles.
2.19.3 Hydrodynamic Dispersion
When the water molecule moves in the soil, it travels around soil
particles and rocks, making paths like a bundle of capillary tubes of
different lengths. Water and chemicals following these ways and paths in
the soil making a phenomena called hydrodynamic dispersion.
When applying chemical to the soil its concentration first is high as
it moves in the soil, its concentration will be less than the concentration at
which the chemical was first applied and this is because of dilution.
Movement of water in real soil is not so ideal, because soil is not
uniform in structure or texture or in the distribution of their organic matter.
Movement of water in soil may be slow or fast, these is because of
presence of spaces between soil particles may be blocked, slowing water
and chemical movement. Animal burrows, large cracks, and former root
31
channels may exist which allow rapid movement of water and dissolved
chemicals [49].
2.20 Interactions:
Chemical properties of the soil like solubility, sorption and density
influence the ability of substances to be transported within the soil.
Chemicals that are more soluble at the soil’s pH tend to move more easily
with water than chemicals that are less water soluble, and chemicals with
lower water solubility will tend to attach to clay particles and organic
matter near the soil surface. Some of these will form chemical precipitates.
Chemicals that are only slightly water soluble can still reach surface
or groundwater and their movement will tend to be slowed through
interactions with soil particles.
Adsorption process is the attraction of molecules to the surface of
soil particles. When molecular layers form on a soil particle surface true
adsorption occurs .
The driving force for adsorption resulted from a specific affinity of
the solute to the solid, where the atoms at the solids surface are subject to
unbalanced forces of attraction [49, 50, 51].
There are two types of adsorption: Physical adsorption and chemical
adsorption. Physical adsorption does not include transferring or sharing of
electrons and maintains the individuality of interacting species like Van der
Waals attraction. Physical adsorption is fully reversible reaction where
adsorption occurs at the same temperature and the process may be slow
because of diffusion effects. Molecules in the physical adsorption are free
32
to undergo translation movement within the interface. Chemical adsorption
includes transferring or sharing of electrons, as a result there is chemical
bonding and chemical adsorption is irreversible. Molecules in the chemical
adsorption are not considered to be free to move on the surface where they
are attached to active centers [52].
Chemical interaction between adsorbent and adsorbate is favored by
high temperature while the heat of physical adsorption is low [53].
Desorption is the process in which molecules are detached or
separated from the surface of soil particles. Desorption and Adsorption
usually occur simultaneously. Absorption process is mixing molecules with
another substance. Most soils absorb water and chemicals, although in
amounts much less than those adsorbed.
Positively charged chemicals (cations) such as phosphorus are
strongly sorbed to soil particles near the surface of the soil and tend to
contaminate surface water if erosion happens. Negatively charged
chemicals (anions) such as nitrate ions are more water soluble and less
strongly sorbed to soil particles, will tend to contaminate ground water if
irrigation or rainfall exceeds plant water use.
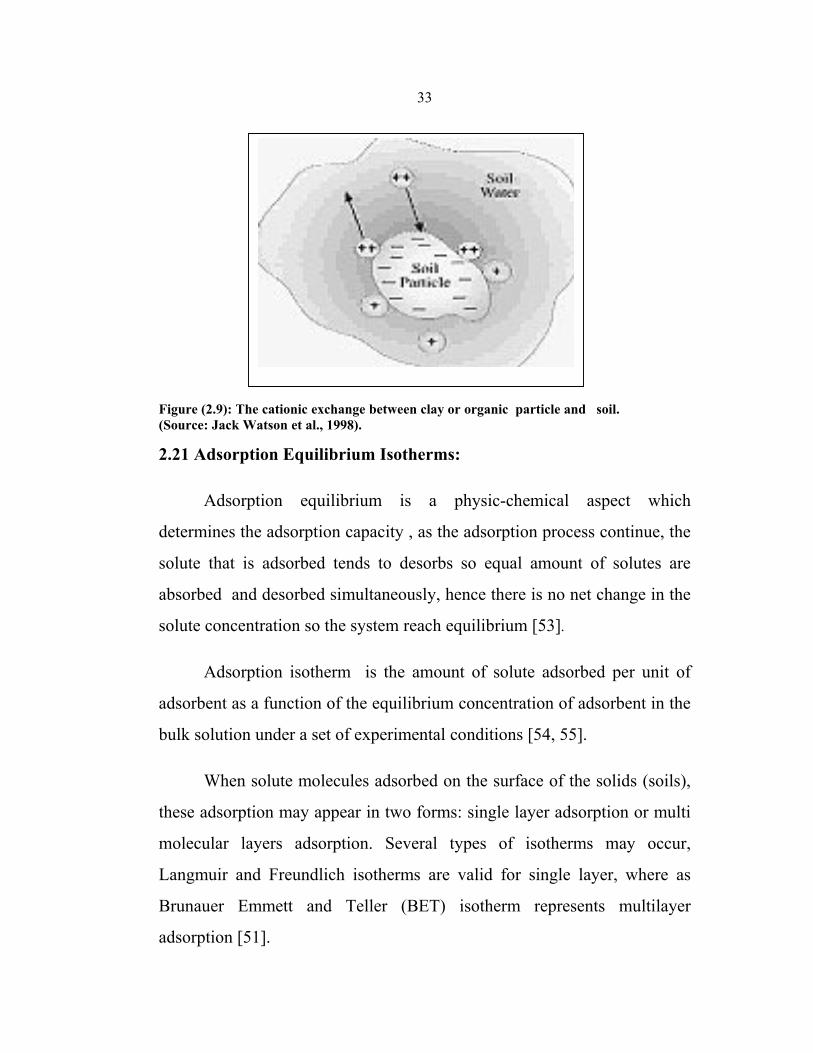
Cation exchange is the movement of cations between clay or organic
particles and the surrounding soil water, and these can seen in Figure (2.9)
and it is an important process [49].
33
Figure (2.9): The cationic exchange between clay or organic particle and soil. (Source: Jack Watson et al., 1998).
2.21 Adsorption Equilibrium Isotherms:
Adsorption equilibrium is a physic-chemical aspect which
determines the adsorption capacity , as the adsorption process continue, the
solute that is adsorbed tends to desorbs so equal amount of solutes are
absorbed and desorbed simultaneously, hence there is no net change in the
solute concentration so the system reach equilibrium [53].
Adsorption isotherm is the amount of solute adsorbed per unit of
adsorbent as a function of the equilibrium concentration of adsorbent in the
bulk solution under a set of experimental conditions [54, 55].
When solute molecules adsorbed on the surface of the solids (soils),
these adsorption may appear in two forms: single layer adsorption or multi
molecular layers adsorption. Several types of isotherms may occur,
Langmuir and Freundlich isotherms are valid for single layer, where as
Brunauer Emmett and Teller (BET) isotherm represents multilayer
adsorption [51].
34
The Langmuir equation is expressed as :
bCebCex
mx m
+=
1 (equation 2.11)
Where :
X : amount of solute adsorbed in moles (mg, mole). m : weight of adsorbent (mg, g). b: a constant related to the heat of adsorption, 1/unit weight . Xm : amount of solute adsorbed per unit weight of adsorbent required for monolayer. Ce : equilibrium concentration of the solute [56].
For linearization of equation (2.11), it can be written in the form :
mm x
Cebxmx
Ce+=
1/ (equation 2.12)
or
]1[.][1/1
CebxCe
xmx mm
+= (equation 2.13)
Any of these equations may be used to evaluate b & Xm from
experimental data using graphic or linear least squares analysis [57].
Freundlich adsorption equation is perhaps the most widely used
mathematical description of adsorption in aqueous systems. The Freundlich
equation is expressed as:
nKCemx /1= (equation 2.14)
35
Where
X : amount of solute adsorbed in moles (mg, mole). m : weight of adsorbent (mg, g). Ce : equilibrium concentration of solute. (1/n) : constant , a measure of adsorption intensity . K: constant, a measure of adsorption capacity.
It is generally stated by Helby (1952) that values of n in the rang 2-
10 represent good adsorption [58]. The constants in the equation (2.14) can
be estimated by simple transformation of equation (2.14) to logarithmic
form
Log x/m = log k + 1/n log Ce (equation 2.15)
By plotting log x/m versus log Ce a straight line is obtained with a
slope of 1/n , and log k is the intercept .
For Freundlich equation, it has been found to be more adaptable to
the adsorption data than the theoretically derived Langmuir equation, this is
due to the majority of adsorption processes do not comply the Langmuir
equation assumption of existence of monolayer of solute solution.
The Brunauer–Emmett –Teller (BET) equation is commonly written
as shown in equation (2.6) :
]/)1(1[)( CsCeBCeCsBCex
mx m
−+−= (equation 2.16)
Where x, m, xm and Ce have the same meaning as Langmuir or
Freundlich isotherm.
36
B: is a constant describing the energy of interaction between the solute and the adsorbent surface . Cs : is the solubility of solute in water at a specified temperature .
The transformation of equation (2.16), shows that a plot of the left
side against Ce/ Cs should give a straight line having slope (B-1)/xm B and
intercept 1/xmB:
CsCe
BxB
BxCeCsXCe
mm
)1(1)(
−+=
− (equation 2.17)[59].
2.22 Ion Selective Electrode:
Ion selective electrode is simple and inexpensive analytical
equipment which referred to sensors, and the pH electrode is the simplest
member of this group and can be used to illustrate the basic principles of
ISEs.
In order to measure, ion selective membrane the ISE/pH electrode
must be immersed together with a separate reference electrode in the test
solution and the two must be connected by a mill volt measuring system.
At equilibrium, the electrons added or removed from the solution by the
ISE.
The relationship between the ionic concentration (activity) and the
electrode potential is given by the Nernst equation:
E = E0 + (2.303RT/ n F) . Log(A) (equation 2.18)
Where
E = the total potential energy (in mV) developed between the sensing and reference electrodes.
37
E0 = is a constant which is characteristic of the particular ISE/reference pair. T = the absolute temperature. R = the gas constant (8.314 joules/degree/mole). F = the Faraday constant (96,500 coulombs). Log(A) = the logarithm of the activity of the measured ion. n = the charge on the ion (with sign).
When plotting E versus log (A) a straight line will appear in the
resulting graph, note that 2.303 RT/nF is the slope of the line from the plot
and the intercept is E0 this is an important diagnostic characteristic of the
electrode [60].
2.23 Kinetic Studies:
Adsorption and desorption are very important phenomenas that
happen in the environment especially in soil and water. The adsorption and
desorption of the different materials in the environment can be studied
kinetically by using different equations like Freundlich and Langmuir
isotherms and by knowing especial conditions like pH, time, temperature,
concentration and other different conditions.
Many researchers in the chemistry department at Al-Najah National
University in Palestine studied the kinetics behavior of may substances in
the environment.
- Attaallah (2011), the kinetic study of Glyphosate leachate in
Palestinian soil at different concentrations.
Manar Attaallah focused here research on the impact of pollutant
such as glyphosate pesticide on the soil and environment, and here study
38
was to study glyphosate kinetically in soil. The amount of glyphosate in
soil decreases with increasing depth of soil, and due to organic content and
metal oxides founded in soil that can form stable complexes with
glyphosate. Glyphosate is highly adsorbed to soil due to metal oxides
founded in soil. Glyphosate fit the first order reaction, Freundlich
adsorption isotherm equation is used to find the values of R, k and n which
is higher than one that indicates good adsorption to soil. The adsorption
isotherms for the soil is of S-type this indicating the easiness of the
adsorption, mainly at higher concentrations [61].
- Awartani (2010), fate of Oxytetracycline and Doxycycline in soil
and underground water.
Lama Awartani studied the adsorption behavior of two
antibacterials, oxytetracycline and doxycycline as examples of
pharmaceuticals that are released into the soil, also studied the effect of
organic matter and magnesium chloride hepta hydrate addition on the
adsorption of the two antibacterials. The results showed that increasing
organic matter increases the adsorption of oxytetracycline more than
doxycycline, also showed that the composition of oxytetracycline complex
with magnesium ion was more stable than doxycycline complex with
magnesium. The study also revealed a higher concentration of doxycycline
in leachate water from the soil than those of oxytetracycline, because
doxycycline has higher solubility in water. It also showed a decrease of the
concentrations for both substances over time in the leachate water due to
degradation [59].
39
- Hattab (2010), adsorption of some fluoroquinolones on selected
adsorbents.
Areej Hattab studied the adsorption of some fluoroquinolones
(antibiotics) such as : Gemifloxacin Mesylate and Levofloxacin
Hemihydrate by using selected adsorbents such as charcoal, kaolin, silica
gel and alumina.
For equilibrium studies, two adsorption isotherms were used,
Freundlich and Langmuir, the later fitted most data very well. Maximum
adsorption capacity for fluoroquinolones occurred into adsorbent charcoal.
The amount adsorbed at equilibrium decreases as adsorbate's concentration
increases and as the weight of adsorbent increases the amount of drug
adsorbed increases. pH played a significant role in the adsorption process
especially with silica and alumina. Thermodynamics parameters showed
that adsorption process was exothermic and spontaneous as ΔGo and ΔHo
had negative values, ΔSo was positive [62].
- Al-Haitali (2009), sorption characteristics of nonionic surfactant
Triton X-100 in soil contaminated with diesel.
Mahmoud Al-Haitali studied the adsorption of the surfactant on
solid surfaces which can lower the concentration of free surfactant in
aqueous solution. If the degree of adsorption is high, surfactant
concentration could drop below the critical micelle concentration,
rendering the surfactant solution with no ability to solubilize. In this study,
diesel was used as an organic contaminant to study sorption characteristics
of non ionic surfactant, Triton X-100. The results indicated that when the
40
concentration of surfactant was lower than the critical micelle
concentration, the amount of surfactant sorbed on soil increased with
increasing the surfactant concentration, the amount of desorbed diesel was
relatively low compared with the original amount added to soil, but
amount of diesel desorbed from soil at surfactant concentration above the
critical micelle concentration was relatively high. Other factors such as
temperature, pH, and ionic strength were also studied to examine whether
they improve or inhibit diesel desorption from soil. The study has shown
that high pH, low pH, high temperature, and ionic strength decreases the
capacity of surfactant in desorption of diesel from soil [63].
- Jaradat (2009), adsorption and desorption characteristics of
Endosulfan pesticide in three soils in Palestine.
Karbalaa Jaradat studied the adsorption and desorption of the
pollutant (endosulfan) in three soil samples ( red soil, chalk soil, and
sandy soil). Adsorption and desorption rates were calculated on soil
samples by using kinetic studies and the values varied based on the type of
soil. By using Langmuir model, maximum specific adsorption capacities
were measured also. Maximum adsorption was measured in red soil
followed by chalk soil, but it was the least for the sandy soil. Also organic
matter played a major role in both processes adsorption and desorption on
the soil samples. A significant reduction in the process of the adsorption
occurred in the soil samples compared with the decline in pH, desorption
was higher at both acidic and alkaline pH ranges compared to neutral pH.
The increase in temperature and the concentration of pollutant increase the
adsorption and desorption in all soil samples [64].
41
Also the kinetic of many substances studied in many countries in
the world Many such as USA, India, Malaysia and Egypt.
- Taha et. ale (2010), assessment removal of heavy metals ions from
wastewater by Cement Kiln Dust (CKD).
Taha and his team in Egypt studied the removal of heavy metal
(HM) ions Al (III), Cd (II), Zn (II), and Co (II) from aqueous wastes by
using adsorption technique using Cement Kiln Dust (CKD) which are both
wastes and are pollutants. Batch adsorption was conducted to evaluate the
removal of Al (III), Cd (II), Co (II) and Zn (II) onto CKD waste over a
wide range of operating conditions of sorbat concentration, pH, contact
time, sorbent dose.
The removal efficiency of (HM) ions showed that Al (III) required a
shortest contact time, for Zn (II) and Cd (II), binding to the (CKD) was
rapid and occurred within 20 to 40 min and completed for Co (II) within 4
hrs.
The equilibrium data for heavy metal ions fitted both Langmuir and
Freundlich models. The adsorption isotherm studies showed that the
adsorptive behavior of (HM) ions on (CKD) satisfies not only the
Langmuir assumptions but also the Freundlich assumptions, i.e. multilayer
formation on the surface of the adsorbent with an exponential distribution
of site energy [65].
- N. Kannan and S. Murugavel (2007), comparative study on the
removal of acid violet by adsorption on various low cost adsorbents.
42
N. Kannan and S. Murugavel in department chemistry in Indian
Institute of Tropical Meteorology studied the kinetic of the removal of
Acid Violet - 17 (AV) which is a dye that contaminates the environment
by adsorption on various adsorbents such as iron chromium oxide (ICO),
fly ash (FA), kapok fruit shell carbon (KC), lignite coal (LC) and cashew
nut shell carbon (CC). These adsorbents used as low cost adsorbents as
alternative materials to (CAC) for the removal of (AV) and the results
compared with the commercial activated carbon (CAC). The removal of
(AV) increases with decrease in the initial concentration of (AV), initial
pH and particle size of adsorbent and increases with increase in the contact
time and dose of adsorbent. Freundlich and Langmuir adsorption isotherms
were used for modulation of the given data at 30± and the reaction is first
order kinetic with intra particle diffusion as one of the rate determining
steps [66].
- S. Yean et. al. (2005), effect of magnetite particle size on adsorption
and desorption of arsenite and arsenate.
S. Yean and his team in Rice university, Houston in Texas in USA
made their study to evaluate the effect of magnetite particle size on the
adsorption and desorption behavior of arsenite and arsenate, and to
investigate the competitive adsorption between natural organic matter and
arsenic. Increases in adsorption maximum capacities for arsenite and
arsenate were observed with decreasing magnetite particle size. Arsenic
desorption is hysteretic, more so with the smaller nanoparticles. Such
desorption hysteresis might result from a higher arsenic affinity for
magnetite nanoparticles. In the presence of natural organic matter,
43
substantial decrease in arsenic sorption to magnetite nanoparticles was
observed [67].
- Ghafar (2004), adsorption studies of aromatic compounds in
aqueous solution onto activated carbon.
Faridah Bt Ghafar in Sains Malaysia University focus here research
on the removal of aromatic compounds like toluene, o-xylene and benzene
from aqueous solutions by adsorption on commercial activated carbons,
Calgon Filtrasorb 300 (F 300) and Norit GAC 1240 (N 1240) .
The adsorption capacity of all adsorbate - adsorbent increased with
increasing initial concentrations but decreased with temperatures. The
equilibrium time was in the following benzene > toluene > o-xylene.
Adsorption isotherm studied by using the Freundlich and Langmuir
isotherm models indicate that the adsorption isotherms of toluene ,benzene
and o-xylene on both adsorbents F 300 and N 1240 can be described by
both isotherm models. The N 1240 adsorbent has higher adsorption
capacity than F 300 adsorbent for all adsorbates due to its higher surface
area and porosity. The adsorption kinetic of all adsorbate-adsorbent
systems was pseudo second order kinetic model. The thermodynamic
studies showed that the adsorption process was physical adsorption,
spontaneous and exothermic in nature for all adsorbate-adsorbent systems.
In the continuous system, the adsorption capacity of both adsorbates
for all adsorbates increased with increasing initial concentration, flow rate
and amount of adsorbent.
44
Adam - Bohart and Yoon-Nelson kinetic models were suitable to
measured the adsorption data well for all adsorbate-adsorbent systems. It
was found that the adsorption capacities of both adsorbents in continuous
system were higher than those in the batch system [68].
2.24 Study Area:
2.24.1 Location:
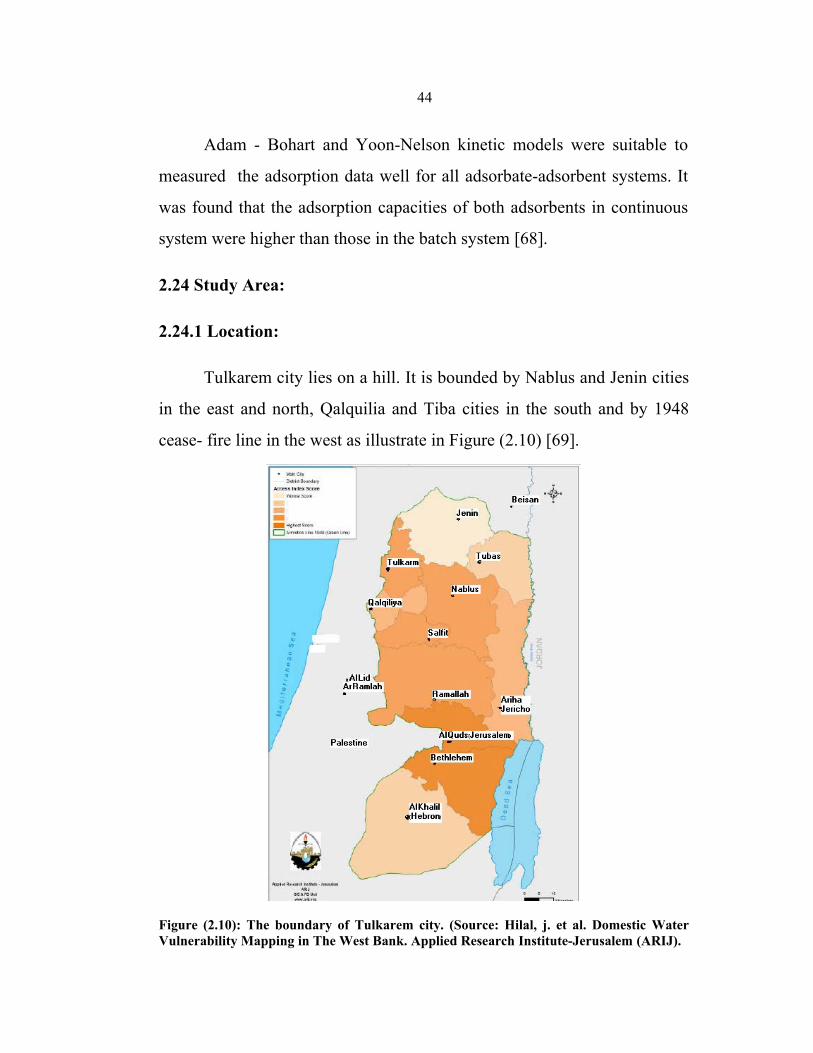
Tulkarem city lies on a hill. It is bounded by Nablus and Jenin cities
in the east and north, Qalquilia and Tiba cities in the south and by 1948
cease- fire line in the west as illustrate in Figure (2.10) [69].
Figure (2.10): The boundary of Tulkarem city. (Source: Hilal, j. et al. Domestic Water Vulnerability Mapping in The West Bank. Applied Research Institute-Jerusalem (ARIJ).
45
2.24.2 Area & Agriculture:
Tulkarem City is an agricultural city and its area about 253,450
dunum from the total area of Tulkarem district that is about 334,530
dunum, the arable area in Tulkarem City is 209,064 dunum, but the
actually cultivated area is 138,368 dunum. These areas are mainly
cultivated with fruit trees, vegetables and field crops [70, 71].
2.24.3 Climate:
Climate of the study area is a Mediterranean type with hot summers
and warm winters.
Precipitation the rainy season starts in October and continues
through May. Almost 70 % of the annual rainfall occurs in December and
January. The mean annual rainfall in Tulkarem City is 612.3 mm for the
period from 1952 to 2009.
Humidity in Tulkarem district reaches high values with an annual
average of 69.6 %, which rises in winter to 75.9 % in February, while it
reaches its lowest value of 62.4 % in May.
Temperature in Tulkarem district, the mean annual maximum
temperature is 22.3 C.
Winds the wind direction in Tulkarem mainly lies between the
southwest and northwest with mean annual wind speed of 3.4 km/hr.
Khamaseen winds blow over the area in the spring full with sand and dust,
causing rising temperature and drop in humidity. The main daily wind
46
speed from April to June is 7 Km/hr. Table (2.2) shows different parameter
that is related to weather of Tulkarem City for the year 2008-2009 [72].
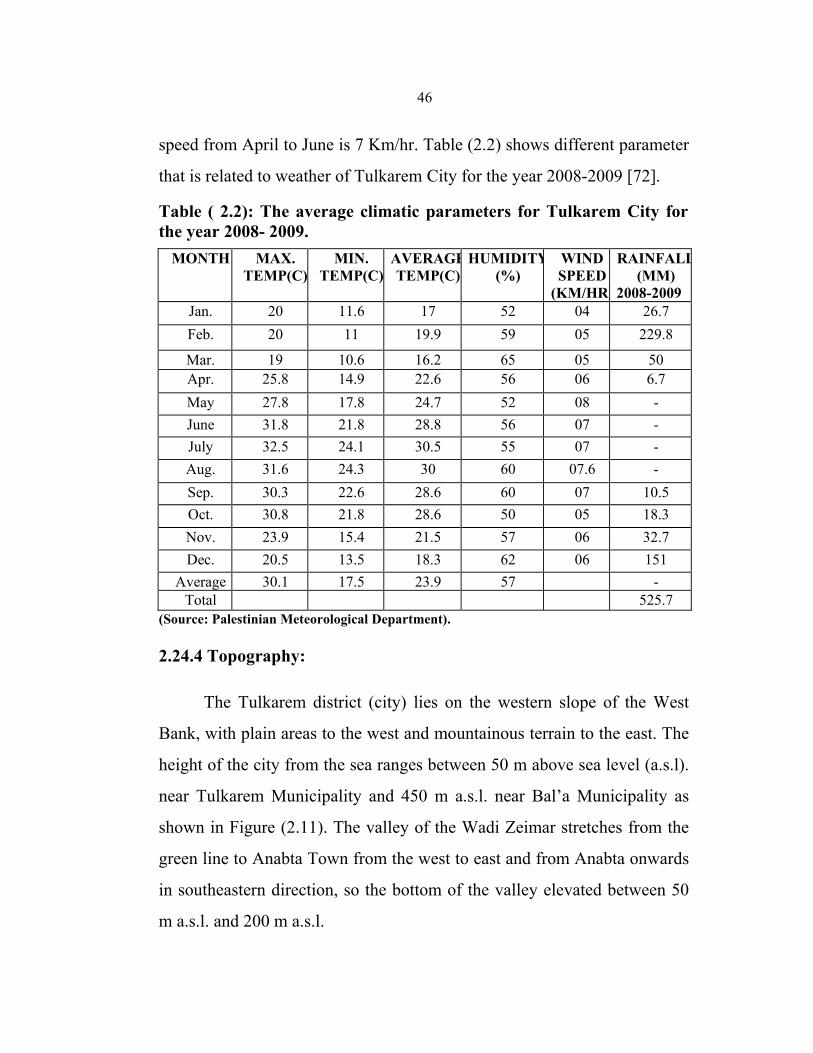
Table ( 2.2): The average climatic parameters for Tulkarem City for the year 2008- 2009.
MONTH MAX. TEMP(C)
MIN. TEMP(C)
AVERAGETEMP(C)
HUMIDITY(%)
WIND SPEED
(KM/HR)
RAINFALL(MM)
2008-2009 Jan. 20 11.6 17 52 04 26.7 Feb. 20 11 19.9 59 05 229.8
Mar. 19 10.6 16.2 65 05 50 Apr. 25.8 14.9 22.6 56 06 6.7 May 27.8 17.8 24.7 52 08 - June 31.8 21.8 28.8 56 07 - July 32.5 24.1 30.5 55 07 - Aug. 31.6 24.3 30 60 07.6 - Sep. 30.3 22.6 28.6 60 07 10.5 Oct. 30.8 21.8 28.6 50 05 18.3 Nov. 23.9 15.4 21.5 57 06 32.7 Dec. 20.5 13.5 18.3 62 06 151
Average 30.1 17.5 23.9 57 - Total 525.7
(Source: Palestinian Meteorological Department).
2.24.4 Topography:
The Tulkarem district (city) lies on the western slope of the West
Bank, with plain areas to the west and mountainous terrain to the east. The
height of the city from the sea ranges between 50 m above sea level (a.s.l).
near Tulkarem Municipality and 450 m a.s.l. near Bal’a Municipality as
shown in Figure (2.11). The valley of the Wadi Zeimar stretches from the
green line to Anabta Town from the west to east and from Anabta onwards
in southeastern direction, so the bottom of the valley elevated between 50
m a.s.l. and 200 m a.s.l.
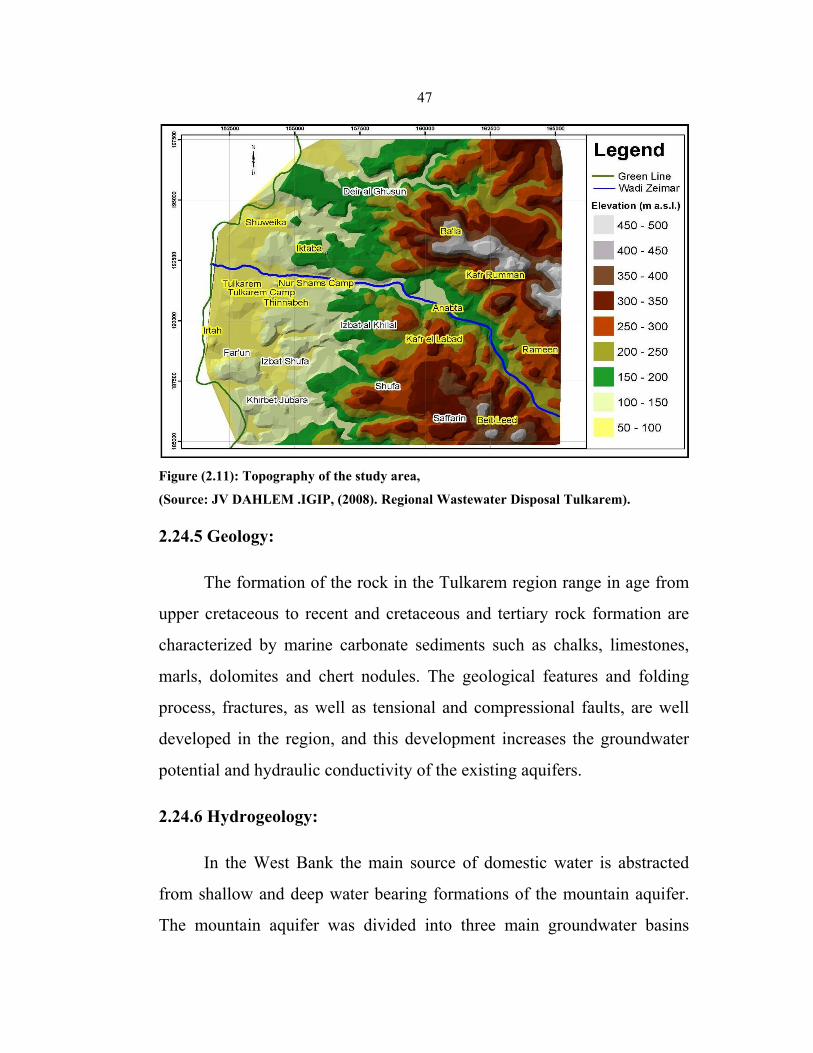
47
Figure (2.11): Topography of the study area,
(Source: JV DAHLEM .IGIP, (2008). Regional Wastewater Disposal Tulkarem).
2.24.5 Geology:
The formation of the rock in the Tulkarem region range in age from
upper cretaceous to recent and cretaceous and tertiary rock formation are
characterized by marine carbonate sediments such as chalks, limestones,
marls, dolomites and chert nodules. The geological features and folding
process, fractures, as well as tensional and compressional faults, are well
developed in the region, and this development increases the groundwater
potential and hydraulic conductivity of the existing aquifers.
2.24.6 Hydrogeology:
In the West Bank the main source of domestic water is abstracted
from shallow and deep water bearing formations of the mountain aquifer.
The mountain aquifer was divided into three main groundwater basins
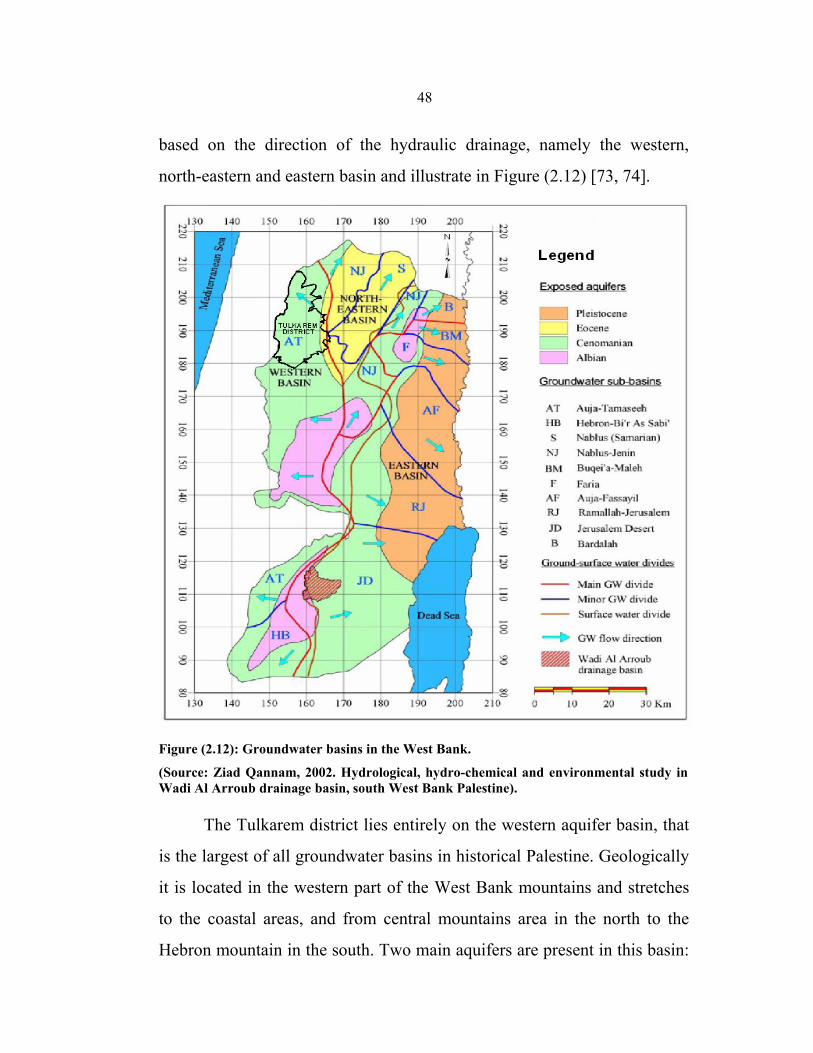
48
based on the direction of the hydraulic drainage, namely the western,
north-eastern and eastern basin and illustrate in Figure (2.12) [73, 74].
Figure (2.12): Groundwater basins in the West Bank.
(Source: Ziad Qannam, 2002. Hydrological, hydro-chemical and environmental study in Wadi Al Arroub drainage basin, south West Bank Palestine).
The Tulkarem district lies entirely on the western aquifer basin, that
is the largest of all groundwater basins in historical Palestine. Geologically
it is located in the western part of the West Bank mountains and stretches
to the coastal areas, and from central mountains area in the north to the
Hebron mountain in the south. Two main aquifers are present in this basin:
49
the upper and the lower aquifers. The average thickness of these aquifers
ranges between 600-900 meters.
The average annual natural recharge of water for the western aquifer
is around 400-440 Mcm/yr. The annual abstraction of water from the basin
reaches to 338 Mcm/yr, and most of these waters 317 Mcm/yr is being
pumped from the Israeli wells that are situated along the West Bank
border.
Palestinians have very low share in groundwater in pumping from
this basin and there are 151 wells run at low pumping rate and their
average pumping 20.9 Mcm/yr. Where, Israel has more than 500 wells just
inside and along its borders with the West Bank [75].
In Tulkarem there are three major aquifers, the cenomanian aquifer
(lower aquifer), upper cenomanian turonian (upper aquifer) and the eocene
complexes. The latter is not of great importance because of its limited
capability to store groundwater. The lower aquifer is deep with high
capacity and productivity of water, this is due to the great thickness of up
to 400 m of dolomitic limestone. In Tulkarem the lower aquifer has not
been explored yet as the high yielding wells in the upper aquifer can satisfy
the required amount of water.
The water quality of the upper aquifer is generally good, though the
aquifer is exposed to pollution caused by sewage disposal in the wadis,
leaking landfills, leaking cesspits, and the infiltration of chemicals released
on the surface. Analyses show high levels of nitrate in most of the wells in
the area and these high nitrate levels are attributed to the leachate of
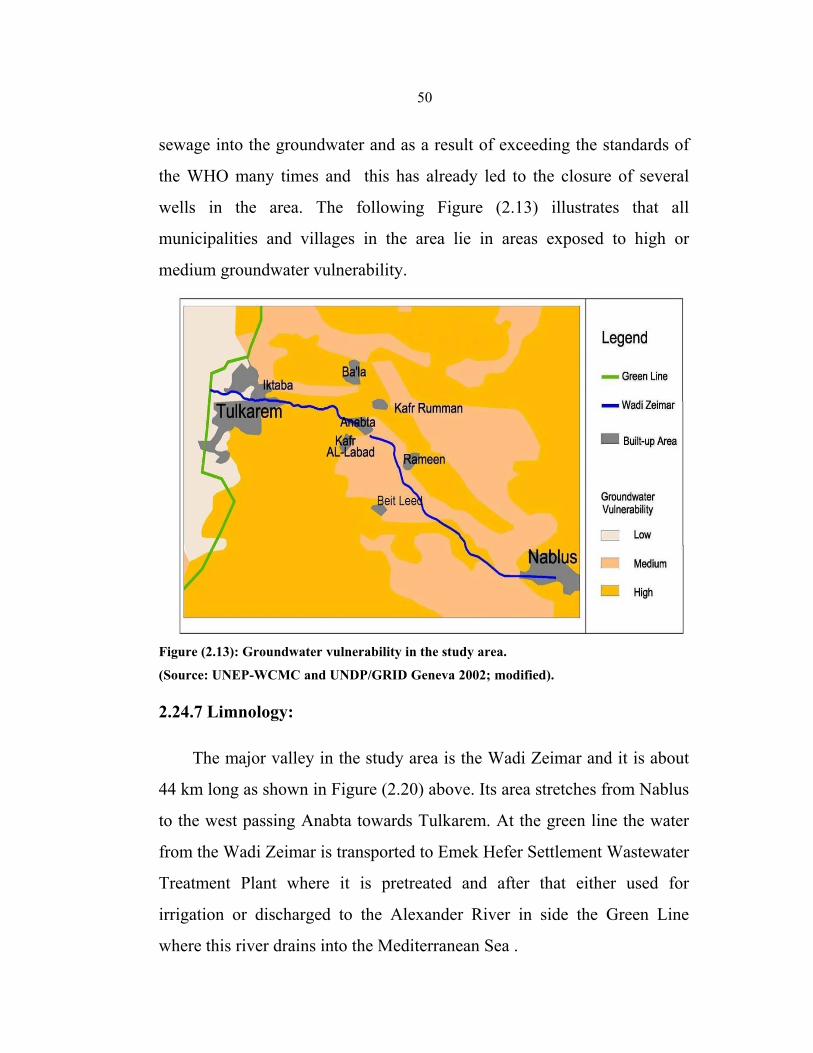
50
sewage into the groundwater and as a result of exceeding the standards of
the WHO many times and this has already led to the closure of several
wells in the area. The following Figure (2.13) illustrates that all
municipalities and villages in the area lie in areas exposed to high or
medium groundwater vulnerability.
Figure (2.13): Groundwater vulnerability in the study area.
(Source: UNEP-WCMC and UNDP/GRID Geneva 2002; modified).
2.24.7 Limnology:
The major valley in the study area is the Wadi Zeimar and it is about
44 km long as shown in Figure (2.20) above. Its area stretches from Nablus
to the west passing Anabta towards Tulkarem. At the green line the water
from the Wadi Zeimar is transported to Emek Hefer Settlement Wastewater
Treatment Plant where it is pretreated and after that either used for
irrigation or discharged to the Alexander River in side the Green Line
where this river drains into the Mediterranean Sea .
51
The main tributary for Wadi Zeimar is Wadi Deir Sharaf that
confluence with the Wadi Zeimar near the Rameen Village. The border of
the Wadi Zeimar is Wadi Massin which is in the north, and Wadi Sajour
and Wadi el Tin which is in the south.
The wadis have a typical temporary runoff pattern with surface
runoff only during the winter season from November to March. However,
Wadi Zeimar shows a permanent runoff throughout the year, waste waters
from Nablus, Sabastya, in the upper catchment area and from Anabta and
Tulkarem in the lower catchment area during the dry season is discharged
into Wadi Zeimer [73]. It contains wastewater from industries, stone
sawmills, solid wastes, leather factories, garages and more.
Ten months out of every year the color of the water is white, due to
the stone powder spread along the stream, the other two months of the
year, October and December, the color water is black due to the organic
matter from the olive waste that is released into the stream from about 26
olive mills that are spread in the area [75].
2.24.8 Groundwater Quality:
The groundwater pollution that caused by infiltration of wastewater
can be evaluated by measuring the standard parameters of sulphate,
chloride, phosphorus nitrate and coliform bacteria. These standard
parameters and their sources are indicated in the following Table (2.3):
52
Table (2.3): Standard parameters and their sources. STANDARD PARAMETERS
SOURCE
Ammonium/Nitrate/Nitrite Fertilizer, feedlots (livestock), sewage. Chloride Saltwater intrusion, mineral dissolution,
industrial or domestic waste & wastewater.Coliform Bacteria Domestic sewage, animal waste, plant or
soil material. Phosphorus Fertilizer, domestic wastewater, detergent. Sulphate Saltwater intrusion, mineral dissolution,
domestic or industrial waste & wastewater.
The concentration of the above parameters in the groundwater is
related to the physical rainfall and anthropogenic factors like agricultural
activities, industrial and domestic pollution and the geological formation of
high permeability of the rocks making the groundwater vulnerable to
anthropogenic factors. Land used around the wells mainly varies from
agricultural, including olive groves, to urban. All wells are drawing their
water from the upper aquifer.
Names of some selected wells located in the study area are given in
the following Table (2.4), also indicating the land use pattern of adjacent
areas and whether the well is located in the Wadi Zeimar area or not.
Table (2.4): Some wells in the study area. WELL NAME URBAN
AREA AGRICULTURAL
AREA OLIVE GROVE
WADI ZEIMAR
TulkaremMunicipality wells1, 2, 3, 4, 5, 6.
√ √ - √
Hafedh Alhamdallah √ √ - √ Rafeeq Hamdallah √ √ - √ Rafat Al Qubbaj √ √ - √ Hasan Mahmud Khaleel
- √ - -
Bala Village Council - - √ - Anabta 1, 2 √ √ - √
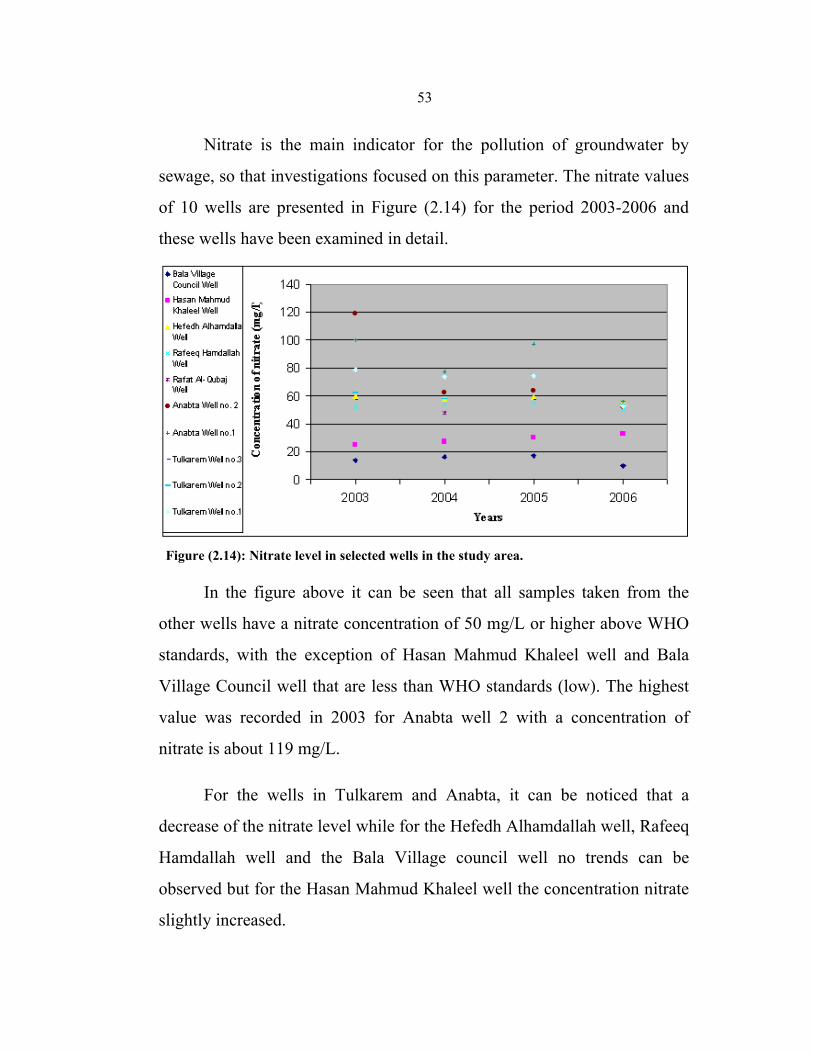
53
Nitrate is the main indicator for the pollution of groundwater by
sewage, so that investigations focused on this parameter. The nitrate values
of 10 wells are presented in Figure (2.14) for the period 2003-2006 and
these wells have been examined in detail.
Figure (2.14): Nitrate level in selected wells in the study area.
In the figure above it can be seen that all samples taken from the
other wells have a nitrate concentration of 50 mg/L or higher above WHO
standards, with the exception of Hasan Mahmud Khaleel well and Bala
Village Council well that are less than WHO standards (low). The highest
value was recorded in 2003 for Anabta well 2 with a concentration of
nitrate is about 119 mg/L.
For the wells in Tulkarem and Anabta, it can be noticed that a
decrease of the nitrate level while for the Hefedh Alhamdallah well, Rafeeq
Hamdallah well and the Bala Village council well no trends can be
observed but for the Hasan Mahmud Khaleel well the concentration nitrate
slightly increased.
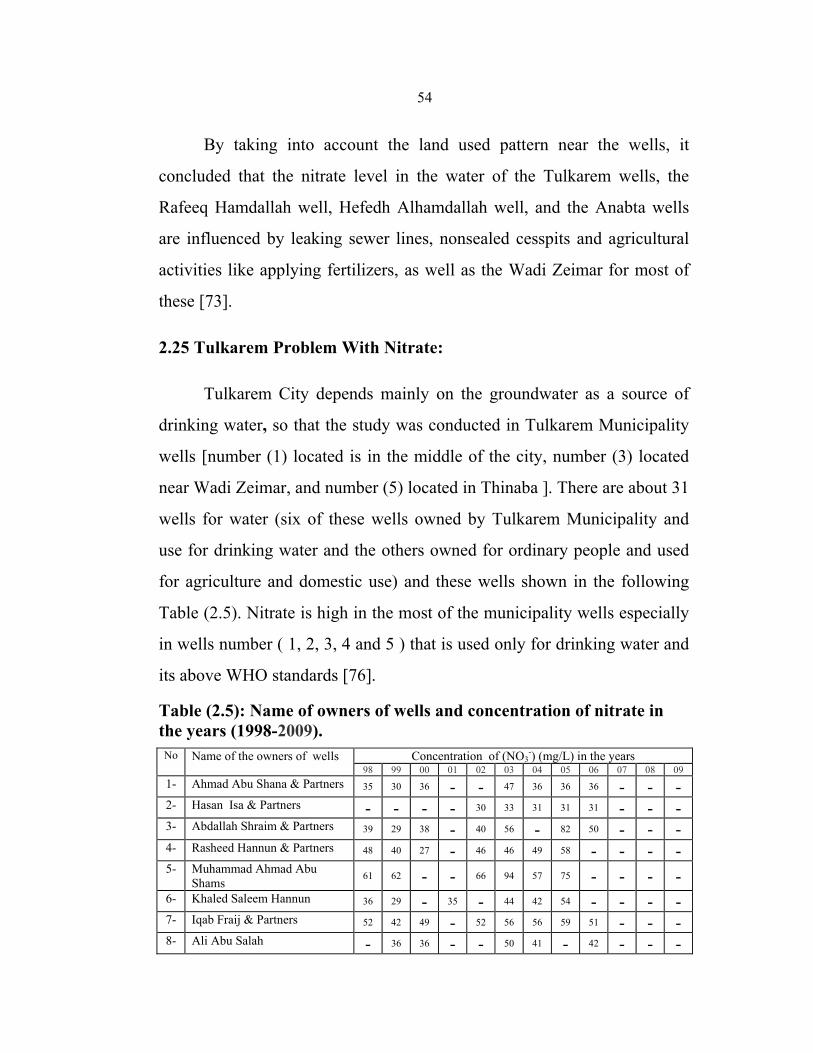
54
By taking into account the land used pattern near the wells, it
concluded that the nitrate level in the water of the Tulkarem wells, the
Rafeeq Hamdallah well, Hefedh Alhamdallah well, and the Anabta wells
are influenced by leaking sewer lines, nonsealed cesspits and agricultural
activities like applying fertilizers, as well as the Wadi Zeimar for most of
these [73].
2.25 Tulkarem Problem With Nitrate:
Tulkarem City depends mainly on the groundwater as a source of
drinking water, so that the study was conducted in Tulkarem Municipality
wells [number (1) located is in the middle of the city, number (3) located
near Wadi Zeimar, and number (5) located in Thinaba ]. There are about 31
wells for water (six of these wells owned by Tulkarem Municipality and
use for drinking water and the others owned for ordinary people and used
for agriculture and domestic use) and these wells shown in the following
Table (2.5). Nitrate is high in the most of the municipality wells especially
in wells number ( 1, 2, 3, 4 and 5 ) that is used only for drinking water and
its above WHO standards [76].
Table (2.5): Name of owners of wells and concentration of nitrate in the years (1998-2009). No Name of the owners of wells Concentration of (NO3
-) (mg/L) in the years 98 99 00 01 02 03 04 05 06 07 08 09
1- Ahmad Abu Shana & Partners 35 30 36 - - 47 36 36 36 - - - 2- Hasan Isa & Partners - - - - 30 33 31 31 31 - - -3- Abdallah Shraim & Partners 39 29 38 - 40 56 - 82 50 - - - 4- Rasheed Hannun & Partners 48 40 27 - 46 46 49 58 - - - - 5- Muhammad Ahmad Abu
Shams 61 62 - - 66 94 57 75 - - - - 6- Khaled Saleem Hannun 36 29 - 35 - 44 42 54 - - - - 7- Iqab Fraij & Partners 52 42 49 - 52 56 56 59 51 - - - 8- Ali Abu Salah - 36 36 - - 50 41 - 42 - - -
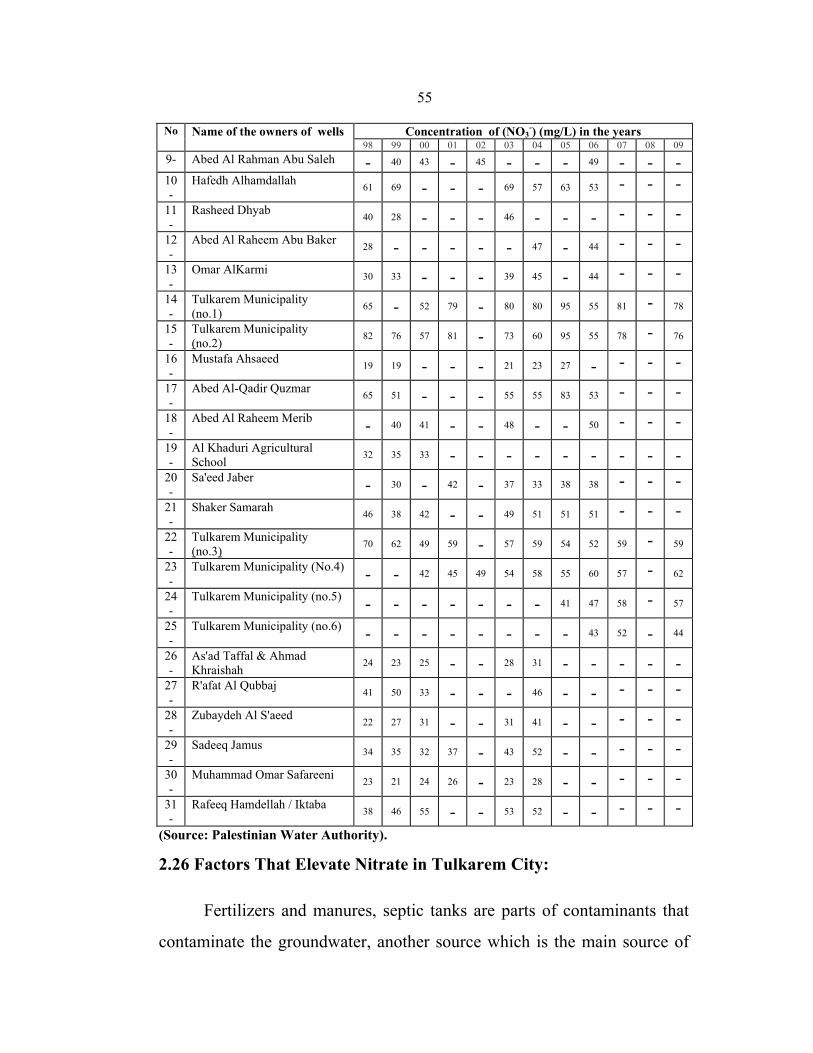
55
No Name of the owners of wells Concentration of (NO3-) (mg/L) in the years
98 99 00 01 02 03 04 05 06 07 08 09 9- Abed Al Rahman Abu Saleh - 40 43 - 45 - - - 49 - - - 10-
Hafedh Alhamdallah 61 69 - - - 69 57 63 53 - - - 11-
Rasheed Dhyab 40 28 - - - 46 - - - - - - 12-
Abed Al Raheem Abu Baker 28 - - - - - 47 - 44 - - - 13-
Omar AlKarmi 30 33 - - - 39 45 - 44 - - - 14-
Tulkarem Municipality (no.1) 65 - 52 79 - 80 80 95 55 81 - 78
15-
Tulkarem Municipality (no.2) 82 76 57 81 - 73 60 95 55 78 - 76
16-
Mustafa Ahsaeed 19 19 - - - 21 23 27 - - - - 17-
Abed Al-Qadir Quzmar 65 51 - - - 55 55 83 53 - - - 18-
Abed Al Raheem Merib - 40 41 - - 48 - - 50 - - - 19-
Al Khaduri Agricultural School 32 35 33 - - - - - - - - -
20-
Sa'eed Jaber - 30 - 42 - 37 33 38 38 - - - 21-
Shaker Samarah 46 38 42 - - 49 51 51 51 - - - 22-
Tulkarem Municipality (no.3) 70 62 49 59 - 57 59 54 52 59 - 59
23-
Tulkarem Municipality (No.4) - - 42 45 49 54 58 55 60 57 - 62
24-
Tulkarem Municipality (no.5) - - - - - - - 41 47 58 - 57
25-
Tulkarem Municipality (no.6) - - - - - - - - 43 52 - 44
26-
As'ad Taffal & Ahmad Khraishah 24 23 25 - - 28 31 - - - - -
27-
R'afat Al Qubbaj 41 50 33 - - - 46 - - - - - 28-
Zubaydeh Al S'aeed 22 27 31 - - 31 41 - - - - - 29-
Sadeeq Jamus 34 35 32 37 - 43 52 - - - - - 30-
Muhammad Omar Safareeni 23 21 24 26 - 23 28 - - - - - 31-
Rafeeq Hamdellah / Iktaba 38 46 55 - - 53 52 - - - - - (Source: Palestinian Water Authority).
2.26 Factors That Elevate Nitrate in Tulkarem City:
Fertilizers and manures, septic tanks are parts of contaminants that
contaminate the groundwater, another source which is the main source of
56
the contamination is Wadi Zaimer, dump site, Israeli factors and depth of
wells.
2.26.1 Fertilizers and Manure:
Tulkarm City is located on agriculture lands, so that there is extensive
use for chemical fertilizers and animals manure (without planning) to give
nitrogen supply which is essential for plant growth, which is converted in
the soil to nitrate and leachate to ground water and pollute it.
2.26.2 Septic Tanks:
Septic tanks are old way for storage wastewater that get out of
houses and factories, so that if these septic tanks are not built well with
concrete from inside the wastewater will leachate to groundwater and
pollute it.
Parts of Tulkarm City is not connected to the public sewerage network
and still using septic tanks for storage wastewater, there are about 217
septic tanks (92 is still in use which 192 are not) around wells numbers (1
& 2) only according to survey done by the department of health &
department of water in Tulkarem Municipality. Sewerage network covers
about (55 %-60 %) of Tulkarem, Shuweika, Irtah, Tulkarem Camp and Nur
Shams Camp [77].
The sewerage system of Tulkarem City and Shuweika Village
operates by Tulkarem Municipality, and the sewerage systems in Tulkarem
Camp and Nur Shams Camp are operated by UNRWA.
57
The Tulkarem trunk system consists of several main trunks and one
force main, which transport the wastewater to the existing ponds west of
Tulkarem while the main trunk of Shuweika discharges the wastewater
directly into the Wadi Zeimar.
2.26.3 Wadi Zaimer:
Wadi Zaimer extends from western part of Nablus city to Tulkarm
City, its about 44 km long. The largest discharge of wastewater to Wadi
Zaimer is comes from the western part of Nablus city at estimated rate of
7000 m3/day, then along its path to Tulkarm area, the quantity increase
according to the other discharge of wastewater from the nearby villages to
reach 20000 m3/day including industrial wastewater which is discharge
directly into Wadi Zaimer [78].
2.26.4 Dump Site:
There are two dump sites in Tulkarem City, one in the eastern part of
the city near Nur Shams Camp which is very close to Wadi Zaimer, used
by Anabta Municipality, and other villages and the second one in the
southern part of the city near Freon and Kaffa Villages, used by Tulkarem
Municipality and other villages in the area and also of Israeli settlements.
These dump site is close to Abu Darany, Eatar, Yousef Omar, and Hasanen
wells that are used for drinking and agriculture, and as you know that there
are many things that dumped in these dump sites such as animals manure,
dead animals, food, fruit, vegetables and chemicals that contain nitrogen
which is converted to toxic gases when its burned it pollutes the air ,and
converted to nitrate and leachate to groundwater and pollute it.
58
2.26.5 Israeli Chemical Factories:
In the western part of the city there are about twelve Israeli chemical
factories that extend from northern to southern part of the city and these
factories are very dangerous on the public health. One of these factories is
Gesshory Chemical Factory that manufacture many dangerous chemicals
like fertilizers, pesticides, herbicides, paints and other dangerous
chemicals.
2.26.6 Depth of The Wells:
Tulkarem city, Irtah, Shuweika, Tulkarem and Nur Shams Camps
depend on Tulkarem Municipality wells for water drinking. Table (2.6)
shows the depth of each well.
Table (2.6): Depth of Municipality wells. NAME OF THE WELL DEPTH (M)
1- Well no.(1) Al kaddeem 90 2- Well no.(2) AlFaddlia 125 3- Well no.(3) Shuweika 157 4- Well no.(4) Al Mesnawi 125 5- Well no.(5) Thenabah 186 6- Well no.(6) Al Ezba 202
(Source: Water Department / Tulkarem Municipality).
Tulkarem City located on the western basin which is rich in
groundwater, it gets its supply of water from the upper part of the aquifer
that is illustrated from the depth of wells in the Table (2.6) so that the
groundwater exposed to pollutants like nitrate that goes through soil to
groundwater. The well's depth is not enough to prevent nitrate from
leachate down, since it is found that as the well depth increase, the quality
of water becomes better and less in nitrate.
59
CHAPTER THREE
Materials And Methods
3.1 Chemicals and Reagents:
3.1.1 Chemicals:
All chemicals used were of analytical grade.
- Sodium Nitrate [NaNO3] granules.
- Ammonium Sulphate [(NH4)2SO4] powder: MERCK.
- Potassium Dihydrogen Phosphate [KH2PO4] powder: Alfa Aesar.
- Concentrated acids (H2SO4, HNO3, HCl).
- Concentrated NaOH.
- Ascorbic acid 90 % (C6H8O6).
- Boric acid.
- K2SO4, CuSO4, AgNO3, NH4SCN.
3.1.2 Reagents:
- Distilled water that is nitrate free.
- Recommended ISAB [KH2PO4]: Recommended ionic strength
adjustment buffer [KH2PO4].
- Nitrate reagent of different concentrations (2000 mg/L, 78 mg/L,
1950 mg/L , 59 mg/L, 1475 mg/L, 57 mg/L, 1425 mg/L ).
60
- Ammonium Sulphate [(NH4)2SO4] reagent of different
concentrations (1 M, 2 M, 0.04 M) ,preparation of these reagent
illustrated in appendix (1.1).
3.2 Instruments:
- Ion selective electrode meter (JENWAY) and nitrate electrode 924-
300 S/N.
- Flask shaker (3F1) with max. speed 800 osc/min (Stuart).
- Analytical sieve (Cisa) BA 200N Cedacedia industry.
- Manual sieve, 2 mm .
- Oven (memmert).
- Analytical balance (Boeco/ Germany) max 210 g.
- Jenway 450 Conductimeter.
- Hanna Hi Microcomputer pH meter.
- Hermle Z 200 A, Centrifuge.
- Vulcan A 500, Furnace.
- Kjeldahl Instrument.
- Spectrophotometer.
- Analytical balance (Sartorius) ) max 1200 g.
- Magnetic stirrer (Fisher scientific).
- Filter paper no. 4 MACHEREY-NAGEL , 125mm.
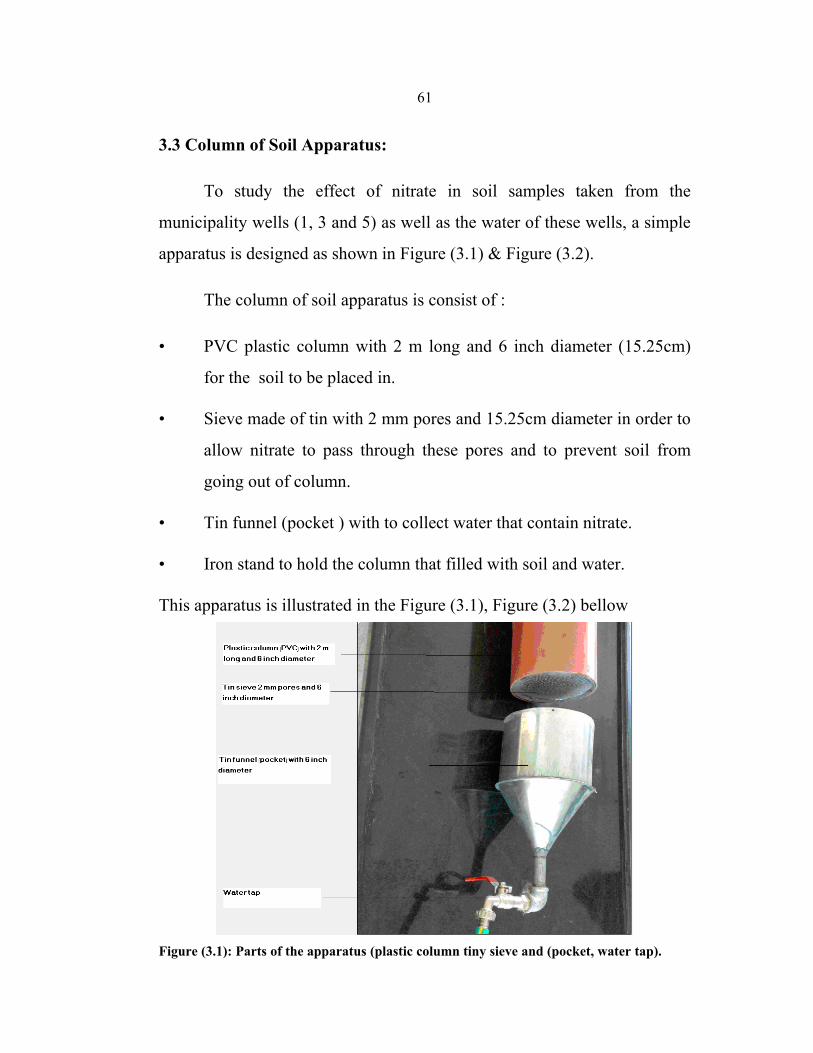
61
3.3 Column of Soil Apparatus:
To study the effect of nitrate in soil samples taken from the
municipality wells (1, 3 and 5) as well as the water of these wells, a simple
apparatus is designed as shown in Figure (3.1) & Figure (3.2).
The column of soil apparatus is consist of :
• PVC plastic column with 2 m long and 6 inch diameter (15.25cm)
for the soil to be placed in.
• Sieve made of tin with 2 mm pores and 15.25cm diameter in order to
allow nitrate to pass through these pores and to prevent soil from
going out of column.
• Tin funnel (pocket ) with to collect water that contain nitrate.
• Iron stand to hold the column that filled with soil and water.
This apparatus is illustrated in the Figure (3.1), Figure (3.2) bellow
Figure (3.1): Parts of the apparatus (plastic column tiny sieve and (pocket, water tap).
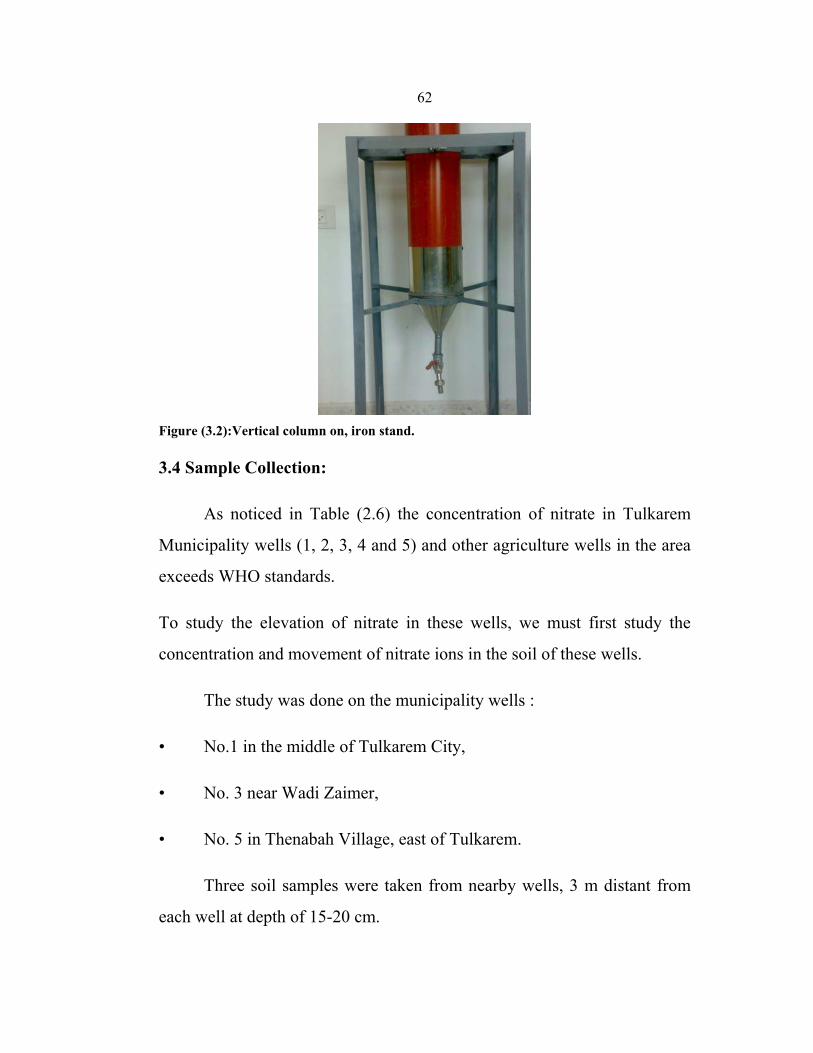
62
Figure (3.2):Vertical column on, iron stand.
3.4 Sample Collection:
As noticed in Table (2.6) the concentration of nitrate in Tulkarem
Municipality wells (1, 2, 3, 4 and 5) and other agriculture wells in the area
exceeds WHO standards.
To study the elevation of nitrate in these wells, we must first study the
concentration and movement of nitrate ions in the soil of these wells.
The study was done on the municipality wells :
• No.1 in the middle of Tulkarem City,
• No. 3 near Wadi Zaimer,
• No. 5 in Thenabah Village, east of Tulkarem.
Three soil samples were taken from nearby wells, 3 m distant from
each well at depth of 15-20 cm.
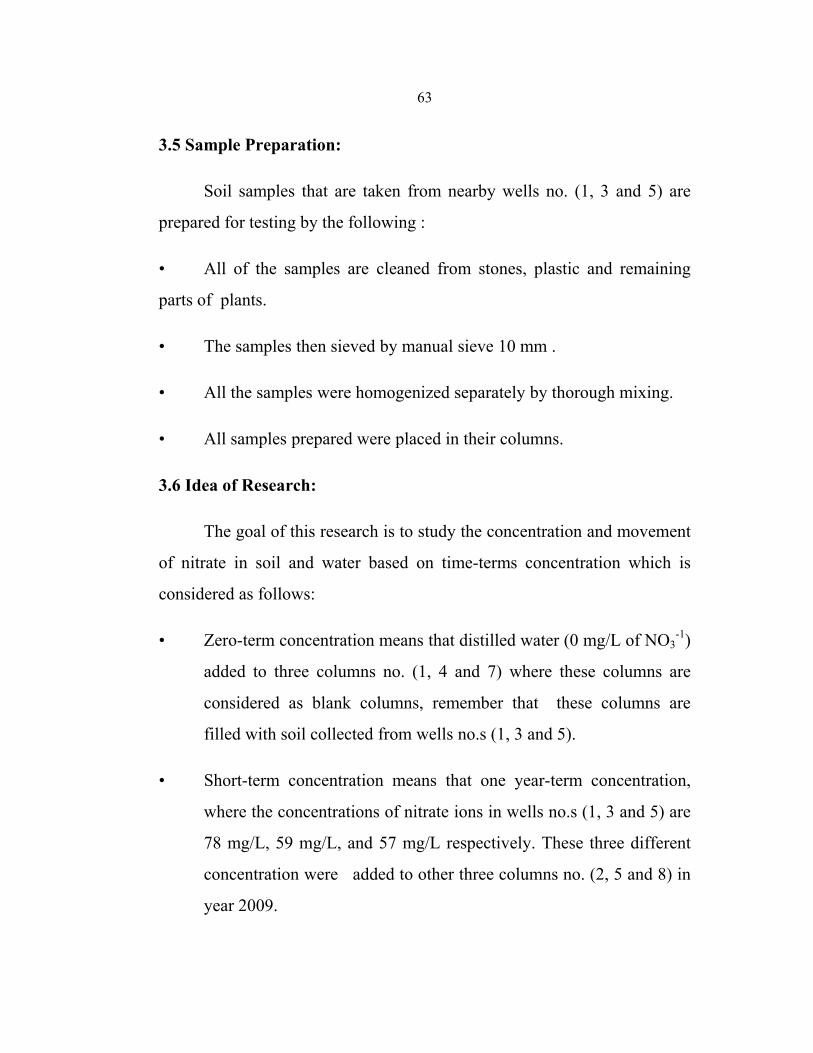
63
3.5 Sample Preparation:
Soil samples that are taken from nearby wells no. (1, 3 and 5) are
prepared for testing by the following :
• All of the samples are cleaned from stones, plastic and remaining
parts of plants.
• The samples then sieved by manual sieve 10 mm .
• All the samples were homogenized separately by thorough mixing.
• All samples prepared were placed in their columns.
3.6 Idea of Research:
The goal of this research is to study the concentration and movement
of nitrate in soil and water based on time-terms concentration which is
considered as follows:
• Zero-term concentration means that distilled water (0 mg/L of NO3-1)
added to three columns no. (1, 4 and 7) where these columns are
considered as blank columns, remember that these columns are
filled with soil collected from wells no.s (1, 3 and 5).
• Short-term concentration means that one year-term concentration,
where the concentrations of nitrate ions in wells no.s (1, 3 and 5) are
78 mg/L, 59 mg/L, and 57 mg/L respectively. These three different
concentration were added to other three columns no. (2, 5 and 8) in
year 2009.
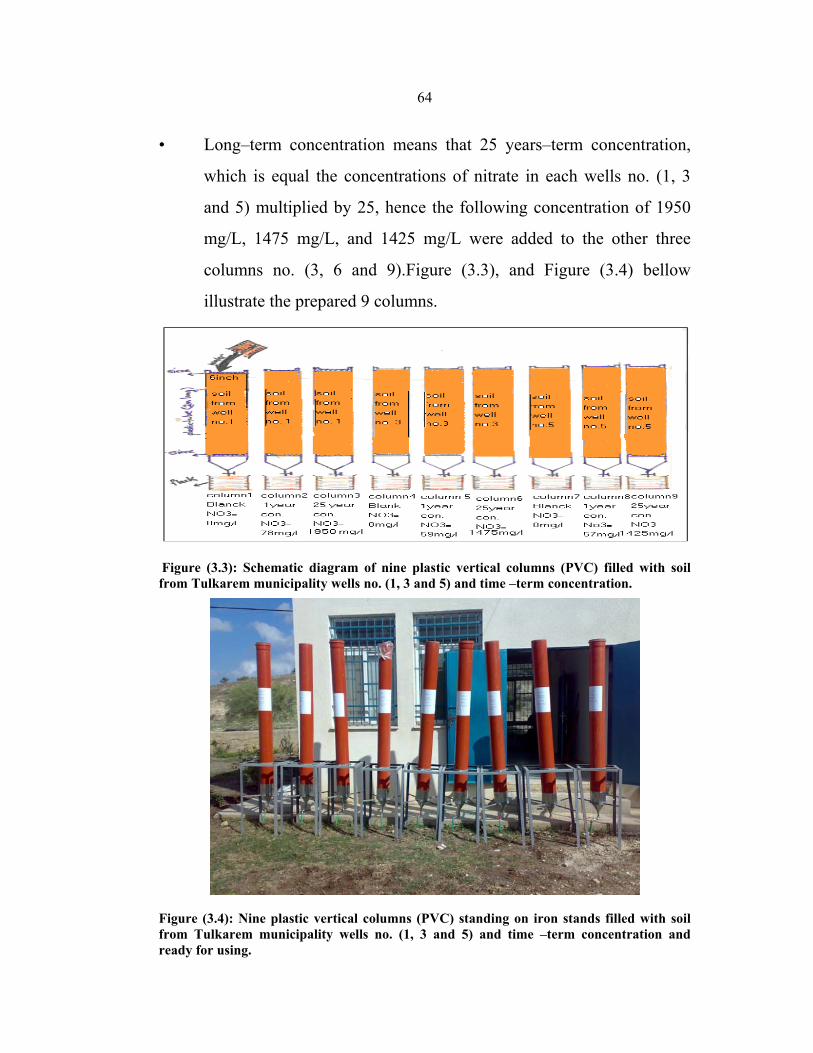
64
• Long–term concentration means that 25 years–term concentration,
which is equal the concentrations of nitrate in each wells no. (1, 3
and 5) multiplied by 25, hence the following concentration of 1950
mg/L, 1475 mg/L, and 1425 mg/L were added to the other three
columns no. (3, 6 and 9).Figure (3.3), and Figure (3.4) bellow
illustrate the prepared 9 columns.
Figure (3.3): Schematic diagram of nine plastic vertical columns (PVC) filled with soil from Tulkarem municipality wells no. (1, 3 and 5) and time –term concentration.
Figure (3.4): Nine plastic vertical columns (PVC) standing on iron stands filled with soil from Tulkarem municipality wells no. (1, 3 and 5) and time –term concentration and ready for using.
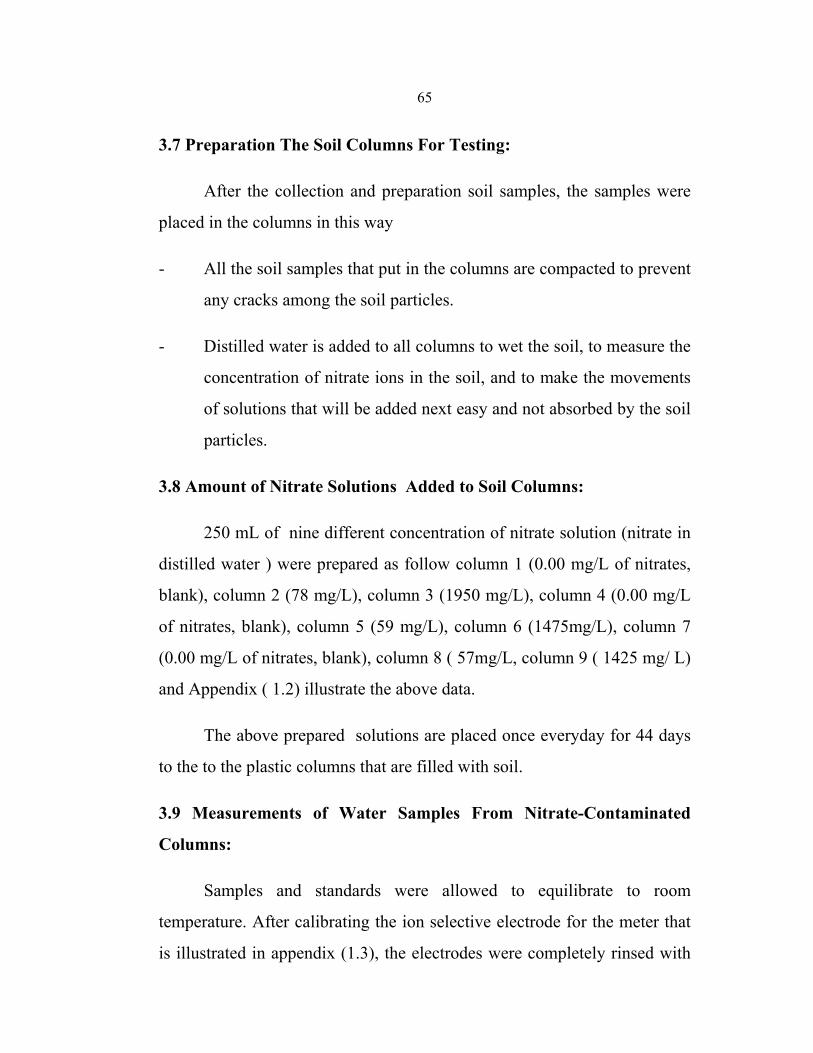
65
3.7 Preparation The Soil Columns For Testing:
After the collection and preparation soil samples, the samples were
placed in the columns in this way
- All the soil samples that put in the columns are compacted to prevent
any cracks among the soil particles.
- Distilled water is added to all columns to wet the soil, to measure the
concentration of nitrate ions in the soil, and to make the movements
of solutions that will be added next easy and not absorbed by the soil
particles.
3.8 Amount of Nitrate Solutions Added to Soil Columns:
250 mL of nine different concentration of nitrate solution (nitrate in
distilled water ) were prepared as follow column 1 (0.00 mg/L of nitrates,
blank), column 2 (78 mg/L), column 3 (1950 mg/L), column 4 (0.00 mg/L
of nitrates, blank), column 5 (59 mg/L), column 6 (1475mg/L), column 7
(0.00 mg/L of nitrates, blank), column 8 ( 57mg/L, column 9 ( 1425 mg/ L)
and Appendix ( 1.2) illustrate the above data.
The above prepared solutions are placed once everyday for 44 days
to the to the plastic columns that are filled with soil.
3.9 Measurements of Water Samples From Nitrate-Contaminated
Columns:
Samples and standards were allowed to equilibrate to room
temperature. After calibrating the ion selective electrode for the meter that
is illustrated in appendix (1.3), the electrodes were completely rinsed with
66
distilled water then excess water was shaken gently off and dried. Then
50.0 mL of the collected water containing nitrate and 1.00 mL of ISAB
were added into a 100 ml beaker furnished with a magnetic stir bar. The
beaker was placed on a magnetic stirrer plate and stirred at slow speed then
the electrode tips immerse to just above the rotating stir bar. The meter
reading (concentration) was recorded as soon as the reading is stable .When
analyses have been completed, the electrodes were rinsed completely with
distilled water and store dry after covering the electrodes with caps [79,80].
3.10 Testing Nitrate Content For Soil Samples From Nitrate
Containing Columns:
By completing the addition of distilled and nitrate solutions with to
all nine columns in 44 days, the excess water was eluted out of the columns
completely. Now the nine columns are ready for testing according to the
following procedure:
Each one of the nine column is cut using electrical disk into four-50
cm equal parts, hence there are 36. Each part was designated with specific
number which is necessary to keep track of the columns part. All parts
were emptied from there contents and dried. All samples were air dried by
putting them on separated pieces of plastic on the floor and using ceiling
fan for 3-4 days. This way dryness is done in 80 %, then complete drying
was done in the oven for 1hr at 60 C°. Dryness in the oven was performed
on small scales whenever needed the homogenized. The oven-dried,
homogenized. The soil sample is grounded and sieved. 20 g of dried soil
sample and 50 mL of extractant 0.04 M (NH4)2SO4 were placed in a 125
mL Erlenmeyer flask. The contents were agitated a reciprocating shaker at
67
400 oscillations per minute. Filter The soil suspension sample was filtrated
using gravity filtration. Then the filtrate sample was tested for nitrate by
ion selective electrode [81].
3.11 Determination of Physical & Chemical Parameters For Soil
Samples:
3.11.1 Determination of The Soil Texture (Hydrometer Test):
The soil sample was broken into particles by using a mortar and
pestle . 1000 g of the sample weighted accurately. A stack of sieve made,
by placing a sieve with larger opening above a sieve with a smaller opening
The sieves that are used in a stack are numbers 4, 10, 20, 40, 60, 140 and
200. The sieve at the bottom should be number 200 and a pan should be
placed under sieve number 200 to collect the soil that get out sieve number
200. Pour the 1000g soil sample prepared into the stack sieve from top, and
put the cover on the top of the stack sieves. A sieve shaker was run for
about 10 to 15 minutes. The amount of soil retained on each sieve and the
pan was weighted, the amount of soil retained and pass can be calculated
by the following
Percent of soil retained on nth sieve
100 (w) weight total
retainedweight sieve on the retained Soil ×= (equation 3.1)
Cumulative percent passing through the nth sieve
= percent finer = 100 – (٪ retained ) (equation 3.2)
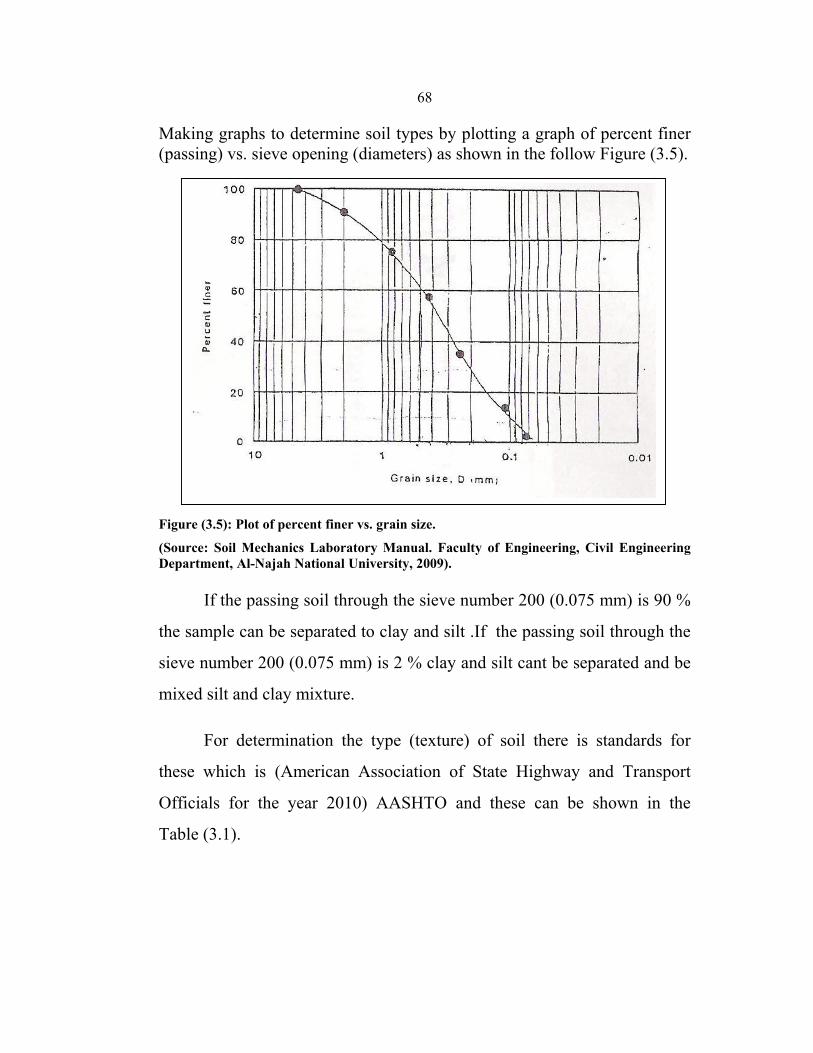
68
Making graphs to determine soil types by plotting a graph of percent finer (passing) vs. sieve opening (diameters) as shown in the follow Figure (3.5).
Figure (3.5): Plot of percent finer vs. grain size.
(Source: Soil Mechanics Laboratory Manual. Faculty of Engineering, Civil Engineering Department, Al-Najah National University, 2009).
If the passing soil through the sieve number 200 (0.075 mm) is 90 %
the sample can be separated to clay and silt .If the passing soil through the
sieve number 200 (0.075 mm) is 2 % clay and silt cant be separated and be
mixed silt and clay mixture.
For determination the type (texture) of soil there is standards for
these which is (American Association of State Highway and Transport
Officials for the year 2010) AASHTO and these can be shown in the
Table (3.1).
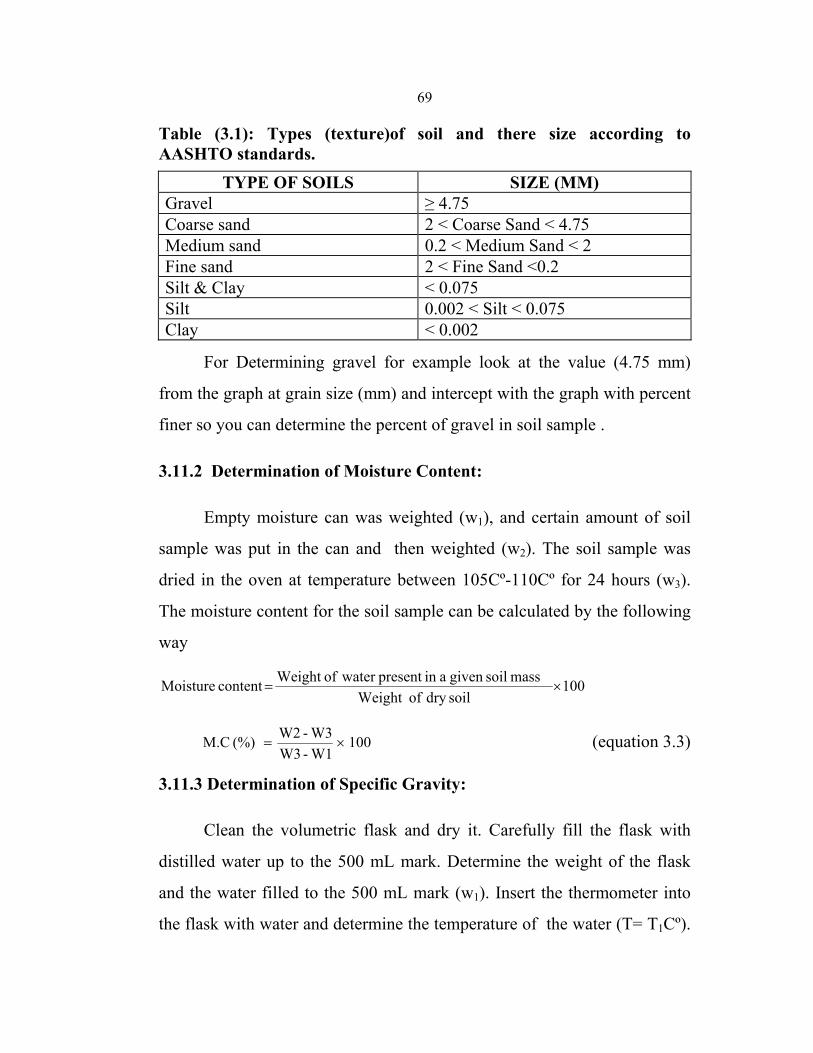
69
Table (3.1): Types (texture)of soil and there size according to AASHTO standards.
TYPE OF SOILS SIZE (MM) Gravel ≥ 4.75 Coarse sand 2 < Coarse Sand < 4.75 Medium sand 0.2 < Medium Sand < 2 Fine sand 2 < Fine Sand <0.2 Silt & Clay < 0.075Silt 0.002 < Silt < 0.075 Clay < 0.002
For Determining gravel for example look at the value (4.75 mm)
from the graph at grain size (mm) and intercept with the graph with percent
finer so you can determine the percent of gravel in soil sample .
3.11.2 Determination of Moisture Content:
Empty moisture can was weighted (w1), and certain amount of soil
sample was put in the can and then weighted (w2). The soil sample was
dried in the oven at temperature between 105Cº-110Cº for 24 hours (w3).
The moisture content for the soil sample can be calculated by the following
way
100soildry ofWeight
mass soilgiven ain present water ofWeight content Moisture ×=
100W1-W3W3-W2 (%) M.C ×= (equation 3.3)
3.11.3 Determination of Specific Gravity:
Clean the volumetric flask and dry it. Carefully fill the flask with
distilled water up to the 500 mL mark. Determine the weight of the flask
and the water filled to the 500 mL mark (w1). Insert the thermometer into
the flask with water and determine the temperature of the water (T= T1Cº).
70
Take approximately 100 gram of air dried soil in an evaporating dish. If the
soil is cohesive, add distilled water to the soil and mix to form a smooth
paste. Keep it soaked for about one–half to one hour in the evaporating
dish. (This step is not necessary for granular, i.e., non-cohesive soil).
Transfer the soil (if granular) or the soil paste (if cohesive ) into the
volumetric flask. Add distilled water to the volumetric flask containing the
soil to make it about two–thirds full. Remove air from the soil–water
mixture . This can be done by:
a- Gently boiling the flask with soil-water mixture for about 15 to 20
minute, accompany the boiling by continuous agitation.
b- Apply vacuum by a vacuum pump until all the entrapped air is out.
Bring the temperature of the soil–water mixture in the volumetric
flask up to room temperature. Add distilled water to the volumetric flask
until the bottom of the meniscus touches the 500 mL mark. Determine the
weight of the bottle plus soil plus water (w2). Check the temperature of the
soil and water in the flask to see if it is T1Cº±1 or not. Pour the soil and the
water into an evaporating dish. Using a plastic squeezing bottle, wash the
inside of the flask and make sure that no soil is left inside. Determine the
weight of the dry soil in the evaporating dish (w3).
by the following equation . The specific gravity can be calculated for the
soil samples.
waterof volumeequal ofWeight soil ofWeight (Gs)Gravity Specific =
Weight of soil = w3
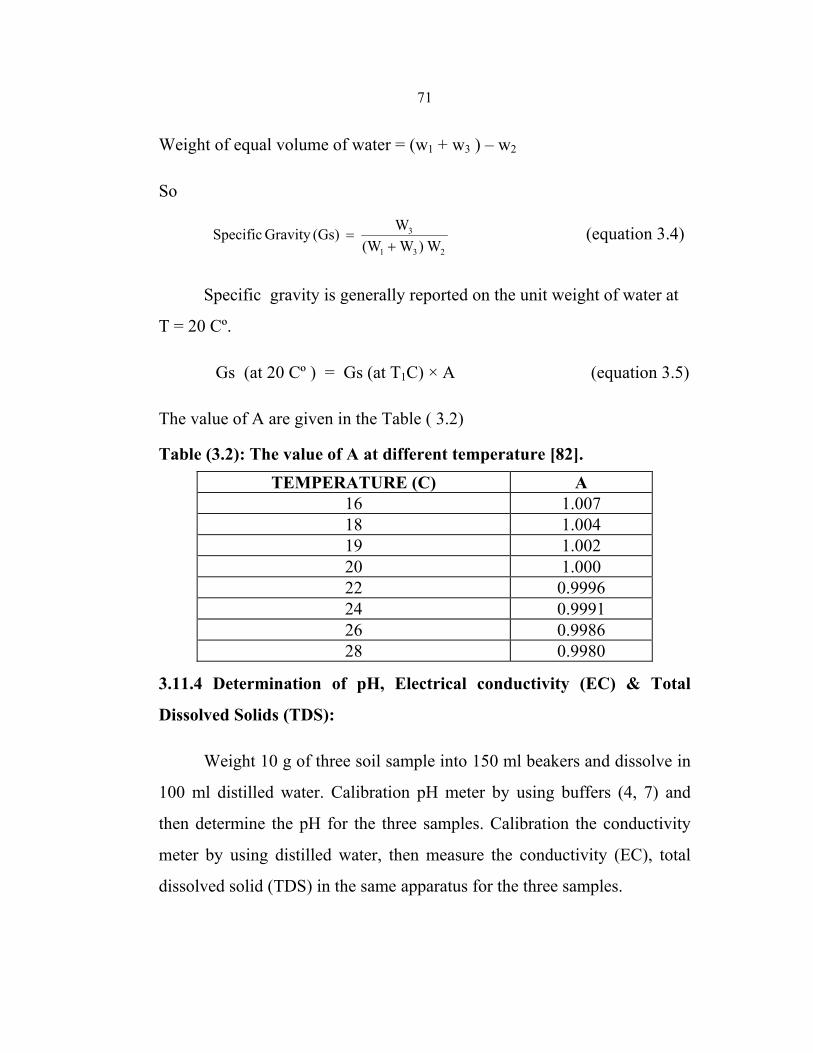
71
Weight of equal volume of water = (w1 + w3 ) – w2
So
231
3
W)W(WW (Gs)Gravity Specific
+ = (equation 3.4)
Specific gravity is generally reported on the unit weight of water at
T = 20 Cº.
Gs (at 20 Cº ) = Gs (at T1C) × A (equation 3.5)
The value of A are given in the Table ( 3.2)
Table (3.2): The value of A at different temperature [82]. TEMPERATURE (C) A
16 1.007 18 1.004 19 1.002 20 1.000 22 0.9996 24 0.9991 26 0.9986 28 0.9980
3.11.4 Determination of pH, Electrical conductivity (EC) & Total
Dissolved Solids (TDS):
Weight 10 g of three soil sample into 150 ml beakers and dissolve in
100 ml distilled water. Calibration pH meter by using buffers (4, 7) and
then determine the pH for the three samples. Calibration the conductivity
meter by using distilled water, then measure the conductivity (EC), total
dissolved solid (TDS) in the same apparatus for the three samples.
72
3.11.5 Determination Salinity as (Sodium Chloride):
Weight about 5 g of three soil samples into three 250 mL Erlenmeyer
flask. Add 100 mL distilled water into each one of the flasks, the agitate on
hot plate using magnetic stirrer for 30 min. The samples cooled to room
temperature then filtered by suction filtration. 25 mL 0.1N AgNO3 and 5
mL conc. HNO3 (1 : 3) were added to each flask and then 5 mL of
ammoniumesien (Ш)-sulfate–12–hydrate indicator was added to the flasks,
Then titration was made with 0.1 N NH4SCN solution until a permanent
light brown is reached. Calculation for salinity determination was done as
follows:
mmol of AgNO3 = Molarity (M) ×volume of AgNO3 added
mmol of NH4SCN = Molarity (M) ×volume of NH4SCN added by titration
Differences = mmol of AgNO3 - mmol of NH4SCN
mg NaCl = differences × molecular weight (NaCl) ×1000
sample)mg(weigh
(NaCl) mg NaCl) ( % = (equation 3.6)
3.11.6 Determination of Phosphorous
Place 1.0 g each of the three soil samples in crucible, then burn in the
furnance for 24 hours. After cooling to room temperature, transfer the
samples to three 150 mL beakers. Add 5 mL conc. H2SO4 and 100 mL
distilled water to each beaker and then boil for 30 minute. Cool the beakers
to room temperature and adjust the pH to 5. Transfer the content of each
beakers to 250 mL volumetric flask and add enough distilled water to reach

73
the 250 mL mark. Take 0.132 g of ascorbic acid and dissolved in 25 mL
phosphorus reagent. Using four 25 mL volumetric flasks, then add to each
flask 4 mL of (ascorbic acid and phosphor reagent, add to each flask about
2 mL of distilled water and shake then add to the first three flask gradually
miles of samples and wait about 15 minute to develop the blue color (1 mL,
5 mL, 5 mL ), add distilled water to each flask to the mark. When the color
in the flasks become light blue, then the concentration of the phosphor in
each flask is determined by using spectrophotometer after making
calibration. Calculation for estimating the concentration of phosphorous is
made by the following equation [83, 84].
(mg) sample of wt. )flask toadded (mL 1000
100 25 250 conc.(1) (%) P ××
×××= (equation3.7)
3.11.7 Determination of Total Organic Carbon (TOC):
Walkley Black titration method is used for determination total
organic carbon (TOC) in the three soil samples. Place three-0.5 g of oven
dried and sieved soil three 250 mL conical flask. Add 5 mL of 1N K2Cr2O7
into each flask and swirled, then add 10 mL of conc. H2SO4 into the
suspension and swirled gently until the soil was mixed. Swirled the mixture
vigorously for about one minute. Let the three flasks cool to room
temperature then add 100 mL of distilled water to each flask and then filter
the suspension. Add 0.3 mL of (0.025 M) orthophenanthroline-ferrous
indicator to each flask then titrate with 0.5 N FeSO4. When the endpoint
was approached the solution changed sharply from greenish-blue to red-
brown. The amount of FeSO4 used in the titration was recorded. The total
organic carbon then calculated as following equations.
74
4
7227224 FeSO mL
OCrK N OCrK mL FeSO (N)Normality ×= (equation 3.8)
meq FeSO4 = mL FeSO4 × N FeSO4 (equation 3.9)
soildry ofweight FeSO meq - OK2CrmeqK (%) TOC 4722= (equation 3.10)
Organic Matter (%) = 1.72 ×organic carbon % (equation 3.11)
3.11.8 Determination of nitrogen:
Kjeldahl method is used for determination nitrogen percent in the
soil samples. Weight three soil samples of 1.0 g and placed them in
digestion tube. A mixture of 0.8 g CuSO4.H2O, 7.0 g of K2SO4 catalysts
and 15 mL of conc. H2SO4 were added to three digestion tubes, then swirl
the three tubes until the acid was mixed with the samples. When all tubes
are ready lower exhausted manifold on the top of the three tubes. Turn on
the vacuum source to full with water. The water flow has been calibrated at
18 liter/minute. Put the rack on the three tubes in the block and heat to 420
Cº for 5 hours then leave the samples on to digest until the color turns clear,
and then the mixture allowed to cool. Add 20 mL of deionized water
slowly with shaking to each tube and swirl to bring any insoluble material
into suspension, after that the tubes were transferred to the (Kjeldahl)
distillation apparatus. The tubes were rinsed three time with water to
complete the transfer. In 250 mL conical flask 50 mL of boric acid was
added, and the flask was placed under the condenser of the distillation in a
away that the end of the condenser in the apparatus was dipped into the
solution. 20 mL of NaOH was added to the funnel of the apparatus into the
digested tube, and the alkali was run slowly into the distillation chamber
and about 100 mL of the condensate was distilled and the color changed
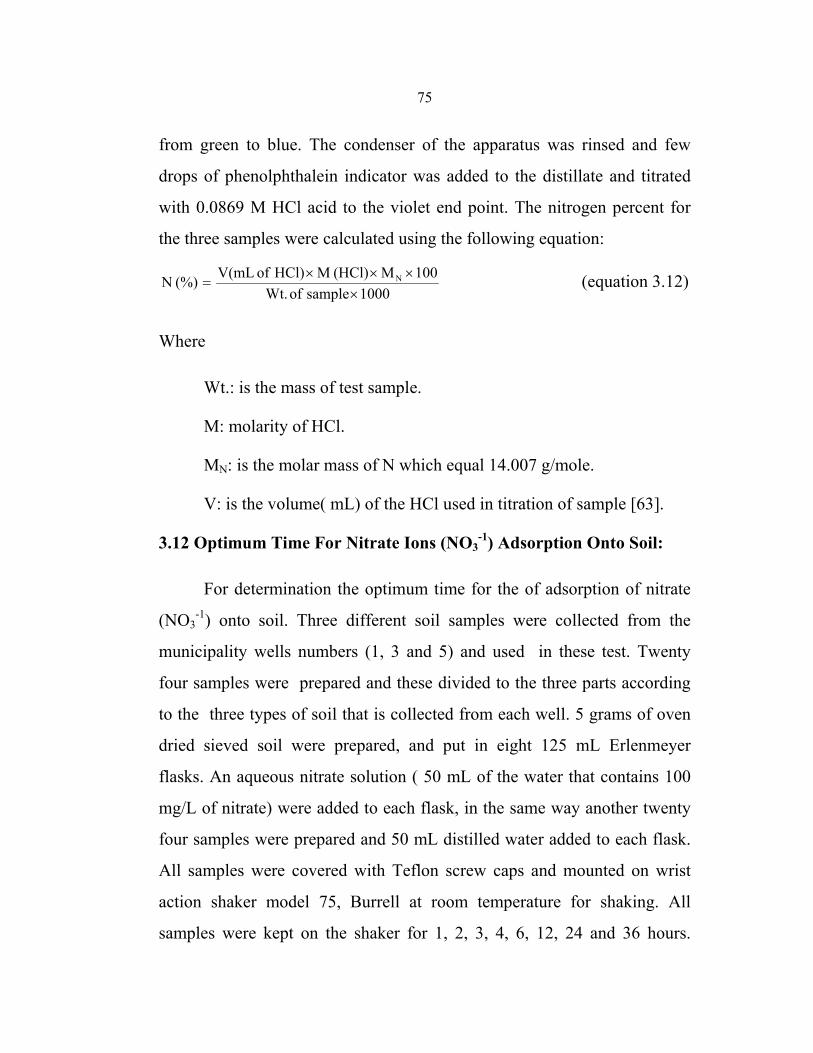
75
from green to blue. The condenser of the apparatus was rinsed and few
drops of phenolphthalein indicator was added to the distillate and titrated
with 0.0869 M HCl acid to the violet end point. The nitrogen percent for
the three samples were calculated using the following equation:
1000 sample of Wt.100M (HCl) M HCl) of V(mL(%) N N
××××
= (equation 3.12)
Where
Wt.: is the mass of test sample.
M: molarity of HCl.
MN: is the molar mass of N which equal 14.007 g/mole.
V: is the volume( mL) of the HCl used in titration of sample [63].
3.12 Optimum Time For Nitrate Ions (NO3-1) Adsorption Onto Soil:
For determination the optimum time for the of adsorption of nitrate
(NO3-1) onto soil. Three different soil samples were collected from the
municipality wells numbers (1, 3 and 5) and used in these test. Twenty
four samples were prepared and these divided to the three parts according
to the three types of soil that is collected from each well. 5 grams of oven
dried sieved soil were prepared, and put in eight 125 mL Erlenmeyer
flasks. An aqueous nitrate solution ( 50 mL of the water that contains 100
mg/L of nitrate) were added to each flask, in the same way another twenty
four samples were prepared and 50 mL distilled water added to each flask.
All samples were covered with Teflon screw caps and mounted on wrist
action shaker model 75, Burrell at room temperature for shaking. All
samples were kept on the shaker for 1, 2, 3, 4, 6, 12, 24 and 36 hours.
76
After shaking, the soil particles for all the samples were allowed to settle
then each sample centrifuged using Hermel Z 200 A centrifuge for 3000
rpm for 10 minutes. After centrifuging, the concentration of nitrate for each
sample was determined by using Jenway ion selective meter by taking 50
ml of each sample.
The actual conc. of (NO3-1) = conc.of the (NO3
-1) in the water after
addition 100 mg/L after certain period of time-conc.of the (NO3-1) in the
distilled water that get from the soil after the same period of time.
3.13 Isotherms:
Freundlich equation and its parameters will be used in this study to
describe the adsorption of nitrate ions onto soil because of its simplicity
and versatility in fitting data.
Five different concentrations 100 mg/L, 200 mg/L, 300 mg/L, 400
mg/L & 500 mg/L of nitrate solutions were prepared .
Fifteen samples were prepared and these divided to the three parts
according to the three types of soil that is collected from each well and
each part contains five soil samples. 5 grams of oven dried and sieved soil
were prepared and put in 125 mL Erlenmeyer flask, and 50 mL of different
concentrations of prepared nitrate were added to each flask, in the same
way another fifteen samples were prepared and 50 mL distilled water added
to each flask, all samples were covered with Teflon screw caps and
mounted on wrist action shaker model 75, Burrell at room temperature for
24 hours for shaking .
77
After shaking the soil was let to settle and centrifuged at 3000 rpm
for 10 minute. After centrifuging, the concentration of nitrate for each
sample was determined by using Jenway ion selective meter by taking 50
mL of each sample. The calculation done as before [59].
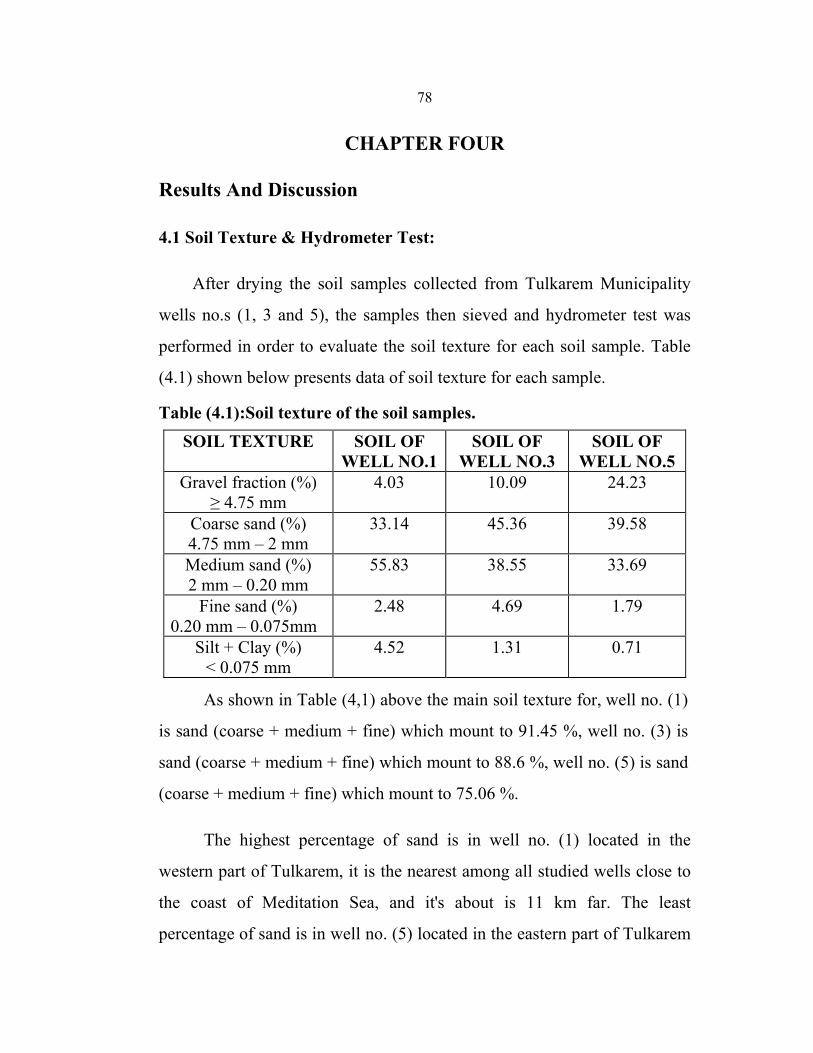
78
CHAPTER FOUR
Results And Discussion
4.1 Soil Texture & Hydrometer Test:
After drying the soil samples collected from Tulkarem Municipality
wells no.s (1, 3 and 5), the samples then sieved and hydrometer test was
performed in order to evaluate the soil texture for each soil sample. Table
(4.1) shown below presents data of soil texture for each sample.
Table (4.1):Soil texture of the soil samples. SOIL TEXTURE SOIL OF
WELL NO.1SOIL OF
WELL NO.3 SOIL OF
WELL NO.5 Gravel fraction (%)
≥ 4.75 mm 4.03 10.09 24.23
Coarse sand (%) 4.75 mm – 2 mm
33.14 45.36 39.58
Medium sand (%) 2 mm – 0.20 mm
55.83 38.55 33.69
Fine sand (%) 0.20 mm – 0.075mm
2.48 4.69 1.79
Silt + Clay (%) < 0.075 mm
4.52 1.31 0.71
As shown in Table (4,1) above the main soil texture for, well no. (1)
is sand (coarse + medium + fine) which mount to 91.45 %, well no. (3) is
sand (coarse + medium + fine) which mount to 88.6 %, well no. (5) is sand
(coarse + medium + fine) which mount to 75.06 %.
The highest percentage of sand is in well no. (1) located in the
western part of Tulkarem, it is the nearest among all studied wells close to
the coast of Meditation Sea, and it's about is 11 km far. The least
percentage of sand is in well no. (5) located in the eastern part of Tulkarem
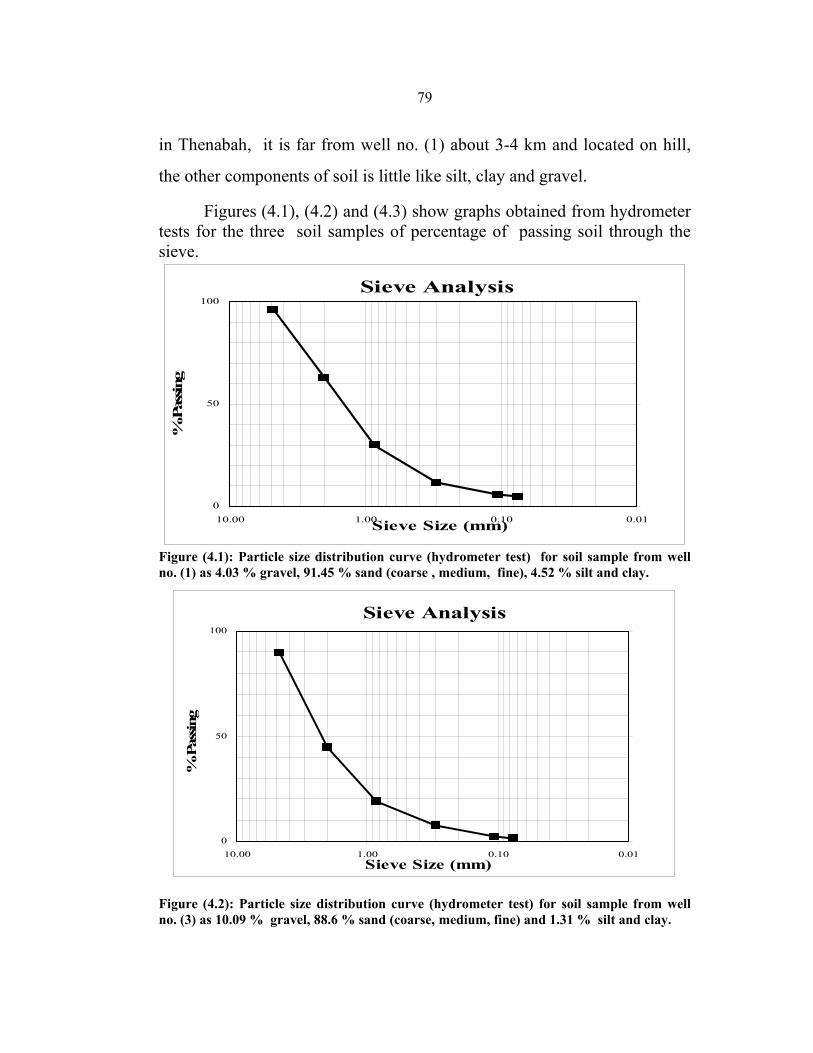
79
in Thenabah, it is far from well no. (1) about 3-4 km and located on hill,
the other components of soil is little like silt, clay and gravel.
Figures (4.1), (4.2) and (4.3) show graphs obtained from hydrometer tests for the three soil samples of percentage of passing soil through the sieve.
Figure (4.1): Particle size distribution curve (hydrometer test) for soil sample from well no. (1) as 4.03 % gravel, 91.45 % sand (coarse , medium, fine), 4.52 % silt and clay.
Figure (4.2): Particle size distribution curve (hydrometer test) for soil sample from well no. (3) as 10.09 % gravel, 88.6 % sand (coarse, medium, fine) and 1.31 % silt and clay.
Sieve Analysis
0
50
100
0.010.101.0010.00 Sieve Size (mm)
% P
assin
g
Sieve Analysis
0
50
100
0.010.101.0010.00Sieve Size (mm)
% P
assin
g
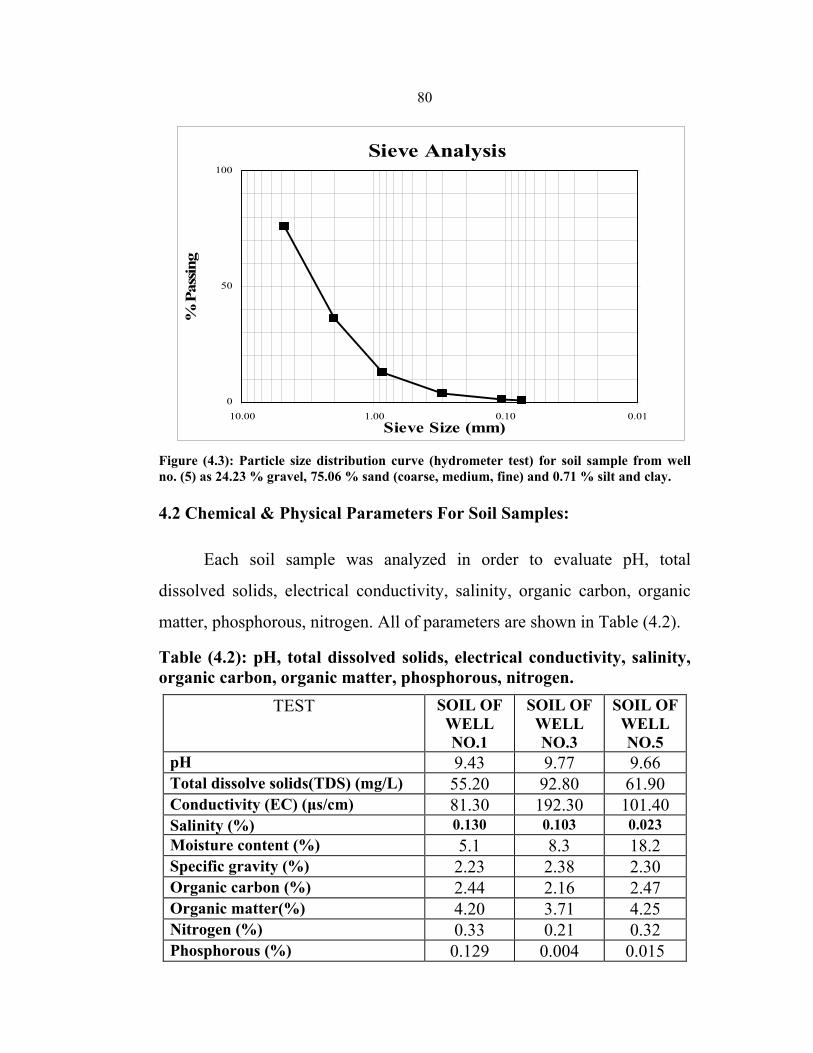
80
Figure (4.3): Particle size distribution curve (hydrometer test) for soil sample from well no. (5) as 24.23 % gravel, 75.06 % sand (coarse, medium, fine) and 0.71 % silt and clay.
4.2 Chemical & Physical Parameters For Soil Samples:
Each soil sample was analyzed in order to evaluate pH, total
dissolved solids, electrical conductivity, salinity, organic carbon, organic
matter, phosphorous, nitrogen. All of parameters are shown in Table (4.2).
Table (4.2): pH, total dissolved solids, electrical conductivity, salinity, organic carbon, organic matter, phosphorous, nitrogen.
TEST SOIL OF WELL NO.1
SOIL OF WELL NO.3
SOIL OFWELL NO.5
pH 9.43 9.77 9.66 Total dissolve solids(TDS) (mg/L) 55.20 92.80 61.90Conductivity (EC) (μs/cm) 81.30 192.30 101.40 Salinity (%) 0.130 0.103 0.023Moisture content (%) 5.1 8.3 18.2 Specific gravity (%) 2.23 2.38 2.30 Organic carbon (%) 2.44 2.16 2.47Organic matter(%) 4.20 3.71 4.25 Nitrogen (%) 0.33 0.21 0.32 Phosphorous (%) 0.129 0.004 0.015
Sieve Analysis
0
50
100
0.010.101.0010.00Sieve Size (mm)
% P
assin
g
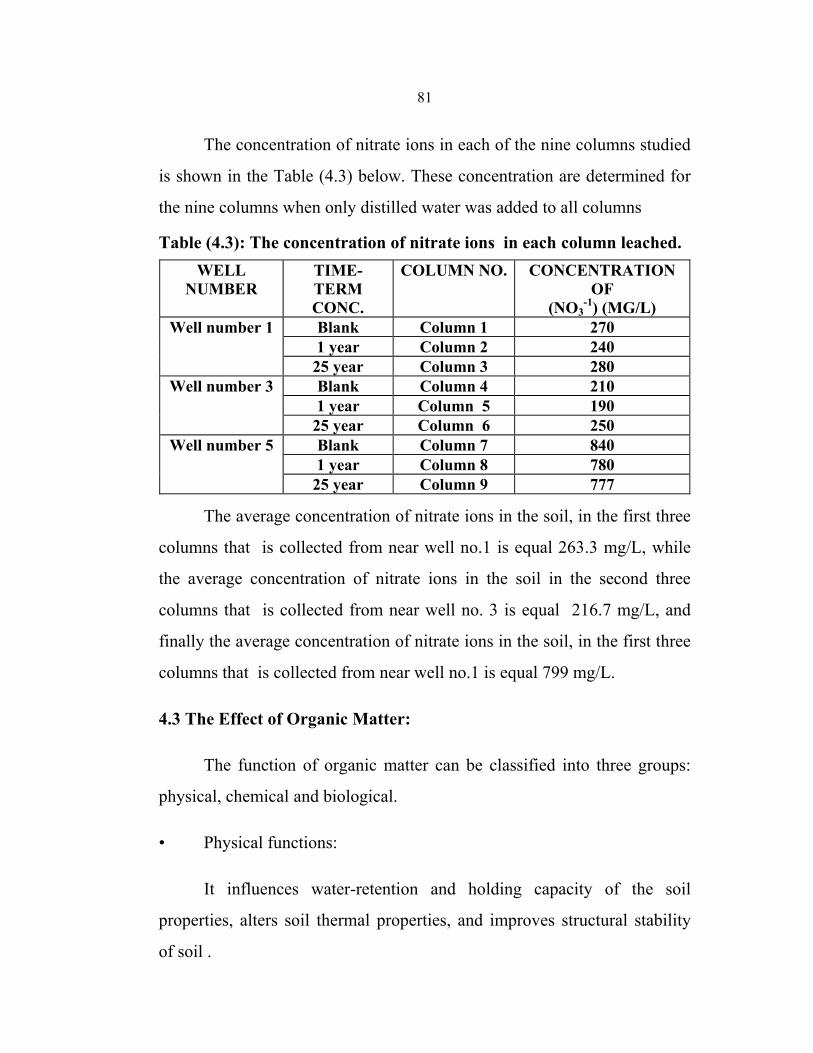
81
The concentration of nitrate ions in each of the nine columns studied
is shown in the Table (4.3) below. These concentration are determined for
the nine columns when only distilled water was added to all columns
Table (4.3): The concentration of nitrate ions in each column leached. CONCENTRATION
OF (NO3
-1) (MG/L)
COLUMN NO.TIME-TERM CONC.
WELL NUMBER
270 Column 1 Blank Well number 1 240 Column 2 1 year 280 Column 3 25 year 210 Column 4 Blank Well number 3 190 Column 5 1 year 250 Column 6 25 year 840 Column 7 Blank Well number 5 780 Column 8 1 year 777 Column 9 25 year
The average concentration of nitrate ions in the soil, in the first three
columns that is collected from near well no.1 is equal 263.3 mg/L, while
the average concentration of nitrate ions in the soil in the second three
columns that is collected from near well no. 3 is equal 216.7 mg/L, and
finally the average concentration of nitrate ions in the soil, in the first three
columns that is collected from near well no.1 is equal 799 mg/L.
4.3 The Effect of Organic Matter:
The function of organic matter can be classified into three groups:
physical, chemical and biological.
• Physical functions:
It influences water-retention and holding capacity of the soil
properties, alters soil thermal properties, and improves structural stability
of soil .
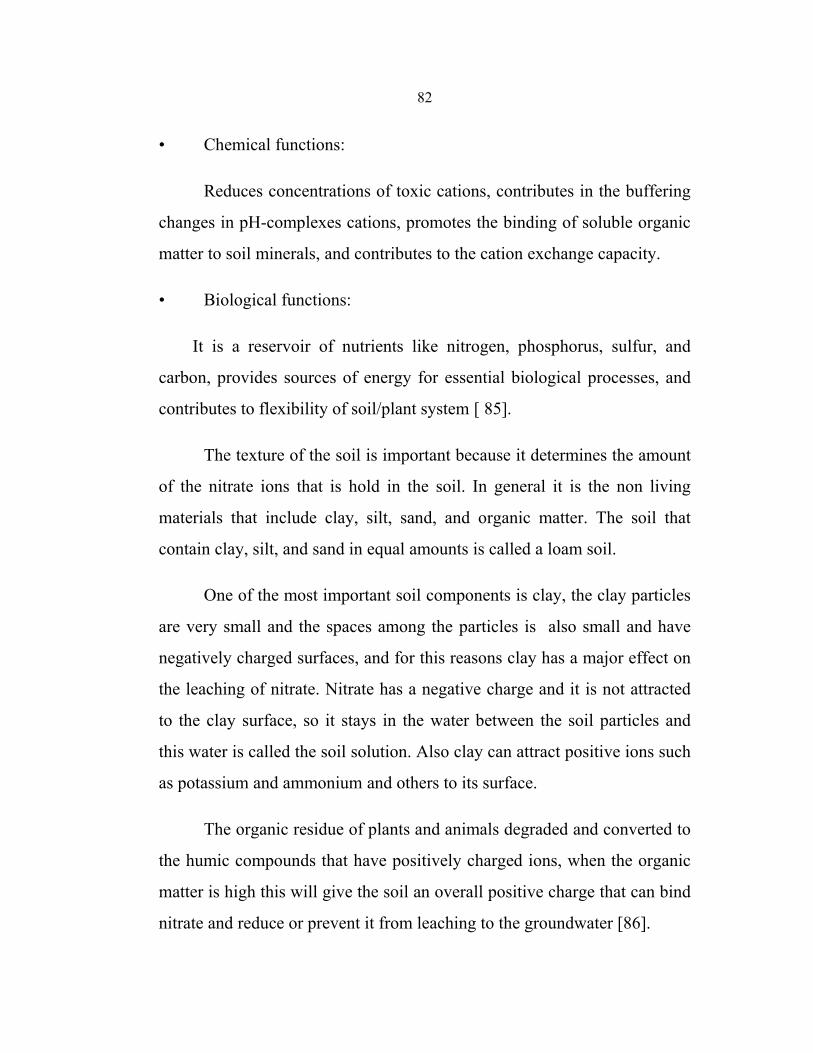
82
• Chemical functions:
Reduces concentrations of toxic cations, contributes in the buffering
changes in pH-complexes cations, promotes the binding of soluble organic
matter to soil minerals, and contributes to the cation exchange capacity.
• Biological functions:
It is a reservoir of nutrients like nitrogen, phosphorus, sulfur, and
carbon, provides sources of energy for essential biological processes, and
contributes to flexibility of soil/plant system [ 85].
The texture of the soil is important because it determines the amount
of the nitrate ions that is hold in the soil. In general it is the non living
materials that include clay, silt, sand, and organic matter. The soil that
contain clay, silt, and sand in equal amounts is called a loam soil.
One of the most important soil components is clay, the clay particles
are very small and the spaces among the particles is also small and have
negatively charged surfaces, and for this reasons clay has a major effect on
the leaching of nitrate. Nitrate has a negative charge and it is not attracted
to the clay surface, so it stays in the water between the soil particles and
this water is called the soil solution. Also clay can attract positive ions such
as potassium and ammonium and others to its surface.
The organic residue of plants and animals degraded and converted to
the humic compounds that have positively charged ions, when the organic
matter is high this will give the soil an overall positive charge that can bind
nitrate and reduce or prevent it from leaching to the groundwater [86].
83
From the Table (4.2) we can see the organic matter content in the
soil ranges from 3.71 % to 4.25 %, and this percentage of the organic
matter considered to be high compared to the normal percentage which
equal 5 %, so the soil texture in the study area is sandy to sandy loam, and
the particles size is big and the spaces among this particles is large and the
surface area is small. This higher amount of organic matter presents on the
soil particles and between them to block this spaces. As a result the
organic matter gives the soil an overall positive charge that can bind nitrate
ions that have negative charge, so it reduces or prevents the nitrate ions
from leaching to the groundwater. Organic matter acts as a reservoir to hold
the water that contain nitrate for period of time, but also there is leaching of
nitrate to the groundwater because the organic matter doesn’t blocked all
the spaces among the soil particles.
4.4 Measurement of The Nitrate Concentrations Leached From The
Soil Vertical Columns:
In order to study the effect of different soils, collected from different
locations near the municipality wells no. (1, 3 and 5) in Tulkarem City, on
nitrate leaching from the nine vertical (PVC) that filled with soils, distilled
water and different concentrations of nitrate that were added to the columns
for 44 days.
The concentrations of nitrate that get out (leached) of soil columns
are shown in the table (4.4) below
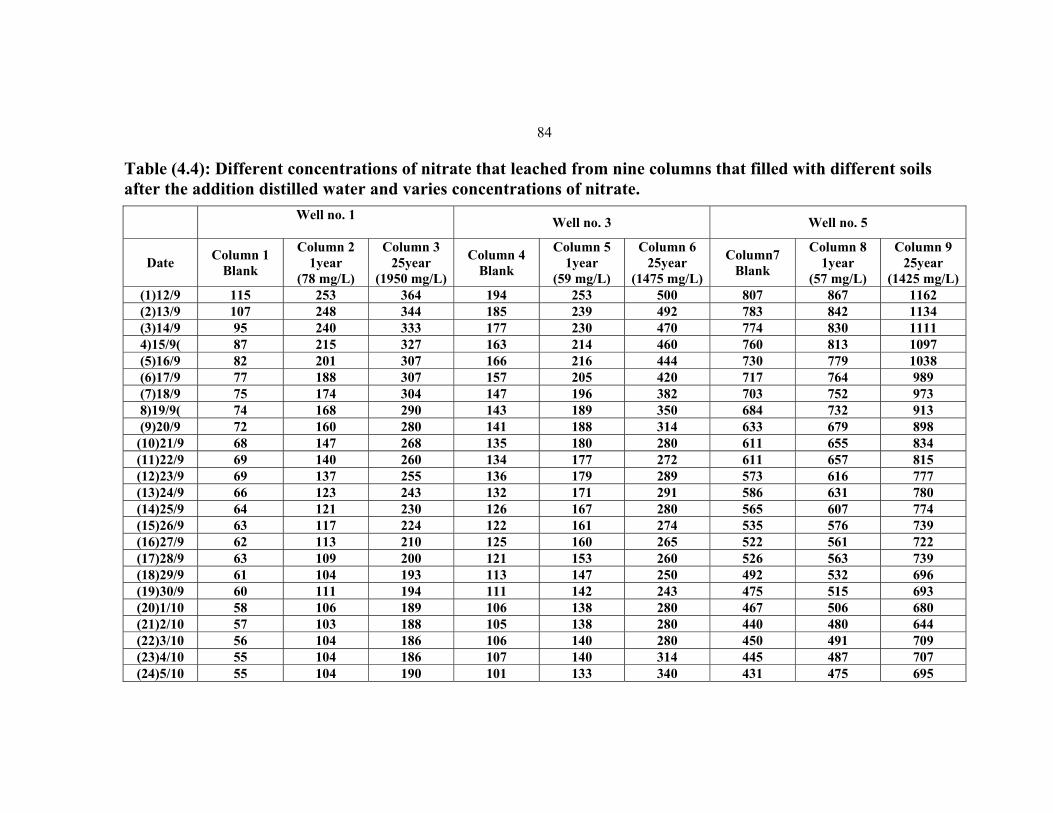
84
Table (4.4): Different concentrations of nitrate that leached from nine columns that filled with different soils after the addition distilled water and varies concentrations of nitrate.
Well no. 5 Well no. 3 Well no. 1
Column 9 25year
(1425 mg/L)
Column 8 1year
(57 mg/L)
Column7 Blank
Column 6 25year
(1475 mg/L)
Column 5 1year
(59 mg/L)
Column 4 Blank
Column 3 25year
(1950 mg/L)
Column 2 1year
(78 mg/L)
Column 1 Blank Date
1162 867 807 500 253 194 364 253 115 (1)12/9 1134 842 783 492 239 185 344 248 107 (2)13/9 1111 830 774 470 230 177 333 240 95 (3)14/9 1097 813 760 460 214 163 327 215 87 4)15/9( 1038 779 730 444 216 166 307 201 82 (5)16/9 989 764 717 420 205 157 307 188 77 (6)17/9 973 752 703 382 196 147 304 174 75 (7)18/9 913 732 684 350 189 143 290 168 74 8)19/9( 898 679 633 314 188 141 280 160 72 (9)20/9 834 655 611 280 180 135 268 147 68 (10)21/9 81565761127217713426014069 (11)22/9 777 616 573 289 179 136 255 137 69 (12)23/9 780 631 586 291 171 132 243 123 66 (13)24/9 774 607 565 280 167 126 230 121 64 (14)25/9 739 576 535 274 161 122 224 117 63 (15)26/9 722 561 522 265 160 125 210 113 62 (16)27/9 73956352626015312120010963 (17)28/9 696 532 492 250 147 113 193 104 61 (18)29/9 693 515 475 243 142 111 194 111 60 (19)30/9 680 506 467 280 138 106 189 106 58 (20)1/10 644 480 440 280 138 105 188 103 57 (21)2/10 709 491 450 280 140 106 186 104 56 (22)3/10 707 487 445 314 140 107 186 104 55 (23)4/10 695 475 431 340 133 101 190 104 55 (24)5/10
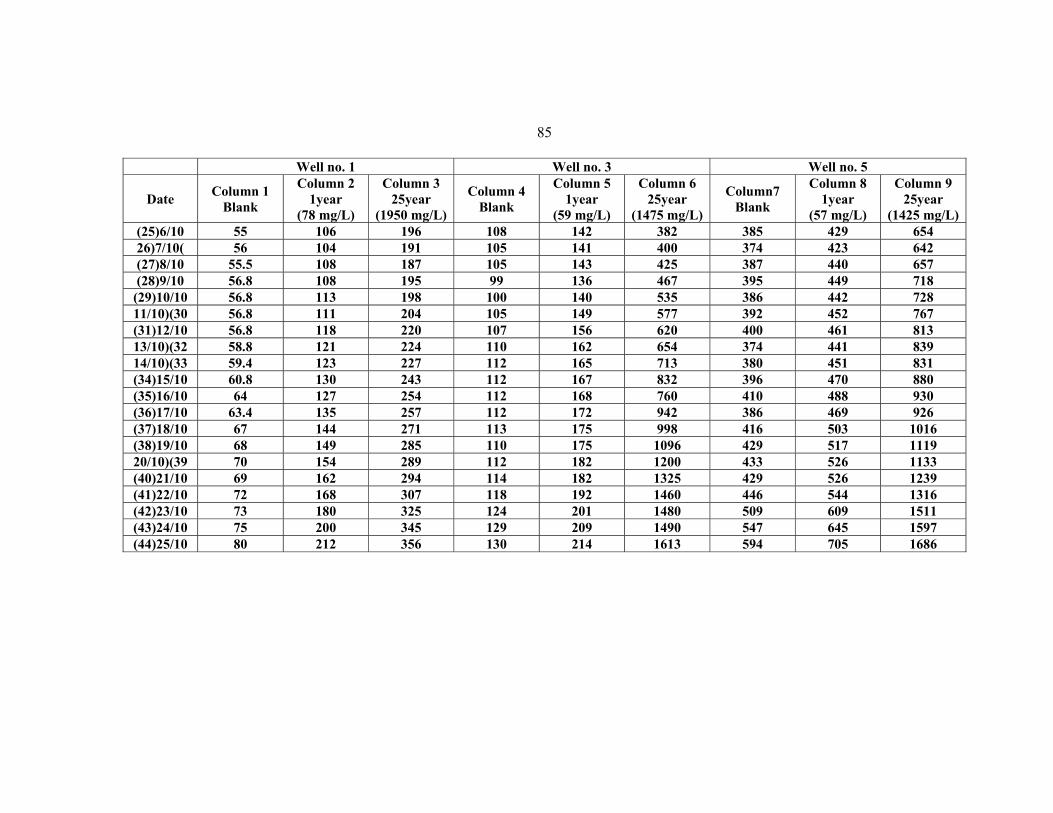
85
Well no. 5 Well no. 3 Well no. 1 Column 9
25year (1425 mg/L)
Column 8 1year
(57 mg/L)
Column7 Blank
Column 6 25year
(1475 mg/L)
Column 5 1year
(59 mg/L)
Column 4 Blank
Column 3 25year
(1950 mg/L)
Column 2 1year
(78 mg/L)
Column 1 Blank Date
654 429 385 382 142 108 196 106 55 (25)6/10 642 423 374 400 141 105 191 104 56 26)7/10( 657 440 387 425 143 105 187 108 55.5 (27)8/10 718 449 395 467 136 99 195 108 56.8 (28)9/10 728 442 386 535 140 100 198 113 56.8 (29)10/10 767 452 392 577 149 105 204 111 56.8 11/10)(30 81346140062015610722011856.8 (31)12/10 839 441 374 654 162 110 224 121 58.8 13/10)(32 831 451 380 713 165 112 227 123 59.4 14/10)(33 880 470 396 832 167 112 243 130 60.8 (34)15/10 930 488 410 760 168 112 254 127 64 (35)16/10 926 469 386 942 172 112 257 135 63.4 (36)17/10
101650341699817511327114467 (37)18/10 1119517429109617511028514968 (38)19/10 1133 526 433 1200 182 112 289 154 70 20/10)(39 1239 526 429 1325 182 114 294 162 69 (40)21/10 1316 544 446 1460 192 118 307 168 72 (41)22/10 1511 609 509 1480 201 124 325 180 73 (42)23/10 1597 645 547 1490 209 129 345 200 75 (43)24/10 1686 705 594 1613 214 130 356 212 80 (44)25/10
86
To calculate the concentration of nitrate leached from the nine soil
columns after the addition of different concentrations (distilled water, short
and long term concentrations) of nitrate for 44 days. The concentration of
nitrate leached from columns for short & long term concentrations is equal
to that of short or long term concentration subtracted from the
concentration of nitrate for blank column, the results are illustrated in Table
(4.5) & Figure (4.4) to (4.6).
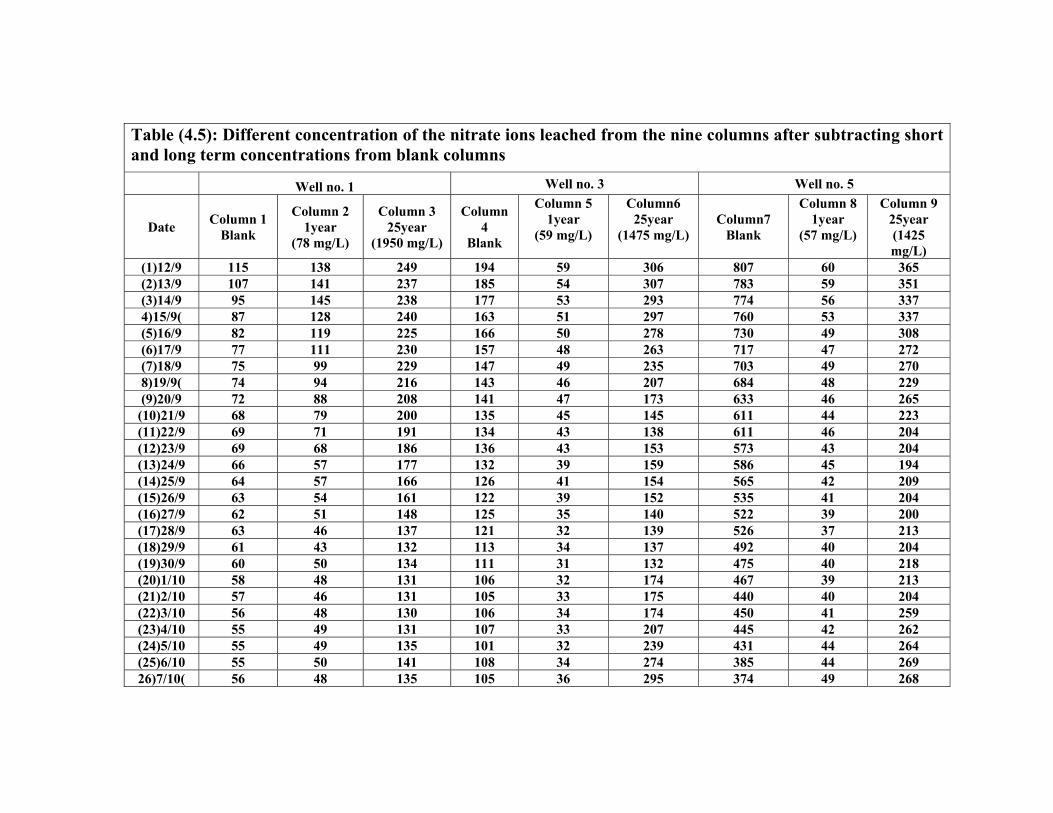
Table (4.5): Different concentration of the nitrate ions leached from the nine columns after subtracting short and long term concentrations from blank columns
Well no. 5 Well no. 3 Well no. 1
Column 9 25year (1425 mg/L)
Column 8 1year
(57 mg/L) Column7
Blank
Column6 25year
(1475 mg/L)
Column 5 1year
(59 mg/L)
Column 4
Blank
Column 3 25year
(1950 mg/L)
Column 2 1year
(78 mg/L)
Column 1 Blank Date
365 60 807 306 59 194 249 138 115 (1)12/9 351 59 783 307 54 185 237 141 107 (2)13/9 337 56 774 293 53 177 238 145 95 (3)14/9 337 53 760 297 51 163 240 128 87 4)15/9( 308 49 730 278 50 166 225 119 82 (5)16/9 272 47 717 263 48 157 230 111 77 (6)17/9 270 49 703 235 49 147 229 99 75 (7)18/9 229 48 684 207 46 143 216 94 74 8)19/9( 265 46 633 173 47 141 208 88 72 (9)20/9 223 44 611 145 45 135 200 79 68 (10)21/9 204 46 611 138 43 134 191 71 69 (11)22/9 204 43 573 153 43 136 186 68 69 (12)23/9 194 45 586 159 39 132 177 57 66 (13)24/9 209 42 565 154 41 126 166 57 64 (14)25/9 204 41 535 152 39 122 161 54 63 (15)26/9 200 39 522 140 35 125 148 51 62 (16)27/9 213 37 526 139 32 121 137 46 63 (17)28/9 20440492137341131324361 (18)29/9 218 40 475 132 31 111 134 50 60 (19)30/9 213 39 467 174 32 106 131 48 58 (20)1/10 204 40 440 175 33 105 131 46 57 (21)2/10 259 41 450 174 34 106 130 48 56 (22)3/10 262 42 445 207 33 107 131 49 55 (23)4/10 264 44 431 239 32 101 135 49 55 (24)5/10 269 44 385 274 34 108 141 50 55 (25)6/10 268 49 374 295 36 105 135 48 56 26)7/10(
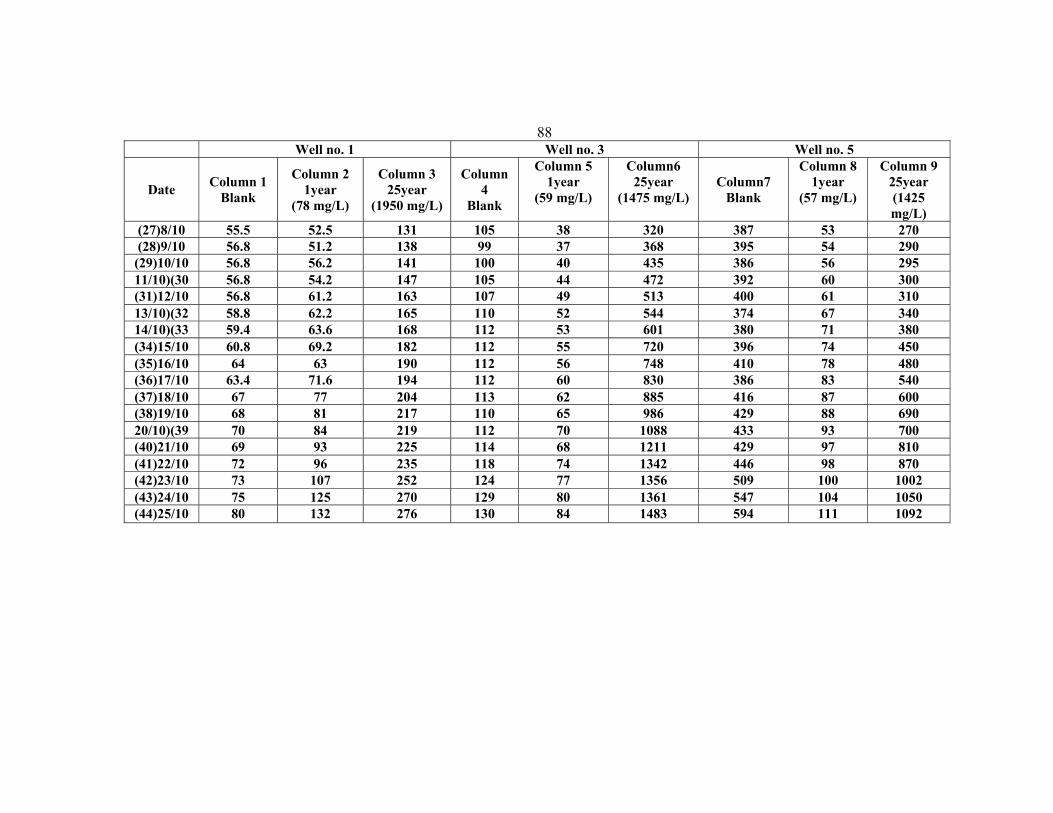
88
Well no. 5 Well no. 3 Well no. 1 Column 9
25year (1425 mg/L)
Column 8 1year
(57 mg/L) Column7
Blank
Column6 25year
(1475 mg/L)
Column 5 1year
(59 mg/L)
Column 4
Blank
Column 3 25year
(1950 mg/L)
Column 2 1year
(78 mg/L)
Column 1 Blank Date
270 53 387 320 38 105 131 52.5 55.5 (27)8/10 290 54 395 368 37 99 138 51.2 56.8 (28)9/10 295 56 386 435 40 100 141 56.2 56.8 (29)10/10 300 60 392 472 44 105 147 54.2 56.8 11/10)(30 310 61 400 513 49 107 163 61.2 56.8 (31)12/10 340 67 374 544 52 110 165 62.2 58.8 13/10)(32 380 71 380 601 53 112 168 63.6 59.4 14/10)(33 450 74 396 720 55 112 182 69.2 60.8 (34)15/10 480 78 410 748 56 112 190 63 64 (35)16/10 540 83 386 830 60 112 194 71.6 63.4 (36)17/10 600 87 416 885 62 113 204 77 67 (37)18/10 690 88 429 986 65 110 217 81 68 (38)19/10 700934331088701122198470 20/10)(39 810 97 429 1211 68 114 225 93 69 (40)21/10 870 98 446 1342 74 118 235 96 72 (41)22/10 1002 100 509 1356 77 124 252 107 73 (42)23/10 1050 104 547 1361 80 129 270 125 75 (43)24/10 1092 111 594 1483 84 130 276 132 80 (44)25/10
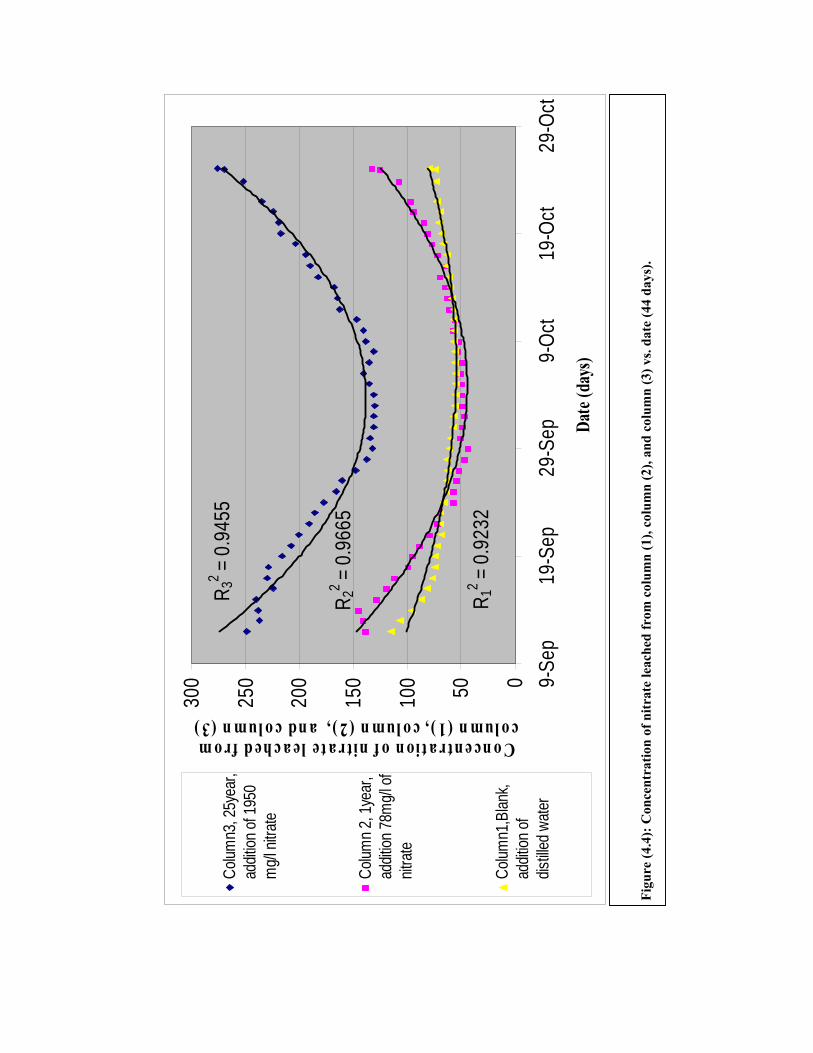
R 12 =
0.9
232
R 22 =
0.9
665
R 32 =
0.9
455
050100
150
200
250
300 9-
Sep
19-S
ep29
-Sep
9-Oc
t19
-Oct
29-O
ctDa
te (d
ays)
Concentration of nitrate leached from column (1), column (2), and column (3)
Colum
n3, 2
5yea
r,ad
dition
of 19
50m
g/l ni
trate
Colum
n 2, 1
year
,ad
dition
78m
g/l of
nitra
te
Colum
n1,B
lank,
addit
ion of
distill
ed w
ater
Figu
re (4
.4):
Con
cent
ratio
n of
nitr
ate
leac
hed
from
col
umn
(1),
colu
mn
(2),
and
colu
mn
(3) v
s. da
te (4
4 da
ys).
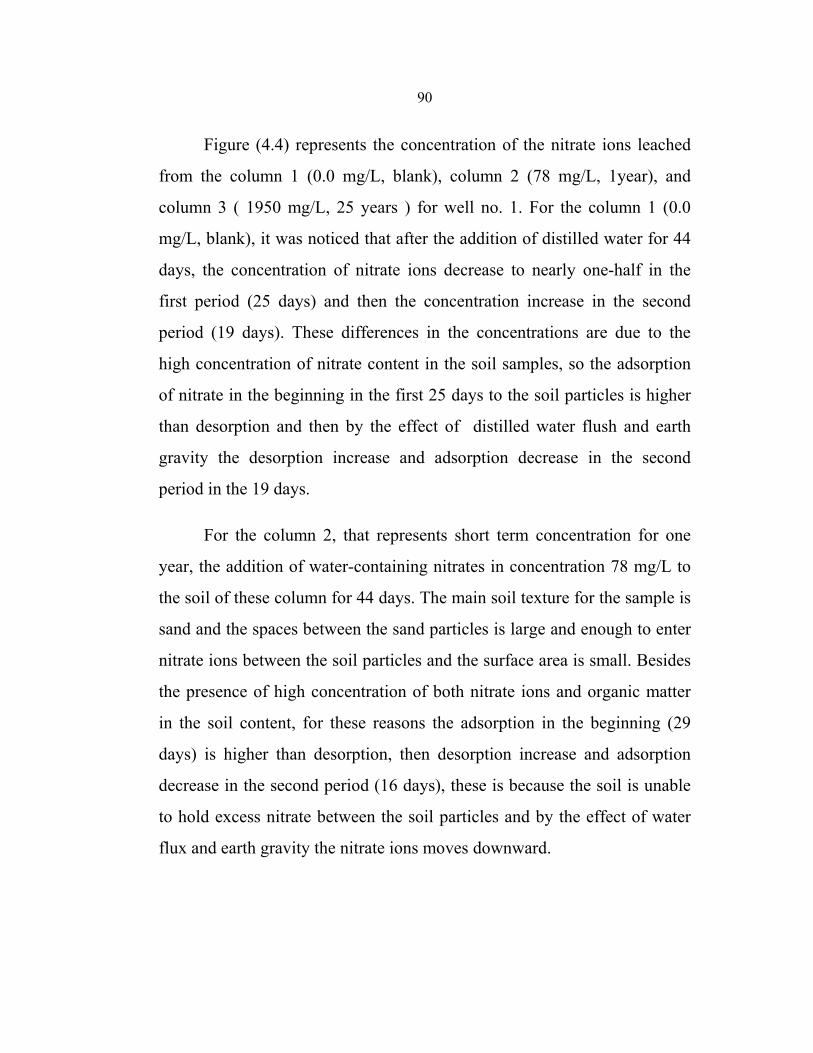
90
Figure (4.4) represents the concentration of the nitrate ions leached
from the column 1 (0.0 mg/L, blank), column 2 (78 mg/L, 1year), and
column 3 ( 1950 mg/L, 25 years ) for well no. 1. For the column 1 (0.0
mg/L, blank), it was noticed that after the addition of distilled water for 44
days, the concentration of nitrate ions decrease to nearly one-half in the
first period (25 days) and then the concentration increase in the second
period (19 days). These differences in the concentrations are due to the
high concentration of nitrate content in the soil samples, so the adsorption
of nitrate in the beginning in the first 25 days to the soil particles is higher
than desorption and then by the effect of distilled water flush and earth
gravity the desorption increase and adsorption decrease in the second
period in the 19 days.
For the column 2, that represents short term concentration for one
year, the addition of water-containing nitrates in concentration 78 mg/L to
the soil of these column for 44 days. The main soil texture for the sample is
sand and the spaces between the sand particles is large and enough to enter
nitrate ions between the soil particles and the surface area is small. Besides
the presence of high concentration of both nitrate ions and organic matter
in the soil content, for these reasons the adsorption in the beginning (29
days) is higher than desorption, then desorption increase and adsorption
decrease in the second period (16 days), these is because the soil is unable
to hold excess nitrate between the soil particles and by the effect of water
flux and earth gravity the nitrate ions moves downward.
91
For the column 3, that represents long term concentration for 25
year, the addition of water-containing nitrates in concentration 1950 mg/L
to the soil of these column for 44 days. The main soil texture for the sample
is sand and the spaces between the sand particles is large and enough to
enter nitrate ions between the soil particles and the surface area is small.
Besides the presence of high concentration of both nitrate ions and organic
matter in the soil content, for these reasons the adsorption in the beginning
(22 days) is higher than desorption, then desorption increase and adsorption
decrease in the second period (22 days), these is because the soil is unable
to hold excess nitrate in large amount between the soil particles and by the
effect of water flux and earth gravity the nitrate ions moves downward.

92
Figu
re (4
.5):
Con
cent
ratio
n of
nitr
ate
leac
hed
from
col
umn
(4),
colu
mn
(5),
and
colu
mn
(6) v
s. da
te (4
4 da
ys).
R 52 =
0.961
6R2 4 =
0.97
35
R 62 =
0.989
7
0
200
400
600
800
1000
1200
1400
1600 9-
Sep
19-S
ep29
-Sep
9-Oc
t19
-Oct
29-O
ct
Date
(day
s)
Concentration of nitrate leached from column(4), column (5), and
column (6 )
Colum
n 6, 2
5ye
ars,
addit
ion of
1475
mg/l
of ni
trate
Colum
n 5, 1
year
,ad
dition
of 59
mg/l
of nit
rate
Colum
n 4, B
lank,
addit
ion of
disti
lled
water
93
Figure (4.5) represents the concentration of the nitrate ions leached
from the column 4 (0.0 mg/L, blank), column 5 (59 mg/L, 1year), and
column 3 ( 1475 mg/L, 25 years ) for well no. 3. For the column 4 (0.0
mg/L, blank), it was noticed that after the addition of distilled water for 44
days, the concentration of nitrate ions decrease in the first period (28 days)
and then the concentration increase in the second period (16 days). These
differences in the concentrations are due to the high concentration of nitrate
content in the soil samples, so the adsorption of nitrate in the beginning in
the first 28 days to the soil particles is higher than desorption these is
because the sand content for the soil is less which is about 89 % and also
by the effect of distilled water flush and earth gravity the desorption
increase and adsorption decrease in the second period in the 16 days.
For the column 5, that represents short term concentration for one
year, the addition of water-containing nitrates in concentration 59 mg/L to
the soil of these column for 44 days. The main soil texture for the sample is
sand and the spaces between the sand particles is large and enough to enter
nitrate ions between the soil particles and the surface area is small. Besides
the presence of high concentration of both nitrate ions and organic matter
in the soil content, for these reasons the adsorption in the beginning (28
days) is higher than desorption, then desorption increase and adsorption
decrease in the second period (16 days), these is because the soil is unable
to hold excess nitrate between the soil particles and by the effect of water
flux and earth gravity the nitrate ions moves downward.
94
For the column 6, that represents long term concentration for 25
year, the addition of water-containing nitrates in concentration 1475 mg/L
to the soil of these column for 44 days. The main soil texture for the sample
is sand and the spaces between the sand particles is large and enough to
enter nitrate ions between the soil particles and the surface area is small.
Besides the presence of high concentration of both nitrate ions and organic
matter in the soil content, for these reasons the adsorption in the beginning
(19 days) is higher than desorption, then desorption increase and adsorption
decrease in the second period (25 days), these is because the soil is unable
to hold excess nitrate in large amount between the soil particles and by the
effect of water flux and earth gravity the nitrate ions moves downward.
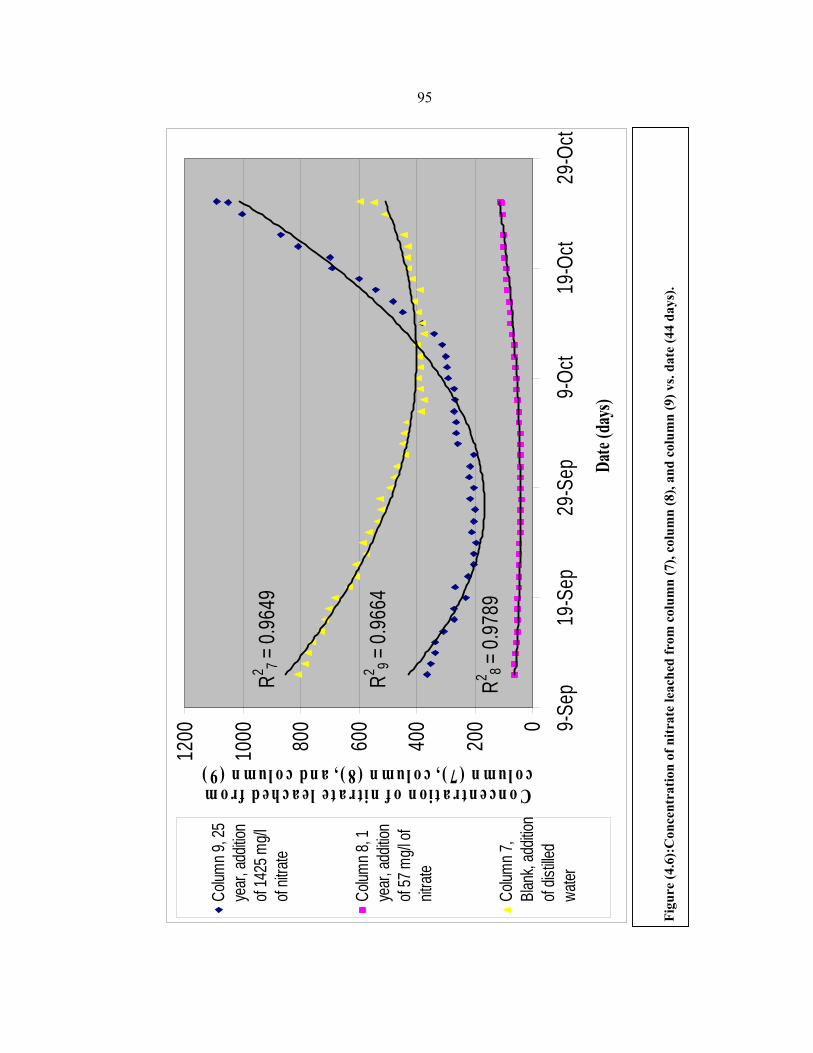
95
Figu
re (4
.6):
Con
cent
ratio
n of
nitr
ate
leac
hed
from
col
umn
(7),
colu
mn
(8),
and
colu
mn
(9) v
s. da
te (4
4 da
ys).
R2 7 = 0.
9649
R2 8 = 0.
9789
R2 9 = 0.
9664
0
200
400
600
800
1000
1200 9-
Sep
19-S
ep29
-Sep
9-Oc
t19
-Oct
29-O
ctDa
te (d
ays)
Concentration of nitrate leached from column (7), column (8), and column (9)
Colum
n 9, 2
5ye
ar, a
dditio
nof
1425
mg/l
of nit
rate
Colum
n 8, 1
year
, add
ition
of 57
mg/l
ofnit
rate
Colum
n 7,
Blan
k, ad
dition
of dis
tilled
water
96
Figure (4.6) represents the concentration of the nitrate ions leached
from the column 7 (0.0 mg/L, blank), column 8 (57 mg/L, 1year), and
column 9 ( 1425 mg/L, 25 years ) for well no. 5. For the column 7 (0.0
mg/L, blank), it was noticed that after the addition of distilled water for 44
days, the concentration of nitrate ions decrease in the first period (32 days)
and then the concentration increase in the second period (12 days). These
differences in the concentrations are due to the high concentration of nitrate
content in the soil samples, so the adsorption of nitrate in the beginning in
the first 32 days to the soil particles is higher than desorption these is
because the sand content for the soil is less which is about 75 % and also
by the effect of distilled water flush and earth gravity the desorption
increase and adsorption decrease in the second period in the 12 days.
For the column 8, that represents short term concentration for one
year, the addition of water-containing nitrates in concentration 57 mg/L to
the soil of these column for 44 days. The main soil texture for the sample is
sand and the spaces between the sand particles is large and enough to enter
nitrate ions between the soil particles and the surface area is small. Besides
the presence of high concentration of both nitrate ions and organic matter
in the soil content, for these reasons the adsorption in the beginning (20
days) is higher than desorption, then desorption increase and adsorption
decrease in the second period (24 days), these is because the soil is unable
to hold excess nitrate between the soil particles and by the effect of water
flux and earth gravity the nitrate ions moves downward.
For the column 6, that represents long term concentration for 25
year, the addition of water-containing nitrates in concentration 1425 mg/L
97
to the soil of these column for 44 days. The main soil texture for the sample
is sand and the spaces between the sand particles is large and enough to
enter nitrate ions between the soil particles and the surface area is small.
Besides the presence of high concentration of both nitrate ions and organic
matter in the soil content, for these reasons the adsorption in the beginning
(26 days) is higher than desorption, then desorption increase and adsorption
decrease in the second period (18 days), these is because the soil is unable
to hold excess nitrate in large amount between the soil particles and by the
effect of water flux and earth gravity the nitrate ions moves downward.
4.5 Testing of Nitrate Content For Soil Samples From Columns-
Contain Nitrate Ions:
After the complete addition of distilled water and contaminated
nitrated-water to each one of the nine columns for 44 days, the excess
water goes from down columns until no water goes out in order to cut the
nine columns.
Each column of the nine 2-meters vertical columns length is divided
into four 50 cm equal parts, hence 36 parts of the nine columns are
resulted. Each part of the columns is designated with a specific number
which is necessary to keep track of the samples. The columns are cut by
electrical disk into 36 equal parts. All parts were emptied from there
contents of soil-containing nitrate ions in order to dry the soil, then the
nitrate concentration is determined and illustrated in the following tables,
Table (4.6) to Table (4.8) .
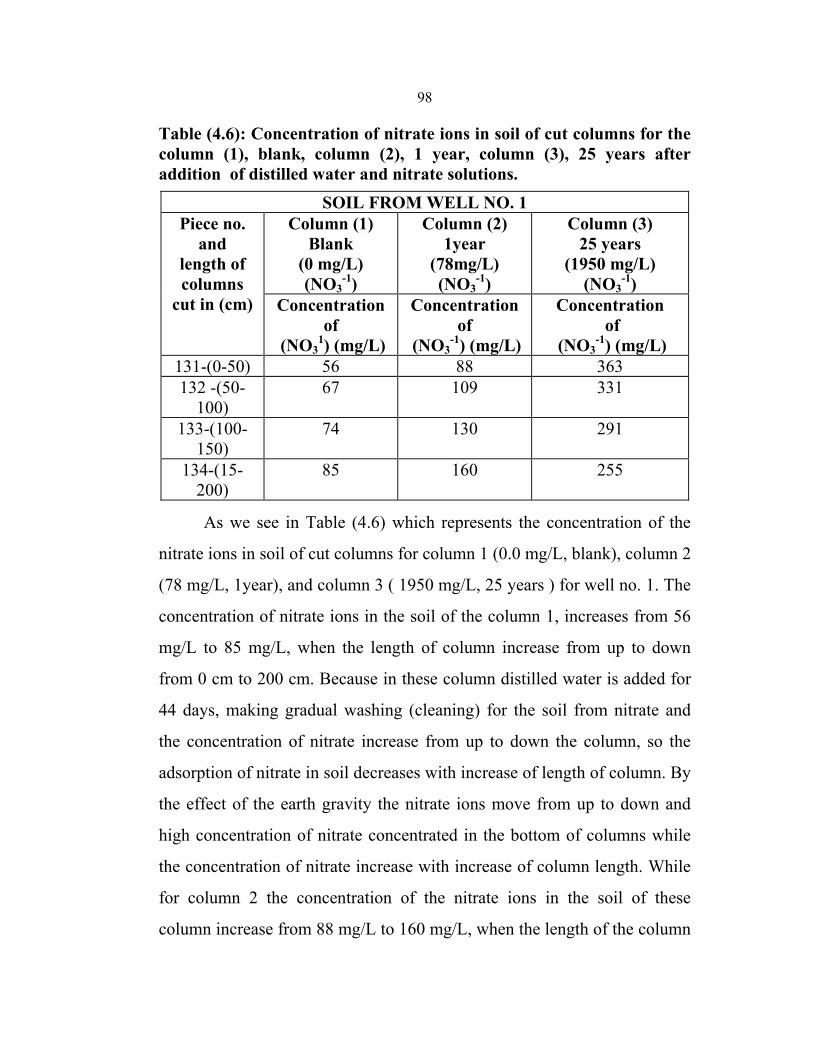
98
Table (4.6): Concentration of nitrate ions in soil of cut columns for the column (1), blank, column (2), 1 year, column (3), 25 years after addition of distilled water and nitrate solutions.
SOIL FROM WELL NO. 1 Column (3)
25 years (1950 mg/L)
(NO3-1)
Column (2) 1year
(78mg/L) (NO3
-1)
Column (1) Blank
(0 mg/L) (NO3
-1)
Piece no. and
length of columns
cut in (cm) Concentration of
(NO3-1) (mg/L)
Concentration of
(NO3-1) (mg/L)
Concentration of
(NO31) (mg/L)
363 8856131-(0-50) 331 109 67 132 -(50-
100) 291 130 74 133-(100-
150) 255 160 85 134-(15-
200)
As we see in Table (4.6) which represents the concentration of the
nitrate ions in soil of cut columns for column 1 (0.0 mg/L, blank), column 2
(78 mg/L, 1year), and column 3 ( 1950 mg/L, 25 years ) for well no. 1. The
concentration of nitrate ions in the soil of the column 1, increases from 56
mg/L to 85 mg/L, when the length of column increase from up to down
from 0 cm to 200 cm. Because in these column distilled water is added for
44 days, making gradual washing (cleaning) for the soil from nitrate and
the concentration of nitrate increase from up to down the column, so the
adsorption of nitrate in soil decreases with increase of length of column. By
the effect of the earth gravity the nitrate ions move from up to down and
high concentration of nitrate concentrated in the bottom of columns while
the concentration of nitrate increase with increase of column length. While
for column 2 the concentration of the nitrate ions in the soil of these
column increase from 88 mg/L to 160 mg/L, when the length of the column
99
increase from up 0 cm to down 200 cm. Because in these column distilled
water that contaminated with nitrate is added for 44 days to the soil that
contain high nitrate content, and the soil texture is sandy and the spaces
between the soil particle is large and able to enter the nitrate ions between
them. By the effect of both water flush and earth gravity the nitrate ions
moves from up to down, and the adsorption of nitrate decrease in the soil
of the column with the increase of the column length. The higher
concentration of nitrate concentrated in the bottom of column, while the
lower concentration concentrated in the top of the column. Finally, the
concentration of the nitrate ions in the column 3 decrease from 363 mg/L to
255 mg/L, when the length of the column increase from up 0 cm to down
200 cm. Because in these column distilled water that contaminated with
nitrate in large amount which is 1950 mg/L added for 44 days to the soil of
these column that contain high nitrate content. The soil texture is sandy and
the spaces between the soil particle is large and able to enter the nitrate ions
between them, so by addition of large amount of nitrate ions to the soil
there is accumulation of the nitrate ions in the soil along the column. By the
effect of both water flush and earth gravity the nitrate ions moves slowly
from up to down, and the adsorption of nitrate increase in the soil of the
column with the increase of the column length. The higher concentration of
nitrate concentrated in the top of column, while the lower concentration
concentrated in the bottom of the column.
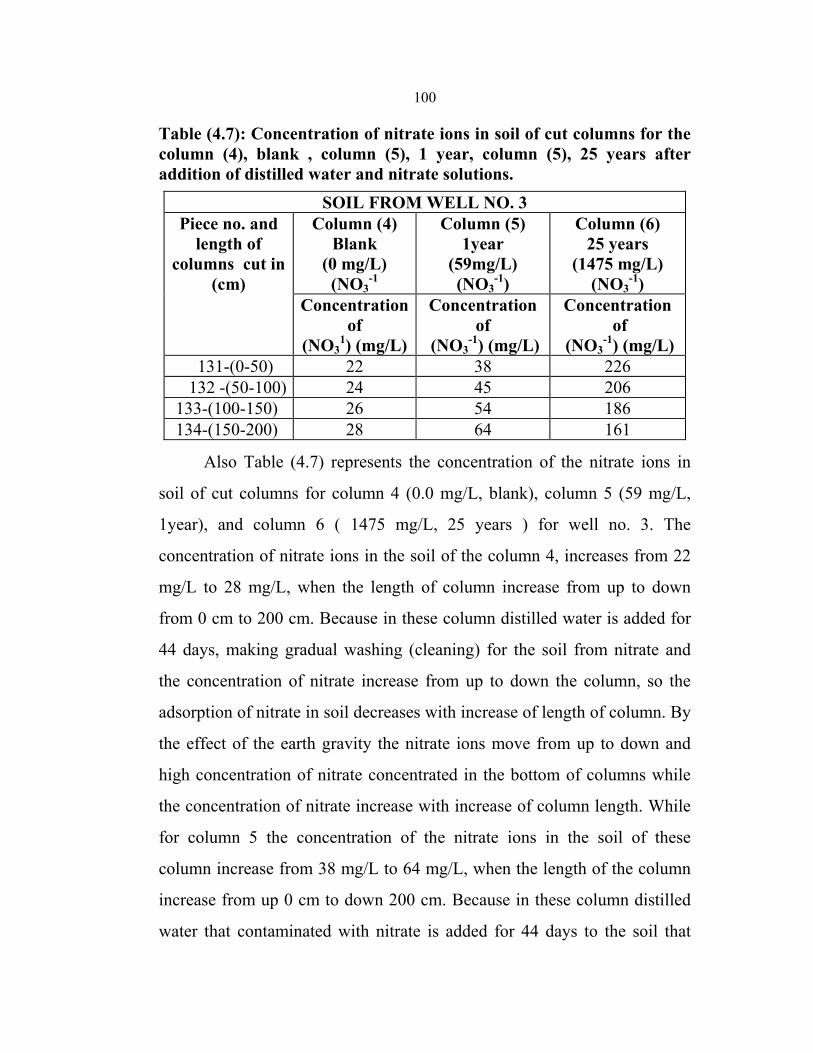
100
Table (4.7): Concentration of nitrate ions in soil of cut columns for the column (4), blank , column (5), 1 year, column (5), 25 years after addition of distilled water and nitrate solutions.
SOIL FROM WELL NO. 3 Column (6)
25 years (1475 mg/L)
(NO3-1)
Column (5) 1year
(59mg/L) (NO3
-1)
Column (4) Blank
(0 mg/L) (NO3
-1
Piece no. and length of
columns cut in (cm)
Concentration of
(NO3-1) (mg/L)
Concentration of
(NO3-1) (mg/L)
Concentration of
(NO31) (mg/L)
226 3822 131-(0-50) 206 45 24 132 -(50-100) 186 54 26 133-(100-150) 161 64 28 134-(150-200)
Also Table (4.7) represents the concentration of the nitrate ions in
soil of cut columns for column 4 (0.0 mg/L, blank), column 5 (59 mg/L,
1year), and column 6 ( 1475 mg/L, 25 years ) for well no. 3. The
concentration of nitrate ions in the soil of the column 4, increases from 22
mg/L to 28 mg/L, when the length of column increase from up to down
from 0 cm to 200 cm. Because in these column distilled water is added for
44 days, making gradual washing (cleaning) for the soil from nitrate and
the concentration of nitrate increase from up to down the column, so the
adsorption of nitrate in soil decreases with increase of length of column. By
the effect of the earth gravity the nitrate ions move from up to down and
high concentration of nitrate concentrated in the bottom of columns while
the concentration of nitrate increase with increase of column length. While
for column 5 the concentration of the nitrate ions in the soil of these
column increase from 38 mg/L to 64 mg/L, when the length of the column
increase from up 0 cm to down 200 cm. Because in these column distilled
water that contaminated with nitrate is added for 44 days to the soil that
101
contain high nitrate content, and the soil texture is sandy and the spaces
between the soil particle is large and able to enter the nitrate ions between
them. By the effect of both water flush and earth gravity the nitrate ions
moves from up to down, and the adsorption of nitrate decrease in the soil
of the column with the increase of the column length. The higher
concentration of nitrate concentrated in the bottom of column, while the
lower concentration concentrated in the top of the column. Finally, the
concentration of the nitrate ions in the column 6 decrease from 226 mg/L to
161 mg/L, when the length of the column increase from up 0 cm to down
200 cm. Because in these column distilled water that contaminated with
nitrate in large amount which is 1475 mg/L added for 44 days to the soil of
these column that contain high nitrate content. The soil texture is sandy and
the spaces between the soil particle is large and able to enter the nitrate ions
between them, so by addition of large amount of nitrate ions to the soil
there is accumulation of the nitrate ions in the soil along the column. By the
effect of both water flush and earth gravity the nitrate ions moves slowly
from up to down, and the adsorption of nitrate increase in the soil of the
column with the increase of the column length. The higher concentration of
nitrate concentrated in the top of column, while the lower concentration
concentrated in the bottom of the column.
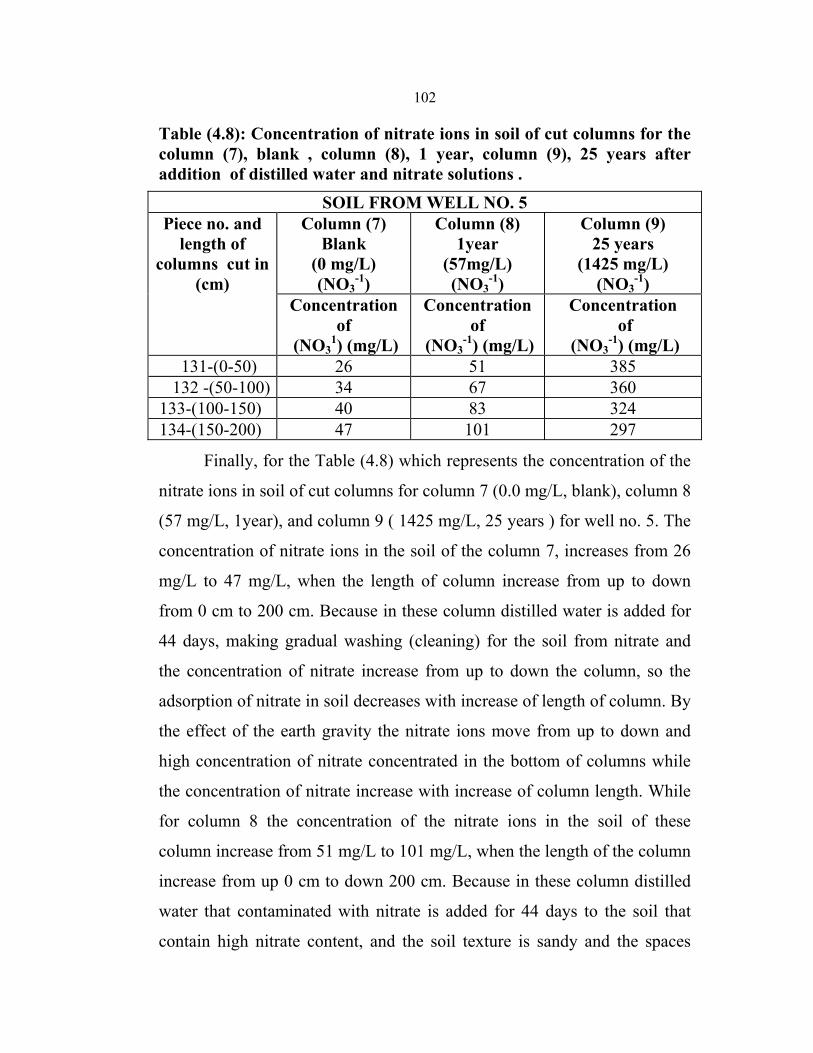
102
Table (4.8): Concentration of nitrate ions in soil of cut columns for the column (7), blank , column (8), 1 year, column (9), 25 years after addition of distilled water and nitrate solutions .
SOIL FROM WELL NO. 5 Column (9)
25 years (1425 mg/L)
(NO3-1)
Column (8) 1year
(57mg/L) (NO3
-1)
Column (7) Blank
(0 mg/L) (NO3
-1)
Piece no. and length of
columns cut in (cm)
Concentration of
(NO3-1) (mg/L)
Concentration of
(NO3-1) (mg/L)
Concentration of
(NO31) (mg/L)
385 5126 131-(0-50) 360 67 34 132 -(50-100) 324 83 40 133-(100-150) 297 101 47 134-(150-200)
Finally, for the Table (4.8) which represents the concentration of the
nitrate ions in soil of cut columns for column 7 (0.0 mg/L, blank), column 8
(57 mg/L, 1year), and column 9 ( 1425 mg/L, 25 years ) for well no. 5. The
concentration of nitrate ions in the soil of the column 7, increases from 26
mg/L to 47 mg/L, when the length of column increase from up to down
from 0 cm to 200 cm. Because in these column distilled water is added for
44 days, making gradual washing (cleaning) for the soil from nitrate and
the concentration of nitrate increase from up to down the column, so the
adsorption of nitrate in soil decreases with increase of length of column. By
the effect of the earth gravity the nitrate ions move from up to down and
high concentration of nitrate concentrated in the bottom of columns while
the concentration of nitrate increase with increase of column length. While
for column 8 the concentration of the nitrate ions in the soil of these
column increase from 51 mg/L to 101 mg/L, when the length of the column
increase from up 0 cm to down 200 cm. Because in these column distilled
water that contaminated with nitrate is added for 44 days to the soil that
contain high nitrate content, and the soil texture is sandy and the spaces
103
between the soil particle is large and able to enter the nitrate ions between
them. By the effect of both water flush and earth gravity the nitrate ions
moves from up to down, and the adsorption of nitrate decrease in the soil
of the column with the increase of the column length. The higher
concentration of nitrate concentrated in the bottom of column, while the
lower concentration concentrated in the top of the column. Finally, the
concentration of the nitrate ions in the column 9 decrease from 385 mg/L to
297 mg/L, when the length of the column increase from up 0 cm to down
200 cm. Because in these column distilled water that contaminated with
nitrate in large amount which is 1950 mg/L added for 44 days to the soil of
these column that contain high nitrate content. The soil texture is sandy and
the spaces between the soil particle is large and able to enter the nitrate ions
between them, so by addition of large amount of nitrate ions to the soil
there is accumulation of the nitrate ions in the soil along the column. By the
effect of both water flush and earth gravity the nitrate ions moves slowly
from up to down, and the adsorption of nitrate increase in the soil of the
column with the increase of the column length. The higher concentration of
nitrate concentrated in the top of column, while the lower concentration
concentrated in the bottom of the column.
4.6 Adsorption Isotherm:
The equilibrium adsorption data could be described by the
Freundlich adsorption equation (4.1) :
x/m = k (Ce)1/n equation (4.1)
The Freundlich equation constants " k" & "n" could be obtained from
the empirical Freundlich adsorption equation (4.1):
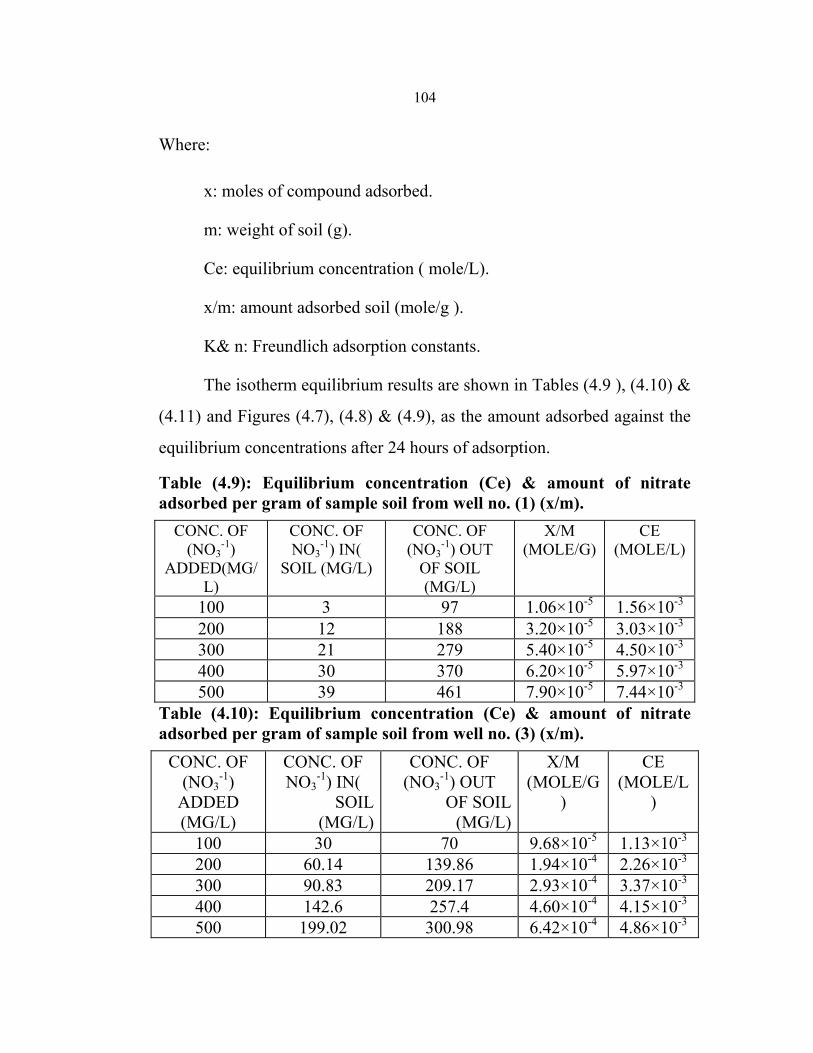
104
Where:
x: moles of compound adsorbed.
m: weight of soil (g).
Ce: equilibrium concentration ( mole/L).
x/m: amount adsorbed soil (mole/g ).
K& n: Freundlich adsorption constants.
The isotherm equilibrium results are shown in Tables (4.9 ), (4.10) &
(4.11) and Figures (4.7), (4.8) & (4.9), as the amount adsorbed against the
equilibrium concentrations after 24 hours of adsorption.
Table (4.9): Equilibrium concentration (Ce) & amount of nitrate adsorbed per gram of sample soil from well no. (1) (x/m).
CE (MOLE/L)
X/M (MOLE/G)
CONC. OF (NO3
-1) OUT OF SOIL (MG/L)
CONC. OF NO3
-1) IN( SOIL (MG/L)
CONC. OF (NO3
-1) ADDED(MG/
L) 1.56×10⁻³ 1.06×10⁻⁵ 97 3 100 3.03×10⁻³ 3.20×10⁻⁵ 188 12 200 4.50×10⁻³ 5.40×10⁻⁵ 279 21 300 5.97×10-36.20×10-5 37030400 7.44×10⁻³ 7.90×10⁻⁵ 461 39 500
Table (4.10): Equilibrium concentration (Ce) & amount of nitrate adsorbed per gram of sample soil from well no. (3) (x/m).
CE (MOLE/L
)
X/M (MOLE/G
)
CONC. OF (NO3
-1) OUT OF SOIL
(MG/L)
CONC. OF NO3
-1) IN( SOIL (MG/L)
CONC. OF (NO3
-1) ADDED (MG/L)
1.13×10⁻³ 9.68×10⁻⁵ 70 30 100 2.26×10⁻³ 1.94×10⁻⁴ 139.86 60.14 200 3.37×10⁻³ 2.93×10⁻⁴ 209.17 90.83 300 4.15×10⁻³ 4.60×10⁻⁴ 257.4 142.6 400 4.86×10⁻³ 6.42×10⁻⁴ 300.98 199.02 500
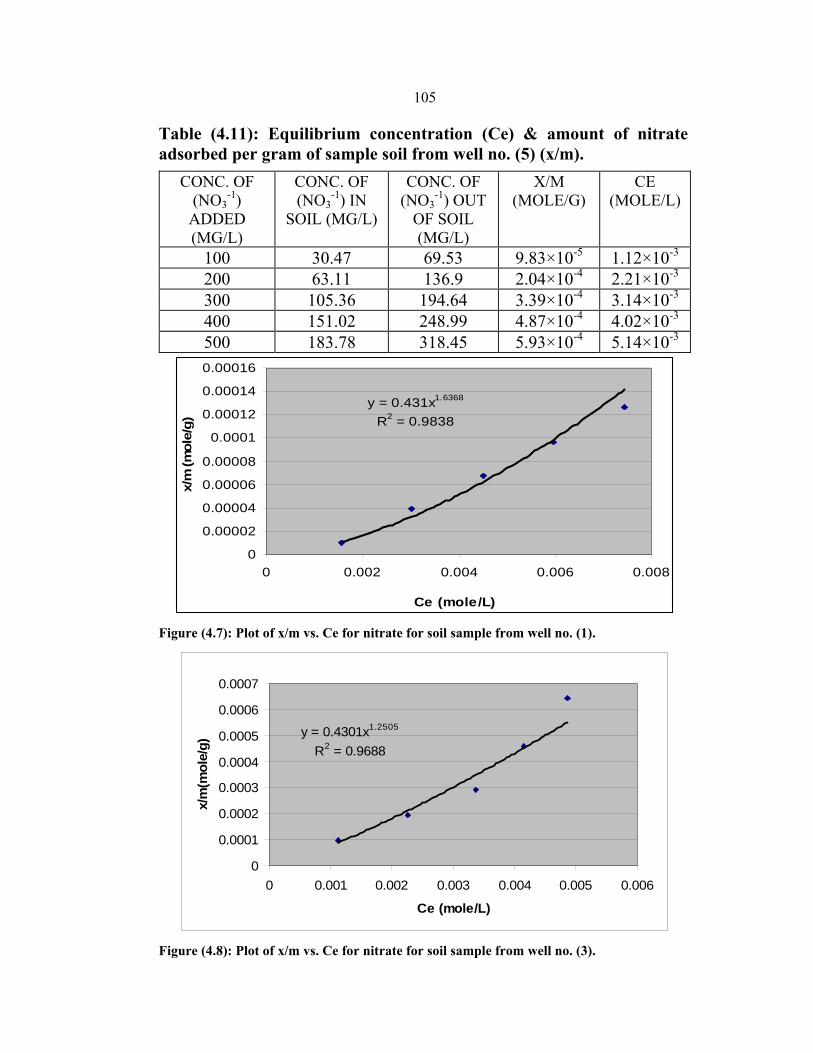
105
Table (4.11): Equilibrium concentration (Ce) & amount of nitrate adsorbed per gram of sample soil from well no. (5) (x/m).
CE (MOLE/L)
X/M (MOLE/G)
CONC. OF (NO3
-1) OUT OF SOIL (MG/L)
CONC. OF (NO3
-1) IN SOIL (MG/L)
CONC. OF (NO3
-1) ADDED (MG/L)
1.12×10⁻³ 9.83×10⁻⁵ 69.53 30.47 100 2.21×10⁻³ 2.04×10⁻⁴ 136.9 63.11 200 3.14×10⁻³ 3.39×10⁻⁴ 194.64 105.36 300 4.02×10⁻³ 4.87×10⁻⁴ 248.99 151.02 400 5.14×10-35.93×10-4 318.45183.78500
y = 0.431x1.6368
R2 = 0.9838
0
0.00002
0.00004
0.00006
0.00008
0.0001
0.00012
0.00014
0.00016
0 0.002 0.004 0.006 0.008
Ce (mole/L)
x/m
(mol
e/g)
Figure (4.7): Plot of x/m vs. Ce for nitrate for soil sample from well no. (1).
y = 0.4301x1.2505
R2 = 0.9688
0
0.0001
0.0002
0.0003
0.0004
0.0005
0.0006
0.0007
0 0.001 0.002 0.003 0.004 0.005 0.006
Ce (mole/L)
x/m
(mol
e/g)
Figure (4.8): Plot of x/m vs. Ce for nitrate for soil sample from well no. (3).
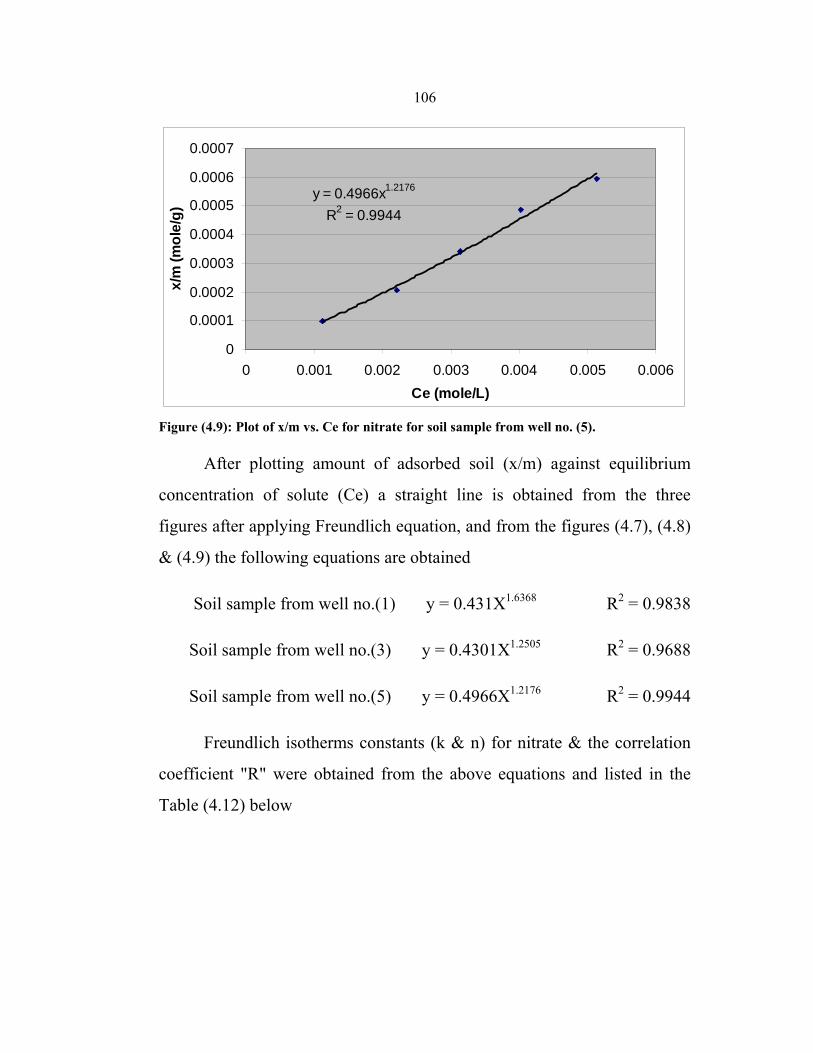
106
y = 0.4966x1.2176
R2 = 0.9944
0
0.0001
0.0002
0.0003
0.0004
0.0005
0.0006
0.0007
0 0.001 0.002 0.003 0.004 0.005 0.006Ce (mole/L)
x/m
(mol
e/g)
Figure (4.9): Plot of x/m vs. Ce for nitrate for soil sample from well no. (5).
After plotting amount of adsorbed soil (x/m) against equilibrium
concentration of solute (Ce) a straight line is obtained from the three
figures after applying Freundlich equation, and from the figures (4.7), (4.8)
& (4.9) the following equations are obtained
Soil sample from well no.(1) y = 0.431X1.6368 R2 = 0.9838
Soil sample from well no.(3) y = 0.4301X1.2505 R2 = 0.9688
Soil sample from well no.(5) y = 0.4966X1.2176 R2 = 0.9944
Freundlich isotherms constants (k & n) for nitrate & the correlation
coefficient "R" were obtained from the above equations and listed in the
Table (4.12) below
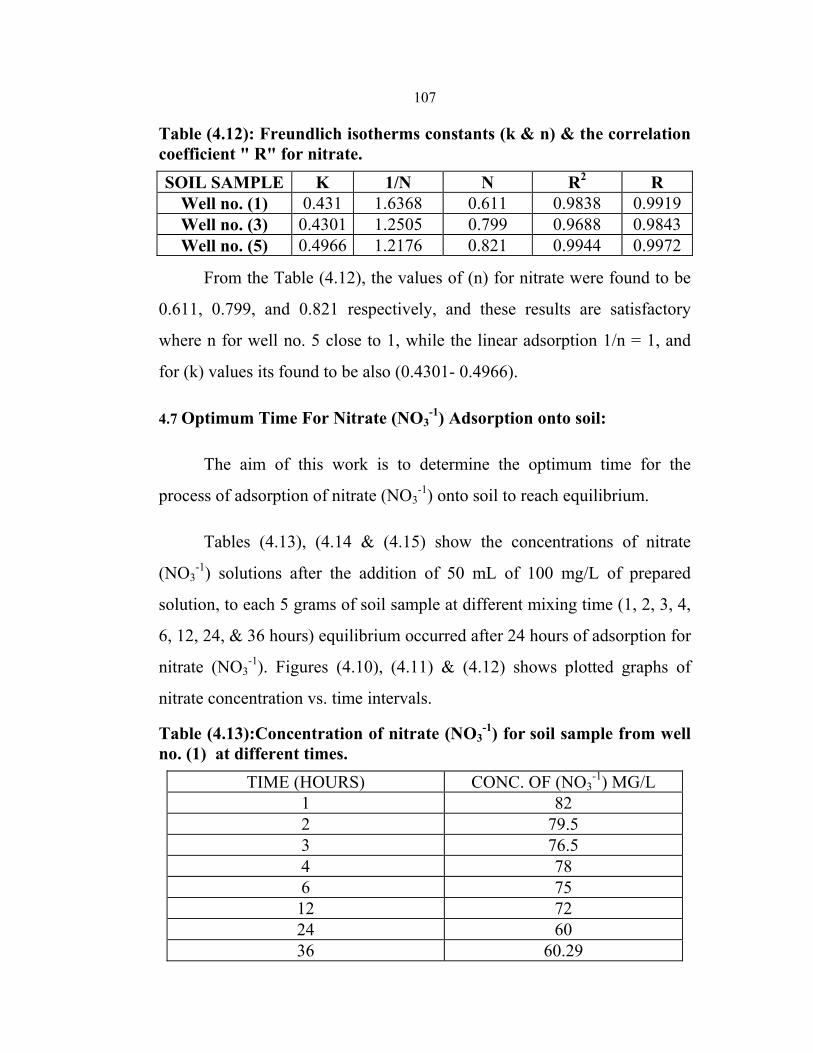
107
Table (4.12): Freundlich isotherms constants (k & n) & the correlation coefficient " R" for nitrate. SOIL SAMPLE K 1/N N R2 R
Well no. (1) 0.431 1.6368 0.611 0.9838 0.9919 Well no. (3) 0.4301 1.2505 0.799 0.9688 0.9843 Well no. (5) 0.4966 1.2176 0.821 0.9944 0.9972
From the Table (4.12), the values of (n) for nitrate were found to be
0.611, 0.799, and 0.821 respectively, and these results are satisfactory
where n for well no. 5 close to 1, while the linear adsorption 1/n = 1, and
for (k) values its found to be also (0.4301- 0.4966).
4.7 Optimum Time For Nitrate (NO3-1) Adsorption onto soil:
The aim of this work is to determine the optimum time for the
process of adsorption of nitrate (NO3-1) onto soil to reach equilibrium.
Tables (4.13), (4.14 & (4.15) show the concentrations of nitrate
(NO3-1) solutions after the addition of 50 mL of 100 mg/L of prepared
solution, to each 5 grams of soil sample at different mixing time (1, 2, 3, 4,
6, 12, 24, & 36 hours) equilibrium occurred after 24 hours of adsorption for
nitrate (NO3-1). Figures (4.10), (4.11) & (4.12) shows plotted graphs of
nitrate concentration vs. time intervals.
Table (4.13):Concentration of nitrate (NO3-1) for soil sample from well
no. (1) at different times. CONC. OF (NO3
-1) MG/L TIME (HOURS) 82 1
79.5 2 76.5 3 78 4 75 6 72 12 60 24
60.29 36
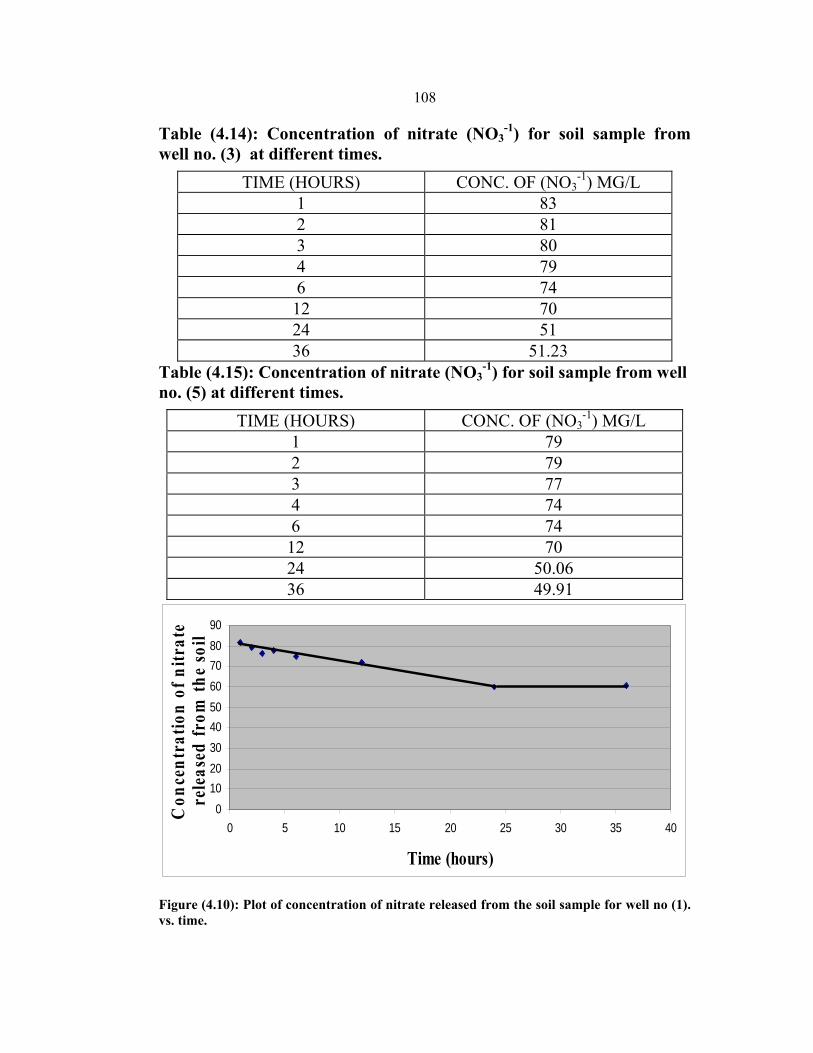
108
Table (4.14): Concentration of nitrate (NO3-1) for soil sample from
well no. (3) at different times. CONC. OF (NO3
-1) MG/L TIME (HOURS) 83 1 81 2 80 3 79 4 746 70 12 51 24
51.23 36 Table (4.15): Concentration of nitrate (NO3
-1) for soil sample from well no. (5) at different times.
CONC. OF (NO3-1) MG/L TIME (HOURS)
79 1 792 77 3 74 4 74 6 70 12
50.06 24 49.91 36
0102030405060708090
0 5 10 15 20 25 30 35 40
Time (hours)
Con
cent
ratio
n of
nitr
ate
rele
ased
from
the
soil
Figure (4.10): Plot of concentration of nitrate released from the soil sample for well no (1). vs. time.
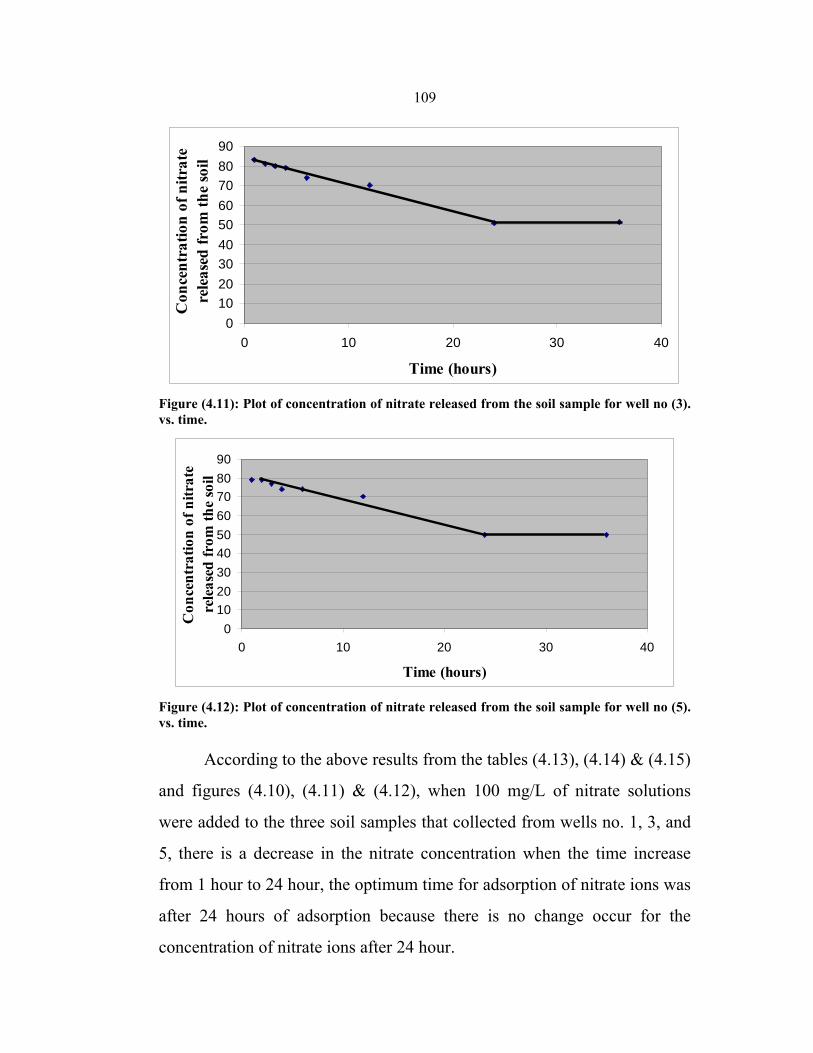
109
0102030405060708090
0 10 20 30 40
Time (hours)
Con
cent
ratio
n of
nitr
ate
rel
ease
d fr
om th
e so
il
Figure (4.11): Plot of concentration of nitrate released from the soil sample for well no (3). vs. time.
0102030405060708090
0 10 20 30 40
Time (hours)
Con
cent
ratio
n of
nitr
ate
rele
ased
from
the
soil
Figure (4.12): Plot of concentration of nitrate released from the soil sample for well no (5). vs. time.
According to the above results from the tables (4.13), (4.14) & (4.15)
and figures (4.10), (4.11) & (4.12), when 100 mg/L of nitrate solutions
were added to the three soil samples that collected from wells no. 1, 3, and
5, there is a decrease in the nitrate concentration when the time increase
from 1 hour to 24 hour, the optimum time for adsorption of nitrate ions was
after 24 hours of adsorption because there is no change occur for the
concentration of nitrate ions after 24 hour.
110
CHAPTER FIVE
CONCLUSIONS AND RECOMMENDATIONS
5.1 CONCLUSIONS:
Many regions in the world and especially Palestine use the
groundwater as the only source of drinking water and agriculture, thus
nitrate in drinking water becomes a significant concern for people.
Soil texture, organic matter content, water flux, certain fertilizer,
fertilizer application may have a major influence on nitrate leaching in
groundwater.
The results clearly indicate, that soil present in the columns taken
from wells no. (1, 3, and 5) is mainly sandy to sandy loam soil that contains
sand in high percentage (75 %-92 %), small amount of silt & clay (0.74 %-
4.52 %), and considerably high percentage organic matters (3.71 %-
4.25%). The soil content in Tulkarem City consider to be high in the
concentration of the nitrate ions that range from 261,7 mg/L to 799 mg/L,
and these elevation in the nitrate concentrations is due to the intensive use
of fertilizers, animal manures, and wastewater from Wadi Zaimer and
septic tanks. This higher concentrations of nitrate leach from the soil to the
ground water in large amount, this because the major component of the soil
is sand, and sand has large particle size and large spaces that enable nitrate
ions to enter between them for a period of time until irrigation or rain full
that move nitrate ions downward to the ground water. However, there are
high amount of organic matters, that close some spaces between the sandy
111
particles, so it reduces the rate of the water that contain nitrate from
leaching to the groundwater.
Using large amount of the water in the irrigation of the agricultural
land makes the percolating of nitrate and other chemicals at greater
potentially risk. This large amount that is used in irrigation dissolves excess
nitrate that is present in the soil and makes it more susceptible to leach
downward until reaching the groundwater. The microbial activity will raise
in the soil, and as a result mineralization increase which is necessary in
making nitrate ions .
Nitrate percolating from fertilizer depends upon the climate
condition, fertilizer types (organic, nitrate, or ammonium) and method of
application. Nitrate percolating may be greater when fertilizer contains
ammonium nitrogen as major component of the fertilizer with nitrate as
another part of fertilizer [87].
Adding distilled water to the blank columns for 44 days, made
washing (cleaning) for the soil from the higher concentration of nitrate
ions, which is present in the soil content. This happened by the effect of
distilled water flux, that forces nitrate ions that is adsorbed to the soil
particles to dissolve in distilled water and move in the soil under influence
of the earth gravity until reach the bottom of the soil column. In the first
addition of distilled water adsorption of nitrate ions to the soil particles is
higher than desorption, then as the addition of distilled water continue the
desorption is higher than adsorption. As a result the higher concentration of
nitrate ions are concentrated in the bottom of the columns, while the top of
112
the soil has lower concentration, and these is a benefit way to remove
nitrate from soil.
Adding contaminated water with nitrate to the soil in the columns
according to the short-term concentration (one year ) and long–term
concentration (25 years), resulted in having a higher concentration of
nitrate at the bottom of the columns and a lower concentration of nitrate
concentrated at the top of the columns. It is worth noticing that the
concentration of nitrate ions is doubled in quantity of the short-term
concentration relative to that of the blank columns. However, in short–
term concentration (57 mg/L-78 mg/L), this higher concentration of nitrate
that added for 44 days to the soil that contain high nitrate content. By the
effect of both water flush and earth gravity the nitrate ions moves from top
to down column, hence the higher concentration of nitrate concentrated at
the bottom of column, comparing the lower concentration at the top of the
column. While in long–term concentration (1400 mg/L-1950 mg/L), this
higher concentration of nitrate that added for 44 days to the soil that
contain high nitrate content, making accumulation of the nitrate ions in the
soil along the column. By the effect of both water flush and earth gravity
the nitrate ions moves very slowly from up to down the column, so the
higher concentration of nitrate concentrated at the top, while the lower
concentration concentrated in the bottom of the column.
The values of "n" in Freundlich equation were close to "one" for well
no. (5) and less for wells no. (1 & 3), which indicate good adsorption for
nitrate, while the optimum time for adsorption was after 24 hours.
113
The groundwater in Tulkarem city is shallow which is about 80 m-
200 m in depth, and that makes it at greater potential risk for leaching of
nitrate into groundwater in a relatively short time, whereas in areas where
the groundwater is deep enough it may take decades before nitrate reaches
the groundwater in large quantities to raise the nitrate concentration above
the standards value.
The soil texture in Tulkarem city is sandy to sandy loam because
Tulkarem is a coastal city, about 10 km–12 km far of the Mediterranean
sea. Going further east, the percentage of sand in soil becomes less which
in return mean, that the other components like clay and silt will be higher in
concentration.
5. 2 RECOMMENDATIONS:
• In the case of sandy soil, mixing soil with organic matter decrease
the pores among the soil particles therefore restrict the flux of water and
other solute through soil, hence nitrate leaching to the groundwater will be
reduced.
• To reduce nitrification in the soil, chemicals known as nitrification
inhibitors can be added to the soil.
• There must be full awareness for the farmers of how to use fertilizers
and animal manures and the proper time for application, and how to
calculate the real need of land from fertilizers and manures by
making chemical tests that illustrate the components of the soil and
its need from fertilizers and manure .
114
• There must be real plan from the municipality to finish the spreading
of septic tanks, by connecting all houses, shops, restaurants, factories
and others with public sewage network.
• Full responsibility laying on the municipality when drilling for new
well, they should have them further away from polluted areas. Also
well must be clean in the inside and tubes and the top must be
sealed.
• To reduce the nitrate in Tulkarem City and in the area surrounding,
the wastewater from western part of Nablus city along with that of
the villages in the path to Tulkarem must pumped their sewage in
trunk line made of concrete and not dumped in Wadi Zaimer.
• If there is high nitrate in any well, that well must be stopped from
pumping drinking water and find other source of water with low
nitrate or solve the problem by diluting it. with water of other well
with low nitrate.
115
References
1- Afaf Ghaleb Hafiz Abu-Dayeh (2006). Thesis: Determination of
Nitrate and Nitrite Content in Several Vegetables in Tulkarem
District . An-Najah National University. Palestine.
2- Mindy Grill (2007). Water Pollution: Causes and Effect of Water
Pollution. Public Services Announcement For Pollution.
3- Lonergan S.C., Brooks D.B. (1994). The Role of Fresh Water in The
Israeli-Palestinian Conflict. International Development Research
Center.
4- EQA, (2002 a). The First Palestinian National Report on Sustainable
Development. Country Report For The World Summit on
Sustainable Development in Johannesburg 54.pp. Environmental
Quality Authority State of Palestine.
5- EQA, (2002 b). The First National Report on Sustainable
Development. Country Report For The World Summit on
Sustainable Development in Johannesburg . Environmental Quality
Authority. State of Palestine.
6-UNEP (2003). Desk study on the Environment in the Occupied
Palestinian Territories. United Nations Environment Programme,
West Bank , Palestine.
7- Fathi Mohammad Amin Yousef Anayah (2006). MSC Thesis: An
assessment of The Nitrate and Chloride in The West Bank
Groundwater Resources Using GIS. An-Najah National
University Nablus–Palestine.
116
8- Marei A., Haddad M. (1998). Nitrate Concentration in The Northern
West Bank. Al-Quds University.
9- Ministry of Health (2001). The Status of health in Palestine. Annual
Report. Palestinian Authority.
10- El-Mahallawi K.M. (1999). Msc. Thesis: Assessment and
Improvement of Drinking Water Quality in The Gaza Strip,
Case Study: Application of a Computer Model of Deir El-Balah
Network. International Institute For Infrastructure Hydraulic and
Environmental Engineering.
11- Paul Jasa, Sharon Skipton, Dave Varner, and De Lynn Hay. Drinking
Water: Nitrate–Nitrite.
12- http: // en. Wikipedia. org. / Wiki / Nitrate.
13- Michael Blaber (1996). Basic Concepts of Chemical Bonding
resonance Structures.
14- Alvin P. Black and Frank H. Babers (1939). Organic Synthesis
(Methyl Nitrate). Coll. vol. 2, P.412, Vol.19,P.64.
15- D. Mc Curdy, J. Mc Cormick. Water Analysis, Determination of
Nitrate (NO3-1) page: 3 .
16- M.S. Subramanian. Analysis of Common Ions at Low Concentrations
in Water. Environmental Chemistry & Analysis. Indian Institute of
Technology. Madras.
117
17- Smith, R.A., Alexander, R.B., and Wolman, M.G. (1987). Water-
quality trends in the Nation’s rivers: Science, 235, p. 1607-
1615.
18- World Health Organization (1996). Guidelines For drinking Water
Quality. Health Criteria & Other Supporting Information, 2nd
edition Vol. 2, 940-949.
19- Kross (1995). In Soil Amendments: Impacts on Biotic System Cited
in ITRC (2000). Technology Overview Prepared by Interstate
Technology & Regulatory Cooperation Work Group (ITRC). June
2002.
20- Ministry of Public Heath (1981). Notification, No. 61, B.F., 2524
Thailand Cited in ITRC (2000). Technology Overview Prepared
by Interstate Technology & Regulatory Cooperation Work Group
(ITRC). June 2002.
21- Craig Runyan (2002). Nitrate in Drinking Water. College of
Agriculture, Consumer & Environmental Sciences. New Mexico
State University.
22- Sabina Fahrner (2002). Groundwater Nitrate Removal Using a
Bioremediation Trench. Pages: (8-11). Honours Thesis.
University of Western Australia, Department of Environmental
Engineering.
23- Wanda Eubank, Jerry Carpenter, Beverly Maltsberger, Karen Mancl.
Nitrate in Drinking Water. pages: (1-2), WQ103. Ohio state
University.

118
24- Kim Gehle MD, MPH. Nitrate/Nitrite Toxicity, Case Studies in
Environmental Medicine Page: (9). Department of Health &
Human Services, Agency For Toxic Substances & Disease
Registry, Division of Toxicity & Environmental Medicine,
Environmental Medicine & Educational Services Branch or http:
// www.Atsdr. cdc . gov /csem.
25- National Research Council (1995). Nitrate and Nitrite in Drinking
water. Committee on Toxicology Washington, DC: National
Academies Press.
26- US Census Bureau (2004). The American Housing Survey For The
United States. Washington, DC: US Department of Commerce.
27- Centers For Disease Control and Prevention (1995). A survey of The
Quality of Water Drawn From Domestic Wells in Nine
Midwest States . Atlanta: US Department of Health and Human
Services.
28- US Geological Survey (1999). The Quality of Our Nation's Waters:
Nutrients and Pesticides . Circular 1225. Reston, VA: US
Department of The Interior.
29- US Environmental Protection Agency (1990). National Pesticide
Survey: Project Summary. Washington, DC: US Environmental
Protection Agency.
30- Barbara Daniels, Nancy Mesner (2005). Nitrate: Safe Drinking
Water in Utah . NR / WQ /2005–23.
119
31- http: // www. Nitrate Poising in Ruminants.
32- Gregory D. Jenning, Ronald E. Sneed. Nitrate in Drinking Water.
Publication Number: AG473-4 .
33- Margaret Mc Casland, Nancy M. Trantmann, Keith S., Robert J.
Wagenet. Nitrate: Nitrate Effects in Drinking Water.
34- Thomas M. Addiscott. Fertilizers & Nitrate Leaching . Pages: (2-3) .
35- Janice Woodard, Kathleen Parrolt, Blake Ross (1996). Nitrate in
Household Water . Virginia Cooperative Extension . Publication
number 356-484.
36- Randy Johnson (2005). Drinking water Treatment Methods .
37- Paul D. Robillard, William E. Sharpe, Bryan R. Swistock. Nitrate in
Drinking Water. Agriculture & Biological Engineering. College
of Agriculture Science Cooperative Extension . F. 136.
38- Barbara Kneen, Ann Lemley, Linda Wagenet (1995). Water
Treatment Notes (Reverse Osmosis Treatment of Drinking
Water) . Cornell Cooperative Extension, College of Human
Ecology. Fact Sheet 4.
39- http: //en . Wikipedia . org / Wiki / soil .
40- Maurice G. Cook (1997) (DBL) . Soil Fact: Good Management Helps
Protect Groundwater. North Corolina Cooperative Extension
Service. Publication AG-439-9 .
41- Sam Kinchloe. Efficient Fertilizer Use Manual: Soil Defined.
120
42- Helen E. Fox, Robert L. Cunningham, Raymand F. Shipp. Some Facts
About Soil Basics. Pennstate Colleage of Agriculture Sciences.
Agronomy Facts 35.
43- Michael Pidwirny (2006). Fundamental of Physical Geography, 2nd
Edition " Chapter 10: Introduction to The Lithosphere :
Introduction to Soil. University of British Columbia Okanagon,
http: // www.phyisicalgeography.net/ physgeoglos.
44- Underground Adventure Soil Critter Field Guide (2005) or www.
Soil Critter Field.
45- Wayne Berry, Quirine Ketterings, Steve Autes, Jouathan Russell-
Anelli, Renuka Rao, Steve De Gloria (2007). Soil Texture. Cornell
University Cooperative Extension. Agronomy Fact Sheet Series,
Fact Sheet 29.
46- New Jersey Department of Environmental of Protection, Environmental
Services Program & Gloucester Country Soil Conservation
District, Sewell, NJ 08080 or www. gloucesterscd .org.
47- A model of Matter: Part 9 Diffusion (2004). Capital Region Science
Educational Partnership. Grant no. 991186 or www. crsep.org.
48- Faustin Habyarimana (2009). Msc. Thesis: Multi-Parameter
Perturbation Analysis of A second Grade Flow Past an
Oscillating Infinite Plate. School of Mathematical Science,
University of Kwa Zulu-Natal, Pietermaritzburg.
121
49- Jack Watson, Tom Cordell, Leland Hardy, ED Minch, ART Hornsby,
Carl Pachek Tom Spofford (1998). How Chemicals Move
Through Soil .University of Arizona Cooperative Extension . AZ
1019.
50- Ruthven D.M. (1984). Principles of Adsorption & Adsorption
Processes . John Wiley & Sons. New York.
51- Weber, JR. W. J. (1972). Physiochemical Processes For Water
Quality Control. Wiley–Interscience, New York.
52- Coulson, J.M. & Richardson, J.F. (1971). Chemical Engineering V.3,
Pergaman Press Ltd., Headington Hill Hall. Oxford.
53- Aly, O.M. and Faust, S.D. (1964). Studies on The Fate of 2,4-D &
Ester Derivatives in Natural Surface Water. J. Agric. Food
Chem., 12(6), 541-6.
54- Giles, C.H. et al. (1960). Studies in Adsorption Part XI. A system of
Classification of Solution Adsorption Isotherm. J. of Chem. Sci.,
3973-92.
55- Giles C.H. & Smith, D.A. (1974). General Treatment and
Classification of Solute Adsorption Isotherm. J. Coll. Inter. Sci. ,
47,755.
56- Young D. M., & Crowel, A,D. (1962). Physical Adsorption of Gases .
Butterwoeths. London.
57- Rubin, A. J., & Mercer, D. L (1984). Principle of Free and Complex
Metal From Solution by Activated Carbon. In Adsorption of
122
Inorganic at Solid Liquid Interfaces, (Eds .M. A. Anderson & A.J.
Rubin ), Ann Arbar Science Pub. Inc. Michigan.
58- Freundlich, H. (1926). Colloid and Capillary Chemistry. Methunen
& Co., London.
59- Lamma Sameeh Awartani. Fate of Oxytetracycline & Doxycycline in
Soil & Underground Water (2010). Msc in Chemistry. An–Najah
National University, Nablus, Palestine.
60- Chris Rundle (2009). Chapter Two and Three: a Beginners Guide to
Ion-Selective Electrode Measurements (Nico 2000 Ltd, UK) or
nico 2000. net/ppslides/ppslides.htm .University of British
Columbia Okanagon.
61- Manar Ahmad Attaallah (2011). The Kinetic Study of Glyphosate
Leachate in Palestinian Soil at Different Concentrations. Msc in
Chemistry. An–Najah National University, Nablus, Palestine.
62- Areej 'Muhammad Ghazi' Abed Ar-Rahman Hattab (2010).
Adsorption of Some Fluoroquinolones on Selected Adsorbents .
Msc in Chemistry. An–Najah National University, Nablus,
Palestine.
63- Mahmoud Ali Al–Haitali (2009). Sorption Characteristics of
Nonionic Surfactant Triton X-100 in Soil Contaminated With
Diesel. Msc in Chemistry. An–Najah National University, Nablus,
Palestine.
123
64- Karbalaa` Muhammad Aref Jaradat (2009). Adsorption and
Desorption Characteristics of Endosulfan Pesticide in Three
soils in Palestine. Msc in Chemistry. An–Najah National
University, Nablus, Palestine.
65- Taha, A. Waly1, A. M. Dakroury2, G. O. El-Sayed3 and S. A. El-
Salam1(2010). Assessment Removal of Heavy Metals Ions from
Wastewater by Cement Kiln Dust (CKD). Egyptian Fuel
Manufacturing Pilot Plant (FMPP) 1, Hot Lab. Center and Waste
Management, Atomic Energy Authority, Egypt2, Department of
Chemistry, Faculty of Science, Benha University. Benha, Egypt3.
Journal of American Science 2010; 6 (12) : 910-917] (ISSN: 1545-
1003). http : // www.americanscience.org 2010; 6(12).
66- N. Kannan and S. Murugavel (2007). Comparative Study on The
Removal of Violet by Adsorption on Various Low Coast
Adsorbents. Department of chemistry (PG), Indian Institute of
Tropical Meteorology, Pune, India. Global NEST Journal, Vol 10,
No 3, pp 395- 403, 2008.
67- S. Yean, L. Cong, C.T. Yavuz, J.T. Mayo, W.W. Yu, A.T. Kan, V.L.
Colvin, and M.B. Tomson (2005). Effect of Magnetite Particle
Size on Adsorption and Desorption of Arsenite and Arsenate.
Department of Civil and Environmental Engineering, Rice
University, Houston, Texas 77005,USA. D J. Mater. Res., Vol. 20,
No. 12, Dec 2005.
124
68- Faridah Bt Ghafar (2004). Adsorption Studies of Aromatic
Compounds in Aqueous Solution Onto Activated Carbon.
Master of Science in chemistry . Sains Malaysia University,
Malaysia.
69- http: // en. Wikipedia. org/Wiki/Tulkarem City.
70- Issac, J. Gigliol, I. and Hilal, J.. Domestic Water Vulnerability
Mapping in The West Bank/Occupied Palestinian Territory.
Applied Research Institute- Jerusalem (ARIJ). Bethlehem,
Palestine.
71- Ministry of Agriculture, Tulkarem Branch.
72- Meteorology Office/ Tulkarem, Ministry of Transport.
73- JV DAHLEM .IGIP (2008). Regional Wastewater Disposal
Tulkarem. Consultancy Services For Review of Feasibility Study.
Preparation of Final Design and Tender Documents, Assistance to
PEA Tendering and Contracting.
74- Ziad Qannam (2002). Hydro-Chemical and Environmental Study in
Wadi Al-Arroub Drainage Basin, South West Bank, Palestine.
75- Ahmad S. AlYaqoubi (2007). Country Paper: Water Resources
Statistical Records in Palestine. Page: (5). Palestinian Water
Authority. Palestine.
76- Information Bank, Palestinian Water Authority/Ramallah.
77- Water Department /Tulkarem Municipality .
125
78- Environment Center (REMAIN) (2000). Proposal Application Form
in The Environment of Tulkarem. Page: (7).
79- Martyn J. Fall. Operating Instructions &Technical Specifications
For Jenway Nitrate Combination Ion Selective Electrode.
Jenway Part Number 924-300.
80- Environmental Protection Agency (2007). Chapter Five (Method
9210A): Potentiomertic Determination of Nitrate in Aqueous
Samples With An Ion–Selective Electrode.
81- Gary Griffin, William Jokela, Don Ross, Dawn Pettinelli, Thomas
Morris and Ann Wolf. Methods of Determination Nitrate in Soil,
Chapter Four: Recommended Soil Nitrate-N Tests. Cooperative
Bulletin No. 493.
82- Soil Mechanics Laboratory Manual (2009). Faculty of Engineering,
Civil Engineering Department, Al-Najah National University.
83- Phosphorus (Total) in Fertilizers, Gravimetric Quinoliniun
Molybodophosphate. AOAC Official Method 962.02.
84- A.L .Page, R. H. Miller & D.R. Keeny. Methods of Soil Analysis,
Second Edition, Part 2 – Chemical & Microbiology Properties,
No.9.
85- Evelyn S, Krull, Jan O. Skjemstad and Jeffrey A. Baldock. Functions
of Soil Organic Matter and the Effect on Soil Properties.
Residue Management, Soil Organic Carbon and Crop Performance.
126
Grains research &development corporation . GRDC Project No
CSO 00029.
86- Nui Milton (2001). Bacteria transform ammonium to nitrate in soil.
Soils are Alive Newsletter .The University of Western Australia.
Volume 2 No. 1, 2001. www.soilhealth.com or
87- A. A. AI Al-Shaikh, G. Abdel-Nasser and A. Sh. Sallam (2009). Reuse
of Date Palm by-Products For Efficient Use of Nitrogen
Fertilizer. International Journal of Soil Science 4(3): 80-92,2009.
ISSN 1816-4978. Academic Journals Inc. King Saud University .
Riyadh, Saudi Arabia.
127
Appendices
APPENDIX 1.1
Preparation of Reagents and Standards Solutions
In this research sodium nitrate (NaNO3) is used as source of nitrate ion
(NO3-1). Molecular weigh of NaNO3 = 84.9947 g, molecular weigh of
(NO3-1) ion = 62.0049 g.
A. Sodium nitrate standard solution (2000 mg/L).
2000 mg/L = 2.0 g.
1 mole NaNO3 (84.9947 g) 1mole (NO3-1) (62.0049 g)
NaNO3 (x g) (NO3-1) (2.0 g)
Grams of ( NO3-1) = ( 2.0 × 84.9947) ÷ 62.0049 = 2.7416 g
2.7416 g NaNO3 was dissolved in one liter distilled water gradually by
shaking.
B. Sodium nitrate solution for well no. 1 one year (78 mg/L).
78 mg/L = 0. 078 g.
84.9947 g 62.0049 g
(x) g 0. 078 g
Grams of ( NO3-1) = (0 . 078 × 84.9947) ÷ 62.0049 = 0.1069 g
128
0.1069 g NaNO3 was dissolved in one liter distilled water gradually by
shaking.
C. Sodium nitrate solution for well no. 25 one year (1950 mg/L).
1950 mg/L = 1.950 mg/L
84.9947 g 62.0049 g
(x) g 1.950 g
Grams of ( NO3-1) = (1.950 × 84.9947) ÷ 62.0049 = 2.6730 g
2.6730 g NaNO3 was dissolved in one liter distilled water gradually by
shaking.
D. Sodium nitrate solution for well no. 3 one year (59 mg/L).
59 mg/L = 0.059 g
84.9947 g 62.0049 g
(x) g 0.059 g
Grams of ( NO3-1) = (0.059 × 84.9947) ÷ 62.0049 = 0.0809 g
0.0809 g NaNO3 was dissolved in one liter distilled water gradually by
shaking.
E. Sodium nitrate solution for well no. 3 25 year (1475 mg/L).
1475 mg/L = 1.475 g
84.9947 g 62.0049 g
129
(x) g 1.475 g
Grams of ( NO3-1) = (1.475 × 84.9947) ÷ 62.0049 = 2.0219 g
2.0219 g NaNO3 was dissolved in one liter distilled water gradually by
shaking.
G. Sodium nitrate reagent for well no. 5 one year (57 mg/L).
57 mg/L = 0.057 g
84.9947 g 62.0049 g
(x) g 0.057 g
Grams of (NO3-1) = ( 0.057 × 84.9947) ÷ 62.0049 = 0.07813 g
0.07813 g NaNO3 was dissolved in one liter of distilled water gradually by
shaking.
H. Sodium nitrate reagent for well no. 5 25 year (1425 mg/L).
1425 mg/L = 1.425 g
84.9947 g 62.0049 g
(x) g 1.425 g
Grams of (NO3-1) = ( 1.425 × 84.9947) ÷ 62.0049 = 1.9534 g
1.9534 g (NaNO3) was dissolved in one liter of distilled water gradually by
shaking.
I. Standard calibration solutions.
130
This solutions prepared from stock solution (2000 mg/L) so the
required calibration solutions are (200 mg/L, 600 mg/L, 1000 mg/L, 1400
mg/L). By the following equation the calibration solution is prepared
M (1)( mg/L) × V(1)(mL) = M(2)( mg/L) × M(2)(mL)
● 200 mg/L calibration solution .
200 mg/L × 100 mL = 2000 mg/L × V(2) (mL)
V(2) (mL) = (200 mg/L ×100 mL) ÷ 2000 mg/L = 10 mL stock solution
10 mL stock solution is added to 90 mL distilled water to making volume
100 mL.
● 600 mg/L calibration solution .
600 mg/L × 100 mL = 2000 mg/L × V(2) (mL)
V(2) (mL) = (600 mg/L ×100 mL) ÷ 2000 mg/L = 30 mL stock solution
30 mL stock solution is added to 70 mL distilled water to making volume
100 mL.
● 1000 mg/L calibration solution .
1000 mg/L × 100 mL = 2000 mg/L × V(2) (mL)
V(2) (mL) = (1000 mg/L ×100 mL) ÷ 2000 mg/L = 50 mL stock solution
50 mL stock solution is added to 50 mL distilled water to making volume
100 mL.
● 1400 mg/L calibration solution .
131
1400 mg/L × 100 mL = 2000 mg/L × V(2) (mL)
V(2) (mL) = (1400 mg/L ×100 mL) ÷ 2000 mg/L = 70 mL stock solution
70 mL stock solution is added to 30 mL distilled water to making volume 100
mL.
J. Recommended ISAB 1 M [KH2PO4] reagent.
This reagent is prepared by the following:
Molarity (M) = Moles of solute 1M = moles of KH2PO4 Liter of solution 0.1 liter
Moles of KH2PO4 = 0.1
Molecular weigh of KH2PO4 = 136.0892 g
Moles of KH2PO4 = weigh of KH2PO4 molecular weigh of KH2PO4 0.1 = wt . of KH2PO4 wt. of KH2PO4 = 13.6089 g 136.0892
13.6089 g is dissolved in 100 mL distilled water for making 1 M.
K. Ionic strength adjustor (ISA) 2 M (NH4)2SO4 reagent.
26.4 g powder of (NH4)2SO4 is added to 100 mL distilled water and
shaking well.
L. Extraction solution 0.04 M of (NH4)2SO4.
20 mL of ISAB is added to 1 liter volumetric flask and making to volume
with distilled water.
132
M. (50 % ) NaOH solution.
500 g NaOH (Pellets) added to 500 mL distilled water (carefully-slowly in
sink in heat resistant container–cool before adding to alkali reservoir.
N. Boric acid solution.
80 g of boric acid added to 1000 mL distilled water, 20 mL of bromocrysol
green indicator and 14 mL methyl red indicator was added to the content
in 2 L volumetric flask and distilled water added to the mark of 2 L.
O. Phosphor reagent.
1- Dissolve 1.2 g of ammonium paramolybdate in 25 mL distilled water.
2- Dissolve 0.02908 g of potassium antimony tartarate in 10 mL distilled
water.
3- Prepare 100 ml of 5 N H2SO4 by diluting 13.8 mL of concentrated
H2SO4 into 100 mL distilled water .
4- Add both (1)+(2) and complete the volume to 200 mL by distilled water.
5- Take 100 mL of solution in (4), add to it 0.528 g ascorbic acid (this step
is done as fresh as possible before testing).
133
APPENDIX 1.2
Amount of nitrate solutions added to soil columns, by knowing the
following parameters
• Average rainfall in Tulkarm city which equal about 602.2 mm = 602.2 ÷
10 = 60.22 cm
• Raining days in Tulkarem City (44 days),
• Surface area of cylinder (tube) = area of circle = R2×π , (R = radius)
Volume of water added to each tube = average rainfall (mm) × surface area
of tube ( mm2) ÷ raining days.
Note: diameter = 6 inch , Radius = 3 inch = 3 × 2.54 = 7.62 cm
= 60.22 (cm) × (7.62 cm × 7.62 cm) × (3.14) ÷ 44 days ≈ 250 mL
This is the amount of water (distilled or contaminated with nitrate) that
must be added everyday for 44 days to the to the plastic columns that filled
with soil .
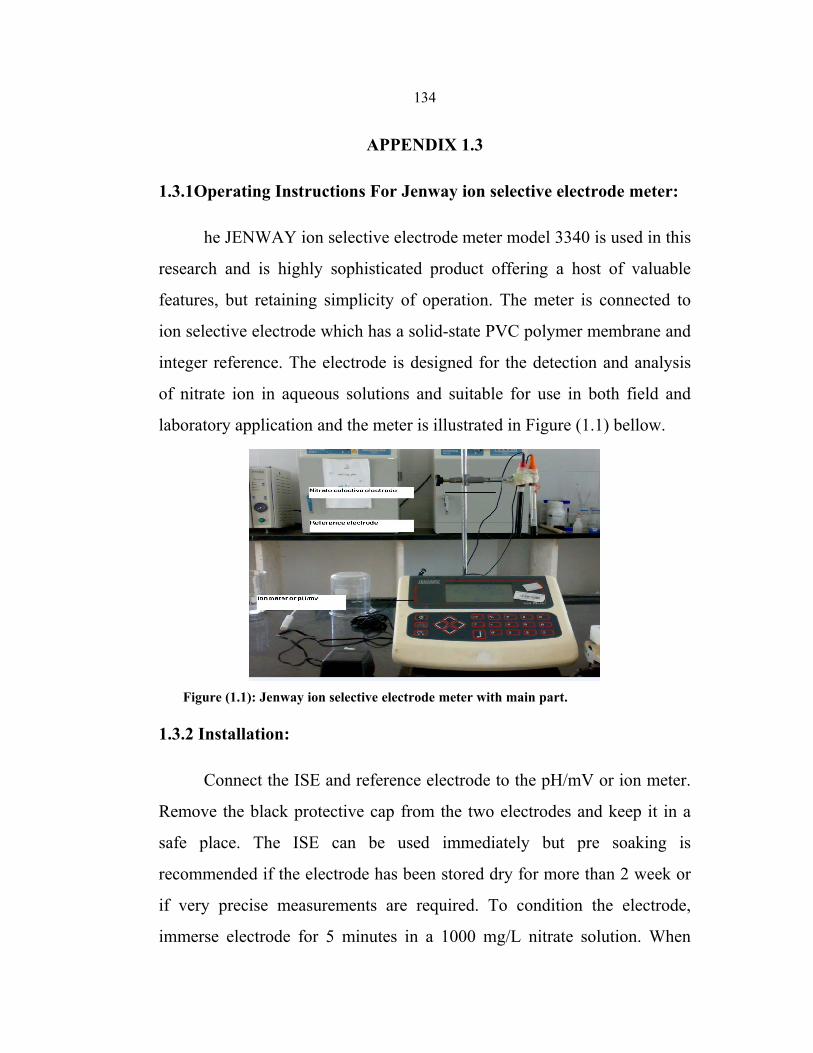
134
APPENDIX 1.3
1.3.1Operating Instructions For Jenway ion selective electrode meter:
he JENWAY ion selective electrode meter model 3340 is used in this
research and is highly sophisticated product offering a host of valuable
features, but retaining simplicity of operation. The meter is connected to
ion selective electrode which has a solid-state PVC polymer membrane and
integer reference. The electrode is designed for the detection and analysis
of nitrate ion in aqueous solutions and suitable for use in both field and
laboratory application and the meter is illustrated in Figure (1.1) bellow.
Figure (1.1): Jenway ion selective electrode meter with main part.
1.3.2 Installation:
Connect the ISE and reference electrode to the pH/mV or ion meter.
Remove the black protective cap from the two electrodes and keep it in a
safe place. The ISE can be used immediately but pre soaking is
recommended if the electrode has been stored dry for more than 2 week or
if very precise measurements are required. To condition the electrode,
immerse electrode for 5 minutes in a 1000 mg/L nitrate solution. When
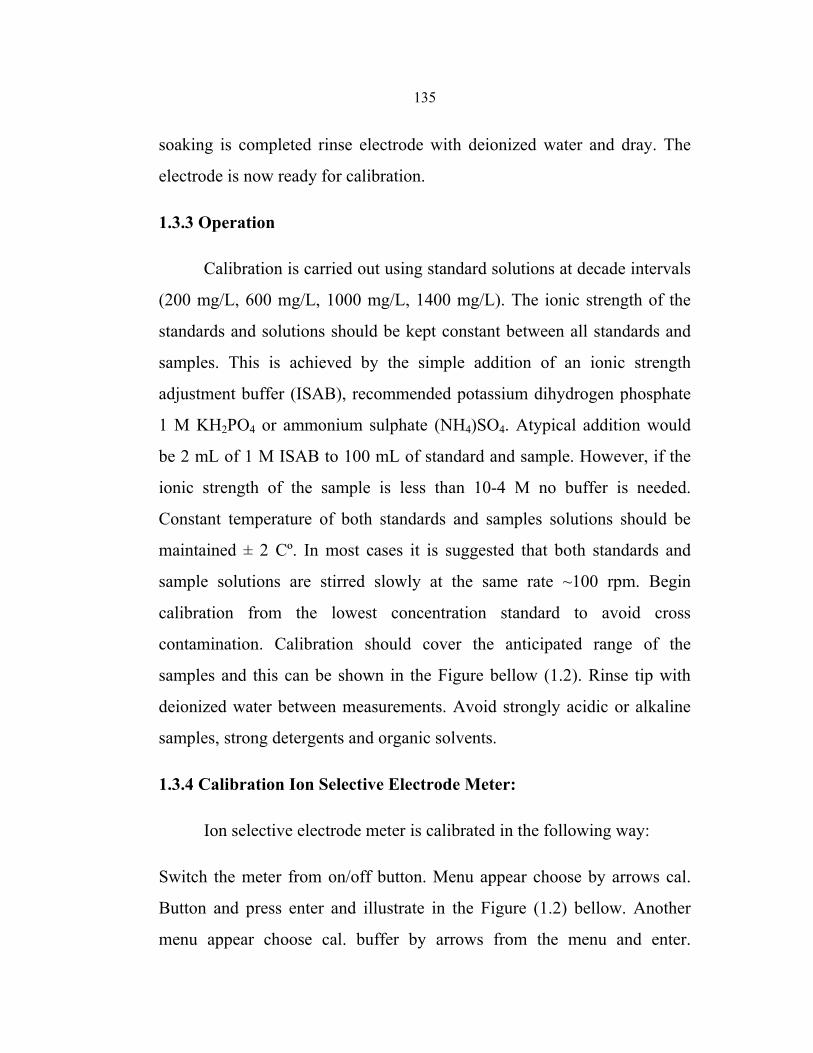
135
soaking is completed rinse electrode with deionized water and dray. The
electrode is now ready for calibration.
1.3.3 Operation
Calibration is carried out using standard solutions at decade intervals
(200 mg/L, 600 mg/L, 1000 mg/L, 1400 mg/L). The ionic strength of the
standards and solutions should be kept constant between all standards and
samples. This is achieved by the simple addition of an ionic strength
adjustment buffer (ISAB), recommended potassium dihydrogen phosphate
1 M KH2PO4 or ammonium sulphate (NH4)SO4. Atypical addition would
be 2 mL of 1 M ISAB to 100 mL of standard and sample. However, if the
ionic strength of the sample is less than 10-4 M no buffer is needed.
Constant temperature of both standards and samples solutions should be
maintained ± 2 Cº. In most cases it is suggested that both standards and
sample solutions are stirred slowly at the same rate ~100 rpm. Begin
calibration from the lowest concentration standard to avoid cross
contamination. Calibration should cover the anticipated range of the
samples and this can be shown in the Figure bellow (1.2). Rinse tip with
deionized water between measurements. Avoid strongly acidic or alkaline
samples, strong detergents and organic solvents.
1.3.4 Calibration Ion Selective Electrode Meter:
Ion selective electrode meter is calibrated in the following way:
Switch the meter from on/off button. Menu appear choose by arrows cal.
Button and press enter and illustrate in the Figure (1.2) bellow. Another
menu appear choose cal. buffer by arrows from the menu and enter.
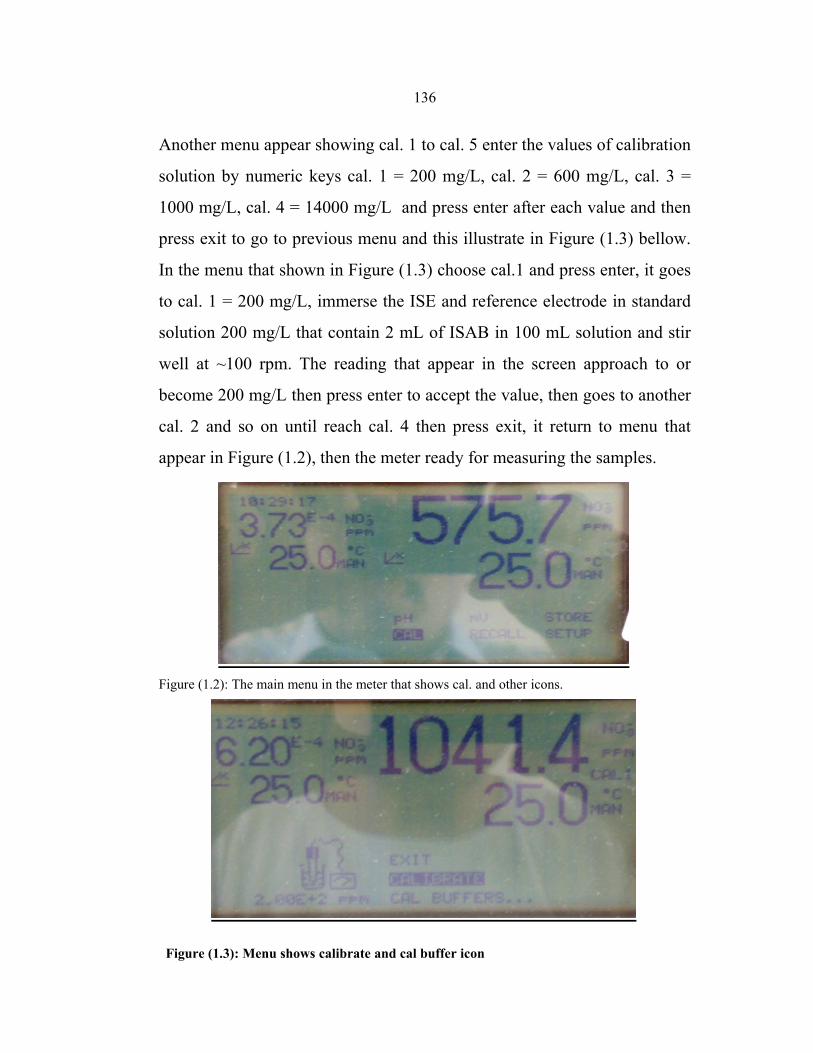
136
Another menu appear showing cal. 1 to cal. 5 enter the values of calibration
solution by numeric keys cal. 1 = 200 mg/L, cal. 2 = 600 mg/L, cal. 3 =
1000 mg/L, cal. 4 = 14000 mg/L and press enter after each value and then
press exit to go to previous menu and this illustrate in Figure (1.3) bellow.
In the menu that shown in Figure (1.3) choose cal.1 and press enter, it goes
to cal. 1 = 200 mg/L, immerse the ISE and reference electrode in standard
solution 200 mg/L that contain 2 mL of ISAB in 100 mL solution and stir
well at ~100 rpm. The reading that appear in the screen approach to or
become 200 mg/L then press enter to accept the value, then goes to another
cal. 2 and so on until reach cal. 4 then press exit, it return to menu that
appear in Figure (1.2), then the meter ready for measuring the samples.
Figure (1.2): The main menu in the meter that shows cal. and other icons.
Figure (1.3): Menu shows calibrate and cal buffer icon

جامعة النجاح الوطنية
كلية الدراسات العليا
دراسة حركة النترات باستخدام أعمدة التربة
في مياه اآلبار الجوفية لمدينة طولكرم
إشراف
شحدة جودة. د
مروان حداد. البروفيسور
إعداد
ناصر محمد زكي أسامة
قدمت هذه األطروحة استكماالً لمتطلبات الحصول علـى درجـة الماجسـتير فـي
.فلسطين –جامعة النجاح الوطنية، نابلس الكيمياء من كلية الدراسات العليا في
2011
ب
دراسة حركة النترات باستخدام أعمدة التربة
في مياه اآلبار الجوفية لمدينة طولكرم
إعداد
ناصر محمدكي أسامة ز
إشراف
شحدة جودة. د
مروان حداد البروفيسور
الملخص
لوث مصادر الميـاه والتـي تتضـمن ت ةعالمي اتملوث يالنترات ه اتكما نعرف أن ايون
ينتج بشكل أساسي من األسمدة النيتروجينية في المناطق وهذا التلوث .المياه السطحية والجوفية
وضعت المعايير (WHO) منظمة الصحة العالمية .حيوانات المياه العادمة وروث ال ،الزراعية
لتر، لذلك أي مصدر للمياه يتعدى هـذه القيمـة / ملغم 45لتركيز ايون النترات والذي يساوي
طريقة األعمدة العمودية التي ملئت بأنواع مختلفة .يعتبر ملوث ويوضع تحت األنظار للمعالجة
ترشـح إذالتربة على المياه الجوفية اتهي لدراسة تأثير مدينة طولكرم المأخوذة من من التربة
.المناطق بارتفاع النترات في هذه االتربة وعالقته خاللالمياه الملوثة بالنترات
ثالثة عينات من األتربة المختلفة في تراكيز النترات ستجمع من جانب آبار بلدية طولكرم
ع في تسعة أنابيب عمودية مـن البالسـتيك هذه العينات ستوض). 5(، ورقم )3(، رقم )1(رقم
(PVC) . بعد ذلك هذه األنابيب ستقسم إلى ثالثة أقسام زمنية معينة للتراكيز وهي صـفر مـدة
لكل عينة ) سنة 25(مدة زمنية طويلة –) سنة واحدة( مدة زمنية قصيرة –) صفر سنة( زمنية
ثالثة تراكيز مختلفة من المياه الملوثة بالنترات ستضاف كتراكيز زمنية لألنابيب التسعة .تراب
.بشكل يومي
وتركيز مياه )سنة واحدة(لمدة زمنية قصيرة لألنابيب، التي تضاف لها النترات بتراكيز
نابيـب وجد أن التراكيز العالية للنترات تتركز في أسـفل األ ) بالنك( مقطرة خالية من النترات
لألنابيب التي تضاف إليها النترات بتركيـز . بينما التراكيز المنخفضة تتركز في أعلى األنابيب

ج
التراكيز العالية لنترات تتركز في أعلى األنابيب بينمـا التراكيـز ) سنة 25( لمدة زمنية طويلة
.المنخفضة تتركز في أسفل األنابيب
تربة هي رملية إلى رملية طفالية وتحتوي علـى ال) تركيب(أشارت أن بنية أيضا النتائج
متوسـط وجـد أن .%4.25و %3.71بين نسبة عالية من المواد العضوية التي تتراوح ما
) 5( و رقـم )3(رقـم ،)1(النترات في محتوى عينات التراب من اآلبار رقم ايونات كيزاتر
.على التوالي ترل/ ملغم 799لتر و / ملغم 216.7لتر،/ ملغم 263.3يساوي
طبقت لدراسة التصاق النترات لذرات التـراب ) مبدأ فرندلخ لاللتصاق(دراسات حركية
،)3(، رقـم )1(رقـم لآلبار االلتصاقنتائج دراسة . )5(ورقم ) 3(، رقم )1(في اآلبار رقم
هـذه النتـائج مرضـية بينمـا .بشكل متوالي 0.821و 0.779 ،0.611يساوي )5(ورقم
.ساعة 24هو بعد األمثل اليونات النترات تصاقاللا