Embed Size (px)
Citation preview

E L S E V I E R International Journal of Pharmaceutics 142 (1996) 215 225
Kinetics of decomposition of hydroperoxides formed during oxidation of soya phosphatidylcholine by analysis of
chemiluminescence generated
the
Satish K. Singh*, Malin Suurkuusk, Carina Elds/iter 1
Pharmacia and Upjohn A B, Department of Pharmacy, S-751 82 Uppsala, Sweden
Received 10 April 1996; revised 15 July 1996; accepted 21 July 1996
Abstract
Chemiluminescence (CL) can be used to measure the extent of oxidation of soya phosphatidylcholine (S-PC) as has been shown previously, utilizing a mixture of the S-PC with medium chain monoacylglycerol. The CL data obtained from such a measurement was examined in this work to estimate the kinetics of decomposition of hydroperoxides that are generated by oxidation. CL intensity has been counted in an inert atmosphere at various temperatures and the data analyzed by non-isothermal and isothermal reaction kinetic analysis, primarily based on isoconversion methods. The isothermal data has also been analyzed to obtain an estimate of the order of reaction. The apparent activation energy for the hydroperoxide decomposition steps in this system is obtained as 74 and 62 kJ/mol; the reaction order changes from 2 to 1 as the reaction proceeds and the hydroperoxides are consumed. Possible mechanisms of hydroperoxide decomposition have been discussed.
Keywords: Chemiluminescence; Hydroperoxide decomposition; Isoconversion methods; Oxidation kinetics; Phos- phatidylcholine oxidation
I. Introduction
*Corresponding author. Fax: +46 18 166336; e-mail: [email protected]
~Present address: Department of Polymer Technology, Royal Institute of Technology, S-100 44 Stockholm, Sweden.
Chemiluminescence (CL) is a vi r tual ly universal
p r o p e r t y o f oxid izable organic substances. Wi th
the deve lopmen t o f sensitive pho tomul t ip l i e r s and
s ing le -photon count ing devices, interest in the use
o f this technique has grown. A m o n g the areas in
which C L measu remen t has shown a lot o f p romise is the s tudy o f ox ida t ion o f l ipids (see
0378-5173/'96/$15.00 © 1996 Elsevier Science B.V. All rights reserved PI1 S0378-5173(96)04671-6
216 S.K. Singh et al. / International Journal o f Pharmaceutics 142 (1996) 215 225
Usuki et al., 1979; Miyazawa et al., 1994; Singh et al., 1996) and the oxidative degradation of poly- mers (see George et al., 1983; Billingham et al., 1991; Forsstr6m et al., 1994). These fields are of interest to the pharmaceutical (and foods) indus- try; the question of oxidation being relevant to both the packaging and the contents thereof.
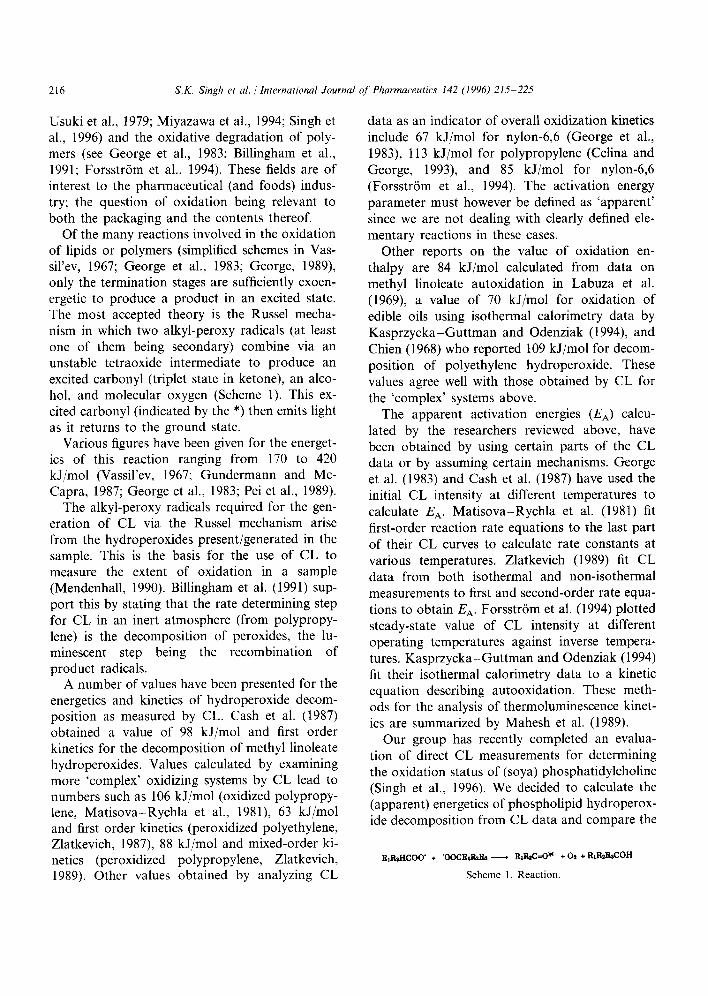
Of the many reactions involved in the oxidation of lipids or polymers (simplified schemes in Vas- sil'ev, 1967; George et al., 1983; George, 1989), only the termination stages are sufficiently exoen- ergetic to produce a product in an excited state. The most accepted theory is the Russel mecha- nism in which two alkyl-peroxy radicals (at least one of them being secondary) combine via an unstable tetraoxide intermediate to produce an excited carbonyl (triplet state in ketone), an alco- hol, and molecular oxygen (Scheme 1). This ex- cited carbonyl (indicated by the *) then emits light as it returns to the ground state.
Various figures have been given for the energet- ics of this reaction ranging from 170 to 420 kJ/mol (Vassil'ev, 1967; Gundermann and Mc- Capra, 1987; George et al., 1983; Pei et al., 1989).
The alkyl-peroxy radicals required for the gen- eration of CL via the Russel mechanism arise from the hydroperoxides present/generated in the sample. This is the basis for the use of CL to measure the extent of oxidation in a sample (Mendenhall, 1990). Billingham et al. (1991) sup- port this by stating that the rate determining step for CL in an inert atmosphere (from polypropy- lene) is the decomposition of peroxides, the lu- minescent step being the recombination of product radicals.
A number of values have been presented for the energetics and kinetics of hydroperoxide decom- position as measured by CL. Cash et al. (1987) obtained a value of 98 kJ/mol and first order kinetics for the decomposition of methyl linoleate hydroperoxides. Values calculated by examining more 'complex' oxidizing systems by CL lead to numbers such as 106 kJ/mol (oxidized polypropy- lene, Matisova-Rychla et al., 1981), 63 kJ/mol and first order kinetics (peroxidized polyethylene, Zlatkevich, 1987), 88 kJ/mol and mixed-order ki- netics (peroxidized polypropylene, Zlatkevich, 1989). Other values obtained by analyzing CL
data as an indicator of overall oxidization kinetics include 67 kJ/mol for nylon-6,6 (George et al., 1983), 113 kJ/mol for polypropylene (Celina and George, 1993), and 85 kJ/mol for nylon-6,6 (Forsstr6m et al., 1994). The activation energy parameter must however be defined as 'apparent' since we are not dealing with clearly defined ele- mentary reactions in these cases.
Other reports on the value of oxidation en- thalpy are 84 kJ/mol calculated from data on methyl linoleate autoxidation in Labuza et al. (1969), a value of 70 kJ/mol for oxidation of edible oils using isothermal calorimetry data by Kasprzycka-Guttman and Odenziak (1994), and Chien (1968) who reported 109 kJ/mol for decom- position of polyethylene hydroperoxide. These values agree well with those obtained by CL for the 'complex' systems above.
The apparent activation energies (EA) calcu- lated by the researchers reviewed above, have been obtained by using certain parts of the CL data or by assuming certain mechanisms. George et al. (1983) and Cash et al. (1987) have used the initial CL intensity at different temperatures to calculate EA. Matisova-Rychla et al. (1981) fit first-order reaction rate equations to the last part of their CL curves to calculate rate constants at various temperatures. Zlatkevich (1989) fit CL data from both isothermal and non-isothermal measurements to first and second-order rate equa- tions to obtain EA. Forsstr6m et al. (1994) plotted steady-state value of CL intensity at different operating temperatures against inverse tempera- tures. Kasprzycka-Guttman and Odenziak (1994) fit their isothermal calorimetry data to a kinetic equation describing autooxidation. These meth- ods for the analysis of thermoluminescence kinet- ics are summarized by Mahesh et al. (1989).
Our group has recently completed an evalua- tion of direct CL measurements for determining the oxidation status of (soya) phosphatidylcholine (Singh et al., 1996). We decided to calculate the (apparent) energetics of phospholipid hydroperox- ide decomposition from CL data and compare the
RIRaI'ICO0" * 'OOCRtP, a.R~ -.---* RzR2C - - 0 . ÷ 02 ÷ RzR~RsCOH
S c h e m e 1. R e a c t i o n .

S.K. S&gh et al. / International Journal o f Pharmaceutics 142 (1996) 215-225 217
values obtained for polymers reported above. No comparative data is available in the litera- ture. Furthermore, a novel approach has been taken to the calculation of EA from CL data in this report based on a non-isothermal reac- tion kinetics analysis whereby no a priori as- sumption is required as to the mechanism involved.
Non-isothermal kinetic analysis is an area of active research since the 1960s and numerous schemes have been put forward (Brown et al., 1980; Flynn et al., 1987). The most successful are the so-called isoconversion methods (see re- views in Ozawa, 1992; Chen et al., 1993). The data analyzed by these methods in the litera- ture are almost exclusively obtained from ther- mogravimetric analysis, i.e. data is in the form of weight loss/gain as a function of time and a constant heating rate. We have however uti- lized the generality in the isoconversion method of Friedman (1964) to analyze our CL data, and obtain an apparent activation energy and propose a probable mechanism.
2. Materials
Chromatographically purified soya phos- phatiydylcholine (S-PC) ( > 98%; batch no. E 40302) and medium-chain monoacylglycerol (MCM) ( > 99%; approx. 20% C10:0 and 80% C8:0 fatty acids; batch no. K 40921) were ob- tained from Karlshamns LipidTeknik AB, Stockholm, Sweden. Samples for the CL stud- ies were prepared by dissolving S-PC in molten MCM (melting point 32 35°C) to a concentra- tion of 50 wt.%. Appropriate amounts of the components were weighed and sealed in a glass bottle under nitrogen purge. The mixture was stirred with a magnet and held between 50- 60°C for 2 - 4 h to obtain a uniform solution. This material was then used in the measure- ments below. No further oxidation was induced in the sample which was kept at - 2 0 ° C in a vial filled with dry nitrogen. All measurements in this report were made on the same batch of 50/50 w/w S-PC/MCM mixture.
3. Methods
3.1. Chemiluminescence
The procedure for CL measurements on phos- phatidylcholine has been described by Singh et al. (1996). CL measurements were made with a CLD 100 chemiluminescence detector containing a CLC-10 photon counter (detection range 300-800 nm) from Tohoku Electronic Industrial, Miyagi, Japan. The apparatus has a compartment in which an open sample container can be placed. The whole compartment can be heated; a shutter isolates the photomultiplier tube from this com- partment when measurements are not being made.
HPLC sample vials were cut to obtain small glass cups (13 mm o; 10 mm high) which were used to hold the lipid sample (,-~ 200 rag) in the CL apparatus. These were introduced into the sample compartment only when the compartment was at 26°C; it was always placed at the same position. Prior to starting measurements, the com- partment was flushed with nitrogen for 10 rain and the nitrogen flush was continued throughout the measurement period. At time t - - 0 , the nomi- nal temperature setting of the compartment was raised to the desired operating temperature (73, 83, 93, 98 and 103°C). CL counting was started simultaneously and continued for the desired length of time after which the sample was re- moved and the compartment cooled to room tem- perature before the next run. Two sets of experiments were carried out: one in which CL was measured for 5000 s and the second where counting was continued for a period of 50 000 s.
Data is obtained as CL counts/10 s as a func- tion of time (see Fig. 1). The instrument also simultaneously reports a sample compartment temperature. However, this temperature does not correspond with the actual sample temperature. Actual sample temperature was measured in sepa- rate experiments by placing a temperature probe in the lipid sample and repeating the above CL measurement procedure for 5000 s but with the shutter closed. A correlation between the sample compartment temperature versus time data re- ported by the instrument and the actual sample temperature was thus obtained (Fig. 2). This cor-

218 S.K. Singh et al. I International Journal o f Pharmaceutics 142 (1996) 215-225
35000 . . . . i . . . . ~ . . . . i . . . .
o 30000
25000
20000
8 15000
10000 E
5000
\/
\ \ t
- ~ \ \ ~
,_ , I , , , , I i , , , I i , , i
5000 10000 15000 20000
Counting t ime (s)
Fig. 1. Chemiluminescence intensity curves obtained from the 50/50 S-PC/MCM sample on heating in an inert atmosphere to 73, 83, 93 and 103°C (ascending order of curves).
Table 1 Oxidation parameters of 50/50 S-PC/MCM w/w sample
Method Parameter Measured value
UV spectroscopy a A233 nm A3oo nm 0.237 (AUs/0.02 g S-PC)
A 2 7 o n m A 3 0 o n m 0 . 0 5 3
(AUs/0.02 g S-PC)
HPLC-ELS-UV S-PC content 45.4 _+ 1.4% detection a
Index 1 0.71 Index 2 not detected
TBARS assay a Malondialdehyde 117.2 p g/g S-PC
Other aldehydes b Formaldehyde 300.2 #g/g S-PC Capronaldehyde 520.7 #g/g S-PC
aSingh et al. (1996). bCoutrim et al. (1993).
relation was very reproducible; the procedure was performed for each of the above nominal operat- ing temperatures. This analysis showed that non- isothermal conditions prevailed between 0 and 5000 s after which the sample temperature was very nearly constant.
o v
I -
120
100
80
60
40
20
' ' ' ' I , / / / / ~ ENmmmm i ~ r n O D D D K I D O D r n D ~ D E
I I I I m I a I I i I I I m I I i
A A A A A A A A A A A A A A A A ~ & & & & & & & & & & & & & & & & l k
, h ~ I ,i//i__ ~ , i L
1000 4 5 0 0 5 0 0 0
M e a s u r e m e n t t ime (s)
Fig. 2. Correlation between actual sample temperature (filled symbols) and temperature shown by apparatus (open symbols) for set temperature = 73°C (triangles), and 103°C (squares).
3.2. Other methods of oxidation characterization
The lipid samples used in the above CL studies were characterized by UV absorption 233 nm and 270 nm, TBARS assay, HPLC with Evaporative light scattering-UV detection (Singh et al., 1996), and an HPLC method for aldehyde determination based on the reaction of carbonyl group with the amino group in 2,4-dinitrophenyl hydrazine (see Coutrim et al., 1993). Results of these analyses are summarized in Table 1. Comparision with the data presented in Singh et al. (1996) shows that the samples analyzed here correspond to relatively low levels of oxidation; no cyclic peroxides should be involved.
4. Kinetic analysis of chemiluminescence data
4.1. Method 1: differential analysis
A generalized differential form of reaction rate equation may be used to define the effective hy- droperoxide degradation rate.
dc~ -- dt = k(T)f(7) (I)

S.K. Singh et al. / International Journal of Pharmaceutics 142 (1996) 215-225 219
where c~ is the fraction of reactant left, f i e ) is a rate function representing the reaction mecha- nism, and k(T) is the rate constant at tempera- ture T. If we assume that the luminescence reaction(s) go to completion (at the highest ex- perimental set temperature, Tm,x) producing a final total count of /tot, then the initial hy- droperoxide concentration Po is proportional to /tot, while the hydroperoxide content at any time t, P(t), is proportional to [Itot-E~_oI(t)] , Y.~_0I(t) being the total counts at time t (Zlatkevich, 1989). Thus,
/ t o t - '~, I(t) P(t) _ t=0
= - (2) Po /tot
where l m a x
i ,o, = Y, I(Tm~x; t ) - P0 (3) t = 0
The rate constant can be represented by the Arrhenius relationship
k(T) = A .e EA,,'RT (4)
where A is the pre-exponential factor, R is the gas constant (8.3144 J/K mol), and T is the reaction temperature in Kelvin. Substituting Eqs. (2) and (4) into Eq. (1) and taking the logarithm on both sides gives
in P o d t j = l n A + l n " R T (5)
For constant values of (P/Po), the function f (P/Po) is assumed to be a constant (at all tem- peratures values). This is equivalent to assuming that the underlying chemistry of the lumines- cence process is independent of the temperature. Eq. (5) can then be used to calculate EA by the procedure described below.
The cumulative CL intensity versus time curve, for each nominal operating temperature, is first converted into a fractional hydroperoxide content (P/Po) time curve by Eq. (2). /tot is ob- tained by summing the counts for the highest operating temperature. The implicit assumption is that all of the hydroperoxides are decomposed in such an experiment. The assumption is sup-
ported by the observation that the CL intensity is almost down to background levels by 15 000 s for an operating temperature of 103°C. Several (P/Po) values over the non-isothermal and isothermal portions of the experiment (between 0.99 and 0.40 in steps of 0.01) are selected and the corresponding [-(1/Po)(dP/dt)] and t deter- mined by interpolation. The corresponding ac- tual T values at time t are also obtained from the sample compartment-sample cup temperature correlation data as discussed earlier (Fig. 2). This procedure is repeated for each of the nomi- nal operating temperatures. For each chosen value of (P/Po), the corresponding l n [ - ( 1 / Po)(dP/dt)] from each nominal operating tem- perature is then plotted against the corresponding (l/T). E A is then obtained from the slope of the regression line according to Eq. (5) (examples shown in Fig. 3a). The results are summarized in Fig. 4a.
S -2
-3
"~ -4
r I I (a) ®
0 . ~ 95
- 5 I I I
0.0020 0.0027 0.0028 0.0029 1/T(K -~)
0.0030
11 : I I I (b) [ ]
,~ e5 ~ 9
1. 8
7 I I t I
0.0026 0.002"/ 0.0028 0.0029 0.0030 0.0031
1/T(K 1)
Fig. 3. Examples of graphical expression of (a) Eq. (5) for various (P/Po) ( = 0.95, 0.9, 0.8, 0.7, 0.6, 0.5, 0.4, 0.3), and (b) Eq. (7) for £~_o I(t) ( =2e5, le6, 2e6, 4e6, 6e6, 8e6, le7, and 1.2e7).

220 S.K. Singh et al. / International Journal o f Pharmaceutics 142 (1996) 215-225
120
100 g
~- 80
E 60
"$" 40
zo
~" o 0.5
, , , , I , ' ' ' i , ' ' , i . . . . i . . . . -
( a ) e 0¢e¢0~ i
m B . . _ • - x . ,
0.6 0.7 0.8 0.9 1.0
P/Po (-)
140
d 120 g
~" 100
80
60
40
~ 20 Oe+O
!G G i i i (b)
3z~ (9
2e+6 4e+6 6e+6 8e+6
~-o l(t) (counts)
Fig. 4. Values of E A (open symbols) and intercepts (filled symbols) calculated f rom (a) Eq. (5), and (b) Eq. (7) as functions of (P/Po) and ]U,_ 0 l(t) (cumulative counts) values respectively. Circles and triangles represent different CL data sets.
4.2. Method 2: integral analysis
The observed CL intensity at time t, I(t), (counts/time) can be expressed as (Billingham et al., 1991)
I ( t )=G @ L (6)
where L is the rate of the luminescent reaction, G is a geometric term and @ is the quantum efficiency of the reaction. G is determined by the photon detection efficiency of the photomulti- plier tube, the geometry of the detector and that of the sample itself; this can be reasonably taken to be a constant in this work. • is a product of the fraction of potentially luminescent reactions which produce excited states and the fraction of such states which emit light rather than decaying by a radiationless transition. For the purpose of
this work, • is also taken to be an invariant since the samples analyzed are similar.
L can be related to the hydroperoxide degra- dation rate defined above in Eq. (1). Substitut- ing from Eqs. (1) and (3) for L gives
. r l,to ,tot to ln[/(t)] = in G*A + lnl f~ . R T
(7)
Eq. (7) is solved for E A. The assumption again is that for constant values of ~, the function f(c 0 is constant. Values of ~',=0 I(t) are selected over the non-isothermal and isothermal parts of the runs (between 10 4 and 107 counts). The corre- sponding t and l(t) are obtained for each of the nominal operating temperatures from the raw data curves. The actual sample temperature T at time t in each of the cases is also determined as indicated above from Fig. 2. ln[I(t)] and (I /T) for each nominal operating temperature are plot- ted for each chosen value of £',= 0 I(t), and E A
obtained from the slope of the line fitted accord- ing to Eq. (7) (examples shown in Fig. 3b). The results from this analysis are summarized in Fig. 4b.
4.3. Method 3: reaction order analysis of &othermal data
The general luminescent reaction can be de- scribed as an nth order reaction producing light
k n (7) nP --* hv + products (8)
The kinetic Eq. (1) can then be written as
P o \ d T } = k,,(T)f = k.(T) ~oo (9)
Under isothermal conditions, this equation can be integrated for various values of n to obtain
n = 0: Po - P(t) = ko(T)t (10)
n = l : P ° - P ( t ) - l - e k,¢TU (11) Po
and
forO < n < 1 a n d n > 1

S.K. Singh et al. / International Journal o f Pharmaceutics 142 (1996) 215 225
Table 2 Isothermal data analysis by Method 4: extent-of-reaction analysis, Eq. (16)
221
Nominal set temperature 73, 83°C 73, 93°C 83, 93°C 83, 103°C 93, 103°C pairs (T,,, Tb)
For ~ ranges between 0.725 and 0.500 0.575 and 0.500 0.575 and 0.300 0.475 and 0.300 0.475 and 0.300 Calculated E A (kJ/mol) 56.8 + 0.2 59.3 + 0.2 58.7 + 0.3 49.0 _+ 0.2 40.4 - 0.1
1 1 ( n - I)P ~' '- ' i (n - 1)P~0 '' 1 ) - kn(T)t (12)
while Po is defined as in Eq. (3). The above equations can be used to determine
reaction order and rate constant. One approach is to fit the isothermal part of CL data to the above equations for a series of different n's. The value of n which gives the best fit is taken to be the estimate for the reaction order.
4.4. Method 4: extent-of-reaction analysis of isothermal data
For an isothermal reaction, the rate Eq. (1) can be integrated
fo.12 ;'2 _ d~ = k ( T ) dt f (~)
(13)
to give, without loss of generality
F(~,) -F (~ 2 ) : k(T)(t2 - t,) (14)
where F is the integral function of 1/f. This rela- tionship must hold for all pairs of ~'s at tempera- tures for which the kinetic function f is valid. Thus, for a pair of e's, ~1 and c~2, at two temper- atures, say Ta and Tb, the ratio of rate constants from Eq. (14) is obtained as
k(Ta) tb2-- tbj (15) k(Tb) t~2- t.~
Substituting from Eq. (4) into Eq. (15) gives
R ~ = In - - (16) ta2 - - tal
Eq. (16) can be used to obtain EA by employing pairs of (isothermal) temperatures and cds. All combinations of ~ values, 0.025 units apart, over the isothermal reaction range have been used for
each nominal operating temperature pair to calcu- late EA. A summary of the results is presented in Table 2.
5. Resu l t s and discuss ion
The CL curves for the set of experiments run for 50 000 s is shown in Fig. 1. The CL intensity passes through a maximum due to two competing processes as the sample is heated: the increase in rate of hydroperoxide decomposition and the re- sulting decrease in concentration of available hy- droperoxide species. The position of the peak is therefore related both to the concentration of hydroperoxide and the heating rate. Such peaks have also been reported for preoxidized polymers heated in an inert atmosphere, e.g. Billingham et al. (1991) and Zlatkevich (1989)]. Another obser- vation that can be made is that the curves for 93 and 103°C show a relatively rapid decrease in CL counts near the end of the experiment.
The non-isothermal and isothermal CL data from each of the experiments has been analyzed according to Friedman (1964) as described above in Methods 1 and 2. The two methods are com- plementary to each other as can be seen in Figs. 3 and 4. The calculated E a values vary with the parameter (P/Po) or Z',=o I(t) used (Fig. 4). How- ever, the major variation occurs in the analysis of the initial part of the CL measurements which occur under heating rates of the order of 5-10°C/ min. A normal non-isothermal reaction process should not give rise to this variation implying that other phenomenon are influencing the reaction being observed. Possible explanations include a reduction in the viscosity of the lipid sample with heating leading to more effective diffusion and recombination of radicals. This effect would lead to a decrease in the E A with increasing tempera-

222 S.K. Singh et al . / International Journal o f Pharmaceutics 142 (1996) 215-225
ture. Another phenomenon that is likely to occur is that the oxygen dissolved in the lipid leads to an initial spurt of extra oxidation as the tempera- ture starts to rise. The effect is a concentration of hydroperoxide that is higher at each point in time than would have been the case if all the hydroper- oxide had been found only at the start of the measurement. The effective reaction rate is thereby slower or the calculated EA higher. This effect is obviously only seen during the initial part of the measurement before all the oxygen is used up. These phenomena can explain the initial de- crease in EA at high (P/Po) ( > 0 . 9 ) or low E' t_oI(t ) ( < 1 x 10⁶ counts) in Fig. 4a and Fig. 4b. The change in EA for (P/Po) values between 0.9 and 0.55 is smaller but a downward trend is apparent (Fig. 4a); an average EA has however been calculated between these limits. Similarly, the limits of Z~=oI(t) used are l x 106 to 6 x 10⁶
and to 8 x 10⁶ counts in Fig. 4b; the lower limits are determined by the need to have at least three points to fit Eq. (7). The results are given in Table 3 with the values lying in the range 60-80 kJ/mol. An average value of 74 kJ/mol is obtained from the two sets of experiments. This value compares
Table 3 Summary of EA and n values obtained by different methods
Method of data analysis E A (kJ/mol) n
Differential analysis Eq. (5) (Method 1) Data set 1 (5 set temperatures) 79.1 +9.0 Data set 2 (4 set temperatures) 68.8 _+ 10.3 Average 74
Integral analysis Eq. (7) (Method 2) Data set 1 (5 set temperatures) 76.9 4-6.9 NA Data set 2 (4 set temperatures) 66.3 _+ 9.9 Average 72
Isothermal reaction order analysis (Method 3) Best data fit (Data set 2) NA l and 2 Eq. (11), First order fit (Data 62 1 a set 2)
Isothermal extent of reaction analysis (Method 4) (Data set 2) NA b NA
aForced fit of first order reaction equation to isothermal data down to ~>0.25 as shown in Fig. 6. bDue to the proposed shift in reaction mechanisms; this method of analysis is not strictly valid; calculated values are shown in Table 2.
I v
v
4 -
2 4 ' ' ' ' I ' ' ' ' I . . . . I . . . . I . . . . [ . . . . . . . . .
23
22
21 -0.70
, , , 1 ~ , , ~ 1 , , , , I , , , , I , , ~ , 1 , , , , I , , ,
-0.60 -0.50 -0.40 -0.30 -0.20 -0.10
In(P/Po) ( - )
Fig. 5. Plot according to Eq. (17) for estimation of reaction order by the Friedman method. Circles and triangles represent different CL data sets.
very well with the activation energies in the litera- ture reviewed earlier. The numbers obtained from polymers are in general slightly higher which can be ascribed to differences in material density, diffusivity of radicals, and light transmitivity, as well as differences in methods of evaluation.
Once a value has been obtained for EA (74 kJ/mol), the analysis can be extended to obtain an estimate of the reaction order after Friedman (1964). For a reaction of order n, Eq. (5) can be rewritten as
[ dl E A 1 ~-~ + In P0 d-} = in A + n in (17)
Substituting for EA, the left-hand side can be evaluated for various values of (P/Po) for each T. The average value of the left-hand side can then be calculated for each (P/Po) and plotted against ln(P/Po) to obtain n by regression. The results are plotted in Fig. 5 and show that second order kinetics can be used to approximate the data for (P/Po) values from 0.9 to 0.55. No attempt has been made to calculate the pre-exponential factor A for the reaction from this plot, since it is likely to be confounded with geometric factors influenc- ing measurement and luminescent efficiency terms as indicated in connection with Eq. (6).
Analysis of the isothermal portion of the data by Method 3 requires an estimate of the value of

S.K. Singh et al. / International Journal o f Pharmaceutics 142 (1996) 215 225 223
P0 when fitting the CL curves by the reaction Eq. (10)-Eq. (12). Ideally, P0 should be obtained from the cumulative intensity at infinite time; however, the value at 15 000 s for the experimental run at 103°C has been used here. This, combined with the rapid decrease in CL counts near the end of the experiment as discussed earlier, gives (P/Po) values that approach zero abruptly. Normal reaction kinetics except for zero-order reactions have a much more gradual approach to completion. In order to avoid this effect, the isothermal data has been analyzed down to a (P/Po) value of 0.25 only. (This restriction applies to data for 93 and 103°C only.) Results of this analysis are presented in Fig. 6 which shows that good fits are obtainable with n = 1 (Eq. (11)) for all the temperatures. The k values obtained are 3 .16x 10 -5 , 5.91 x 10 -5 , 1.11 x 10 -4a nd 1.72 x 1 0 - 4 s - l f o r 73, 83, 93 and 103°C, respectively, which gives an activation en- ergy of 62 k J/tool. However, using a nonlinear regression fit with variable n (Eq. (12)) gives best fits with n = 1.74, 0.99, 0.83 and 0.75 for 73, 83, 93 and 103°C, respectively. No particular reason can be given for this discrepancy except that there may be more than one set of parameters that fit the data; the actual data fit is only marginally better in terms of sums of squares residuals (data not shown). The value of n ~ 1.74 for 73°C however departs suffi-
1.0
s
~F
5000 10000 15000 20000
Counting time (s)
2 RIR~-ICOOH -----* RIR~ICO0" * RtR~HCO" + H~O
Scheme 2. Reaction.
ciently from n = 1 to lead to a test of hypothesis that two reaction processes are underway simulta- neously. The following equation representing simultaneous first and second order reactions was fit to the isothermal data
kl --kit
g 1 k ek,, kl + k2
The analysis shows that a significant second order reaction effect is present in the data obtained at 73°C. For the data at 83°C, the second order term improves the fit slightly but is not significant. For the other temperatures, the equation does not converge.
The above data analyses indicates a probable shift in the order of reaction, and thereby in the mechanism, with increase in extent of reaction. Examples of shift in mechanisms are available at least for polymers (Chien and Jabloner, 1968; George, 1989; Zlatkevich, 1989). No comparable discussion is available for fats and oils but Slawson and Adamson (1976) ascribe the origin of CL from their study of autoxidation of linotenic acid to a bimolecular mechanism. Cash et al. (1987) ascribe first order kinetics to the decomposition of methyl linoleate hydroperoxides in the bulk as compared to second order kinetics when adsorbed on silica gel.
It is possible that the first stage of CL emission is a result of the alkyl-peroxy radicals generated by the bimolecular decomposition of hydroperoxides present, as indicated in Scheme 2, with any dis- solved oxygen also taking part through the oxida- tive cascade (Singh et al., 1996). As the CL emission continues, the concentration of hydroperoxides drops, and the unimolecular decomposition (ho- molysis) of hydroperoxides becomes the predomi- nant mechanism for the generation of alkoxy and hydroxy radicals (Scheme 3).
Fig. 6. Fit of Eq. (11) to isothermal portion of CL data. The full lines represent original data; the regression curves are dotted.
RIR2HCOOH ~ RIR:HCO" + 'OH
Scheme 3. Reaction.

224 S.K. Singh et al. / International Journal o f Pharmaceutics 142 (1996) 215 225
R~R~I-ICO" + "OH + 2 RIR~qCOOH
-----* 2 RIR,~ICOO" + RtR~-ICOH ÷ H2
Schcrnc 4. Reaction.
CL may then be emitted from the alkoxy radicals via the free radical induced decomposi- tion of hydroperoxides that leads to the pro- duction of alkyl-peroxy radicals shown in Scheme 4. Thus the reaction in Scheme 3 is followed by the fast reaction 4 (Cash et al., 1987), and subsequently, the Russel mechanism in Scheme 1.
An alternative reaction (to Russell mecha- nism) is the generation of CL by a dispropor- tionation of the alkoxy radicals or a molecular rearrangement reaction of hydroperoxides as in- dicated in Scheme 5. The mechanism requires that the peroxide be secondary.
The reactions in Scheme 3 or Scheme 5 are favoured in inert atmospheres and could well become dominant as the dissolved oxygen is used up and the hydroperoxide concentration in the sample drops. Thus, for the study made at 73°C, the radicals are generated by both the bi- molecular and unimolecular decomposition of hydroperoxides. With increasing temperature of experiment and the increasing degrees of con- version achieved, the unimolecular decomposi- tion becomes dominant at the later stages in the process as the hydroperoxides are con- sumed.
Method 4 for analysis of isothermal data gives estimates of E A (Table 2) that are some- what lower than that obtained by the Friedman analysis methods (Methods 1 and 2) in Table 3. The analysis in Method 4 is made on the as- sumption of unchanging kinetics which does not hold true here in the isothermal data range.
The possible reasons for the sudden dip seen in the CL curves for 93 and 103°C are worth speculation. Can the radical recombination re- action change to a non-luminescent pathway or
RIR~HCOOH ~ RIR2HCO" + "OH ~ RIRcC= O* + H20
Scheme 5. Reaction.
does the hydroperoxide decomposition follow pathways that do not generate free radicals? Is it related to the concentration of other products from oxidation, some of which can function as quenchers? More work with samples of differ- ing extents of oxidation is required to clarify the process occuring here.
The methods of kinetic data evaluation em- ployed in this work have a number of advan- tages. The isoconversion data analysis technique (Methods 1 and 2) used here does not require the assumption of any reaction mechanism; re- action order obtained by combining results from non-isothermal and isothermal data is considered to be more reliable than that from any single measurement technique (Zuru et al., 1990). While it is advantageous to have experi- ments in which the temperature has been raised at a controlled rate, it is not a neccessity as has been demonstrated in this work; however, experiments with (various) controlled heating rates are required to clarify the mechanism and to obtain a better estimate of EA than could be obtained here.
6. Conclusions
Data obtained from measurement of chemilu- minescence from soya phosphatidylcholine un- der inert atmosphere has been analyzed. Both non-isothermal and isothermal kinetic analysis have been carried out. An isoconversion method has been utilized for the first time on CL data. Results suggest a complex mechanism for the hydroperoxide decompostion process that leads to chemiluminescence. The apparent activation energy obtained for the decompositon of hydroperoxides is 74 kJ/mol, with an esti- mated reaction order of 2 at the early stages. The decomposition likely proceeds by both hi- molecular and unimolecular reactions. The dominant reaction order changes to 1 as the concentration of hydroperoxides drops. An ap- parent activation energy calculated for this re- action is 62 kJ/mol. The values of EA are of the same order of magnitude as those in the literature.

S.K. Singh et al. / International Journal of Pharmaceutics I42 (1996) 215-225 225
Acknowledgements
We are grateful to Dr. Sigbritt Karlsson and Prof. Ann-Christine Albertsson, for their support of the CL measurement work. We would like to thank Anna Kron for her help with the chemilu- minscence apparatus and discussions on oxida- tion.
References
Billingham, N.C., Then, E.T.H. and Gijsman, P.J., Chemilu- minescence from peroxides in polypropylene. Part 1: Rela- tion of luminescence to peroxide content. Polym. Deg. Stab., 34 (1991) 263 277.
Brown, W.E., Dollimore, D. and Galway, A.E., Reactions in the solid state. Comprehensive Chemical Kinetics, Vol. 22. Elsevier. Amsterdam, 1980, pp. 41-113.
Cash, G.A., George, G.A. and Bartley, J.P., A chemilumines- cent study of the decomposition of methyl linoleate hy- droperoxides on active substrates. Chem. Phys. Lipids, 43 (1987) 265 282.
Celina, M. and George, G.A., A heterogeneous model for the thermal oxidation of solid polypropylene from chemiu- minescence analysis. Polym. Deg. Stab., 40 (1993) 323-335.
Chen, D., Gao, X. and Dollimore, D., The application of non-isothermal methods of kinetic analysis to the decom- position of calcium hydroxide. Thermochim. Acta, 215 (1993) 65 82.
Chien, J.C.W., Polymer reactions. II. Thermal decomposition of polyethylene hydroperoxide. J. Polym. Sei., A-l, 6 (1968) 375-~ 379.
Chien, J.C.W. and Jabloner, H., Polymer reactions. IV. Ther- mal decomposition of polypropylene hydroperoxides. J. Polym Sci., A-l, 6 (1968) 393-402.
Coutrim, M.X., Nakamura, L.A. and Collins, C.H., Quantifi- cation of 2,4-dinitrophenyl-hydrazones of low molecular mass aldehydes and ketones using HPLC. Chro- matographia, 37 (1993) 185 190.
Flynn, J.H., Brown, M. and Sestak, J., Report on the work- shop: Current problems of kinetic data reliability evaluated by thermal analysis. Thermochim. Acta, 110 (1987) 101 I12.
Forsstr6m, D., Kron, A., Stenberg, B., Terselius, B. and Reitberger, T., Chemiluminescence analysis technique Performance and influencing parameters. Polym. Deg. Stab., 43 (1994) 277-284.
Friedman, H.L., Kinetics of thermal degradation of char- forming plastics from thermogravimetry. Application to a phenolic plastic. J. Polym. Sci., C6 (1964) 183 195.
George, G.A, Chemiluminescence of polymers at nearly ambi- ent conditions. In Zlatkevich g. (Ed.), Luminescence Tech- niques #l Solid State Polymer Research, Marcel Dekker,
New York, 1989, pp. 93-134. George, G.A., Egglestone, G.T. and Riddell, S.Z., Chemilu-
minescence studies of the degradation and stabilization of polymers. Polym. Eng. Sci., 23 (1983) 412 418.
Gundermann, K-D. and McCapra, F., Chemiluminescenee in Organic Chemistry, Springer-Verlag, Berlin, 1987, pp. 17 .106.
Kasprzycka-Guttman, T. and Odenziak, D., Antioxidant properties of lignin and its fractions. Thermoehim. Aeta, 231 (1994) 161 168.
Labuza, T.P., Tsuyuki, H. and Karel, M., Kinetics of linoleate oxidation in model systems. J. Am. Oil Chem. Soe., 46 (1969) 409 416.
Mahesh, K., Weng, P.S. and Furetta, C., Thermoluminescenee in Solids and its Applications. Nuclear Technology Publish- ing, Kent, England, 1989, pp. 43-83.
Matisova Rychla, L., Fodor, Zs., Rychly, J. and Iring, M., Decomposition of peroxides of oxidized polypropylene studied by the chemiluminescence method. Po!vm. Deg. Stab., 3 (1981) 371 382.
Mendenhall, G.D., Chemiluminescence techniques for the characterization of materials. Ange~. Chem. Int. Ed. Engl., 29 (1990) 362-373.
Miyazawa, T., Fujimoto, K., Kinoshita, M. and Riichiro, U., Rapid estimation of peroxide content of soyabean oil by measuring thermoluminescence. J. Am. Oil Chem. Sot., 71 (1994) 343 345.
Ozawa, T., Estimation of activation energy by isoconversion methods. Thermochim. Acta, 203 (1992) 159 165.
Pei, P., Hsu, S.M., Weeks, S. and Lawson, R., Chemilumines- cence instrumentation for fuel and lubricant oxidation studies. Lubrication Eng., 45 (1989) 9 15.
Singh, S.K., Suurkuusk, M., Elds~ter, C., Karlsson. S. and Albertsson, A-C., Chemiluminescence is a rapid and sensi- tive method to assess phosphatidylcholine oxidation. Int. J. Pharm., 142 (1996) 199 213.
Slawson, V. and Adamson, A.W., Chemiluminescent autoxi- dation of linolenic acid films on silica gel. Lipids, 11 (1976) 472-477.
Usuki, R., Kaneda, T., Yamagishi, C.T. and Inaba, H., Esti- mation of oxidative deterioration of oils and foods by measurement of ultraweak chemiluminescence. J. Food Sei., 44 (1979) 1573 1576.
Vassil'ev, R.F., Chemiluminescence in liquid-phase reactions. Progr. Reaction Kinetics, 4 (1967) 305 352.
Zlatkevich, L., A chemiluminescence technique for the evalua- tion of the thermal oxidative stability of polyethylene. Polym. Deg. Stab., 19 (1987) 51 60.
Zlatkevich, L., Chemiluminescence in evaluating thermal oxi- dative stability. In Zlatkevich, L. (Ed.), Lumineseence Techniques in Solid State Polymer Research. 1989, pp. 135 197.
Zuru, A.A., Whitehead, R. and Griffiths, D.L., A new tech- nique for determination of the possible reaction mecha- nism from non-isothermal thermogravimetric data. ThermochinT. Aeta, 164 (1990) 285 305.