Embed Size (px)
Citation preview
The distributor of Kinetics Mutual Funds, Inc. is Kinetics Funds Distributor LLC.
Kinetics Funds Distributor LLC is not an affiliate of Kinetics Mutual Funds, Inc.
Kinetics Mutual Funds
Fourth Quarter 2016 - Conference Call with Peter Doyle
January 17, 2017
Disclosures: Kinetics Asset Management LLC (“Kinetics”) is pleased to announce that on January 17, 2017, Peter Doyle, Senior
Portfolio Manager for Kinetics Mutual Funds, Inc. hosted a conference call to financial advisors. The transcript set
forth below is intended to provide a summary of Mr. Doyle’s remarks.
You should consider the investment objectives, risks, charges and expenses of the Kinetics Mutual Funds, Inc.
(the “Funds”) carefully before investing. For a free copy of the Funds’ Prospectus, which contains this and other
information, visit our website at www.kineticsfunds.com or call 1-800- 930-3828. You should read the Prospectus
carefully before you invest. For the most recent month-end performance data, please visit our website at
www.kineticsfunds.com. Standardized performance can be accessed here: www. kineticsfunds.com/funds/
The opinions contained in this transcript are not intended to be a forecast of future events, or a guarantee of future
results, or investment advice. The statements made in this transcript are based on information available to the public,
and no representation is made with regard to their accuracy or completeness. An investor’s investment return and
principal value of an investment will fluctuate, so that an investor’s shares, when redeemed, may be worth more or less
than their original cost.
Current performance may be higher or lower than the performance data quoted. The views expressed herein may
change at any time subsequent to the date of issue hereof. This transcript is neither an offer nor a solicitation to buy or
sell securities.
All expressions or opinions reflect the opinions of the presenter at the time they were made and are subject to change.
Kinetics and its affiliates may have positions in the securities of companies mentioned. Reproduction is strictly
prohibited. As always, past performance does not guarantee future results. You will be charged a redemption fee equal
to 2.00% of the net amount of the redemption if you redeem or exchange your shares less than 30 days after you
purchase them. As most are non-diversified Funds, the value of the Funds' shares may fluctuate more than shares
invested in a broader range of companies. Non-investment grade debt securities, i.e., junk bonds, are subject to greater
credit risk, price volatility and risk of loss than investment grade securities.
Options contain special risks, including the imperfect correlation between the value of the option and the value of the
underlying asset. In addition, investing in foreign securities involves more risk than does investing in U.S. investments,
including the risk of currency fluctuations, political and economic instability, and differences in financial reporting
standards. There may also be heightened risks investing in non-investment grade debt securities and the use of options.
Also, there are risks associated with investing in small and medium size companies. Unlike other investment companies
that directly acquire and manage their own portfolios of securities, the Funds pursue their investment objectives by
investing all of their investable assets in a corresponding portfolio series of Kinetics Portfolio Trust.
Index & Benchmark Definitions:
The S&P 500 Index represents an unmanaged, broad-based basket of stocks. It is typically used as a proxy for overall
market performance. The Russell 2000 Index measures the performance of the small-cap segment of the U.S. equity
universe. The iShares MSCI ACWI Index seeks to measure the performance of both the MSCI World Index and MSCI
Emerging Markets Index. The iShares EAFE Index measures international equity performance across large and mid-
cap equities across developed markets in Europe, Australasia and the Far East, excluding the U.S. and Canada. The
Barclays 1-3 U.S. Credit Bond Index is composed of investment grade U.S. credit securities with a maturity between
one and three years. The Barclays U.S. Aggregate Bond Index is composed of the Barclays U.S.
Government/Corporate Bond Index, Mortgage-Backed Securities Index, and Asset-Backed Securities Index, and
includes securities that are of investment grade quality or better, have at least one year to maturity, and have an outstanding par value of at least $100 million. An investor cannot invest directly in an index.
2
James Davolos: Happy New Year and thank you to everyone for joining us for the Fourth Quarter
2016 Kinetics Mutual Funds Conference Call. I will be giving the opening remarks today, as Chris Bell,
our national sales manager, is under the weather. But he and his team are available as always for any
follow-ups or additional information.
We’ll start the call today with a brief review of the performance of our funds and their respective
benchmarks. I would imagine that everybody on this call knows that we manage agnostic to any
benchmarks, but we will provide them for context. Then, we will make some brief comments and add a
little bit of additional context regarding the performance in the most recent two months or so.
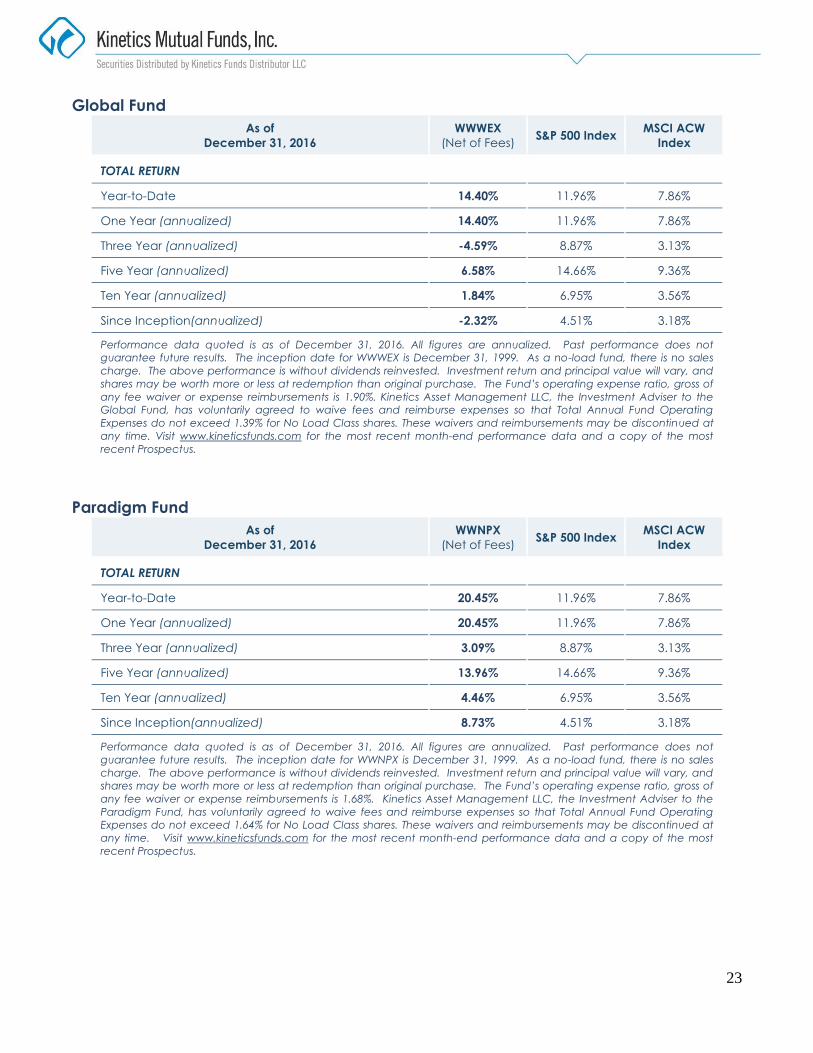
The Paradigm Fund (no-load shares) ended up the year just short of 20.5%, relative to the S&P 500,
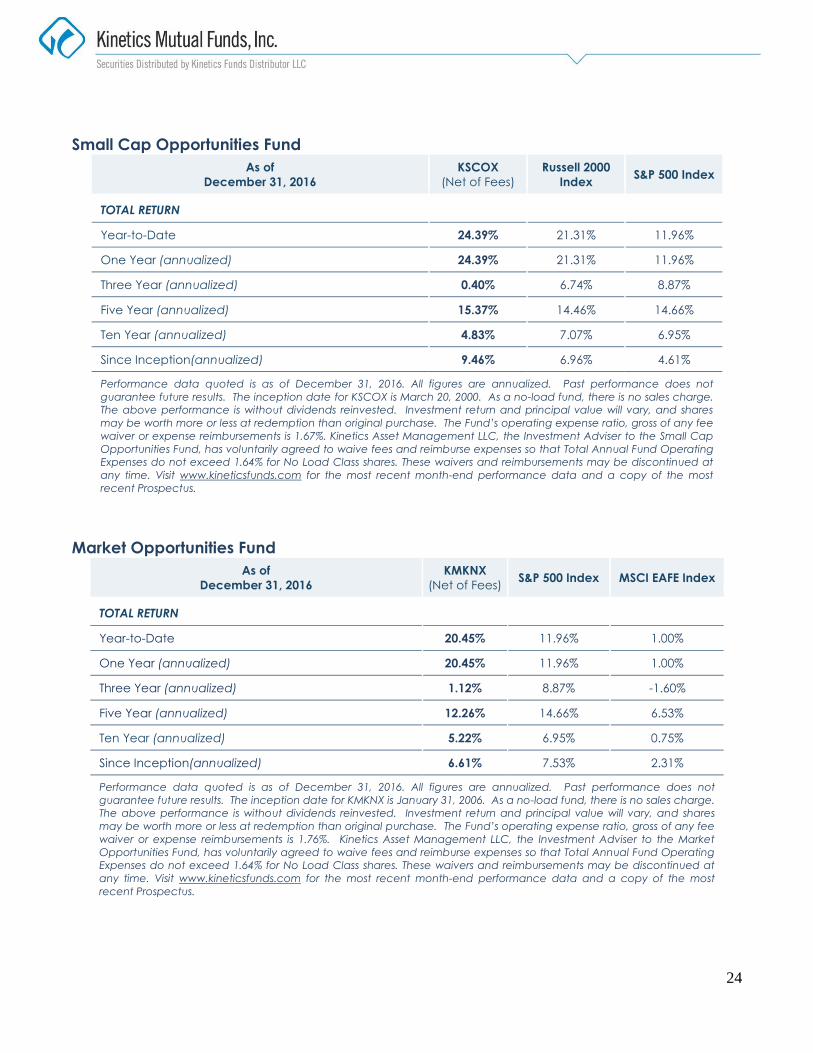
which returned just shy of 12%. The Small Cap Opportunities Fund returned 24.39%, relative to the
Russell 2000 Index’s returning 21.31%. The Market Opportunities Fund returned 20.45%, again,
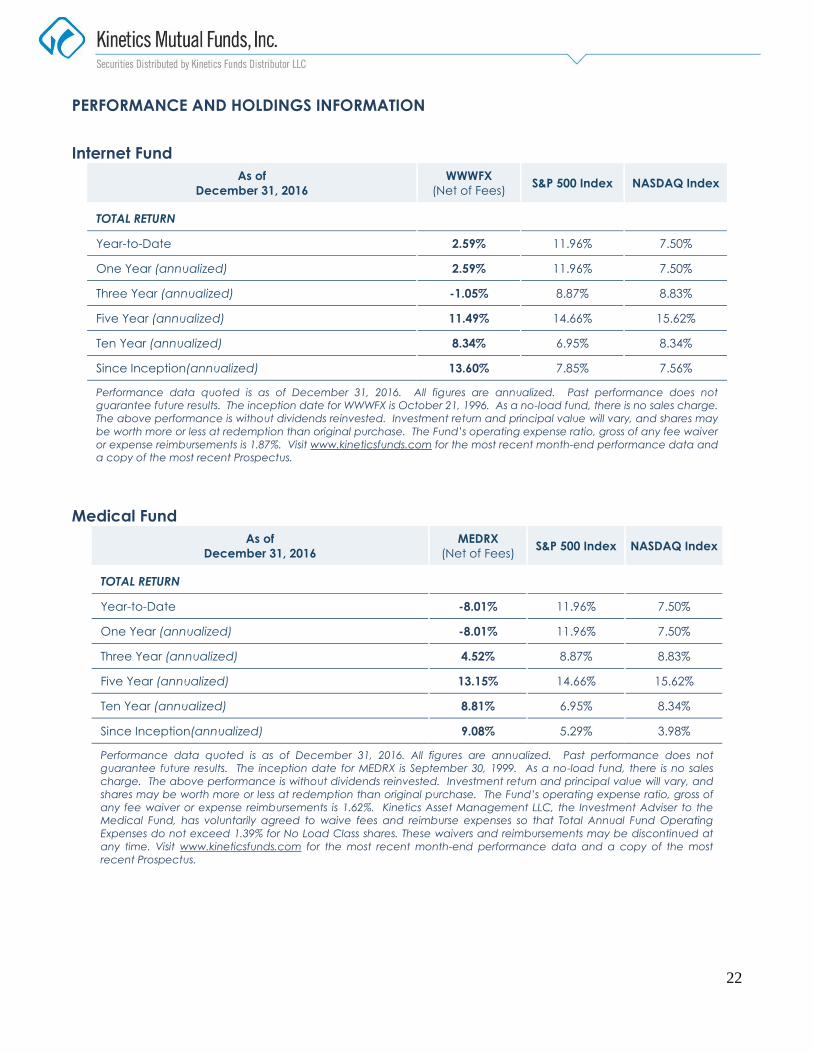
relative to the S&P 500 being just shy of 12%. The Internet Fund returned 2.6%, relative to 7.5% for the
NASDAQ Composite. The Global Fund returned 14.4%, compared to 7.86% for the MSCI All-Country
World Index. And our last equity fund, the Medical Fund, declined 8% for the year relative to 2.8% for
the S&P Healthcare Index. But I would like to break that down and just say that the S&P Pharma Sector
was down closer to 12% and the S&P Biotech Sector was down over 21.5%.
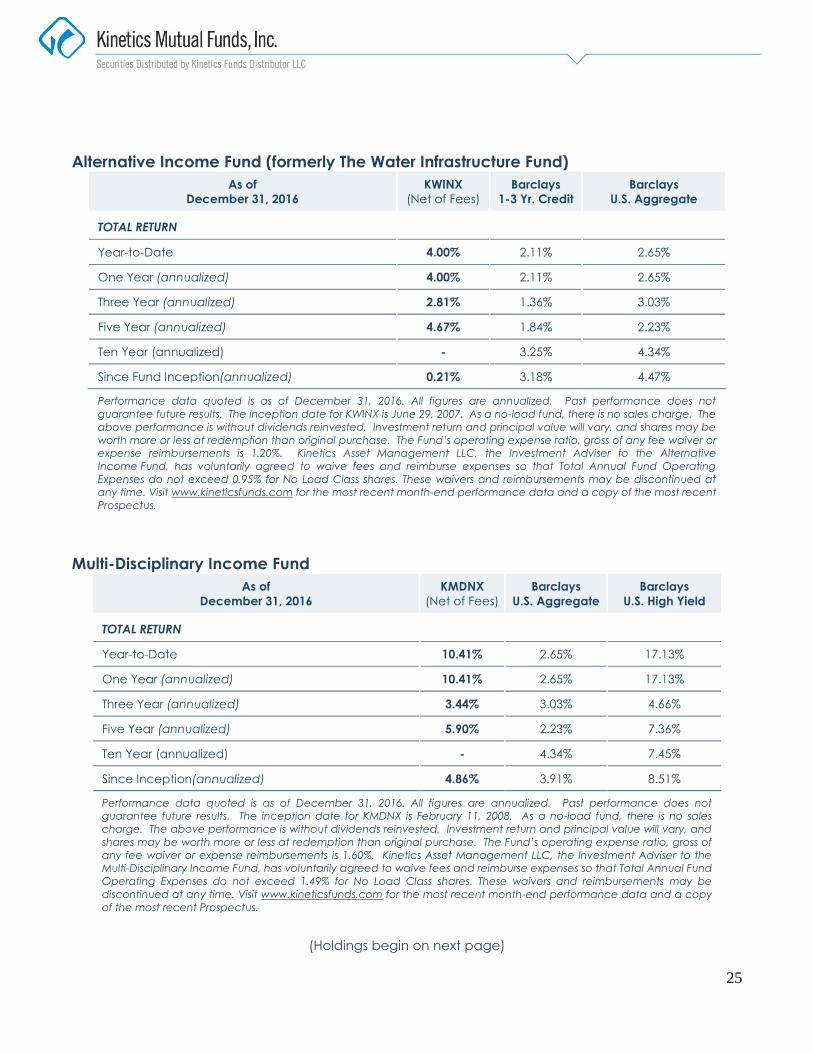
Moving on to our income-oriented funds, the Kinetics Multi-Disciplinary Income Fund returned
10.41%. That’s relative to 2.66% for the Bloomberg Barclays US Aggregate Bond Index and an average
yield on the 10-year Treasury of 1.84%, and then about 17.13% for the Bloomberg Barclays US Corp.
High Yield Index. Similarly, the Alternative Income Fund generated 4%, again compared to 2.66% for
the Barclays Agg and 1.84% average yield for the U.S. 10-year Treasury.
I would like to make two quick comments about performance, and Peter will follow up on this. All of
the funds have a pretty significant cash position. This is simply reflective of the opportunity set, but also
of our desire to have protection and the ammunition to allocate that capital should prices become more
favorable. So, just to give you a brief rundown, the Paradigm Fund was approximately 20% cash at year-
3
end, Small Cap approximately 10%, Market Opportunities approximately 25%, the Internet Fund
approximately 40%, and the Global Fund approximately 42%.
Similarly, the Multi-Disciplinary Income Fund was approximately 10% cash, but we’ll talk about the put
exposure in that fund in just a moment, which was virtually nil throughout the year. And Alternative
Income was approximately 52% cash, again, wanting to be positioned very conservatively, consistent
with the very low implied volatility on put options.
One last comment on performance before I turn it over to Peter is that, impressive as our one-year
returns may be, the returns were actually much better on a relative basis going into November 8. And
since November 9, there’s been a very aggressive rally in risk assets. Whether we agree with that or not
is not really the point, but you’ve seen small-cap stocks return 14% since the election results through the
end of the year, compared to 5% for the S&P 500. Ostensibly, the biggest beneficiaries of the election—
again, none of this has been proven, and this is purely conjecture and speculation,—in our belief have
been financials, where the financial sector has rallied nearly 17%. In the coming months, I think we’re
going to have to see a lot of proof of concept for these gains to be held. But we remain conservatively
positioned and did not participate fully in this rally.
I’ll have some comments on specific fund holdings of specific funds later in the call. But, for now, I’m
going to turn it over to Peter Doyle.
Peter Doyle: Thank you, James. Over the years, we have spoken a lot about the development of the
ETF industry and the effects of that industry and the growth of that industry on the pricing of assets, and
what we’d consider to be the distortion of pricing of assets. From the standpoint of an investor, I would
want to know about a few things:
1) James pointed out the high cash position in our funds, which really is a function of us being bottom-
up, fundamental investors. As we go through the landscape of opportunities out there, we are finding it
increasingly difficult to find companies that have an attractive risk profile that would provide us with an
expected return that would be acceptable to us. We have to get approval from our board of directors on a
quarterly basis, and we tell them that right now, based on that bottom-up analysis, we are very much in a
defensive position. That is not a prediction about what’s going to happen in the stock market. It is just
4
that we’re not finding the risk profile we desire, and we’re just not choosing to risk our capital or our
customers’ capital at this time.
2) The next big question I guess most people would have, looking at our funds, is about the high
concentration. Much of the outperformance that we had in 2016 is attributable to one stock: Texas
Pacific Land Trust (“Texas Pacific”, “TPL”), which is an oil and gas company, but it’s more of a royalty
company. They really don’t do any drilling. They merely get paid for people having wells on their
property, easements that they might get, grazing rights for people that want to graze cattle, and some
other revenue streams. James is going to delve a little bit further into the specifics of that company as we
go on in the call.
That stock was up very substantially, and it’s caused some concern, as the weighting now is in excess of
20% in many of our funds. Therefore, the question is: are we properly assessing our risk? And could
something happen to that stock? I don’t think people really question our analytical ability, but they’re
saying that, if this stock got cut in half, it could really have an impact on our performance.
But, when we look at the risk profile and the optionality of that particular investment, it is so compelling
that we’re comfortable here. And if we look at the long-term track records of the best names, the
legendary names within the financial services sector, particularly the mutual fund sector, most of those
investors share very similar characteristics. One of which is that they have low turnover. As a result of
that low turnover, they actually have high concentrations. Their best names tend to rise to the top. This
is a stock that we first wrote about in 1995. Texas Pacific Land Trust was Horizon Research’s first
research report. And we’ve held it since then in various accounts. However, the founders of the Firm
have actually known the stock and have been invested in it since the early 1980s. And the opportunity
set in the company today is probably more attractive to us than it was when we first learned of the
company, even though the price has risen dramatically.
The second thing is that, if these legendary investors are low-turnover, higher-concentration, they have
to accept the resulting volatility. There is price risk in Texas Pacific Land Trust, but there is no real
financial risk in our view. The company sits on a pile of cash and has no debt. Hence, this company is
not going out of business due to lack of liquidity. And even if the price of oil goes lower than it is today,
the royalty interest stream from that doesn’t really get impacted very much. Many of the companies that
5
are asking to drill on their property are actually making very attractive returns, even with the price of oil
in the $40 range.
I’m going to contrast that to two very recognizable names that we could in theory diversify into by
cutting our position in Texas Pacific Land Trust: Chevron and ExxonMobil. Chevron has a market
capitalization of $358 billion. Compare this to about $2.5 billion for Texas Pacific Land Trust.
Chevron’s trailing 12 months’ earnings were actually $(0.81). It has a dividend yield of 3.71%. That
dividend is really the crux of why it trades where it does, because, based on its fundamentals, you’re
really making a very significant bet about the price of oil by investing in Chevron.
If you look at the revenues of Chevron over the last several years, in 2013, $220 billion; in 2014, $200
billion; in 2015, $130 billion; obviously being affected by the declining price of oil. Trailing 12 months:
$108 billion. It’s not exactly a robust top line. Long-term debt during that period of time went from $20
billion in 2013 to $39 billion today. Net income over that course of time fell from $21 billion to $(1.5)
billion in the most recent trailing 12 months.
Accordingly, here you have a company that really cannot afford to pay its dividend, and, if the price of
oil does not stay above $55-60 a barrel, they’re going to really struggle and they’re going to have to cut
their dividend. And you would have real erosion of capital as a result of that. Thus, anyone that’s
invested in Chevron, which is quite a few people, given its market capitalization, and quite a few ETFs,
is really making a bet on the price of oil. And that’s not a bet that we care to make.
Second company: ExxonMobil, similar trends, only slightly better. Revenues in the year 2012: $480
billion. Revenues in 2013: $438 billion. 2014: $411 billion. With the decline in the price of oil, $269
billion in 2015, not radically different for the trailing 12 months ending December 31 of 2016. Long-
term debt over that period of time went from $11.6 billion to $26 billion. It also has a yield of 3.47%,
making it a very attractive fixed income alternative for investors. The stock trades currently at a P/E
multiple of 40.3x. You’re looking at a company that has a market capitalization of $360 billion. If the
price of oil does not remain above $50 a barrel, they cannot maintain their dividend. Their investors are
taking on a tremendous financial risk.
6
No one is telling us to go into those names, by any stretch of the imagination. I’m just saying, from an
appearance standpoint, we could actually take two-thirds of our money out of TPL and move it into
those names, and it would satisfy most of the diversification issues that anyone might have. And that’s
just something we’re not going to do.
Consider the corresponding statistics for Texas Pacific Land Trust—the scale, obviously, is far, far less
in terms of the size of the company. But the trends are much more attractive. 12-month revenue in 2013:
$44 million. 2014: $55 million. 2015: close to $80 million. Trailing 12 months: $57 million. Again,
that’s a reflection of the decline in oil prices. But by no stretch of the imagination is it anywhere near
approaching a problem in terms of making their dividend. They have no long-term debt, as I pointed out
earlier.
More recently—and I’m going to let James discuss this—there have actually been many transactions
going on in the Delaware Basin. And, based on those transactions, just the oil value of TPL probably can
justify a price twice what it is today. So, again, if we look at the risk profile and the optionality of TPL;
they have many more diverse ways of getting revenue into the company other than oil revenue royalties.
And we think it’s just an attractive play and is something that, even though it’s a large position, it’s
likely to remain a high weight.
Back to the driving engine of stocks, you know that the stocks are driven by, essentially, three things:
the P/E multiple, the earnings, and the dividends. Right now, the trailing 12-month P/E on the S&P
500—and this falls into line with why we’re not finding opportunities from a bottoms-up basis—trailing
12-month P/E is 25x. The Schiller cyclically-adjusted P/E multiple is closer to 29x earnings. The last
time it hit that level was in 2007. And the other time that it hit close to that level was in early 2000,
when you had the tech bubble.
Accordingly, there are some danger points. I’m not saying that the market is going to roll over; I don’t
think that’s going to happen unless interest rates really rise dramatically. Clearly, the Fed is
contemplating raising rates several times more in 2017. We’re saying it’s a time to be defensive, based
on our bottom-up, fundamental analysis. The names that we have in our funds really do have, in our
opinion, a low risk of the permanent loss of capital, which is important to us.
7
With that, I’m going to stop and turn it back over to James, who will discuss a couple of the bigger
names in the portfolio.
James Davolos: Thanks, Peter. I’m going to start off with a broader view, just to remind people
how we look at the world of investing; I will then go through some of our bigger equity names, and will
wrap up with some points on the income-oriented funds. But, going back a decade or two, which
coincided with the founding years of Horizon Kinetics and the beginning of our track record, people
wanted to look at the world in terms of asset allocation mixes. That type of strategy is actually getting
even more and more popular, with people having tactical allocations to gain exposure to asset classes
that nobody even thought of a decade ago.
But let’s just go back to what was considered the conservative retirement allocation mix of a 60/40
equity and fixed income mix. Historically, if you had higher interest rates, it meant that the economy
was doing well, stocks should be doing well, and bonds were going to go down, and vice-versa. Thus, in
any environment, you would do well with that sort of allocation. The problem is, right now, stocks and
bonds are buoyed to incredibly low future returns and high valuations based on the same variable that
this 60/40 mix is supposed to dilute. Consequently, if you stress test your asset allocation model for
what would happen if rates were to move another 100 basis points in a portfolio where you have eight
years of duration, and where you have been buying utilities and real estate companies and consumer
staples that everyone is valuing based off of a 3% dividend yield, you would be assuming that those
distributions were going to be sustained and grown into perpetuity. If you model a 100 basis point
interest rate increase for that portfolio, you’ll see big trouble; therefore, we’re not playing that game.
When people allocate capital using this academic framework, which I believe has a lot of limitations
when applied to the real world, they’re assuming that they have full exposure to each asset class. And
they do not—it simply does not make sense to do that at all times, because you need to preserve your
capital when it does not make sense to take risk with it. One of the biggest problems that people have is
that they say, “Well, what about my opportunity cost?” And, granted, that is a significant concern to
have, but the opportunity cost right now, in a risk-free asset, is taking seven-plus years of duration in a,
“risk-free” asset for 180 basis points of return. Given early projections of the Fed’s stated target of CPI1,
1 Consumer Price Index
8
you’re inflating those 180 basis points away to a zero to slightly negative real rate of return. So, what is
your actual opportunity cost?
In equities, there are pockets of opportunity, but we don’t think that the opportunity set justifies being
fully allocated. This is a very objective, real-world approach to asset allocation: instead of trying to look
at an academic framework that works in theory, but, 10% of the time when things are misaligned, ends
up really, really hurting investors.
With that said, we’re an opportunistic firm. We look for what the market gives us. And there are some
incredible opportunities right now, not just Texas Pacific Land Trust. I’ll touch on a few. But, obviously,
a lot of people have Texas Pacific on their mind. Peter mentioned some transactions. When you woke up
this morning, you would have seen that Clayton Williams was bought by Noble Energy for $3.2 billion.
Not a perfect comparison, but they have predominantly all of their acreage in Eastern Reeves County,
which is in the Delaware Basin. I encourage any skeptics or people who want to do their own work to
just do a cursory search of transactions for acreage in the Delaware Basin in the last six months.
These wells are in the Wolfcamp A formation. There happen to be three Bone Spring formations, three
Wolfcamp formations, as well as the Avalon Shale. This is the sweet spot, and this is providing the most
hydrocarbons at the lowest cost right now. But you’re looking at potentially one-sixth or 20% of the
resource in play.
Clayton Williams is doing wells where there they’re looking at 75 lateral feet. And, assuming $56 per
oil barrel and $3 per gallon of gas, which is using a strip based on the futures curve, they’re getting a
60% rate of return on these wells. They are forecasting 73-83% compound annual growth from 2016-
2020 in production in the Delaware Basin.
Now, how does all this relate to Texas Pacific? The vast majority of Texas Pacific’s land is right in the
middle of the Delaware Basin. But, I think more importantly, you can look at the purchase price paid of
$3.2 billion in the Clayton Williams/Noble deal versus 120,000 net acres. Now, you need to be careful
when you look at acreage; gross acres do not include royalty payments or other working interests.
Consequently, you take that on a net basis, and you come out with something in the vicinity, after
adjusting for working capital and production, of $30,000 per net acre.
9
This $30,000 price is for an operating lease, where these operators are going in, and then they’re
spending a minimum of $8 million just to drill vertically, and then they’re probably going to spend
another $10-20 million to drill laterally, for each lateral bore. They are taking a very, very high capital
outlay where they’re looking for, based on these numbers, well-level economics of 60%. And they’re
willing to pay $30,000 to lease this land. What would you be willing to pay if you were sitting there with
zero capital at work and you were just cashing checks, the way that Texas Pacific is as a royalty owner?
I’ll give you one more transaction, which was announced just after 9 a.m. this morning. There’s not a
ton of data. But ExxonMobil is spending $5.6 billion up front, and potentially another $1 billion in
contingent payments, to buy out the Bass family in Dallas, which has about 275,000 gross acres,
primarily in the Delaware and Midland Basins, stretching actually up into New Mexico at certain points.
We don’t know the precise location and we don’t know what the royalty burden on the 275,000 acres is.
But, assuming it’s between 20-25% royalties, again, you’re getting the $30,000 an acre for a lease hold,
$30,000 for the right to sit there and spend $30 million to put a hole in the ground speculatively
(although I’d argue not speculatively).Again, you can make your own assumptions about what a royalty
acre is worth. But the only real comparison—and, again, there’s a limitation here as well—is a company
in the Midland Basin, which is the eastern portion of the Permian Basin, called Viper Energy. They have
royalty interests, Spanish Trail is where most of their production is, related to Diamondback Energy.
We’re looking at estimated recoveries from wells in the Delaware, and they’re a heck of a lot more
attractive. And there’s lower lifting costs, which is obviously somewhat helped by the oil field service
cost coming down. Regardless, I would argue Delaware wells are showing better results with a lot less
research right off the bat than what you’re seeing in the Midland Basin. Again, I’m not going to do the
math for you, but you can look at what a royalty acre is trading for when you look at the enterprise value
of Viper, and then come back to TPL.
Peter justified a significantly higher share price using oil and gas royalties. Then you also have a
considerable surface acreage position, which has easement revenue relative to pipelines, exploration,
sundry income, and then also, the surface estate owns water rights in Texas. Many of these wells are
pulling a great deal of water out of the ground. Sometimes you have to put that water back into the
ground, but you’re paying the royalty owner, the surface owner, for both. Or, in a best-case scenario,
10
you can use that water for fracking fluid, again paying the surface owner and then paying them a sundry
for your tailings pond, which is basically just digging a huge reservoir for your fracking fluid.
Thus, potentially, the oil and gas royalties are less than half of the story here. Again, you’ve got eight
employees. You have 97% gross margins. Therefore, we think that there’s a lot of low-hanging fruit to
really optimize this business. But even if you don’t have to do anything in terms of optimizing the
business, look at Chevron’s, and then, here, Clayton Williams’s, 73-83% compound annual growth rate.
This would be approximately 80% a year for four years of growth in production. The research is going
to do itself based on the fundamentals at TPL, where nothing even has to change for the shares to
appreciate further.
In sum, that’s the crux of our conviction. And we really view this as a highly idiosyncratic investment,
which is extremely detached from the forces that are driving equity prices. I think that there are many
value-adds for investors, particularly higher net worth investors that don’t simply want a tactical ETF or
an ETF tracking the Russell 2000 Index or the S&P 500 Index. They’re going to demand more than
that. And this is the type of portfolio that really embraces those types of exposures and those types of
companies.
Just moving down the list, I’ll touch on these briefly. Howard Hughes Corp. (“Howard Hughes”) is one
we’ve talked about many times in our calls. We actually just did a property tour with our team of
analysts down at the South Street Seaport in Lower Manhattan. I believe that consensus estimates are
grossly below where net operating income is going to come out on this building, because the gross
leasable area doesn’t tell the whole story. They have rent participations, depending on the success of
their tenants. And they have a rooftop amphitheater, which is probably going to be one of the premier
concert venues in the country. And, on top of that, you have incredible sponsorship opportunities. I
believe—and the top investor and chairman has echoed this belief— longer-term, this property may
ultimately be worth more than the entire enterprise value of the company.
They’ve also done some really interesting bolt-on acquisitions in Columbia, Maryland, to which nobody
seems to be paying attention. Columbia is a really attractive, growing market area between Baltimore
and Washington, D.C. They’re going to have the largest condo presence and then they’re going to
control all of the retail and all of the mixed-use. This was considered a dead, dormant asset for years,
11
but now I think that a lot of progress has been made, and you can see a lot of visibility as to what
Columbia will ultimately become.
One other transaction, which was actually slightly south of there, is that they’ve bought an off-parcel
Macy’s, which was one of the boxes in the Alexandria Mall, which, again, was considered a dead mall.
But it’s in an incredible market area where you have Washington D.C. right across the river. Howard
Hughes is going to redevelop this, make it more of an open-air destination instead of it just being an in-
line, sterile, air-conditioned box.
Consequently, these investors are doing all the right things. I think that the math indicates a significantly
higher share price, regardless of where interest rates go, because you have the master planned
communities, which are basically land banks. If you want to put some sort of adjusted book value
multiple on the land banks—which, again, that book value is a 2009-2010 bankruptcy-level book
value—and then put a cap rate on what the operating properties are projected to do, again, you don’t
need any type of heroic effort or any type of great market movements in any of these real estate markets
for this to do incredibly well over the next decade. But they do not pay a dividend yet, and they have
two separate types of assets, where the market just doesn’t seem to appreciate what these entrepreneurs
are doing.
James Davolos: Okay, I’m going to turn it back to Peter.
Peter Doyle: Thanks, James. So, as James was touching on some of the names, it occurs to me that I
wanted to bring up something that people are probably going to start seeing, and it’s a little bit off the
beaten path, and especially since we hold ourselves out as being value-oriented, margin-of-safety type
investors: that’s the position that we have in Bitcoin.
For those who are following Bitcoin—and I think most people have only a vague understanding of it—
it’s really, potentially, in our opinion, the de facto or the go-to potential currency or store of value
that’s out there. And Bitcoin came into existence in early 2009. The way it works is that, over the
course of the next 123 years, they will issue roughly another 5 million Bitcoins, for a total of 21 million
Bitcoins. Accordingly, it’s essentially deflationary. Once that number is reached, 21 million, they’ll
12
never issue another one. Right now, there’s roughly 16 million outstanding. And it gives it a market
capitalization of roughly $13 billion.
If the world ever decided that Bitcoin was a better store of value than gold, or a comparable store of
value to gold, we should note that the entire market capitalization of gold is roughly $8 trillion. If
Bitcoin were ever to move up to that, you would make, from today’s level, roughly 615x your money.
Most people think in terms of a downside of 50%, and maybe we’ll have the opportunity to make 2-3x
our money. We’re talking about, if it got to the same valuation as gold, and it potentially could go higher
than that, it would make 615x. Even if you assumed that there was a 90% chance of it going to zero—
and that’s not out of the realm of possibility—and only a 10% chance of that happening, you would
actually make 61x your money in the fund.
Most of our funds, our equity funds, with the exception of the Small-Cap, have a very small position in
that. And, if we’re right and it actually comes to fruition, it will have a meaningful impact on our
performance. And, if we’re wrong, it would really end up being a rounding error in terms of what it
would mean for the funds’ performance over time.
This is an example where the potential reward is so great that it’s worth the risk even if you’re almost
100% certain that it’s going to go, actually, to zero, which we do not believe. And, if you study it, as we
have over the last year, it seems to us that it’s actually becoming more permanent in terms of its uses.
And people are starting to wake up to its potential.
With that being said, I just want people to be cognizant of that information if you see it. And, back to
you, James.
James Davolos: Thanks, Peter. You know, on that note, I think I’ll go in one more direction with
our equity exposure: instead of really playing this game of just going with the flow, with index flows
and interest rates and the market grinding higher with fund flows, there is a considerable portion of our
portfolio that is intended to do very well in an adverse market. And not necessarily an adverse market
where you’re talking 2008 or 2000; we think it’s probably equally likely or more likely that it’s just
going to be negative or zero real rates of return in the broader equity markets for a prolonged period of
time, given where fundamentals stand relative to valuations.
13
But if you look at a scattering of our holdings, from Fairfax Financial to Franco-Nevada to Silver
Wheaton to Icahn Enterprises, all of these positions have been fighting the headwinds of these artificial
variables that have been inflating asset prices, not the least of which have been Fed-directed. But the Fed
is changing course. These companies stand to do extremely well in any scenario other than the current ,
grind-higher scenario. And we can go through the fundamentals of each one and how they’re very
different from a conventional exposure, but I think that they also stand to be a very considerable part of
any complete equity portfolio.
In the interest of time, I’ll turn over to the Multi-Disciplinary Income Fund. As of the end of the year,
the bond portfolio was about 90% of the Fund. 10% was in Cash, and there was virtually zero exposure
in put options. And just to give you a number—and I’ll tie this to Bitcoin in a moment—if you were to
write a put at-the-money in the S&P 500 out to December of 2017, with the CBOE Volatility Index
(“VIX”) at 12, which is eight points below its long-term average, you would take in $14 of premium for
a $226 strike. This equates to a 6.2% yield and a 15% implied volatility.
Even looking at some of the temporary market disruptions over the past three years, we’ve seen that
6.2% can be ripped through in very, very short order. I’ll remind you, almost a year ago to the day, we
saw oil and gas prices plummeting. And I think the Russell 2000 started off last year with a 15% or 17%
drawdown, before rallying back and finishing the year up over 20%.
Now let’s compare this to a conventional hedge, where you’re spending 600 basis points a year if you
wanted to protect your entire portfolio with an at-the-money put. If you had had that exposure for the
last three or four years, you would have eroded a quarter of your capital, or more. In the Bitcoin
example, I think that there’s a much, much higher optionality in that hedge, and you would spend just 10
basis points. Thus, the dynamics are just incredibly different. In any case, it doesn’t necessarily make
sense to write puts, but we are looking at different put exposures to supplement the income.
Assuming zero puts are written, the Fund has an estimated yield-to-worst of about 4.4% and a duration
of 2.89 years. The weighted average coupon is 4.91% and the average maturity is 3.2 years. That’s a
pretty impressive yield of over 4.4% for a duration of 2.89 years. And I’d note that this is not an
aggressive high yield portfolio. I mean, granted, this is technically high yield. But 45% of the portfolio
14
is rated between BB-plus and BB-minus. And the top position in the Fund, which represents about 7%
of the bond portfolio, is actually an A-minus rated bond, with 1.5 years of duration and a yield-to-worst
of 5%.
We think this is an incredibly opportunistic fund. And we think that, worst-case scenario, the credit is
rock-solid. You might have some volatility, but, even assuming no puts, you’re annualizing at 4.4% for
the better part of three years. And if volatility blows out, then we can write puts and supplement that,
doubling that or even tripling that, in the right environment. Accordingly, I believe that this is really
great positioning. And it also happens to be a wonderful time to explore this Fund as an allocation.
Just to compare this to other alternatives, the Barclays High Yield Index has about 4.1 years duration,
which is 1.2 years more than the Multi-Disciplinary Income Fund, and you’re getting about a 6.6%
yield. But 40% of those bonds are in single-B-rated issues and 15% are in CCCs. Hence, you’re taking a
lot more risk, both in terms of credit quality but also in duration (i.e., interest rate sensitivity). Then
again, if you want to look at something more conservative, the Bloomberg Barclays Aggregate US Bond
Index has 5.7 years duration, almost twice as much duration, and you’re only getting a 2% yield.
Therefore, you’re going very short-term, very safe with respect to credit risk, because you’re in mostly
AAA bonds, but you’re taking a ton of interest rate risk.
Consequently, the Multi=Disciplinary Income Fund really fits into that sweet spot. And, all else equal,
we believe that you’re going to end up having a very good investment experience. But I think that
there’s going to be a really attractive opportunity to supplement that with some put writing, should
volatility come to something a little bit more reflective of what we think the market should be pricing.
Peter Doyle: And some of that opportunity in the Multi-Disciplinary Income Fund is really a function
of the ETF bond funds having to scale out of bonds prematurely to keep a fixed maturity. And Murray
has been taking advantage of that. Accordingly, there’s a real inefficiency as a result of these passive
strategies in fixed income that you can take advantage of, as James pointed out.
With that, we’ll ask the Operator if there are any questions out there, and we’ll open it up to questions.
15
Questioner 1: Hey, quick question: do you have any color on Icahn? You just mentioned it briefly in
your last few words. What do you see as the catalyst for Icahn going forward? It’s had a nice run here in
the past month and a half or so.
James Davolos: Last week, or in the past two weeks, he’s actually been tendering to knock out
some of his bonds and extend some maturity, and then he also did a rights offering. Thus, he’s gearing
up to put some capital to work. And he actually also just sold his railcar leasing business late last year.
This is not the American Railcar Enterprises business; it’s ARL, which is a subset, which he rolled into
Icahn Enterprises LP (“IEP”). But, using all these different variables, you’re having $2.5 billion come in
the door from ARL, and then you’re having bond maturities, which are actually upside by $250 million,
and then the rights issuance. You’ve got an investor who has been struggling against what I would
personally call myopic regulation under the previous administration, who’s now gearing up with a war
chest of capital to go to work where these businesses can actually go out and make money, and not be
worried about red tape.
Peter Doyle: He’s also been appointed by the President-Elect to be special advisor on the business
regulations that’s going on in the country. Therefore, if he thinks there’s silly regulations that’s hurting
his businesses, that’s going to be pointed out pretty quickly, in our opinion.
James Davolos: Then, just to bring it all together, you have what’s right now about a 10%
dividend yield on the partnership units. I would argue that, with all of these liquidity measures, that
dividend is rock-solid for the foreseeable future. Last time he disclosed his investment exposure, he had
a very considerable short exposure, hedging out a lot of these excesses that we see in the market. If you
roll all that together with this new pool of capital for him to deploy, I believe that it’s probably a really
great time to allocate to Icahn Enterprises.
Bob Uly: Hi, Peter. Hi, James. I had a question from one of our analysts who’s up in an airplane
right now: your thoughts on CBOE, going forward?
Peter Doyle: You know, just a great business, and something that we’ve been involved with from its
inception. They own the biggest products, and they have a monopolistic position on them. And those
16
products continue to trade and continue to grow. From what I understand, CBOE is likely to be one of
the first to bring out a futures contract on Bitcoin. If they’re successful in that, there is potential for them
to have a monopolistic position on it, which we think has great promise.
It isn’t cheap. It would likely be acquired by a larger entity, if it were a little less expensive. But it’s not
cheap because it actually has very proprietary and very high-margin businesses. And it continues to
grow.
James Davolos: That actually reminds me of some of my earlier remarks about being somewhat
opportunistic in how you allocate capital, where I think everyone that considers themselves a value
investor, and even some people that skew more towards the growth side, they would like to act like they
are sitting in Omaha with Warren and Charlie, and buying into great businesses at good prices that can
reinvest cash flow at double-digit rates of return. And, you buy 15-20 of those companies, and then you
can just relax and let those compound, and you end up being a multibillionaire.
But the number-one variable in that type of practice is purchase price. CBOE fits all of the criteria, and
historically has fit the criteria, for purchase price. But I think that there’s a lot of good priced into the
expectations, whether it’s interest rate–driven or driven by the success of the company’s proprietary
products. But it’s highly recurring cash flow, and they have a lot of ability to reinvest that into high
returns on invested capital opportunities. Thus, this is one of those case studies and a phenomenal
business that, at the right price, you can just set it and forget it, but there are fewer and fewer of those in
this market.
Questioner 3: Good morning, everyone. I’ve been with Southeastern Asset Management from the mid-
’70s, and we’re roughly 25% in cash, and we always talk about what is the wild card; what keeps you up
at night; what would worry you that maybe hasn’t been discussed today. With your assets under
management, what is it, when you get together in a groupthink and say, “What is the market not thinking
of? What keeps me up at night?” What would your response be?
Peter Doyle: Well, with respect to the broader market, we’re pretty defensive. One of the reasons is
that we’re just not finding opportunities. And that keeps us up, because we’re continually searching for
new opportunities.
17
I would say, if there had to be a target on the back in the marketplace right now, I would certainly be
looking at the drug companies. If the Republicans are successful in repealing Obamacare and coming in
with a new plan that’s going to lower the copays and lower the annual expenses for insurance, health
insurance, they’re going to get that money from drug companies. And the new administration has stated
as much, and I have a feeling that they are serious about it. Therefore, if I were one of the drug
companies today, I would be very, very nervous.
There are a lot of things that we see out there—we look at ExxonMobil or Chevron and the companies
that we pointed out earlier, and there’s a tremendous amount of financial risk, not just volatility. How
that plays out, I don’t know. Is it a slow bleed and you just get a very low-level, slightly negative rate of
return for a long period of time? Or do interest rates spike up and there’s a shock to the system that
causes it to come down very hard? I guess that would probably be the biggest concern for me. Do you
have anything?
James Davolos: Yes. I follow Mason Hawkins very closely, and Southeastern, and both the Small-
Cap Fund and Longleaf Partners had exceptional years with all that cash, as did we. Accordingly, I think
that the tide is turning in the favor of allocators of our ilk. But what really keeps me up at night? Being
a fundamental investor, I try to reconcile what the market is pricing in with some of the other variables,
some of which happen to be top-down. And, post-election, people are pricing in very robust growth and
a vastly reinvigorated economy, which obviously translates into higher earnings. But a lot of the policies
that will, “stimulate growth” will have the short-term impact of dramatically decreasing the quality of
the credit profile of the United States of America.
And now that our debt burden, just federal debt, not including entitlements, states, and municipalities, is
over 100% of GDP, you’re playing around with something where a very slight misstep can have
profound implications. And if you want to just do the math on what’s an extra 50 bps or 100 bps on a
10-year Treasury Bond, when your debt service is already in the hundreds of billions, you can see that
this needs to be taken extremely seriously. And the market doesn’t seem to be taking it seriously
whatsoever.
18
Hence, as much as people want to talk about animal spirits, reconcile to the cold, hard facts right there.
And that certainly does not translate into a VIX at 12 or currencies trading where they’re trading and
sovereign bonds trading where they’re trading.
Questioner 3: That’s an excellent answer, very much like Francois Trahan over at Cornerstone has the
same kind of risk parameters, credit quality. Good answer. Thank you.
Questioner 4: Hey, good morning. I was wondering if you can comment on Bitcoin. Bitcoin is often
described as an anonymous currency, and it seems like some of the issues in the news right now, coming
out of China but also here in the U.S., could probably put that feature at risk. Can you comment about
that and the long-term value of Bitcoin if that feature has to be reduced or removed?
Peter Doyle: Sure. Two things about that: 1) don’t believe everything you read in the press, and 2) it’s
not an anonymous currency. There’s an address to it. It’s a harder-to-track currency, but it’s not an
anonymous currency. Therefore, if you open up a digital wallet today, you’re going to be required to fill
out a form and link a bank account or a credit card; they know who you are.
With regard to China, and I’ve read the same reports that you’re referring to, where they have allegedly
98% of the volume going on in China. If people actually tried to reconcile what’s being reported coming
out of the exchanges in China versus what actually goes on in the Blockchain, it’s impossible to do. The
reported volume in China is actually fictitious volume. And they may be, “trading” it, but they’re not
really trading it, and it’s not going on the Blockchain. You can go to Blockchain.info, and you can see
every transaction that occurs in a 10-minute block, and you cannot reconcile what they’re reporting
versus what’s actually on the true Blockchain.
The reason China has cracked down on it is that people are “using those exchanges” to take money out
of China, because they devalued their currency six times in the year 2016. And that’s one of the strong
points of it; people saying: “I don’t trust my government. Let me move my assets into something that I
at least trust.” And this is one way to get money out of the country. And they’re doing it in ways that
probably make the Chinese government upset. But it’s not actually really, truly related to the true
Blockchain and Bitcoin.
19
James Davolos: Just to add to that, the entire global population, with the exception of the United
States of America, has been dramatically devalued in their savings through fiat currencies at one point or
another in history. And people are getting very fed up with that, and they want a store of value other
than a piece of paper that a policymaker in an ivory tower can devalue and, thereby, cripple your 30
years of savings. Hence, we don’t know if you’re ever going to go to Starbucks and use a Bitcoin, but
that doesn’t necessarily control the outcome.
There are extremely practical applications for Blockchain. And these applications are only feasible to
the extent that the Blockchain ecosystem is large enough to handle something akin to a MasterCard or a
Visa, or, if you want to go even bigger, look at Depository Trust Company, both of which are highly
overpriced and highly inefficient. It still takes three days for me to buy a stock for a client and to settle
in his or her account. Visa and MasterCard and their partners are taking 3% off the top of swipes.
Blockchain can definitely make this more efficient and less expensive for the end consumer.
In conclusion, I think that there are three different ways to look at Bitcoin’s being viable: one is as a
store of value, which is incredibly attractive; two is the Blockchain itself, which is incredibly attractive;
and then the third outlier, which is what it was originally intended for and where you get all of the
negative press, is to actually be an anonymous currency for illicit activity. I don’t think it necessarily has
to be illicit. But the two real applications vastly outstrip anything related to a day-to-day transactional
currency.
Peter Doyle: I just want to add to that with a little more color on why it has, in our opinion, some
explosive upside potential. If you look at supply and demand for any asset, prices are set at the margin.
During the financial crisis, there were companies, including Texas Pacific Land that got down to $19.
Essentially, it worked out to be approximately $60 an acre at the time, I believe. And there were bonds
that were trading at 20 cents, 30 cents on the dollar that you knew were money-good, but nobody
actually had the capital, or most people didn’t have the capital or the willingness, to take the risk to put
up the money at that time. Prices were set based on supply and demand.
Bitcoin is the ultimate supply-and-demand. It has a very fixed number of coins that will ever be
outstanding. And the demand is actually growing exponentially. If you track the number of digital
20
wallets that are being opened on a daily basis, there’s something like 30,000 wallets that are being
opened on a daily basis. And they’re only issuing 1,800 coins a day. And that number is going to go
down in another four years to 900 a day, and then down after that. Accordingly, the demand is heating
up for it, and the supply is very fixed.
Even during the internet bubble, to which we had a ringside seat, there were companies that came out of
it that are well-known companies today. And, if you look at four of the top companies today, they have a
market capitalization of about $1.3 trillion—Google, Amazon, Netflix, and Facebook. All of that
“demand” could be concentrated behind Bitcoin. And, if the world wants to own, or just to accept it as
an asset class, a legitimate asset class, and shifts a very small amount of capital—we’re talking about 25
basis points of people’s portfolios on a global basis—there’s really not enough supply to handle that.
And the only mechanism to correct that is the price, and the price could go up just an incredible amount.
In conclusion, we’re not recommending that anybody run out and put 10% of their portfolio into it. But a
very small portion of your assets in this, in success mode, could actually have a very favorable outcome
for your total returns, looking out over an extended period of time. Therefore, I believe that the upside
potential is so enormous that you’d be foolish not to have some. I think it’s more imprudent not to own
it than it is to own it.
Questioner 4: Question for you on your recent 13G filing on Associated Capital, Gabelli’s
business: one, what do you think is Gabelli’s intent is with this business, and why did he spin it off
initially; and two, what do you think is the ultimate earnings power of the business?
James Davolos: Gabelli has a very long history of creating a lot of value in convoluted ways and
business combinations. And, Mario Gabelli saw the writing on the wall where he has three businesses.
He has his core, long-only asset management business, which value had been under threat, but he’s
maintained assets pretty well. His declining business is his research business, where it’s a sell-side-
oriented research and trading business. And then his up-and-coming business is a hedge fund business,
which is mostly risk arb, merger arb.
21
You take the risk arb business, which is running about $1.3 billion in AUM, and this is a full-fee and
incentive-fee business; therefore, you’re not getting the ETF pressure. And the performance has actually
been very, very strong relative to other risk arb indices and competitors. You have the research business,
which probably is break-even. But most importantly, when he did the spinoff, he transferred a very
considerable portion of cash, cash equivalents, stock in GAMCO, and then a unique pay-in-kind bond. I
think it’s a $250 million bond, which, if you look at the balance sheet, is actually a deduction out of
shareholders equity because it’s a pick bond. But this is an obligation of GAMCO to Associated Capital.
If you reverse that, you’re buying Associated Capital at its current price at about a 20% discount to
liquidation value.
You could argue that the research business should have no multiple, but, in the event that rates move,
risk arbitrage is going to be a viable strategy again. You have a $1.3 billion business, which has done
well in a terrible environment and stands to do much better in a future environment.
With regard to the 13G, it was a closely-held stock where, obviously, GAMCO is very closely held. And
insiders held a lot of the float. And we were able to access some liquidity in one block, which is what
triggered the filing.
We believe that the book value already provides an attractive risk profile,, and then you have a call
option on a full-fee hedge fund business that seems to be at an inflection point.
Peter Doyle: Thank you all for listening. And if you have any further questions, you can reach out to
contact us directly, or you can go to the Kinetics’ website and get more information about our funds
there. Thank you.
22
PERFORMANCE AND HOLDINGS INFORMATION
Internet Fund
As of
December 31, 2016
WWWFX
(Net of Fees) S&P 500 Index NASDAQ Index
TOTAL RETURN
Year-to-Date 2.59% 11.96% 7.50%
One Year (annualized) 2.59% 11.96% 7.50%
Three Year (annualized) -1.05% 8.87% 8.83%
Five Year (annualized) 11.49% 14.66% 15.62%
Ten Year (annualized) 8.34% 6.95% 8.34%
Since Inception(annualized) 13.60% 7.85% 7.56%
Performance data quoted is as of December 31, 2016. All figures are annualized. Past performance does not
guarantee future results. The inception date for WWWFX is October 21, 1996. As a no-load fund, there is no sales charge.
The above performance is without dividends reinvested. Investment return and principal value will vary, and shares may
be worth more or less at redemption than original purchase. The Fund’s operating expense ratio, gross of any fee waiver
or expense reimbursements is 1.87%. Visit www.kineticsfunds.com for the most recent month-end performance data and
a copy of the most recent Prospectus.
Medical Fund
As of
December 31, 2016
MEDRX
(Net of Fees) S&P 500 Index NASDAQ Index
TOTAL RETURN
Year-to-Date -8.01% 11.96% 7.50%
One Year (annualized) -8.01% 11.96% 7.50%
Three Year (annualized) 4.52% 8.87% 8.83%
Five Year (annualized) 13.15% 14.66% 15.62%
Ten Year (annualized) 8.81% 6.95% 8.34%
Since Inception(annualized) 9.08% 5.29% 3.98%
Performance data quoted is as of December 31, 2016. All figures are annualized. Past performance does not
guarantee future results. The inception date for MEDRX is September 30, 1999. As a no-load fund, there is no sales
charge. The above performance is without dividends reinvested. Investment return and principal value will vary, and
shares may be worth more or less at redemption than original purchase. The Fund’s operating expense ratio, gross of
any fee waiver or expense reimbursements is 1.62%. Kinetics Asset Management LLC, the Investment Adviser to the
Medical Fund, has voluntarily agreed to waive fees and reimburse expenses so that Total Annual Fund Operating
Expenses do not exceed 1.39% for No Load Class shares. These waivers and reimbursements may be discontinued at
any time. Visit www.kineticsfunds.com for the most recent month-end performance data and a copy of the most
recent Prospectus.
23
Global Fund
As of
December 31, 2016
WWWEX
(Net of Fees) S&P 500 Index
MSCI ACW
Index
TOTAL RETURN
Year-to-Date 14.40% 11.96% 7.86%
One Year (annualized) 14.40% 11.96% 7.86%
Three Year (annualized) -4.59% 8.87% 3.13%
Five Year (annualized) 6.58% 14.66% 9.36%
Ten Year (annualized) 1.84% 6.95% 3.56%
Since Inception(annualized) -2.32% 4.51% 3.18%
Performance data quoted is as of December 31, 2016. All figures are annualized. Past performance does not
guarantee future results. The inception date for WWWEX is December 31, 1999. As a no-load fund, there is no sales
charge. The above performance is without dividends reinvested. Investment return and principal value will vary, and
shares may be worth more or less at redemption than original purchase. The Fund’s operating expense ratio, gross of
any fee waiver or expense reimbursements is 1.90%. Kinetics Asset Management LLC, the Investment Adviser to the
Global Fund, has voluntarily agreed to waive fees and reimburse expenses so that Total Annual Fund Operating
Expenses do not exceed 1.39% for No Load Class shares. These waivers and reimbursements may be discontinued at
any time. Visit www.kineticsfunds.com for the most recent month-end performance data and a copy of the most
recent Prospectus.
Paradigm Fund
As of
December 31, 2016
WWNPX
(Net of Fees) S&P 500 Index
MSCI ACW
Index
TOTAL RETURN
Year-to-Date 20.45% 11.96% 7.86%
One Year (annualized) 20.45% 11.96% 7.86%
Three Year (annualized) 3.09% 8.87% 3.13%
Five Year (annualized) 13.96% 14.66% 9.36%
Ten Year (annualized) 4.46% 6.95% 3.56%
Since Inception(annualized) 8.73% 4.51% 3.18%
Performance data quoted is as of December 31, 2016. All figures are annualized. Past performance does not
guarantee future results. The inception date for WWNPX is December 31, 1999. As a no-load fund, there is no sales
charge. The above performance is without dividends reinvested. Investment return and principal value will vary, and
shares may be worth more or less at redemption than original purchase. The Fund’s operating expense ratio, gross of
any fee waiver or expense reimbursements is 1.68%. Kinetics Asset Management LLC, the Investment Adviser to the
Paradigm Fund, has voluntarily agreed to waive fees and reimburse expenses so that Total Annual Fund Operating
Expenses do not exceed 1.64% for No Load Class shares. These waivers and reimbursements may be discontinued at
any time. Visit www.kineticsfunds.com for the most recent month-end performance data and a copy of the most
recent Prospectus.
24
Small Cap Opportunities Fund
As of
December 31, 2016
KSCOX
(Net of Fees)
Russell 2000
Index S&P 500 Index
TOTAL RETURN
Year-to-Date 24.39% 21.31% 11.96%
One Year (annualized) 24.39% 21.31% 11.96%
Three Year (annualized) 0.40% 6.74% 8.87%
Five Year (annualized) 15.37% 14.46% 14.66%
Ten Year (annualized) 4.83% 7.07% 6.95%
Since Inception(annualized) 9.46% 6.96% 4.61%
Performance data quoted is as of December 31, 2016. All figures are annualized. Past performance does not
guarantee future results. The inception date for KSCOX is March 20, 2000. As a no-load fund, there is no sales charge.
The above performance is without dividends reinvested. Investment return and principal value will vary, and shares
may be worth more or less at redemption than original purchase. The Fund’s operating expense ratio, gross of any fee
waiver or expense reimbursements is 1.67%. Kinetics Asset Management LLC, the Investment Adviser to the Small Cap
Opportunities Fund, has voluntarily agreed to waive fees and reimburse expenses so that Total Annual Fund Operating
Expenses do not exceed 1.64% for No Load Class shares. These waivers and reimbursements may be discontinued at
any time. Visit www.kineticsfunds.com for the most recent month-end performance data and a copy of the most
recent Prospectus.
Market Opportunities Fund
As of
December 31, 2016
KMKNX
(Net of Fees) S&P 500 Index MSCI EAFE Index
TOTAL RETURN
Year-to-Date 20.45% 11.96% 1.00%
One Year (annualized) 20.45% 11.96% 1.00%
Three Year (annualized) 1.12% 8.87% -1.60%
Five Year (annualized) 12.26% 14.66% 6.53%
Ten Year (annualized) 5.22% 6.95% 0.75%
Since Inception(annualized) 6.61% 7.53% 2.31%
Performance data quoted is as of December 31, 2016. All figures are annualized. Past performance does not
guarantee future results. The inception date for KMKNX is January 31, 2006. As a no-load fund, there is no sales charge.
The above performance is without dividends reinvested. Investment return and principal value will vary, and shares
may be worth more or less at redemption than original purchase. The Fund’s operating expense ratio, gross of any fee
waiver or expense reimbursements is 1.76%. Kinetics Asset Management LLC, the Investment Adviser to the Market
Opportunities Fund, has voluntarily agreed to waive fees and reimburse expenses so that Total Annual Fund Operating
Expenses do not exceed 1.64% for No Load Class shares. These waivers and reimbursements may be discontinued at
any time. Visit www.kineticsfunds.com for the most recent month-end performance data and a copy of the most
recent Prospectus.
25
Alternative Income Fund (formerly The Water Infrastructure Fund)
As of
December 31, 2016
KWINX
(Net of Fees)
Barclays
1-3 Yr. Credit
Barclays
U.S. Aggregate
TOTAL RETURN
Year-to-Date 4.00% 2.11% 2.65%
One Year (annualized) 4.00% 2.11% 2.65%
Three Year (annualized) 2.81% 1.36% 3.03%
Five Year (annualized) 4.67% 1.84% 2.23%
Ten Year (annualized) - 3.25% 4.34%
Since Fund Inception(annualized) 0.21% 3.18% 4.47%
Performance data quoted is as of December 31, 2016. All figures are annualized. Past performance does not
guarantee future results. The inception date for KWINX is June 29, 2007. As a no-load fund, there is no sales charge. The
above performance is without dividends reinvested. Investment return and principal value will vary, and shares may be
worth more or less at redemption than original purchase. The Fund’s operating expense ratio, gross of any fee waiver or
expense reimbursements is 1.20%. Kinetics Asset Management LLC, the Investment Adviser to the Alternative
Income Fund, has voluntarily agreed to waive fees and reimburse expenses so that Total Annual Fund Operating
Expenses do not exceed 0.95% for No Load Class shares. These waivers and reimbursements may be discontinued at
any time. Visit www.kineticsfunds.com for the most recent month-end performance data and a copy of the most recent
Prospectus.
Multi-Disciplinary Income Fund
As of
December 31, 2016
KMDNX
(Net of Fees)
Barclays
U.S. Aggregate
Barclays
U.S. High Yield
TOTAL RETURN
Year-to-Date 10.41% 2.65% 17.13%
One Year (annualized) 10.41% 2.65% 17.13%
Three Year (annualized) 3.44% 3.03% 4.66%
Five Year (annualized) 5.90% 2.23% 7.36%
Ten Year (annualized) - 4.34% 7.45%
Since Inception(annualized) 4.86% 3.91% 8.51%
Performance data quoted is as of December 31, 2016. All figures are annualized. Past performance does not
guarantee future results. The inception date for KMDNX is February 11, 2008. As a no-load fund, there is no sales
charge. The above performance is without dividends reinvested. Investment return and principal value will vary, and
shares may be worth more or less at redemption than original purchase. The Fund’s operating expense ratio, gross of
any fee waiver or expense reimbursements is 1.60%. Kinetics Asset Management LLC, the Investment Adviser to the
Multi-Disciplinary Income Fund, has voluntarily agreed to waive fees and reimburse expenses so that Total Annual Fund
Operating Expenses do not exceed 1.49% for No Load Class shares. These waivers and reimbursements may be
discontinued at any time. Visit www.kineticsfunds.com for the most recent month-end performance data and a copy
of the most recent Prospectus.
(Holdings begin on next page)
26
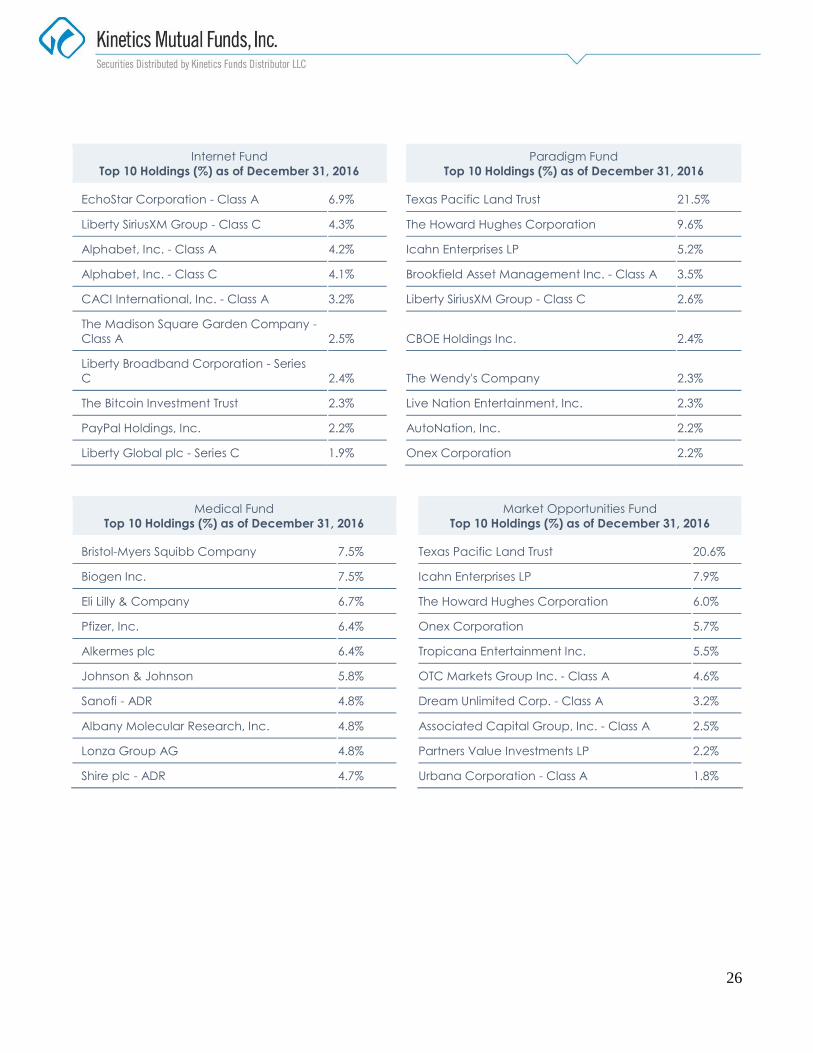
Internet Fund
Top 10 Holdings (%) as of December 31, 2016
Paradigm Fund
Top 10 Holdings (%) as of December 31, 2016
EchoStar Corporation - Class A 6.9% Texas Pacific Land Trust 21.5%
Liberty SiriusXM Group - Class C 4.3% The Howard Hughes Corporation 9.6%
Alphabet, Inc. - Class A 4.2% Icahn Enterprises LP 5.2%
Alphabet, Inc. - Class C 4.1% Brookfield Asset Management Inc. - Class A 3.5%
CACI International, Inc. - Class A 3.2% Liberty SiriusXM Group - Class C 2.6%
The Madison Square Garden Company -
Class A 2.5%
CBOE Holdings Inc. 2.4%
Liberty Broadband Corporation - Series
C 2.4%
The Wendy's Company 2.3%
The Bitcoin Investment Trust 2.3% Live Nation Entertainment, Inc. 2.3%
PayPal Holdings, Inc. 2.2% AutoNation, Inc. 2.2%
Liberty Global plc - Series C 1.9% Onex Corporation 2.2%
Medical Fund
Top 10 Holdings (%) as of December 31, 2016
Market Opportunities Fund
Top 10 Holdings (%) as of December 31, 2016
Bristol-Myers Squibb Company 7.5% Texas Pacific Land Trust 20.6%
Biogen Inc. 7.5% Icahn Enterprises LP 7.9%
Eli Lilly & Company 6.7% The Howard Hughes Corporation 6.0%
Pfizer, Inc. 6.4% Onex Corporation 5.7%
Alkermes plc 6.4% Tropicana Entertainment Inc. 5.5%
Johnson & Johnson 5.8% OTC Markets Group Inc. - Class A 4.6%
Sanofi - ADR 4.8% Dream Unlimited Corp. - Class A 3.2%
Albany Molecular Research, Inc. 4.8% Associated Capital Group, Inc. - Class A 2.5%
Lonza Group AG 4.8% Partners Value Investments LP 2.2%
Shire plc - ADR 4.7% Urbana Corporation - Class A 1.8%
27
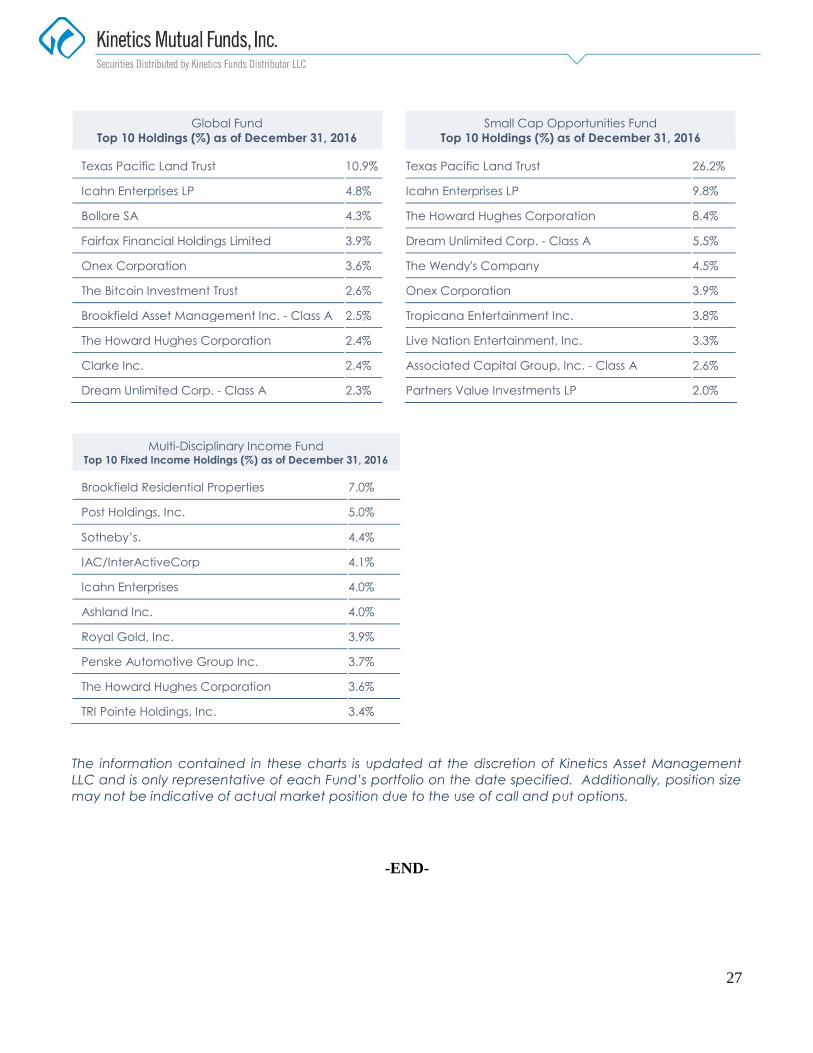
Global Fund
Top 10 Holdings (%) as of December 31, 2016
Small Cap Opportunities Fund
Top 10 Holdings (%) as of December 31, 2016
Texas Pacific Land Trust 10.9% Texas Pacific Land Trust 26.2%
Icahn Enterprises LP 4.8% Icahn Enterprises LP 9.8%
Bollore SA 4.3% The Howard Hughes Corporation 8.4%
Fairfax Financial Holdings Limited 3.9% Dream Unlimited Corp. - Class A 5.5%
Onex Corporation 3.6% The Wendy's Company 4.5%
The Bitcoin Investment Trust 2.6% Onex Corporation 3.9%
Brookfield Asset Management Inc. - Class A 2.5% Tropicana Entertainment Inc. 3.8%
The Howard Hughes Corporation 2.4% Live Nation Entertainment, Inc. 3.3%
Clarke Inc. 2.4% Associated Capital Group, Inc. - Class A 2.6%
Dream Unlimited Corp. - Class A 2.3% Partners Value Investments LP 2.0%
Multi-Disciplinary Income Fund Top 10 Fixed Income Holdings (%) as of December 31, 2016
Brookfield Residential Properties 7.0%
Post Holdings, Inc. 5.0%
Sotheby’s. 4.4%
IAC/InterActiveCorp 4.1%
Icahn Enterprises 4.0%
Ashland Inc. 4.0%
Royal Gold, Inc. 3.9%
Penske Automotive Group Inc. 3.7%
The Howard Hughes Corporation 3.6%
TRI Pointe Holdings, Inc. 3.4%
The information contained in these charts is updated at the discretion of Kinetics Asset Management
LLC and is only representative of each Fund’s portfolio on the date specified. Additionally, position size
may not be indicative of actual market position due to the use of call and put options.
-END-