Embed Size (px)
Citation preview
ISSN-1996-918X
Pak. J. Anal. Environ. Chem. Vol. 17, No. 1 (2016) 93 – 105
Kinetics and Thermodynamics of Sorption of 4-Nitrophenolon Activated Kaolinitic Clay and Jatropha Curcas Activated
Carbon from Aqueous Solution
Samsudeen Olanrewaju Azeez1 and Folahan Amoo Adekola2*
1Chemistry Unit, Department of Chemical, Geological and Physical Sciences, Kwara State University Malete, P.M.B.1530, Ilorin, Nigeria
2*Department of Industrial Chemistry, University of Ilorin, P.M.B 1515, Ilorin 240222, Nigeria*Corresponding Author Email: [email protected]
Received 26 January 2016, Revised 03 June 2016, Accepted 06 June 2016
--------------------------------------------------------------------------------------------------------------------------------------------AbstractAdsorption behaviour of 4-nitrophenol (4-NP) on activated kaolinitic clay and Jatropha curcas activatedcarbon was investigated. The kaolinitic clay and Jatropha curcas were activated with 1 M HNO3 and 0.5 MNaOH respectively and were characterized by XRF, XRD, BET, SEM and FTIR techniques. The effects ofprocessing parameters, such as initial 4-NP concentration, temperature, pH, contact time and adsorbentdosage on the adsorption process were investigated. The results obtained showed that Jatropha curcasactivated carbon exhibited higher performance than activated kaolinitic clay for the removal of 4-nitrophenol from aqueous solution. Langmuir, Freundlich, Temkin and Dubinin-Radushkevich modelswere used to describe the adsorption isotherms. The adsorption data were best fitted with Freundlichmodel. The experimental data of the two adsorbate-adsorbent systems fitted very well with the pseudo-second order kinetic model with r2 values of 0.999 respectively. Adsorption thermodynamic parameterswere also estimated. The results revealed that the adsorption of 4-nitrophenol onto both adsorbents wereexothermic processes and spontaneous for Jatropha curcas activated carbon but non spontaneous foractivated kaolinitic clay.
Keywords: 4-nitrophenol, Adsorption isotherm, Jatropha curcas, Kaolinitic clay, Kinetics,Thermodynamics
--------------------------------------------------------------------------------------------------------------------------------------------
Introduction
Organic pollutants such as 4-nitrophenol and otherphenolic compounds usually abound inwastewaters discharged from oil refinery, plasticmanufacturing industries, pharmaceuticalindustries, coke plants and phenolics resin plants[1]. Because of their high volatility and solubility,phenol and its compounds impart taste and odouron water even at parts per billion levels. Phenol isprotoplasmic poison and so it damages all kind ofcells. Hence, there is a need to remove phenolicswaste effluent generated from these industriesbefore discharging it into the environment [2, 3].Various treatment technologies have been reportedto remove these contaminants from wastewaterssuch as steam distillation [4], chemical extraction
[5], separation membrane [6, 7], air oxidation [8,9], electrochemical oxidation [10-13] andbiochemical abatement [14]. Many problemsassociated with the above mentioned methodsinclude high cost, low efficiency and generation oftoxic products [15]. However, adsorption has beenchosen as one of the most widely acceptableeffective techniques to remove phenolic at thisconcentration due to its relatively simple design,cost effectiveness, ease of operation and simpleregeneration [16, 17]. A good number ofadsorbents have been reported by researchers forwastewater treatment and remediation. Someinclude the adsorption of phenol on natural clayreported by Djebbar et al. [18], the equilibrium
doi: 10.21743/pjaec/2016.06.014
Pak. J. Anal. Environ. Chem. Vol. 17, No. 1 (2016)94
kinetic and thermodynamic studies on theadsorption of phenol onto activated phosphate rockreported by Atef and Waleed [19]. Preeti andSingh [20] also investigated the sorption of phenoland p-nitrophenol from aqueous solution usingclay sorbent. In addition, Adegoke and Adekola[21] investigated the removal of phenol fromaqueous solution by activated carbon preparedfrom some agricultural materials and Hatem et al.[22] reported the isotherms, kinetics andthermodynamics of 4-nitrophenol adsorption onfiber-based activated carbon from coconut husksprepared under optimized conditions.Consequently, as a result of growing interest in theuse of low cost adsorbents for wastewatertreatment and remediation. It becomes imperativeto activate the natural indigenous adsorbent bynatural or synthetic materials.
Kaolinitic clay is clay that is rich inkaolinite also known as china clay [23]. They areparts of the group of industrial minerals withchemical composition Al2Si2O5(OH)4. It is alayered silicate mineral with one tetrahedral sheetlinked through oxygen atoms to one octahedralsheet of alumina [24]. It has many uses due to itsfavourable properties such as natural whiteness,fine particle size, non-abrasiveness, and chemicalstability. It is applied in the production of rubber,plastics and pigments as filler and also for theproduction of synthetic zeolites and thus, as anadsorbent in drugs [25]. Jatropha curcas is one ofthe species of flowering plant in the genusJatropha in spurge family, Euphorbiaceae, a tropicplant of Mexico and Central America [26]. Theseeds contain 27- 40% oil (average: 34.4%) thatcould be processed to produce a high-qualitybiodiesel fuel, usable in a standard dieselengine [27, 28]. The seed coat is hardwhich allows it to be charred and used as anadsorbent.
The prime objective of this study was toinvestigate the removal of 4-NP from aqueoussolution by activated Kaolinitic (AKC) clay andJatropha curcas activated carbon (JAC) with aview to determining their efficacy andeffectiveness. The effects of initial 4-NPconcentration, pH, contact time, and adsorbentdosage on adsorption capacity were investigated.
Kinetic models and thermodynamic parameterswere tested on the experimental data and theirconstants determined.
Materials and MethodsReagents and apparatus
The reagents and chemicals that were usedfor this experiment were of analytical grade asfollows: 4-nitrophenol (BDH, 98%, Prd. No:30167), hydrochloric acid (Purity 37%, density 1.1kg/cm3, Riedel-deHaen, Buffalo, NY, USA),sodium hydroxide (BDH prod. No. 30167, SigmaAldrich, Diegem, Belgium) and Nitric acid (purity98%, 1.51gcm3), were used without furtherpurification.
Sample collection and preparation of theadsorbents
The Kaolinitic clay sample that was usedfor this experiment was sourced from Batagbonmining site in Kwara State, Nigeria. The Jatrophacurcas fruit used was collected from private estatesin Ilorin, Nigeria. The seed coat was used for thepreparation of activated carbon. The Kaolin claysample was ground and sieved into particle size ˂ 90 μm using Tyler screen standard sieves. It wasthen soaked in concentrated HCl solution for 4hr.to eliminate impurities and further washedseverally with deionised water and oven-dried[19]. The Jatropha curcas seed coat wascarbonised at a temperature of 500 °C for 1hr30min and ground into smaller sizes, and alsosieved into particle size, ˂ 90 µm [21]. 100 g of the sieved clay (˂ 90 μm) was activated with 1 Mnitric acid by adding 400 mL of the acid solutionand stirred on a magnetic stirrer at affixed rate of500 rpm for 2 hr 30 min at a temperature of 90°C.The sample was then filtered, washed severallywith deionized water to neutral pH and dried at105°C to obtain activated kaolinitic clay (AKC)sample [20]. The sieved carbon prepared fromJatropha curcas seed coat was activated with 0.5M NaOH. 50 g of the Jatropha curcas wasimpregnated into 200 mL of 0.5 M NaOH solutionfor 48 hours. The sample was then filtered, washedwith deionized water to neutral pH and oven-driedat 105°C [21].
Pak. J. Anal. Environ. Chem. Vol. 17, No. 1 (2016) 95
Characterization of the adsorbents
The mineralogical composition of thekaolinitic clay sample was carried out using MINIPAL4 EDXRF Spectrometer. The X-ray diffraction(XRD) of the kaolinitic clay was carried out usinga PANalytical X'Pert PRO MRD PW3040 model.The surface area of both AKC and JAC wereexamined by Brunauer, Emmet and Teller (BET)analysis of N2 adsorption at 77K usingMicromeritics ASAP 2020 V3.02H model. Thesurface morphology of the adsorbents wereanalysed using the scanning electron microscope(SEM) model ASPEX 3020. Fourier transforminfrared spectroscopy (FTIR, Shimadzu, Columbia,MD, USA) absorption spectra were obtained usingthe potassium bromide (KBr) pellet method andthe spectra of the samples were recorded over therange 4000–400 cm−1 using Shimadzu FTIR-8400S.
Preparation of standard solution
A stock solution of 4-NP (1000 mg/L) wasprepared by dissolving 1.0 g of the adsorbate withdeionized water in 1000 mL capacity standardvolumetric flask and serial dilution was made toobtain other lower concentrations required [20].
Adsorption experiment
The adsorption experiment was carried outby batch equilibrium method. The experimentinvolved preparing 20 mL of differentconcentrations of 4-NP and contacted with 0.2 g(AKC) and 0.02 g (JCA) in a 100 mL conicalflasks. The content was agitated for 2 hr at 200rpm at a temperature of 28±2 ºC. The pH of thesolution was adjusted using 0.1 M HCl or 0.1 MNaOH solutions by a pH meter model. The effectof experimental parameters such as pH, contacttime, adsorbent dosage (AKC and JAC) andtemperature were studied. The solutions were thencentrifuged at 10,000 rpm for 10 min and thesupernatant solution filtered and analysed using aUV/Visible spectrophotometer (Bechman CoulterDU 730 Pasadena, CA, USA) at λmax of 400 nm for 4-NP. The amounts of 4-NP adsorbed, qe
(mg/g) and % 4-NP adsorbed were calculatedusing equation 1 and 2 [22, 29-30]:
W
VCCq eo (1)
% 4-NP adsorbed =
100
o
eo
C
CC(2)
Where; C0 and Ce are the initial and equilibriumconcentration of 4-NP (mg/L), V is the volume ofthe solution (L) and W is the amount of adsorbentused (g).
All experiments were performed intriplicate to ensure the reproducibility of theresults; the mean of the measurements wasreported.
Results and discussionComposition of the kaolinitic clay
The mineralogical composition of thekaolin sample is depicted in the (Table 1).
The major compounds detected by theXRF are Al2O3 (43.3%) and SiO2 (52.0%) as inTable 1. High grade Kaolin samples have beenfound to contain Al2O3 (alumina) in the range (33 –42%) [31].
Table 1. Chemical composition of kaolinitic clay sample by XRF.
Compounds
Al2O3
SiO2
K2O CaO TiO2
Fe2
O3
MnO
Cr2
O3
V2O5 Ag2
O
Conc.%
43.3 52.0 0.041
0.214
1.68 1.04 0.016
0.036
0.085
1.40
X-ray diffraction (XRD) of the kaolinitic clay
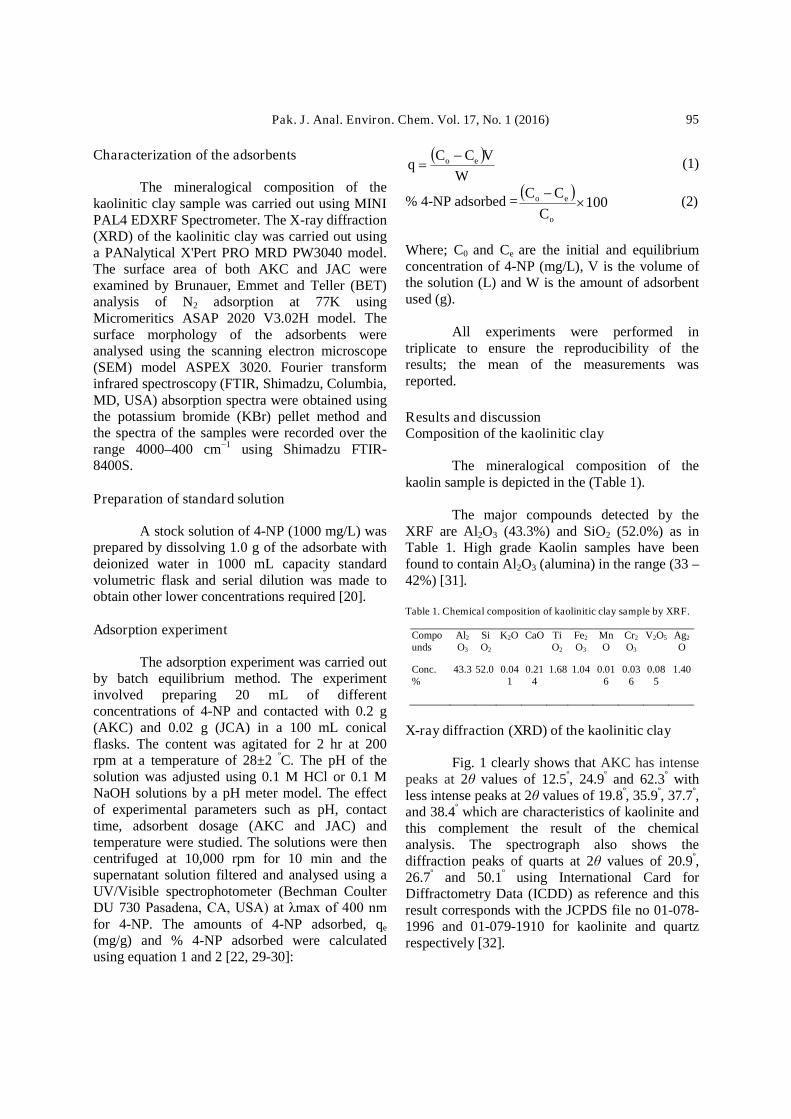
Fig. 1 clearly shows that AKC has intensepeaks at 2θ values of 12.5º, 24.9º and 62.3º withless intense peaks at 2θ values of 19.8º, 35.9º, 37.7º,and 38.4º which are characteristics of kaolinite andthis complement the result of the chemicalanalysis. The spectrograph also shows thediffraction peaks of quarts at 2θ values of 20.9º,26.7º and 50.1º using International Card forDiffractometry Data (ICDD) as reference and thisresult corresponds with the JCPDS file no 01-078-1996 and 01-079-1910 for kaolinite and quartzrespectively [32].
Pak. J. Anal. Environ. Chem. Vol. 17, No. 1 (2016)96
a1
01-078-1996 (C) - Kaolinite 1A - Al2(Si2O5)(OH)4 - Y: 50.00 % - d x by: 1. - WL: 1.5406 - Triclinic - a 5.15540 - b 8.94480 - c 7.40480 - alpha 91.700 - beta 104.862 - gamma 89.822 - Base-centered - C1 (0) - 2 - 329.8
01-079-1910 (C) - Quartz - alpha-SiO2 - Y: 83.33 % - d x by: 1. - WL: 1.5406 - Hexagonal - a 4.91400 - b 4.91400 - c 5.40600 - alpha 90.000 - beta 90.000 - gamma 120.000 - Primitive - P3121 (152) - 3 - 113.052 - I/Ic
Operations: Smooth 0.150 | Background 1.000,1.000 | Import
a1 - File: A1.raw - Type: 2Th/Th locked - Start: 10.000 ° - End: 89.978 ° - Step: 0.034 ° - Step time: 71.6 s - Temp.: 25 °C (Room) - Time Started: 11 s - 2-Theta: 10.000 ° - Theta: 5.000 ° - Chi: 0.00 ° - Phi: 0.00 ° - X: 0.
Lin
(Counts)
0
100
200
300
400
500
600
700
800
900
1000
1100
1200
1300
1400
1500
1600
1700
1800
1900
2-Theta - Scale
10 20 30 40 50 60 70 80
Figure 1. XRD patterns of AKC
Surface area determination of the adsorbents
The results of the surface area analysis ofthe adsorbents are tabulated in Table 2.Summarily, the BET surface area and pore volumeof JAC is significantly higher than AKC while thepore size of AKC is greater than JAC. Accordingto the classification by International Union of Pureand Applied Chemistry [33], pores are classified asmicropores (< 2nm diameter), mesopore (2-50 nmdiameter) and macropores (> 50 nm diameter). Itcan be seen (Table 2) that both AKC and JAC arecomposed mainly of mesopores with surface areain the range of 20 to 100 m2 per gram and pore sizeof about 3.4 nm and 2.1 nm respectively. Thelarger surface area and pore volume recorded forJAC viz-a-viz the pore size in the mesopore regionsuggest that JAC might be a better adsorbent in theuptake of 4-NP.
Table 2: BET results of the Adsorbents.
Adsorbents BET surfacearea (m2/g)
Pore volume(cm3/g)
Pore size(nm)
AKC 20.60 0.0180 3.480
JAC 50.30 0.026 2.10
Scanning electron microscopy (SEM)
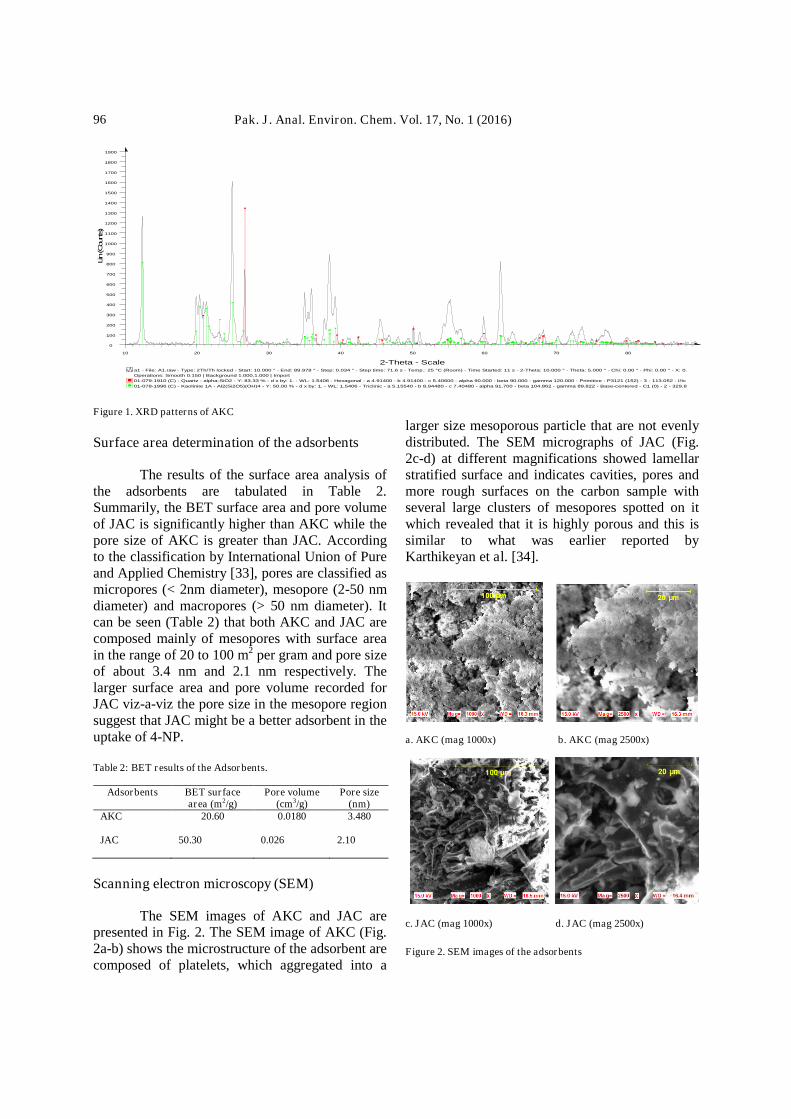
The SEM images of AKC and JAC arepresented in Fig. 2. The SEM image of AKC (Fig.2a-b) shows the microstructure of the adsorbent arecomposed of platelets, which aggregated into a
larger size mesoporous particle that are not evenlydistributed. The SEM micrographs of JAC (Fig.2c-d) at different magnifications showed lamellarstratified surface and indicates cavities, pores andmore rough surfaces on the carbon sample withseveral large clusters of mesopores spotted on itwhich revealed that it is highly porous and this issimilar to what was earlier reported byKarthikeyan et al. [34].
a. AKC (mag 1000x) b. AKC (mag 2500x)
c. JAC (mag 1000x) d. JAC (mag 2500x)
Figure 2. SEM images of the adsorbents
Pak. J. Anal. Environ. Chem. Vol. 17, No. 1 (2016) 97
Fourier Transform Infra-Red Spectroscopy(FTIR)
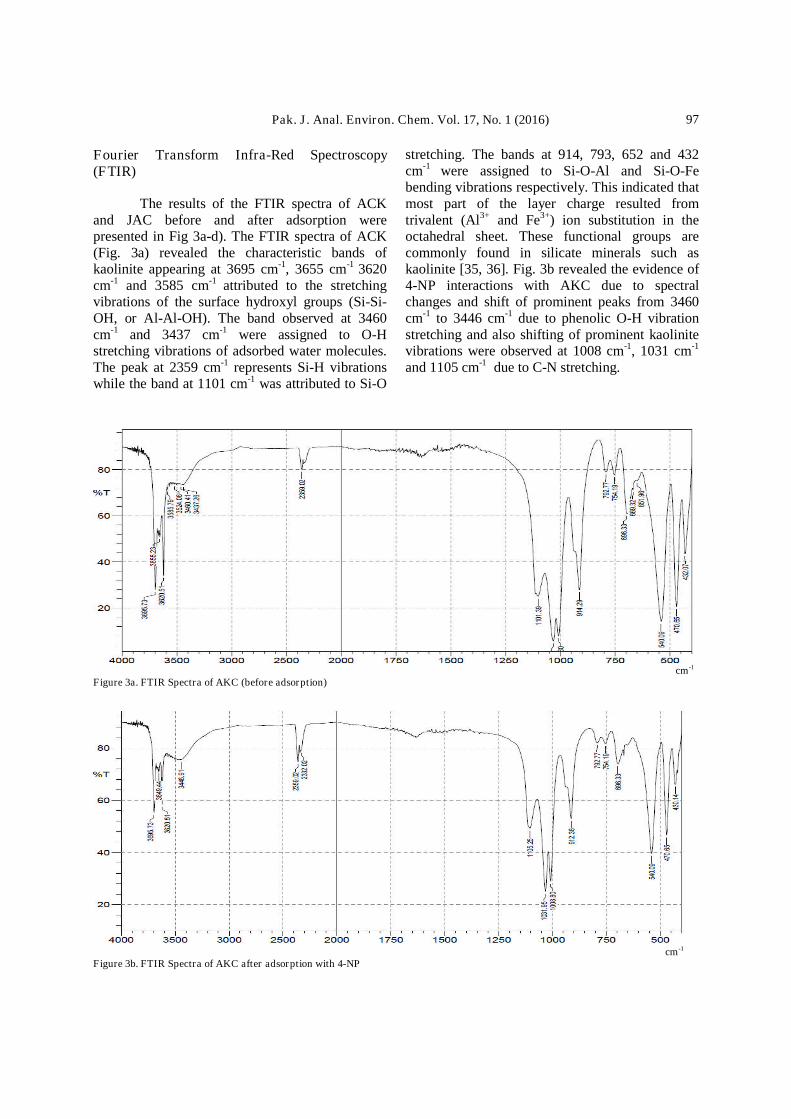
The results of the FTIR spectra of ACKand JAC before and after adsorption werepresented in Fig 3a-d). The FTIR spectra of ACK(Fig. 3a) revealed the characteristic bands ofkaolinite appearing at 3695 cm-1, 3655 cm-1 3620cm-1 and 3585 cm-1 attributed to the stretchingvibrations of the surface hydroxyl groups (Si-Si-OH, or Al-Al-OH). The band observed at 3460cm-1 and 3437 cm-1 were assigned to O-Hstretching vibrations of adsorbed water molecules.The peak at 2359 cm-1 represents Si-H vibrationswhile the band at 1101 cm-1 was attributed to Si-O
stretching. The bands at 914, 793, 652 and 432cm-1 were assigned to Si-O-Al and Si-O-Febending vibrations respectively. This indicated thatmost part of the layer charge resulted fromtrivalent (Al3+ and Fe3+) ion substitution in theoctahedral sheet. These functional groups arecommonly found in silicate minerals such askaolinite [35, 36]. Fig. 3b revealed the evidence of4-NP interactions with AKC due to spectralchanges and shift of prominent peaks from 3460cm-1 to 3446 cm-1 due to phenolic O-H vibrationstretching and also shifting of prominent kaolinitevibrations were observed at 1008 cm-1, 1031 cm-1
and 1105 cm-1 due to C-N stretching.
cm-1
Figure 3a. FTIR Spectra of AKC (before adsorption)
cm-1
Figure 3b. FTIR Spectra of AKC after adsorption with 4-NP
Pak. J. Anal. Environ. Chem. Vol. 17, No. 1 (2016)98
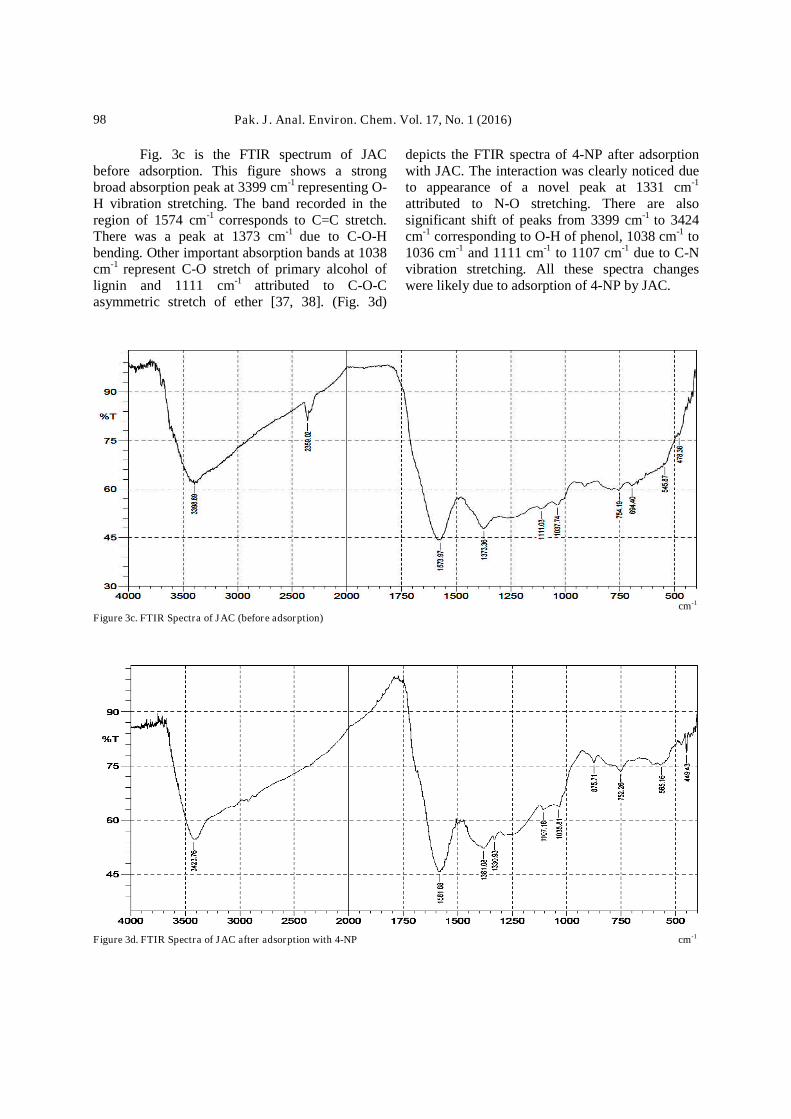
Fig. 3c is the FTIR spectrum of JACbefore adsorption. This figure shows a strongbroad absorption peak at 3399 cm-1 representing O-H vibration stretching. The band recorded in theregion of 1574 cm-1 corresponds to C=C stretch.There was a peak at 1373 cm-1 due to C-O-Hbending. Other important absorption bands at 1038cm-1 represent C-O stretch of primary alcohol oflignin and 1111 cm-1 attributed to C-O-Casymmetric stretch of ether [37, 38]. (Fig. 3d)
depicts the FTIR spectra of 4-NP after adsorptionwith JAC. The interaction was clearly noticed dueto appearance of a novel peak at 1331 cm-1
attributed to N-O stretching. There are alsosignificant shift of peaks from 3399 cm-1 to 3424cm-1 corresponding to O-H of phenol, 1038 cm-1 to1036 cm-1 and 1111 cm-1 to 1107 cm-1 due to C-Nvibration stretching. All these spectra changeswere likely due to adsorption of 4-NP by JAC.
cm-1
Figure 3c. FTIR Spectra of JAC (before adsorption)
Figure 3d. FTIR Spectra of JAC after adsorption with 4-NP cm-1
Pak. J. Anal. Environ. Chem. Vol. 17, No. 1 (2016) 99
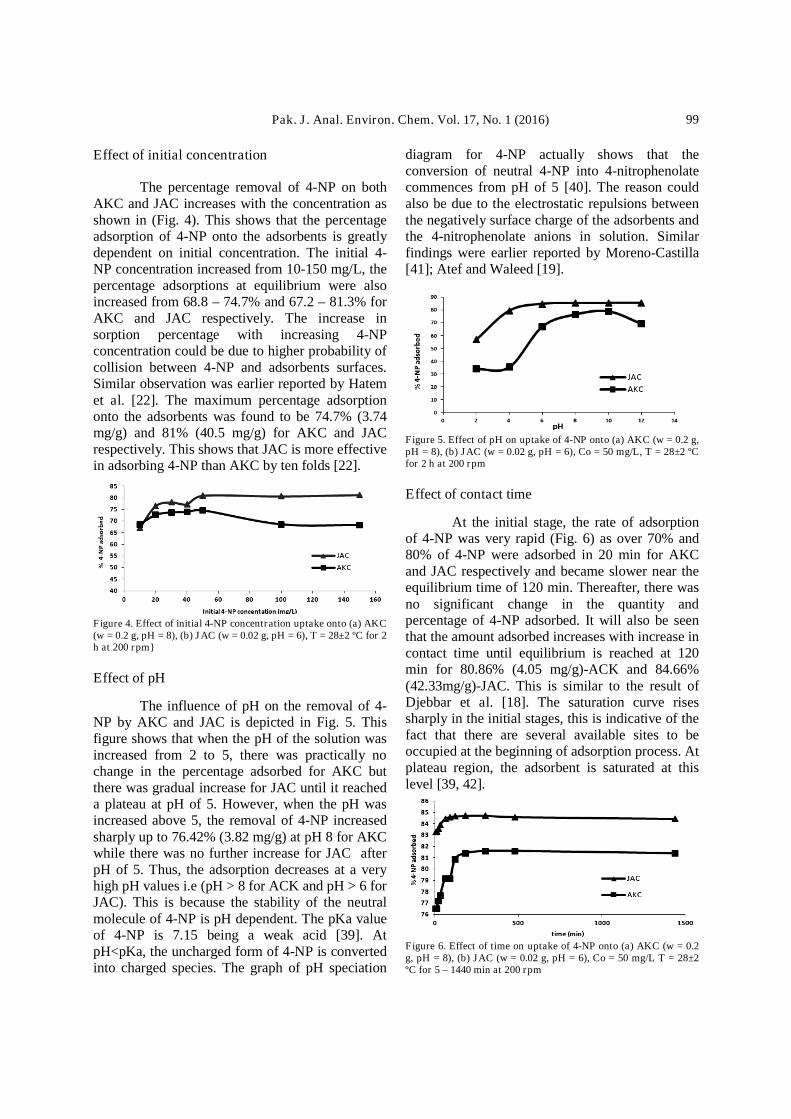
Effect of initial concentration
The percentage removal of 4-NP on bothAKC and JAC increases with the concentration asshown in (Fig. 4). This shows that the percentageadsorption of 4-NP onto the adsorbents is greatlydependent on initial concentration. The initial 4-NP concentration increased from 10-150 mg/L, thepercentage adsorptions at equilibrium were alsoincreased from 68.8 – 74.7% and 67.2 – 81.3% forAKC and JAC respectively. The increase insorption percentage with increasing 4-NPconcentration could be due to higher probability ofcollision between 4-NP and adsorbents surfaces.Similar observation was earlier reported by Hatemet al. [22]. The maximum percentage adsorptiononto the adsorbents was found to be 74.7% (3.74mg/g) and 81% (40.5 mg/g) for AKC and JACrespectively. This shows that JAC is more effectivein adsorbing 4-NP than AKC by ten folds [22].
Figure 4. Effect of initial 4-NP concentration uptake onto (a) AKC(w = 0.2 g, pH = 8), (b) JAC (w = 0.02 g, pH = 6), T = 28±2 ºC for 2h at 200 rpm}
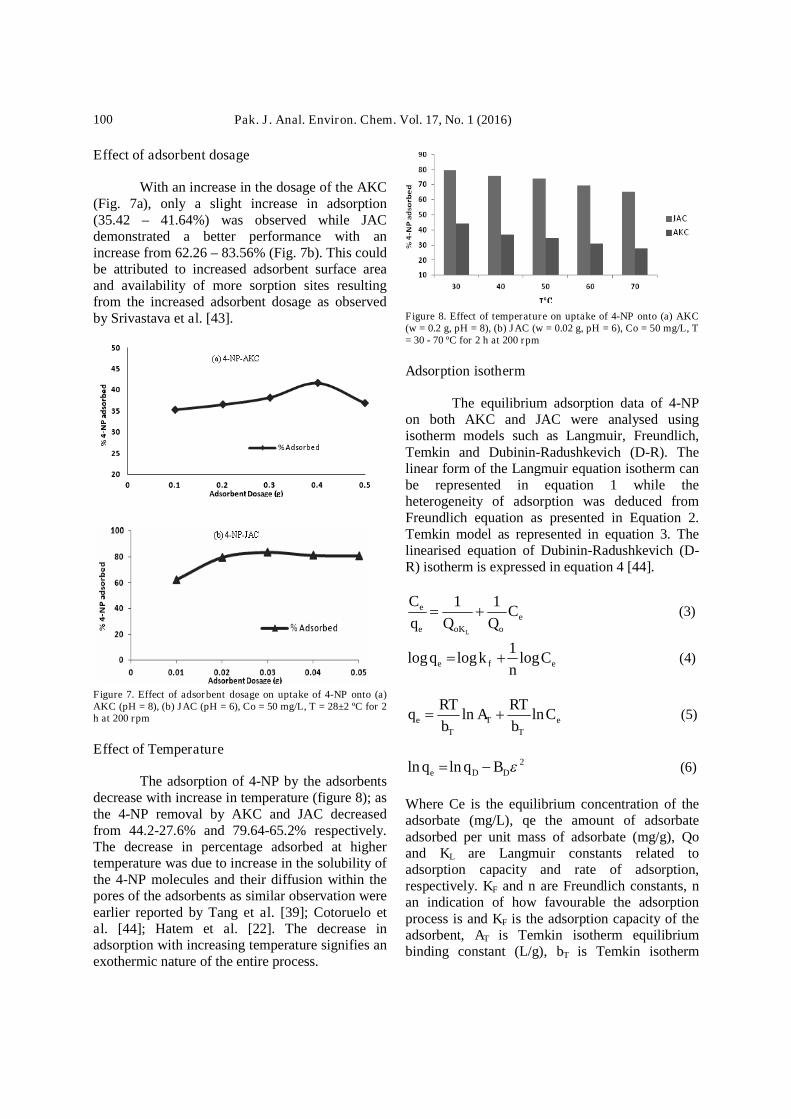
Effect of pH
The influence of pH on the removal of 4-NP by AKC and JAC is depicted in Fig. 5. Thisfigure shows that when the pH of the solution wasincreased from 2 to 5, there was practically nochange in the percentage adsorbed for AKC butthere was gradual increase for JAC until it reacheda plateau at pH of 5. However, when the pH wasincreased above 5, the removal of 4-NP increasedsharply up to 76.42% (3.82 mg/g) at pH 8 for AKCwhile there was no further increase for JAC afterpH of 5. Thus, the adsorption decreases at a veryhigh pH values i.e (pH > 8 for ACK and pH > 6 forJAC). This is because the stability of the neutralmolecule of 4-NP is pH dependent. The pKa valueof 4-NP is 7.15 being a weak acid [39]. AtpH<pKa, the uncharged form of 4-NP is convertedinto charged species. The graph of pH speciation
diagram for 4-NP actually shows that theconversion of neutral 4-NP into 4-nitrophenolatecommences from pH of 5 [40]. The reason couldalso be due to the electrostatic repulsions betweenthe negatively surface charge of the adsorbents andthe 4-nitrophenolate anions in solution. Similarfindings were earlier reported by Moreno-Castilla[41]; Atef and Waleed [19].
Figure 5. Effect of pH on uptake of 4-NP onto (a) AKC (w = 0.2 g,pH = 8), (b) JAC (w = 0.02 g, pH = 6), Co = 50 mg/L, T = 28±2 ºCfor 2 h at 200 rpm
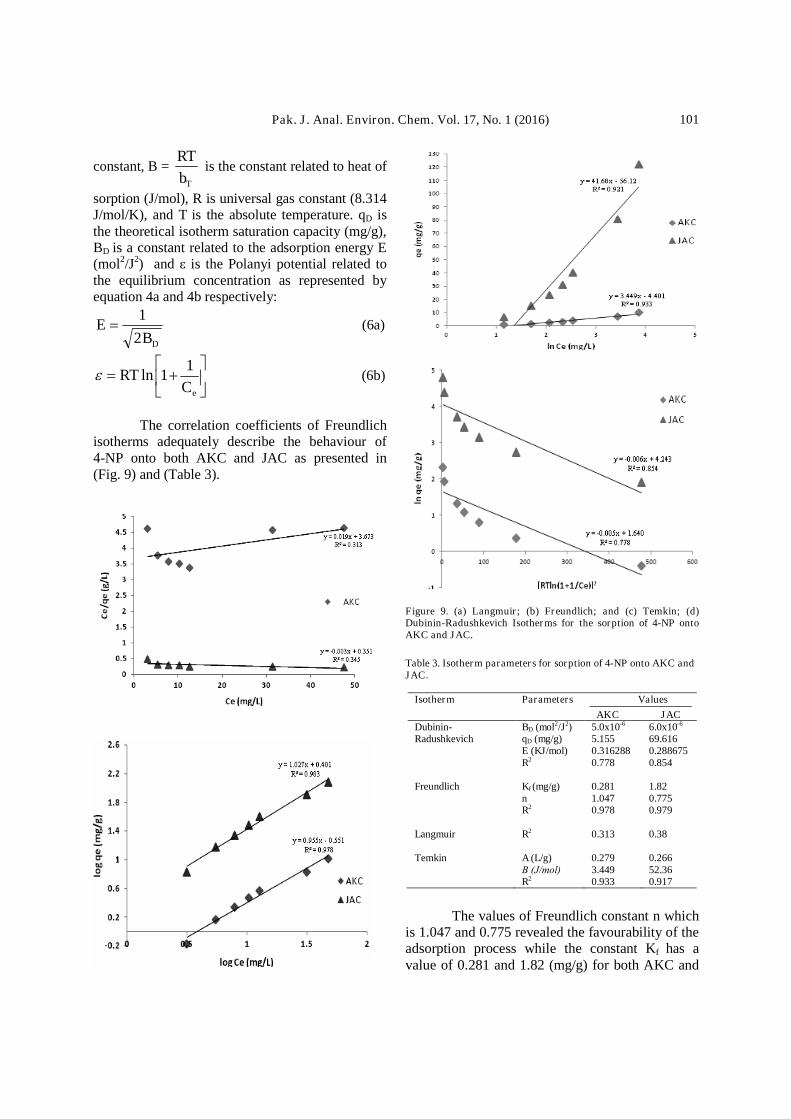
Effect of contact time
At the initial stage, the rate of adsorptionof 4-NP was very rapid (Fig. 6) as over 70% and80% of 4-NP were adsorbed in 20 min for AKCand JAC respectively and became slower near theequilibrium time of 120 min. Thereafter, there wasno significant change in the quantity andpercentage of 4-NP adsorbed. It will also be seenthat the amount adsorbed increases with increase incontact time until equilibrium is reached at 120min for 80.86% (4.05 mg/g)-ACK and 84.66%(42.33mg/g)-JAC. This is similar to the result ofDjebbar et al. [18]. The saturation curve risessharply in the initial stages, this is indicative of thefact that there are several available sites to beoccupied at the beginning of adsorption process. Atplateau region, the adsorbent is saturated at thislevel [39, 42].
Figure 6. Effect of time on uptake of 4-NP onto (a) AKC (w = 0.2g, pH = 8), (b) JAC (w = 0.02 g, pH = 6), Co = 50 mg/L T = 28±2ºC for 5 – 1440 min at 200 rpm
Pak. J. Anal. Environ. Chem. Vol. 17, No. 1 (2016)100
Effect of adsorbent dosage
With an increase in the dosage of the AKC(Fig. 7a), only a slight increase in adsorption(35.42 – 41.64%) was observed while JACdemonstrated a better performance with anincrease from 62.26 – 83.56% (Fig. 7b). This couldbe attributed to increased adsorbent surface areaand availability of more sorption sites resultingfrom the increased adsorbent dosage as observedby Srivastava et al. [43].
Figure 7. Effect of adsorbent dosage on uptake of 4-NP onto (a)AKC (pH = 8), (b) JAC (pH = 6), Co = 50 mg/L, T = 28±2 ºC for 2h at 200 rpm
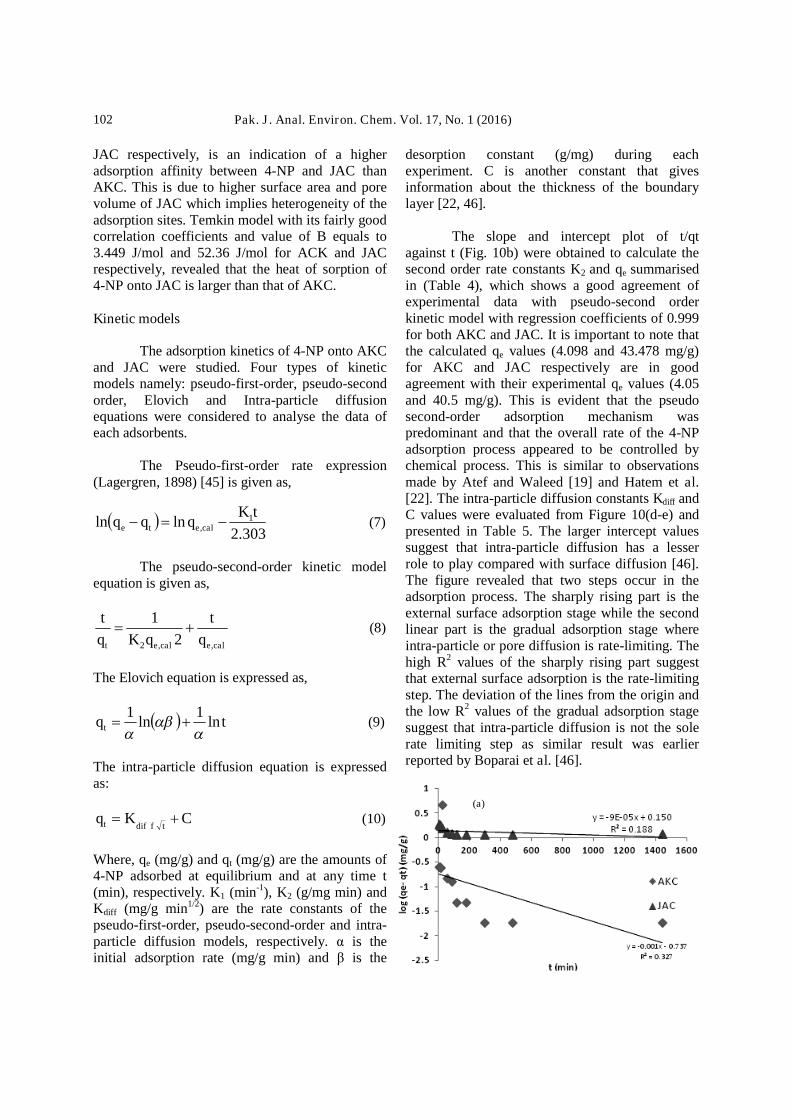
Effect of Temperature
The adsorption of 4-NP by the adsorbentsdecrease with increase in temperature (figure 8); asthe 4-NP removal by AKC and JAC decreasedfrom 44.2-27.6% and 79.64-65.2% respectively.The decrease in percentage adsorbed at highertemperature was due to increase in the solubility ofthe 4-NP molecules and their diffusion within thepores of the adsorbents as similar observation wereearlier reported by Tang et al. [39]; Cotoruelo etal. [44]; Hatem et al. [22]. The decrease inadsorption with increasing temperature signifies anexothermic nature of the entire process.
Figure 8. Effect of temperature on uptake of 4-NP onto (a) AKC(w = 0.2 g, pH = 8), (b) JAC (w = 0.02 g, pH = 6), Co = 50 mg/L, T= 30 - 70 ºC for 2 h at 200 rpm
Adsorption isotherm
The equilibrium adsorption data of 4-NPon both AKC and JAC were analysed usingisotherm models such as Langmuir, Freundlich,Temkin and Dubinin-Radushkevich (D-R). Thelinear form of the Langmuir equation isotherm canbe represented in equation 1 while theheterogeneity of adsorption was deduced fromFreundlich equation as presented in Equation 2.Temkin model as represented in equation 3. Thelinearised equation of Dubinin-Radushkevich (D-R) isotherm is expressed in equation 4 [44].
e
ooKe
e CQQq
C
L
11 (3)
efe Cn
kq log1
loglog (4)
e
T
T
T
e Cb
RTA
b
RTq lnln (5)
2lnln DDe Bqq (6)
Where Ce is the equilibrium concentration of theadsorbate (mg/L), qe the amount of adsorbateadsorbed per unit mass of adsorbate (mg/g), Qoand KL are Langmuir constants related toadsorption capacity and rate of adsorption,respectively. KF and n are Freundlich constants, nan indication of how favourable the adsorptionprocess is and KF is the adsorption capacity of theadsorbent, AT is Temkin isotherm equilibriumbinding constant (L/g), bT is Temkin isotherm
Pak. J. Anal. Environ. Chem. Vol. 17, No. 1 (2016) 101
constant, B =Tb
RTis the constant related to heat of
sorption (J/mol), R is universal gas constant (8.314J/mol/K), and T is the absolute temperature. qD isthe theoretical isotherm saturation capacity (mg/g),BD is a constant related to the adsorption energy E(mol2/J2) and ε is the Polanyi potential related tothe equilibrium concentration as represented byequation 4a and 4b respectively:
DBE
2
1 (6a)
eCRT
11ln (6b)
The correlation coefficients of Freundlichisotherms adequately describe the behaviour of4-NP onto both AKC and JAC as presented in(Fig. 9) and (Table 3).
Figure 9. (a) Langmuir; (b) Freundlich; and (c) Temkin; (d)Dubinin-Radushkevich Isotherms for the sorption of 4-NP ontoAKC and JAC.
Table 3. Isotherm parameters for sorption of 4-NP onto AKC andJAC.
Isotherm Parameters Values
AKC JACDubinin-Radushkevich
BD (mol2/J2)qD (mg/g)E (KJ/mol)R2
5.0x10⁻⁶
5.1550.3162880.778
6.0x10⁻⁶
69.6160.2886750.854
Freundlich Kf (mg/g)nR2
0.2811.0470.978
1.820.7750.979
Langmuir R2 0.313 0.38
Temkin A (L/g)Β (J/mol)R2
0.2793.4490.933
0.26652.360.917
The values of Freundlich constant n whichis 1.047 and 0.775 revealed the favourability of theadsorption process while the constant Kf has avalue of 0.281 and 1.82 (mg/g) for both AKC and
Pak. J. Anal. Environ. Chem. Vol. 17, No. 1 (2016)102
JAC respectively, is an indication of a higheradsorption affinity between 4-NP and JAC thanAKC. This is due to higher surface area and porevolume of JAC which implies heterogeneity of theadsorption sites. Temkin model with its fairly goodcorrelation coefficients and value of B equals to3.449 J/mol and 52.36 J/mol for ACK and JACrespectively, revealed that the heat of sorption of4-NP onto JAC is larger than that of AKC.
Kinetic models
The adsorption kinetics of 4-NP onto AKCand JAC were studied. Four types of kineticmodels namely: pseudo-first-order, pseudo-secondorder, Elovich and Intra-particle diffusionequations were considered to analyse the data ofeach adsorbents.
The Pseudo-first-order rate expression(Lagergren, 1898) [45] is given as,
303.2
lnln 1,
tKqqq calete (7)
The pseudo-second-order kinetic modelequation is given as,
calecalet q
t
qKq
t
,,2 2
1 (8)
The Elovich equation is expressed as,
tqt ln1
ln1
(9)
The intra-particle diffusion equation is expressedas:
CKqtfdift (10)
Where, qe (mg/g) and qt (mg/g) are the amounts of4-NP adsorbed at equilibrium and at any time t(min), respectively. K1 (min-1), K2 (g/mg min) andKdiff (mg/g min1/2) are the rate constants of thepseudo-first-order, pseudo-second-order and intra-particle diffusion models, respectively. α is theinitial adsorption rate (mg/g min) and β is the
desorption constant (g/mg) during eachexperiment. C is another constant that givesinformation about the thickness of the boundarylayer [22, 46].
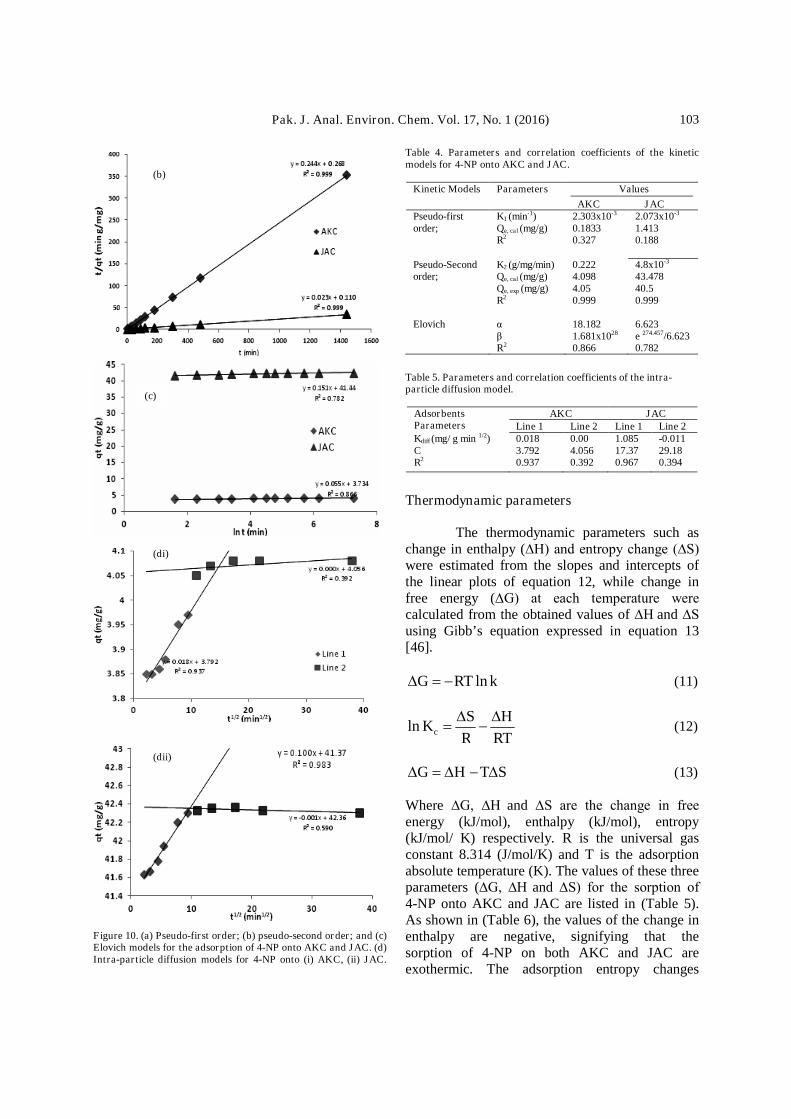
The slope and intercept plot of t/qtagainst t (Fig. 10b) were obtained to calculate thesecond order rate constants K2 and qe summarisedin (Table 4), which shows a good agreement ofexperimental data with pseudo-second orderkinetic model with regression coefficients of 0.999for both AKC and JAC. It is important to note thatthe calculated qe values (4.098 and 43.478 mg/g)for AKC and JAC respectively are in goodagreement with their experimental qe values (4.05and 40.5 mg/g). This is evident that the pseudosecond-order adsorption mechanism waspredominant and that the overall rate of the 4-NPadsorption process appeared to be controlled bychemical process. This is similar to observationsmade by Atef and Waleed [19] and Hatem et al.[22]. The intra-particle diffusion constants Kdiff andC values were evaluated from Figure 10(d-e) andpresented in Table 5. The larger intercept valuessuggest that intra-particle diffusion has a lesserrole to play compared with surface diffusion [46].The figure revealed that two steps occur in theadsorption process. The sharply rising part is theexternal surface adsorption stage while the secondlinear part is the gradual adsorption stage whereintra-particle or pore diffusion is rate-limiting. Thehigh R2 values of the sharply rising part suggestthat external surface adsorption is the rate-limitingstep. The deviation of the lines from the origin andthe low R2 values of the gradual adsorption stagesuggest that intra-particle diffusion is not the solerate limiting step as similar result was earlierreported by Boparai et al. [46].
(a)
Pak. J. Anal. Environ. Chem. Vol. 17, No. 1 (2016) 103
Figure 10. (a) Pseudo-first order; (b) pseudo-second order; and (c)Elovich models for the adsorption of 4-NP onto AKC and JAC. (d)Intra-particle diffusion models for 4-NP onto (i) AKC, (ii) JAC.
Table 4. Parameters and correlation coefficients of the kineticmodels for 4-NP onto AKC and JAC.
Kinetic Models Parameters Values
AKC JACPseudo-firstorder;
K1 (min-1)Qe, cal (mg/g)R2
2.303x10⁻³
0.18330.327
2.073x10⁻³
1.4130.188
Pseudo-Secondorder;
K2 (g/mg/min)Qe, cal (mg/g)Qe, exp (mg/g)R2
0.2224.0984.050.999
4.8x10⁻³
43.47840.50.999
Elovich αβR2
18.1821.681x1028
0.866
6.623e 274.457/6.6230.782
Table 5. Parameters and correlation coefficients of the intra-particle diffusion model.
AdsorbentsParameters
AKC JACLine 1 Line 2 Line 1 Line 2
Kdiff (mg/ g min 1/2)CR2
0.0183.7920.937
0.004.0560.392
1.08517.370.967
-0.01129.180.394
Thermodynamic parameters
The thermodynamic parameters such aschange in enthalpy (∆H) and entropy change (∆S) were estimated from the slopes and intercepts ofthe linear plots of equation 12, while change infree energy (∆G) at each temperature were calculated from the obtained values of ∆H and ∆S using Gibb’s equation expressed in equation 13[46].
kRTG ln (11)
RT
H
R
SKc
ln (12)
STHG (13)
Where ∆G, ∆H and ∆S are the change in free energy (kJ/mol), enthalpy (kJ/mol), entropy(kJ/mol/ K) respectively. R is the universal gasconstant 8.314 (J/mol/K) and T is the adsorptionabsolute temperature (K). The values of these threeparameters (∆G, ∆H and ∆S) for the sorption of 4-NP onto AKC and JAC are listed in (Table 5).As shown in (Table 6), the values of the change inenthalpy are negative, signifying that thesorption of 4-NP on both AKC and JAC areexothermic. The adsorption entropy changes
(b)
(c)
(di)
(dii)
Pak. J. Anal. Environ. Chem. Vol. 17, No. 1 (2016)104
(∆S) of both adsorbents are negative, which is an indication of the fact that the mobility ofadsorbate on the surface of adsorbents isbeing more restricted in comparison withthose in solution. The value of ∆S is lower for AKC (-0.0687 kJmol-1K-1) compared to that ofJAC (-0.0376 kJmol-1K-1). This is due to thefact that the mesopores of JAC are in a moreorderly arrangement [47]. The positive values of∆G for AKC shows that the adsorption process is not feasible and it’s not spontaneous,the reaction would have to be induce for itto occur by lowering the temperature of theadsorption process. While that of JAC gives anegative values of ∆G and this confirm the feasibility of the process and thespontaneous nature of the adsorptionwith a stronger affinity for 4-NP. This issimilar to what was earlier reported by Cotorueloet al. [44].
Table 6: Thermodynamic parameters of 4-NP onto AKC and JAC.
Adsorbents∆H (kJ/mol) -14.283 -14.799
∆S (kJ/mol/K) -0.0687 -0.0376
∆G (kJ/mol) T (K) ∆G T (K) ∆G 303 6.536 303 -3.406313 7.22 313 -3.03323 7.907 323 -2.654333 8.594 333 -2.278343 9.281 343 -1.902
Conclusion
For this study, chemical activation methodwas applied for the preparation of activatedKaolinitic clay and Jatropha curcas activatedcarbon under optimal experimental conditionsusing HNO3 and NaOH as the chemical activatorsrespectively. It can be concluded that AKC andJAC are potential and promising adsorbents in theremoval of 4-NP from aqueous solution. Theresults obtained showed that JAC achieved ahigher performance compared to AKC for 4-NPremoval. The adsorption of 4-NP by AKC and JACwas found to be influenced by the initialconcentration of the adsorbates, contact time,solution pH, adsorbent dosage and temperature.Langmuir, Freundlich, Temkin and Dubinin-Radushkevich models were used to examine theadsorption isotherms. Freundlich equation stoodout as the best isotherm for describing the
adsorption equilibrium data. The isothermsparameters confirm that the adsorption efficiencyof JAC (1.82 mg/g) is higher than that of AKC(0.281 mg/g). Pseudo-second order kinetic modelprovided the best fit for the experimental data ofall the adsorbents. The adsorbed 4-NP decreasedwith increasing temperature, indicating anexothermic process. The enthalpy changes (∆H) for the adsorption of 4-NP were all negatives andtheir absolute values were less than 40 KJ/mol,hence the adsorption is controlled by anexothermic physical process.
References
1. D. N. Jdhav and A. K. Vanjara, Indian J.Chem. Tech., 11 (2004) 35.
2. S, Senel, A. Kara, G. Alsancak and A.Denizli, J. Hazard. Mater., 138 (2006) 317.
3. O. Hamdaoui and E. Naffrechoux, J. Hazard.Mater., 147 (2007) 94.
4. H. G. Franck and J. W. Stadelhofer,Industrial Aromatic Chemistry. SpringerVerlag, Berlin, (1989) 148.
5. D. C. Greminger, G. P. Burns, S. Lynn, D. N.Hanson and C. J. King, Ind. Eng. Chem.Process Des., 21 (1982) 51.
6. M. Xiao, J. Zhou, Y. Tan, A. Zhang, Y. Xiaand L. Ji, Desalination, 195 (2006) 281.
7. M. T. A. Reis, O. M. F. De Freitas, M. R. C.Ismael and J. M. R. Carvalho, J. Membr.Sci., 305 (2007) 313.
8. J. Levec and A. Pintar, A Review. Catal.Today, 124 (2007) 172.
9. M. Matheswaran, S. Balaji, S. J. Chung andI. S. Moon, Catal. Commun., 8 (2007) 1497.
10. G. Chen, Sep. Purif. Techhnol., 38 (2004)11.11. M. Panizza and G. Cerisola, Electrochim.
Acta, 51 (2005) 191.12. M. J. Pacheco, A. Morao, A. Lopes, L.
Cirıaco and I. Goncalves, Electrochim. Acta,53 (2007) 629.
13. D. Rajkumar and K. Palanivelu, J. Hazard.Mater., B113 (2004) 123.
14. P. Saravanan, K. Pakshirajan and P. Saha,Bioresour. Technol., 99 (2008) 205.
15. K. Nazari, N. Esmaeili, A. Mahmoudi, H.Rahimi and A. A. Moosavi-Movahedi,Enzyme Microb. Technol., 41 (2007) 226.
16. Y. Ku and K. C. Lee, J. Hazard. Mater., B80(2000) 59.
Pak. J. Anal. Environ. Chem. Vol. 17, No. 1 (2016) 105
17. O. S. Fatoki, O. S. Ayanda, F. A. Adekolaand B. J. Ximba, Clean Soil Air Water, 42(2013) 472.
18. M. Djebbar, F. Djafri, M. Bouchekara andDjafri, African J. Pure and AppliedChemistry, 6 (2012) 15.
19. S. A. Atef and M. Waleed, Int’l. J. Phy., 4(2009) 172.
20. S. Preeti and B. K. Singh, Indian J. Chem.,46A (2007) 620.
21. H. I. Adegoke and F. A. Adekola, Adv. inNatural and Applied Sciences, 4 (2010) 293.ISSN 1995-0748.
22. A. A. Hatem, M. J. Maah, R. Yahyar and M.Radzi bin abas, Asian J. Chem., 25 (2013)9575.
23. W. A. Deer, R. A. Howie and J. Zussman,An introduction to the rock formingminerals. Second edition Harlow: Longman,ISBN 0-582-30094-0 (1992).
24. W. L. Pohl, Economic geology, principlesand practice; metals, mineral, coal andhydrocarbons- Introduction to formation andsustainable exploitation of mineral depositsWiley Blackwell, 331, ISBN 978-1-4443-3662-7 (2011).
25. H. M. Hadyn, “Industrial application ofkaolin” Georgia Kaolin Company, Elizabeth,New Jersy. Tenth National Conference onClays and Clay Minerals (1955).
26. J. Janick, and E. P. Robert, TheEncyclopaedia of Fruit & Nuts. CABI. 371–372. ISBN 978-0-85199-638-7 (2008).
27. W. M. J. Achten, E. Mathijs, L. Verchot,V.P. Singh, R. Aerts and B. Muys B.,Jatropha biodiesel fuelling sustainabilityBiofuels, Bioproducts and Biorefining. 1(2007) 283.
28. K. Nahar and M. Ozores-Hampton, Jatrophaan Alternative Substitute to Fossil Fuel(IFAS Publication Number HS1193).Gainesville: University of Florida, Instituteof Food and Agricultural Sciences (2011).
29. A. Qadeer and A. Rehan, Turk J. Chem., 26(2002) 357.
30. O. A. Ekpete, A. I. Spiff, M. Horsfall Jnr.and P. Adowei, Innovations in Science andEngineering, 2 (2012) 7.
31. T. A. Adebayo and O. Ajayi, AsianTransactions on Engineering, 1 (2011) 2221.
32. O. S. Olokode and P. O. Aiyedun, Pacific J.of Sci. and Technol., 12 (2011) 558.
33. S. Tangjuank, N. Insuk, J. Tontrakoon and V.Udeye, World Academy of Sci., Eng. andTechnol., 52 (2009) 110.
34. S. Karthikeyan, K. Sakthivel and C. Kannan,Rasayan J. Chem., 4 (2011) 519.
35. A. Gadsden, Infrared Spectra of Mineralsand Related Inorganic Compounds. TheButter worth group, UK, (1975).
36. J. Madejova, Vibrational Spectroscopy,(2003) 311.
37. M. S. Islam, M. A. Rouf, S. Fujimoto and T.Minowa, Bangladesh J. Sci. Ind. Res., 47(2012) 257..
38. W. Tongpoothor, M. Sriuttha, P. Homchan,S. Chanthai and C. Ruangviriyachai, Chem.Eng. Res.Des., 89 (2011) 335.
39. D. Tang, Z. Zheng, K. Lin, J. Luan and J.Zhang, J. Harzard. Mater., 143 (2007) 49.
40. I. Diaconu, R. Girdea, C. Camelia, N.Gheorghe, R. Elena and E. E. Totu,Romanian Biotechnological Letters, 15(2010) 5702.
41. C. Moreno-Castilla, Carbon, 42 (2004) 83.42. M. Uddin, M. Islam and M. Abedin, ARPN J.
of Eng. and Applied Sci., 2 (2007) 11.43. V. C. Srivastava, M. M. Swammy, I. D.
Mall, B. Prasad and I. M. Mishra, ColloidsSurf. A Physicochem Eng. Aspects, 272(2006) 89.
44. L. M. Cotoruelo, M. D. Marques, F. J. Diaz,J. Rodriguez-Mirasol, J.J. Rodriguez and T.Cordero, Chem. Eng. J., 184 (2012) 176.
45. Lagergren S., Handlingar, 24 (1898) 1.46. K. H. Boparai, J. Meera and M. O. Denis, J.
Hazard Mater., 186 (2011) 458.47. L. Ai-min, W. Hai-suo, Z. Quan-xing, Z,
Gen-cheng, L. Chao, F. Zheng-hao, L. Fu-qiang and C. Jin-long, Chinese J. of PolymerSci., 22 (2004) 259.