Embed Size (px)
Citation preview

Kinetics analysis and automated online screening of aminocarbonylation of aryl halides in flow
Article
Published Version
Creative Commons: Attribution 3.0 (CC-BY)
Open access
Moore, J. S., Smith, C. D. and Jensen, K. F. (2016) Kinetics analysis and automated online screening of aminocarbonylation of aryl halides in flow. Reaction Chemistry & Engineering, 1 (3). pp. 272-279. ISSN 2058-9883 doi: https://doi.org/10.1039/C6RE00007J Available at http://centaur.reading.ac.uk/56244/
It is advisable to refer to the publisher’s version if you intend to cite from the work. See Guidance on citing .Published version at: http://dx.doi.org/10.1039/C6RE00007J
To link to this article DOI: http://dx.doi.org/10.1039/C6RE00007J
Publisher: Royal Society of Chemistry
All outputs in CentAUR are protected by Intellectual Property Rights law, including copyright law. Copyright and IPR is retained by the creators or other copyright holders. Terms and conditions for use of this material are defined in

the End User Agreement .
www.reading.ac.uk/centaur
CentAUR
Central Archive at the University of Reading
Reading’s research outputs online

ReactionChemistry &Engineering
PAPER
Cite this: DOI: 10.1039/c6re00007j
Received 9th January 2016,Accepted 12th February 2016
DOI: 10.1039/c6re00007j
rsc.li/reaction-engineering
Kinetics analysis and automated online screeningof aminocarbonylation of aryl halides in flow†
Jason S. Moore,ab Christopher D. Smithac and Klavs F. Jensen*a
Temperature, pressure, gas stoichiometry, and residence time were varied to control the yield and product
distribution of the palladium-catalyzed aminocarbonylation of aromatic bromides in both a silicon micro-
reactor and a packed-bed tubular reactor. Automation of the system set points and product sampling en-
abled facile and repeatable reaction analysis with minimal operator supervision. It was observed that the re-
action was divided into two temperature regimes. An automated system was used to screen steady-state
conditions for offline analysis by gas chromatography to fit a reaction rate model. Additionally, a transient
temperature ramp method utilizing online infrared analysis was used, leading to more rapid determination
of the reaction activation energy of the lower temperature regimes. The entire reaction spanning both re-
gimes was modeled in good agreement with the experimental data.
Introduction
The carbonyl group is one of the key building blocks of na-ture, where it is essential for the construction of proteins,many polymers, and numerous drugs. The ubiquity of thesehigh value products has stimulated a demand for efficientnew routes and safe processes to produce this functionalgroup.1 Palladium-catalyzed carbonylation offers a rapid andmodular route for the union of three components (electro-phile, CO, and nucleophile) in an atom efficient manner(Scheme 1).2–5 The difficulties in handling toxic and flamma-ble gases like CO within pressure vessels for screening andeventual scale-up have led to the innovative use of alternativeCO sources including DMF,6,7 aldehydes,8 and MoIJCO)6.
9,10
Nevertheless, the simplicity, cost, and availability of carbonmonoxide gas make its continued use inevitable.
To address the control and containment of gases, a num-ber of publications have employed continuous flow technolo-gies due to the intrinsic advantages of the micro-scale, with asmall footprint suitable for installation in laboratory fumehoods. Recent advances include in situ generatedhydrogen11–13 and porous membranes14,15 for gas delivery,but the most focus has been on segmented flow.13,16–18
Herein, we report an automated screening system applica-ble for gas/liquid reactions in flow. Biphasic systems, espe-cially gas–liquid reactions, are of special interest due to themany variables and difficulties associated with such reac-tions. In batch systems, expensive and specialized equipmentis necessary to cope with the temperatures and pressures re-quired. The use of microreactors in gas–liquid reactions en-ables facile control over the temperature, pressure, and reac-tion time.19 The small size of the reactor permits hightemperatures and pressures to be routinely applied,20,21 en-abling a safe work environment and an expanded reactionspace with high reproducibility.22 For initial studies, sampleswere automatically collected for offline analysis and reactionconditions were adjusted, including temperature and reac-tion time, using a Labview-driven reaction system similar tosystems we have recently reported.23–25 The system was effec-tive for both silicon microreactors26,27 and packed-bed tubu-lar reactors and successfully used for the carbonylation of ar-omatic halides (Scheme 1).
The initial results from these studies were promising ininvestigating the scope of the carbonylation chemistry andgaining a qualitative understanding of the effects of severalparameters on the reaction. Further improvements and moreunderstanding were needed to generate a kinetic model
React. Chem. Eng.This journal is © The Royal Society of Chemistry 2016
aDepartment of Chemical Engineering, Massachusetts Institute of Technology, 77
Massachusetts Avenue, 66-342, Cambridge, MA 02139, USA.
E-mail: [email protected]; Fax: +1 617 258 8992b The Dow Chemical Company, 2301 North Brazosport Blvd., B-1603, Freeport,
TX, 77541 USAcDepartment of Chemistry, University of Reading, Whiteknights, Reading, RG6
6AD, UK
† Electronic supplementary information (ESI) available: Model details plus GCand IR spectra. See DOI: 10.1039/c6re00007j Scheme 1 General reaction scheme.
Ope
n A
cces
s A
rtic
le. P
ublis
hed
on 2
2 Fe
brua
ry 2
016.
Dow
nloa
ded
on 2
2/02
/201
6 11
:28:
28.
Thi
s ar
ticle
is li
cens
ed u
nder
a C
reat
ive
Com
mon
s A
ttrib
utio
n 3.
0 U
npor
ted
Lic
ence
.
View Article OnlineView Journal
React. Chem. Eng. This journal is © The Royal Society of Chemistry 2016
describing the process. This led to focusing on the amino-carbonylation of p-bromobenzonitrile with morpholine andthe incorporation of inline IR analysis and a continuous tem-perature ramp to rapidly determine activation energy.
System description
Liquid stream A (aryl halide, base, and internal standard inmorpholine) and liquid stream B (catalyst and ligand in tolu-ene) in 8 mL Harvard stainless steel syringes were driven(Harvard Apparatus PhD 2000) and mixed, whereupon theymet the gas stream (dispensed using a UNIT mass flow con-troller) ensuring a 1 : 1 volumetric gas–liquid ratio (1 : 1, v : v,g : l) at room temperature for consistency before passingthrough the reactor (Fig. 1). The outflow passed through a six-way valve attached to a 250 μL reagent loop and a Gilson FC204 fraction collector for sample analysis. The bulk of the re-action stream was collected in a Parr pressure vessel, with thesystem pressurized by an inert gas (N2) from a cylinder. Aslow bleed vent was also incorporated to dilute the CO and toaccount for the liquid displacement. The samples from thefraction collector were diluted with acetone and analyzed byGC (Agilent HP 6890), with the results calibrated to the inter-nal standard (naphthalene). The system was controlledthrough a Matlab (version 2010b) interface allowing auto-mated control of reaction time and temperature and the col-lection of the reaction aliquot for analysis.
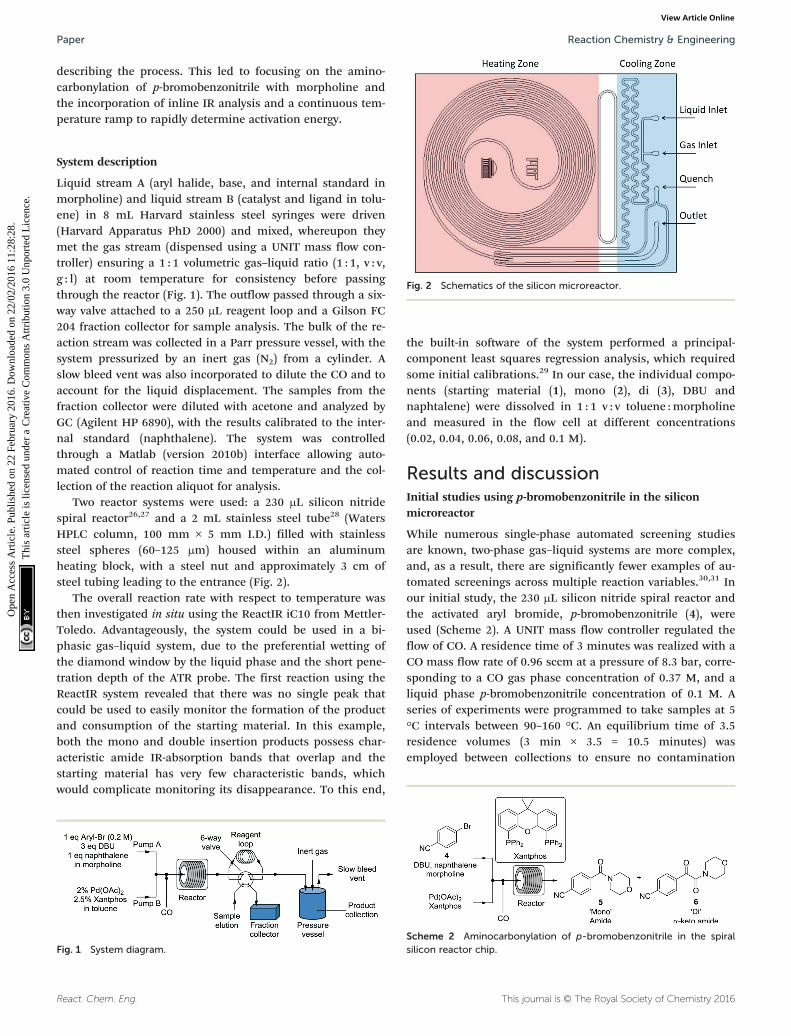
Two reactor systems were used: a 230 μL silicon nitridespiral reactor26,27 and a 2 mL stainless steel tube28 (WatersHPLC column, 100 mm × 5 mm I.D.) filled with stainlesssteel spheres (60–125 μm) housed within an aluminumheating block, with a steel nut and approximately 3 cm ofsteel tubing leading to the entrance (Fig. 2).
The overall reaction rate with respect to temperature wasthen investigated in situ using the ReactIR iC10 from Mettler-Toledo. Advantageously, the system could be used in a bi-phasic gas–liquid system, due to the preferential wetting ofthe diamond window by the liquid phase and the short pene-tration depth of the ATR probe. The first reaction using theReactIR system revealed that there was no single peak thatcould be used to easily monitor the formation of the productand consumption of the starting material. In this example,both the mono and double insertion products possess char-acteristic amide IR-absorption bands that overlap and thestarting material has very few characteristic bands, whichwould complicate monitoring its disappearance. To this end,
the built-in software of the system performed a principal-component least squares regression analysis, which requiredsome initial calibrations.29 In our case, the individual compo-nents (starting material (1), mono (2), di (3), DBU andnaphtalene) were dissolved in 1 : 1 v : v toluene :morpholineand measured in the flow cell at different concentrations(0.02, 0.04, 0.06, 0.08, and 0.1 M).
Results and discussionInitial studies using p-bromobenzonitrile in the siliconmicroreactor
While numerous single-phase automated screening studiesare known, two-phase gas–liquid systems are more complex,and, as a result, there are significantly fewer examples of au-tomated screenings across multiple reaction variables.30,31 Inour initial study, the 230 μL silicon nitride spiral reactor andthe activated aryl bromide, p-bromobenzonitrile (4), wereused (Scheme 2). A UNIT mass flow controller regulated theflow of CO. A residence time of 3 minutes was realized with aCO mass flow rate of 0.96 sccm at a pressure of 8.3 bar, corre-sponding to a CO gas phase concentration of 0.37 M, and aliquid phase p-bromobenzonitrile concentration of 0.1 M. Aseries of experiments were programmed to take samples at 5°C intervals between 90–160 °C. An equilibrium time of 3.5residence volumes (3 min × 3.5 = 10.5 minutes) wasemployed between collections to ensure no contamination
Fig. 1 System diagram.
Fig. 2 Schematics of the silicon microreactor.
Scheme 2 Aminocarbonylation of p-bromobenzonitrile in the spiralsilicon reactor chip.
Reaction Chemistry & EngineeringPaper
Ope
n A
cces
s A
rtic
le. P
ublis
hed
on 2
2 Fe
brua
ry 2
016.
Dow
nloa
ded
on 2
2/02
/201
6 11
:28:
28.
Thi
s ar
ticle
is li
cens
ed u
nder
a C
reat
ive
Com
mon
s A
ttrib
utio
n 3.
0 U
npor
ted
Lic
ence
.View Article Online

React. Chem. Eng.This journal is © The Royal Society of Chemistry 2016
between experiments (Fig. 3). As can be seen in Fig. 3, theproduct ratio demonstrates a substantial temperature depen-dence; above 130 °C, the proportion of the double insertionproduct (6) reduced substantially with respect to the monoproduct (5), in agreement with prior carbonylationstudies.32–35
These results prompted us to evaluate the pressure depen-dency of the reaction (Fig. 4). Continuing with constant 1 : 1,v : v, g : l, the pressures of 2.8, 5.5, 8.3, and 12.4 bar were ex-amined, where 2.8 bar was the lowest reliable flow rate of themass flow meter and 12.4 bar was the pressure limit of thesyringe pumps. The results demonstrate that decreasing COpressure leads to a higher overall rate and increasing thepressure leads to a higher proportion of the double insertionα-keto amide product (6).
Given the fixed 1 : 1, v : v, g : l proportions throughout thesestudies, a concern whether mass transfer limitations mightinfluence the observed trends was raised. To this end, reac-tions were repeated with varying liquid and gas slug lengths,which would change the mass transfer coefficient. No effecton the product distribution was observed, implying that themass transfer rate was greater than the intrinsic kinetic reac-tion rate.
Aminocarbonylations using the tubular reactor
Upon establishing our automated system, we examined thescope of the reaction by varying both the electrophilic andnucleophilic species. The tubular reactor with a residencetime of 8.3 minutes and a pressure of 8.3 bar was used. Thesix pairs of reactants were chosen to permit some compari-son between the different species (Table 1, Fig. 5).
As expected, electron deficient aryl halides (I and II)proved to be more reactive due to the relative ease of oxida-tive addition. The change from morpholine to cyclohexyl-amine did not result in a significant difference of reactivity.
The p-phenyl examples (III and IV) showed less reactivity.The more deactivated substrates involving p-methoxy-bromobenzene and 2-chloropyridine36 (V and VI) provedunreactive until high temperatures.
Kinetics
There is significant interest in understanding the kinetics ofthis gas–liquid system, especially to determine the effectsthat dictate the product ratio. For aryl bromides, the oxida-tive addition of palladium is often assumed to be therate-determining step35 after which the reaction bifurcates.
Fig. 3 Silicon reactor, τ = 3 min, PCO = 8.3 bar, usingp-bromobenzonitrile. Aryl bromide starting material ( ), amide product( ), α-keto amide product ( ), total product ( ), and mass balance ( ).
Fig. 4 Temperature and pressure dependency of (a) yield and (b)selectivity. 2.8 ( ), 5.5 ( ), 8.3 ( ), 12.4 ( ) bar.
Table 1 Substrate scope performed in the tubular reactor
I II
III IV
V VI
Reaction Chemistry & Engineering Paper
Ope
n A
cces
s A
rtic
le. P
ublis
hed
on 2
2 Fe
brua
ry 2
016.
Dow
nloa
ded
on 2
2/02
/201
6 11
:28:
28.
Thi
s ar
ticle
is li
cens
ed u
nder
a C
reat
ive
Com
mon
s A
ttrib
utio
n 3.
0 U
npor
ted
Lic
ence
.View Article Online

React. Chem. Eng. This journal is © The Royal Society of Chemistry 2016
Thus, overall conversion should be able to be modeled with-out needing to account for product selectivity (Scheme 3),and the rate of loss of starting material (ArX) can be writtenas a first-order reaction in both aryl halide and palladium(eqn (1)). Furthermore, we observed that as the pressure ofcarbon monoxide increased, the rate of the reaction de-creased, implying that carbon monoxide was reversibly poi-soning the palladium catalyst. The next simplification was toassume a steady state approximation for the active palladiumcatalyst, LPd. By using this approximation, an expression forconcentration of active palladium, [Pd] (eqn (2)), is foundand can be substituted in eqn (1). This leads to eqn (3), apseudo first-order expression for the rate of reaction:
(1)
(2)
(3)
(4)
The result of this simplification predicts that the ob-served rate, kobs, is proportional to the initial concentrationof the palladium used and inversely proportion to the con-centration of the carbon monoxide in the liquid phase ofthe system. This assumes no palladium deactivation. Nopalladium black was observed, and we have shown previ-ously in a similar system that palladium can be recycledseveral times with no loss of activity.37 With varying pres-sures of carbon monoxide Henry's Law predicts that [CO] ∝CO pressure; hence a higher pressure will adversely affectthe rate of the reaction. The temperature dependence of theHenry's Law constant for the solvent system was modeledusing Aspen Plus and demonstrated only a slight reductionin solution phase CO concentration at the highest reactiontemperatures studied (details provided in ESI†). Finally, af-ter coordination of the first molecule of carbon monoxidethe two products were formed.
The reaction was run in the tubular reactor at 8.3 bar andwith 8.3 minutes residence time. With the aid of the in situmonitoring, we continuously increased the reaction tempera-ture at constant residence time, which would be analogous toa time profile found in batch studies.25 In this example, thetemperature was increased by 1 °C every 2 minutes (Fig. 6).The temperature was held at 104 °C for 4 minutes to assist inaligning temperature and concentration data. Additionally,the concentration profiles flatten at this point, showing thatthe system is never operating far from steady state. The pat-tern observed was the same as for the earlier steady stateanalysis, where the ratio of mono/di insertion products re-mains constant until approximately 120 °C, above which theratio of mono increases substantially. However, the IR
Fig. 5 Amide yield in substrate scope examination. Tubular reactor:τ = 8.3 min, P = 8.3 bar. In reference to the combinations in Table 1: I( ), II ( ), III ( ), IV ( ), V ( ), VI ( ).
Scheme 3 Simplified model of the aminocarbonylation reaction.
Fig. 6 ReactIR data for aminocarbonylation of p-bromobenzonitrilewith morpholine under an increasing temperature (1 °C every 2minutes) in the tubular reactor (8.3 min residence time, 8.3 bar CO).Starting material ( ), mono product ( ), di product ( ), mass balance( ), total product ( ), and temperature ( ).
Reaction Chemistry & EngineeringPaper
Ope
n A
cces
s A
rtic
le. P
ublis
hed
on 2
2 Fe
brua
ry 2
016.
Dow
nloa
ded
on 2
2/02
/201
6 11
:28:
28.
Thi
s ar
ticle
is li
cens
ed u
nder
a C
reat
ive
Com
mon
s A
ttrib
utio
n 3.
0 U
npor
ted
Lic
ence
.View Article Online
React. Chem. Eng.This journal is © The Royal Society of Chemistry 2016
analysis is less sensitive to lower concentrations, especiallythe starting material, causing significant noise beyond ap-proximately 95% conversion. Lastly, the data after reactionheat was switched off suggests that even more rapid analysisunder true transient conditions is possible.
From these data it is possible to form an Arrhenius plot oflnIJkobs) vs. 1/T to determine the activation energy from theslope (see Fig. S5†). In principal, the pre-exponential factorcan also be determined (the intercept of y-axis), but the sub-stantial extrapolation required can present significant errors.The system demonstrates a steady slope from 80 °C to 120°C, but beyond 120 °C there appears to be a change in therate-limiting step. The system was applied at three conditionsas described in Table 2, resulting in similar activation ener-gies with relatively small error bars represented by one stan-dard deviation.
Similar Arrhenius analyses were performed at steady statefor reactions under different conditions in the microreactorand tubular reactor using offline GC analysis.
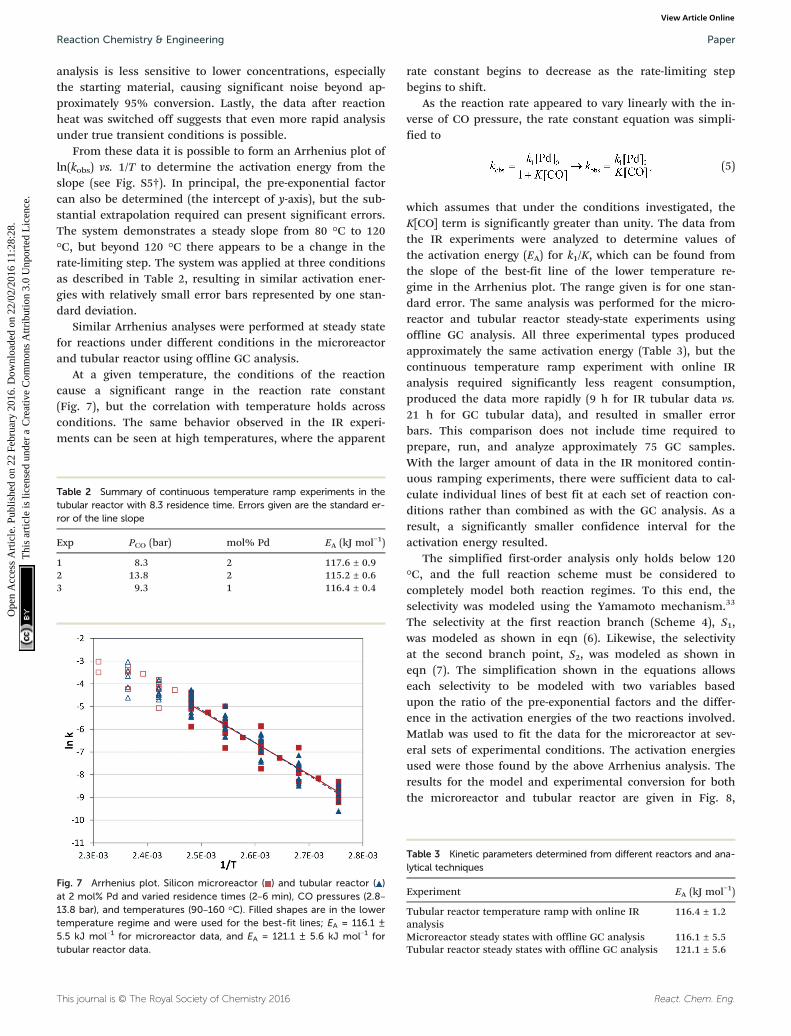
At a given temperature, the conditions of the reactioncause a significant range in the reaction rate constant(Fig. 7), but the correlation with temperature holds acrossconditions. The same behavior observed in the IR experi-ments can be seen at high temperatures, where the apparent
rate constant begins to decrease as the rate-limiting stepbegins to shift.
As the reaction rate appeared to vary linearly with the in-verse of CO pressure, the rate constant equation was simpli-fied to
(5)
which assumes that under the conditions investigated, theK[CO] term is significantly greater than unity. The data fromthe IR experiments were analyzed to determine values ofthe activation energy (EA) for k1/K, which can be found fromthe slope of the best-fit line of the lower temperature re-gime in the Arrhenius plot. The range given is for one stan-dard error. The same analysis was performed for the micro-reactor and tubular reactor steady-state experiments usingoffline GC analysis. All three experimental types producedapproximately the same activation energy (Table 3), but thecontinuous temperature ramp experiment with online IRanalysis required significantly less reagent consumption,produced the data more rapidly (9 h for IR tubular data vs.21 h for GC tubular data), and resulted in smaller errorbars. This comparison does not include time required toprepare, run, and analyze approximately 75 GC samples.With the larger amount of data in the IR monitored contin-uous ramping experiments, there were sufficient data to cal-culate individual lines of best fit at each set of reaction con-ditions rather than combined as with the GC analysis. As aresult, a significantly smaller confidence interval for theactivation energy resulted.
The simplified first-order analysis only holds below 120°C, and the full reaction scheme must be considered tocompletely model both reaction regimes. To this end, theselectivity was modeled using the Yamamoto mechanism.33
The selectivity at the first reaction branch (Scheme 4), S1,was modeled as shown in eqn (6). Likewise, the selectivityat the second branch point, S2, was modeled as shown ineqn (7). The simplification shown in the equations allowseach selectivity to be modeled with two variables basedupon the ratio of the pre-exponential factors and the differ-ence in the activation energies of the two reactions involved.Matlab was used to fit the data for the microreactor at sev-eral sets of experimental conditions. The activation energiesused were those found by the above Arrhenius analysis. Theresults for the model and experimental conversion for boththe microreactor and tubular reactor are given in Fig. 8,
Fig. 7 Arrhenius plot. Silicon microreactor ( ) and tubular reactor ( )at 2 mol% Pd and varied residence times (2–6 min), CO pressures (2.8–13.8 bar), and temperatures (90–160 °C). Filled shapes are in the lowertemperature regime and were used for the best-fit lines; EA = 116.1 ±
5.5 kJ mol−1 for microreactor data, and EA = 121.1 ± 5.6 kJ mol−1 fortubular reactor data.
Table 3 Kinetic parameters determined from different reactors and ana-lytical techniques
Experiment EA (kJ mol−1)
Tubular reactor temperature ramp with online IRanalysis
116.4 ± 1.2
Microreactor steady states with offline GC analysis 116.1 ± 5.5Tubular reactor steady states with offline GC analysis 121.1 ± 5.6
Table 2 Summary of continuous temperature ramp experiments in thetubular reactor with 8.3 residence time. Errors given are the standard er-ror of the line slope
Exp PCO (bar) mol% Pd EA (kJ mol−1)
1 8.3 2 117.6 ± 0.92 13.8 2 115.2 ± 0.63 9.3 1 116.4 ± 0.4
Reaction Chemistry & Engineering Paper
Ope
n A
cces
s A
rtic
le. P
ublis
hed
on 2
2 Fe
brua
ry 2
016.
Dow
nloa
ded
on 2
2/02
/201
6 11
:28:
28.
Thi
s ar
ticle
is li
cens
ed u
nder
a C
reat
ive
Com
mon
s A
ttrib
utio
n 3.
0 U
npor
ted
Lic
ence
.View Article Online

React. Chem. Eng. This journal is © The Royal Society of Chemistry 2016
with model parameters in Table 4. The selectivity for themicroreactor results are shown in Fig. 9. The model trends
for conversion and selectivity match the experimental data.Additionally, as the tubular reactor conversion data werenot used to fit the model, instead these points served as avalidation set for the model.
(6)
Fig. 8 Summary of model predictions (curves) and experimental data(points) for conversion of a) microreactor at: 2% Pd, 2.8 bar, 2 min ( );2% Pd, 8.3 bar, 3 min ( ); 2% Pd, 5.5 bar, 2 min ( ); 2% Pd, 8.3 bar,2 min ( ); 2% Pd, 12.4 bar, 2 min ( ); 1% Pd, 8.3 bar, 3 min ( ); 1% Pd,8.3 bar, 2 min ( ); and 0.5% Pd, 8.3 bar, 2 min (□) and b) tubularreactor at 2% Pd, 3.4 bar, 2 min ( ); 2% Pd, 13.8 bar, 8.3 min ( );2% Pd, 8.3 bar, 4 min ( ); 2% Pd, 5.5 bar, 2 min ( ); 1% Pd, 8.3 bar,2 min ( ); 2% Pd, 8.3 bar, 3 min ( ); 2% Pd, 8.3 bar, 2 min ( ); and2% Pd, 12.4 bar, 2 min (□).
Table 4 Best-fit model parameters
k0[1] 1.33 × 10¹⁷ L mol−1 s−1
EA[1] 116.4 kJ mol−1
k0[4] 1.11 × 10⁶ s−1
EA[4] 55.6 kJ mol−1
(EA[2] − EA
[3]) 107 kJ mol−1
k0[3]/k0
[2] 2.42 × 10⁻¹³
(EA[5] − EA
[6]) 38.7 kJ mol−1
k0[6]/k0
[5] 2.01 × 10⁻⁴
Fig. 9 Summary of model and experimental selectivity in themicroreactor for a) mono product and b) di product. Symbolscorrespond to those in Fig. 8a.
Scheme 4 Model to which kinetic parameters were fitted based uponthe Yamamoto mechanism.33
Reaction Chemistry & EngineeringPaper
Ope
n A
cces
s A
rtic
le. P
ublis
hed
on 2
2 Fe
brua
ry 2
016.
Dow
nloa
ded
on 2
2/02
/201
6 11
:28:
28.
Thi
s ar
ticle
is li
cens
ed u
nder
a C
reat
ive
Com
mon
s A
ttrib
utio
n 3.
0 U
npor
ted
Lic
ence
.View Article Online

React. Chem. Eng.This journal is © The Royal Society of Chemistry 2016
(7)
The change in trends around 120 °C can be explained as achange in rate-determining step by the combined effects oftemperature on S1 and the subsequent reactions. Thus, astemperature increases, the reaction increasingly favors theupper pathway through the more entropically favored inter-mediate that leads solely to the mono product. However, thenext step in the mechanism has a slower rate than the oxida-tive addition, causing that to become the rate-limiting step.Further model details are provided in the ESI.†
Conclusions
We have successfully demonstrated an in-line automatedscreening platform suitable for continuous gas–liquid flowsystems. The applicability of the system was proven for thesuccessful carbonylation of aryl bromides. The effect of tem-perature, residence time, gas stoichiometry, and pressure canbe easily controlled with minimum operator intervention be-yond the initial start-up and shut-down processes. It isexpected that the facile control of the reaction conditionsand ease of data capture will have a significant impact on thestudy of reaction kinetics leading to more efficient catalyticprocesses.
Having successfully demonstrated the automated screen-ing system using both IR and GC analysis, the kinetics of thepalladium-catalyzed aminocarbonylation of aryl bromideswere further investigated. The reaction was found to be di-vided into two temperature regimes. For the lower tempera-ture regime, this study compared traditional, steady-state ex-periments paired with offline GC analysis to transienttemperature ramp experiments paired with online IR analysisand found that, while both methods provided similar activa-tion energies, the latter method was significantly more effi-cient in both time and reagents. Additionally, both the con-version and selectivity for both regimes were modeled ingood agreement with experimental data. Below 120 °C, theoxidative addition was found to be the rate-limiting step, withnearly equal selectivity for the two products. However, athigher temperatures, the selectivity shifted to a pathway thatprovides only the mono product from a slower intermediatestep, reducing the overall reaction rate.
Acknowledgements
The support of the Novartis-MIT Centre for ContinuousManufacturing is acknowledged. CDS and KFJ thank Amgen,Thousand Oaks for initial sponsorship of this project.
Notes and references
1 C. L. Allen and J. M. Williams, Chem. Soc. Rev., 2011, 40,3405–3415.
2 A. Brennführer, H. Neumann and M. Beller, Angew. Chem.,Int. Ed., 2009, 48, 4114–4133.
3 C. F. J. Barnard, Organometallics, 2008, 27, 5402–5422.4 C. F. J. Barnard, Org. Process Res. Dev., 2008, 12, 566–574.5 M. Beller and M. Eckert, Angew. Chem., Int. Ed., 2000, 39,
1010–1027.6 Y. Q. Wan, M. Alterman, M. Larhed and A. Hallberg, J. Org.
Chem., 2002, 67, 6232–6235.7 Y. Wan, M. Alterman, M. Larhed and A. Hallberg, J. Comb.
Chem., 2003, 5, 82–84.8 J. Ruan and J. Xiao, Acc. Chem. Res., 2011, 44, 614–626.9 P. Appukkuttan, L. Axelsson, E. Van der Eycken and M.
Larhed, Tetrahedron Lett., 2008, 49, 5625–5628.10 W. Ren and M. Yamane, J. Org. Chem., 2010, 75, 8410–8415.11 B. Desai and C. O. Kappe, J. Comb. Chem., 2005, 7, 641–643.12 S. Saaby, K. R. Knudsen, M. Ladlow and S. V. Ley, Chem.
Commun., 2005, 2909–2911.13 C. Csajági, B. Borcsek, K. Niesz, I. Kovács, Z. Székelyhidi, Z.
Bajkó, L. Ürge and F. Darvas, Org. Lett., 2008, 10,1589–1592.
14 P. Koos, U. Gross, U. A. Polyzos, M. O'Brien, I. Baxendaleand S. V. Ley, Org. Biomol. Chem., 2011, 9, 6903–6908.
15 M. O'Brien, N. Taylor, A. Polyzos, I. R. Baxendale and S. V.Ley, Chem. Sci., 2011, 2, 1250–1257.
16 P. W. Miller, N. J. Long, A. J. de Mello, R. Vilar, H. Audrain,D. Bender, J. Passchier and A. Gee, Angew. Chem., 2007, 119,2933–2936.
17 W. M. Philip, E. J. Lucy, J. D. Andrew, D. G. Antony, J. L.Nicholas and V. Ramon, Adv. Synth. Catal., 2009, 351,3260–3268.
18 J. Balogh, A. Kuik, L. Ürge, F. Darvas, J. Bakos and R. Skoda-Földes, J. Mol. Catal. A: Chem., 2009, 302, 76–79.
19 R. L. Hartman, J. P. McMullen and K. F. Jensen, Angew.Chem., Int. Ed., 2011, 50, 7502–7519.
20 S. Marre, A. Adamo, S. Basak, C. Aymonier and K. F. Jensen,Ind. Eng. Chem. Res., 2010, 49, 11310–11320.
21 F. Trachsel, C. Hutter and P. R. von Rohr, Chem. Eng. J.,2008, 135, 309–316.
22 K. Geyer, T. Gustafsson and P. H. Seeberger, Synlett,2009, 15, 2382–2391.
23 J. S. Moore and K. F. Jensen, Org. Process Res. Dev., 2012, 16,1409–1415.
24 N. Heublein, J. S. Moore, C. D. Smith and K. F. Jensen, RSCAdv., 2014, 4, 63627–63631.
25 J. S. Moore and K. F. Jensen, Angew. Chem., Int. Ed.,2014, 53, 470–473.
26 M. W. Bedore, N. Zaborenko, K. F. Jensen and T. F. Jamison,Org. Process Res. Dev., 2010, 14, 432–440.
27 N. Zaborenko, M. W. Bedore, T. F. Jamison and K. F. Jensen,Org. Process Res. Dev., 2011, 15, 131–139.
28 J. R. Naber and S. L. Buchwald, Angew. Chem., Int. Ed.,2010, 49, 9469–9474.
29 DS Series Sampling Technology Mettler Toledo, LLC, http://us.mt.com/us/en/home/products/L1_AutochemProducts/L2_insituSpectrocopy/AgX-FiberConduit-Sampling-Technology-DS-Series.html, Accessed Nov. 7, 2010.
Reaction Chemistry & Engineering Paper
Ope
n A
cces
s A
rtic
le. P
ublis
hed
on 2
2 Fe
brua
ry 2
016.
Dow
nloa
ded
on 2
2/02
/201
6 11
:28:
28.
Thi
s ar
ticle
is li
cens
ed u
nder
a C
reat
ive
Com
mon
s A
ttrib
utio
n 3.
0 U
npor
ted
Lic
ence
.View Article Online

React. Chem. Eng. This journal is © The Royal Society of Chemistry 2016
30 J. P. McMullen and K. F. Jensen, Annu. Rev. Anal. Chem.,2010, 3, 19–42.
31 E. R. Murphy, J. R. Martinelli, N. Zaborenko, S. L. Buchwaldand K. F. Jensen, Angew. Chem., Int. Ed., 2007, 46,1734–1737.
32 F. Ozawa, T. Sugimoto, Y. Yuasa, M. Santra, T. Yamamotoand A. Yamamoto, Organometallics, 1984, 3, 683–692.
33 Y.-S. Lin and A. Yamamoto, Organometallics, 1998, 17,3466–3478.
34 F. Ozawa, N. Kawasaki, H. Okamoto, T. Yamamoto and A.Yamamoto, Organometallics, 1987, 6, 1640–1651.
35 F. Ozawa, H. Soyama, H. Yanagihara, I. Aoyama, H. Takino,K. Izawa, T. Yamamoto and A. Yamamoto, J. Am. Chem. Soc.,1985, 107, 3235–3245.
36 M. Beller, W. Mägerlein, A. F. Indolese and C. Fischer,Synthesis, 2001, 2001, 1098–1109.
37 P. Li, J. S. Moore and K. F. Jensen, ChemCatChem, 2013, 5,1729–1733.
Reaction Chemistry & EngineeringPaper
Ope
n A
cces
s A
rtic
le. P
ublis
hed
on 2
2 Fe
brua
ry 2
016.
Dow
nloa
ded
on 2
2/02
/201
6 11
:28:
28.
Thi
s ar
ticle
is li
cens
ed u
nder
a C
reat
ive
Com
mon
s A
ttrib
utio
n 3.
0 U
npor
ted
Lic
ence
.View Article Online