Embed Size (px)
Citation preview
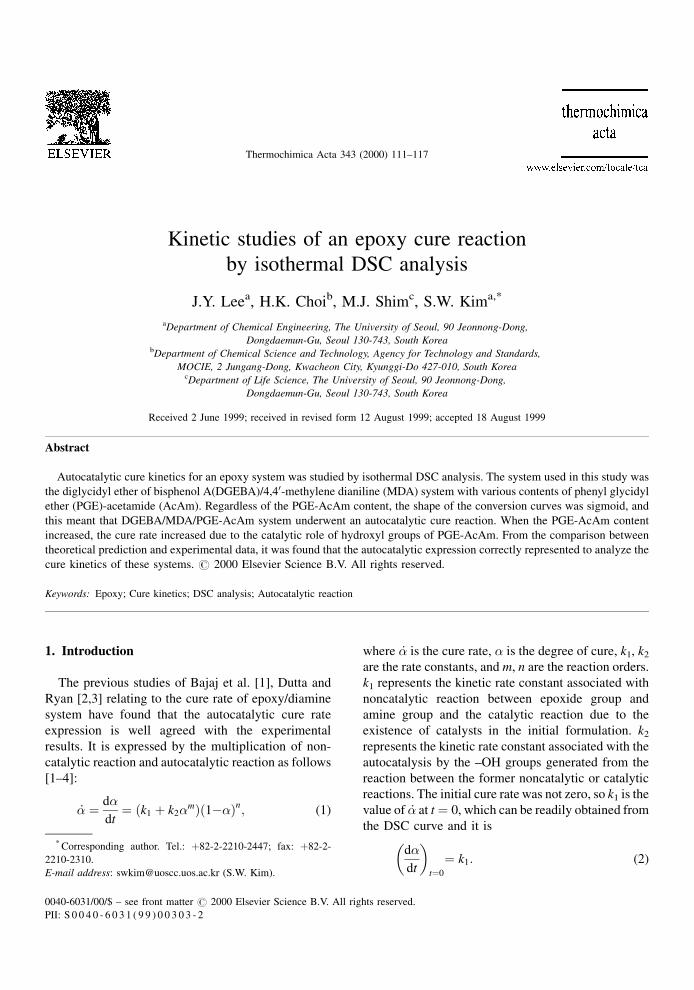
Kinetic studies of an epoxy cure reactionby isothermal DSC analysis
J.Y. Leea, H.K. Choib, M.J. Shimc, S.W. Kima,*
aDepartment of Chemical Engineering, The University of Seoul, 90 Jeonnong-Dong,
Dongdaemun-Gu, Seoul 130-743, South KoreabDepartment of Chemical Science and Technology, Agency for Technology and Standards,
MOCIE, 2 Jungang-Dong, Kwacheon City, Kyunggi-Do 427-010, South KoreacDepartment of Life Science, The University of Seoul, 90 Jeonnong-Dong,
Dongdaemun-Gu, Seoul 130-743, South Korea
Received 2 June 1999; received in revised form 12 August 1999; accepted 18 August 1999
Abstract
Autocatalytic cure kinetics for an epoxy system was studied by isothermal DSC analysis. The system used in this study was
the diglycidyl ether of bisphenol A(DGEBA)/4,40-methylene dianiline (MDA) system with various contents of phenyl glycidyl
ether (PGE)-acetamide (AcAm). Regardless of the PGE-AcAm content, the shape of the conversion curves was sigmoid, and
this meant that DGEBA/MDA/PGE-AcAm system underwent an autocatalytic cure reaction. When the PGE-AcAm content
increased, the cure rate increased due to the catalytic role of hydroxyl groups of PGE-AcAm. From the comparison between
theoretical prediction and experimental data, it was found that the autocatalytic expression correctly represented to analyze the
cure kinetics of these systems. # 2000 Elsevier Science B.V. All rights reserved.
Keywords: Epoxy; Cure kinetics; DSC analysis; Autocatalytic reaction
1. Introduction
The previous studies of Bajaj et al. [1], Dutta and
Ryan [2,3] relating to the cure rate of epoxy/diamine
system have found that the autocatalytic cure rate
expression is well agreed with the experimental
results. It is expressed by the multiplication of non-
catalytic reaction and autocatalytic reaction as follows
[1±4]:
_� � d�
dt� �k1 � k2�
m��1ÿ��n; (1)
where _� is the cure rate, � is the degree of cure, k1, k2
are the rate constants, and m, n are the reaction orders.
k1 represents the kinetic rate constant associated with
noncatalytic reaction between epoxide group and
amine group and the catalytic reaction due to the
existence of catalysts in the initial formulation. k2
represents the kinetic rate constant associated with the
autocatalysis by the ±OH groups generated from the
reaction between the former noncatalytic or catalytic
reactions. The initial cure rate was not zero, so k1 is the
value of _� at t � 0, which can be readily obtained from
the DSC curve and it is
d�
dt
� �t�0
� k1: (2)
Thermochimica Acta 343 (2000) 111±117
* Corresponding author. Tel.: �82-2-2210-2447; fax: �82-2-
2210-2310.
E-mail address: [email protected] (S.W. Kim).
0040-6031/00/$ ± see front matter # 2000 Elsevier Science B.V. All rights reserved.
PII: S 0 0 4 0 - 6 0 3 1 ( 9 9 ) 0 0 3 0 3 - 2
To determine the other kinetic parameters, the
DSC results were introduced to the following equa-
tions [2±4]:
m� n � 2; (3)
m �ln
_�p=�1ÿ�p�2ÿmÿk1
�2ÿm�k1�1ÿmp =�mÿ�p�
!ln�p
; (4)
k2 ��2ÿm�k1�
1ÿmp
mÿ2�p
; (5)
where �p is the degree of cure at exothermic peak
and _�p is the cure rate at the exothermic peak. �p and
_�p were easily obtained from the isothermal DSC
curve.
Epoxy resins are used in the ®elds of adhesives,
coatings, electrical insulators, encapsulants, structural
applications, automobiles, aircrafts, etc. and many
researchers have investigated to develop new epoxy
resins of high performance [5±7]. To improve the
mechanical, thermal and electrical properties, epoxy
resins or/and curing agents are modi®ed by the
following methods: (1) introduction of reactive
additives, (2) incorporation of reactive liquid rubbers,
and (3) mixing with different epoxy and curing
agent. In this study, epoxy resin was modi®ed by
phenyl glycidyl ether (PGE)-acetamide (AcAm) as
a reactive additive and the effect of ±OH group
in PGE-AcAm on the cure rate of diglycidyl ether
of bisphenol A(DGEBA)/4,40-methylene dianiline
(MDA) system was investigated.
2. Experimental
The epoxy resin was diglycidyl ether of bisphenol
A(DGEBA) type Epon 828 supplied by Shell and the
curing agent was 4,40-methylene dianiline (MDA).
Phenyl glycidyl ether (PGE)-acetamide (AcAm)
was used as an additive [5,6].
DGEBA was well mixed with both 30 phr of MDA
and various contents of PGE-AcAM, where the unit
phr is an abbreviation of `̀ part per one hundred base
resin'', and here DGEBA is a base resin. They were
stored atÿ138C to prevent the cure reaction during the
storage. To measure the total heat, QT, evolved during
the complete cure, dynamic DSC analysis was carried
out from 308C to 3508C at the heating rate of
108C/min and to measure cumulative heat, Q, at a
time, isothermal DSC analyses were performed at
808C, 908C, 1008C, 1108C and 1208C. Based upon
the assumption that the heat evolved at any time
during the cure reaction is directly proportional to
the extent of monomer conversion, the degree of
conversion is � � Q/QT and the differential cure rate
is _� � d�=dt � �1=QT��dQ=dt� [7,8].
3. Results and discussion
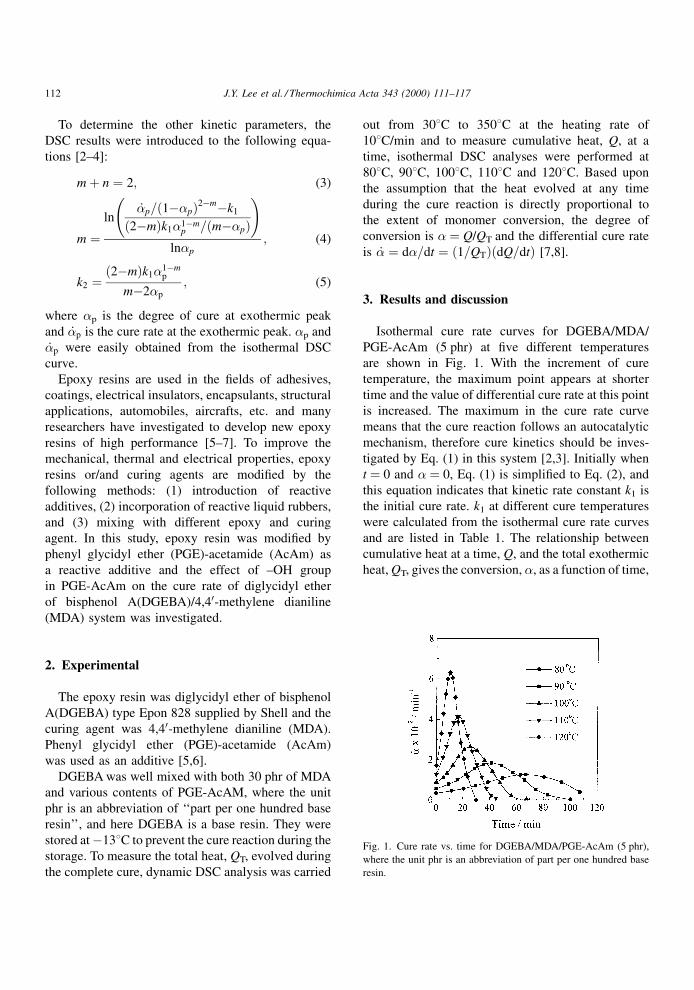
Isothermal cure rate curves for DGEBA/MDA/
PGE-AcAm (5 phr) at ®ve different temperatures
are shown in Fig. 1. With the increment of cure
temperature, the maximum point appears at shorter
time and the value of differential cure rate at this point
is increased. The maximum in the cure rate curve
means that the cure reaction follows an autocatalytic
mechanism, therefore cure kinetics should be inves-
tigated by Eq. (1) in this system [2,3]. Initially when
t � 0 and � � 0, Eq. (1) is simpli®ed to Eq. (2), and
this equation indicates that kinetic rate constant k1 is
the initial cure rate. k1 at different cure temperatures
were calculated from the isothermal cure rate curves
and are listed in Table 1. The relationship between
cumulative heat at a time, Q, and the total exothermic
heat, QT, gives the conversion, �, as a function of time,
Fig. 1. Cure rate vs. time for DGEBA/MDA/PGE-AcAm (5 phr),
where the unit phr is an abbreviation of part per one hundred base
resin.
112 J.Y. Lee et al. / Thermochimica Acta 343 (2000) 111±117
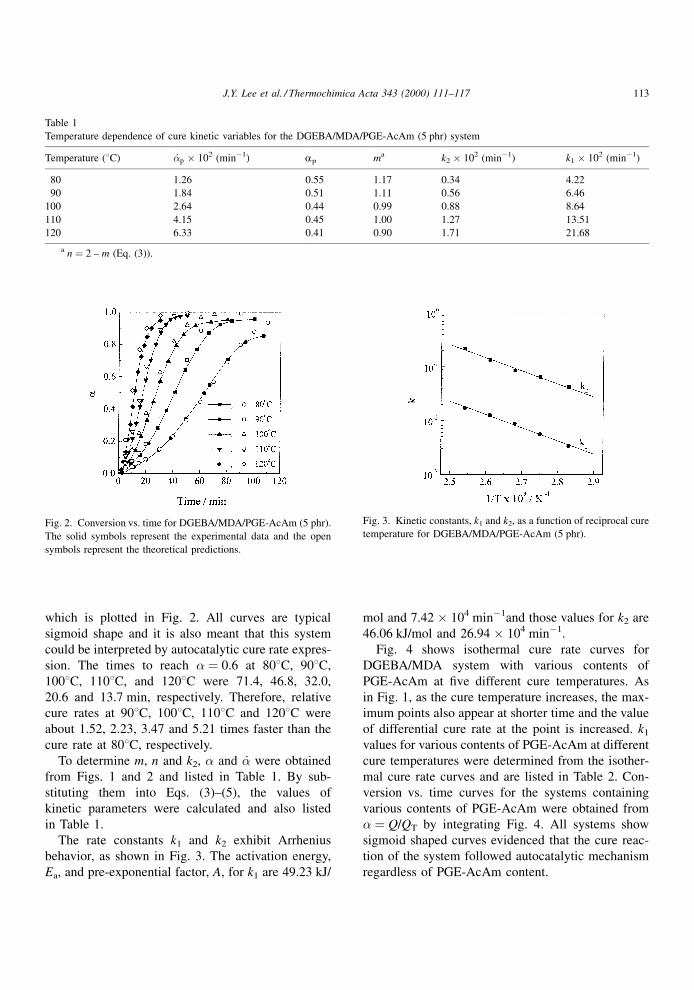
which is plotted in Fig. 2. All curves are typical
sigmoid shape and it is also meant that this system
could be interpreted by autocatalytic cure rate expres-
sion. The times to reach � � 0.6 at 808C, 908C,
1008C, 1108C, and 1208C were 71.4, 46.8, 32.0,
20.6 and 13.7 min, respectively. Therefore, relative
cure rates at 908C, 1008C, 1108C and 1208C were
about 1.52, 2.23, 3.47 and 5.21 times faster than the
cure rate at 808C, respectively.
To determine m, n and k2, � and _� were obtained
from Figs. 1 and 2 and listed in Table 1. By sub-
stituting them into Eqs. (3)±(5), the values of
kinetic parameters were calculated and also listed
in Table 1.
The rate constants k1 and k2 exhibit Arrhenius
behavior, as shown in Fig. 3. The activation energy,
Ea, and pre-exponential factor, A, for k1 are 49.23 kJ/
mol and 7.42 � 104 minÿ1and those values for k2 are
46.06 kJ/mol and 26.94 � 104 minÿ1.
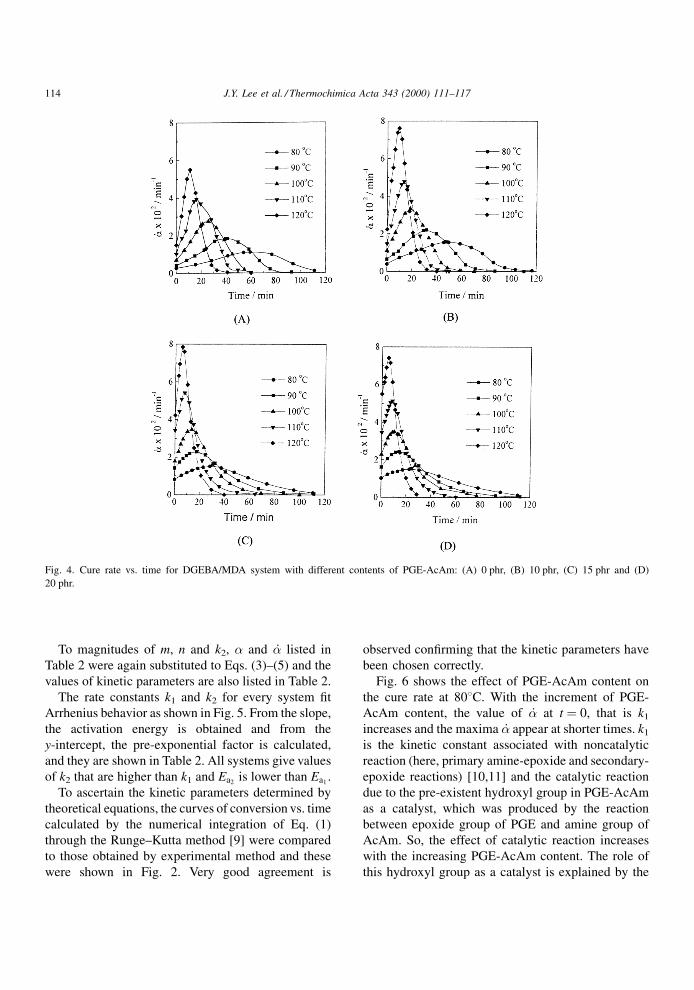
Fig. 4 shows isothermal cure rate curves for
DGEBA/MDA system with various contents of
PGE-AcAm at ®ve different cure temperatures. As
in Fig. 1, as the cure temperature increases, the max-
imum points also appear at shorter time and the value
of differential cure rate at the point is increased. k1
values for various contents of PGE-AcAm at different
cure temperatures were determined from the isother-
mal cure rate curves and are listed in Table 2. Con-
version vs. time curves for the systems containing
various contents of PGE-AcAm were obtained from
� � Q/QT by integrating Fig. 4. All systems show
sigmoid shaped curves evidenced that the cure reac-
tion of the system followed autocatalytic mechanism
regardless of PGE-AcAm content.
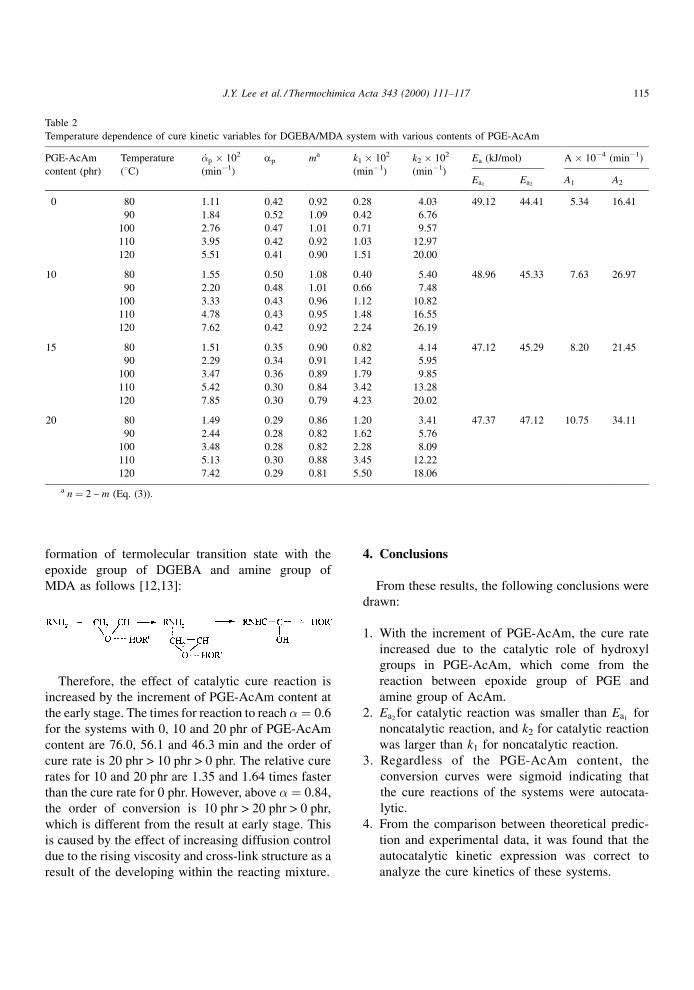
Table 1
Temperature dependence of cure kinetic variables for the DGEBA/MDA/PGE-AcAm (5 phr) system
Temperature (8C) _�p � 102 (minÿ1) ap ma k2 � 102 (minÿ1) k1 � 102 (minÿ1)
80 1.26 0.55 1.17 0.34 4.22
90 1.84 0.51 1.11 0.56 6.46
100 2.64 0.44 0.99 0.88 8.64
110 4.15 0.45 1.00 1.27 13.51
120 6.33 0.41 0.90 1.71 21.68
a n � 2 ± m (Eq. (3)).
Fig. 2. Conversion vs. time for DGEBA/MDA/PGE-AcAm (5 phr).
The solid symbols represent the experimental data and the open
symbols represent the theoretical predictions.
Fig. 3. Kinetic constants, k1 and k2, as a function of reciprocal cure
temperature for DGEBA/MDA/PGE-AcAm (5 phr).
J.Y. Lee et al. / Thermochimica Acta 343 (2000) 111±117 113
To magnitudes of m, n and k2, � and _� listed in
Table 2 were again substituted to Eqs. (3)±(5) and the
values of kinetic parameters are also listed in Table 2.
The rate constants k1 and k2 for every system ®t
Arrhenius behavior as shown in Fig. 5. From the slope,
the activation energy is obtained and from the
y-intercept, the pre-exponential factor is calculated,
and they are shown in Table 2. All systems give values
of k2 that are higher than k1 and Ea2is lower than Ea1
.
To ascertain the kinetic parameters determined by
theoretical equations, the curves of conversion vs. time
calculated by the numerical integration of Eq. (1)
through the Runge±Kutta method [9] were compared
to those obtained by experimental method and these
were shown in Fig. 2. Very good agreement is
observed con®rming that the kinetic parameters have
been chosen correctly.
Fig. 6 shows the effect of PGE-AcAm content on
the cure rate at 808C. With the increment of PGE-
AcAm content, the value of _� at t � 0, that is k1
increases and the maxima _� appear at shorter times. k1
is the kinetic constant associated with noncatalytic
reaction (here, primary amine-epoxide and secondary-
epoxide reactions) [10,11] and the catalytic reaction
due to the pre-existent hydroxyl group in PGE-AcAm
as a catalyst, which was produced by the reaction
between epoxide group of PGE and amine group of
AcAm. So, the effect of catalytic reaction increases
with the increasing PGE-AcAm content. The role of
this hydroxyl group as a catalyst is explained by the
Fig. 4. Cure rate vs. time for DGEBA/MDA system with different contents of PGE-AcAm: (A) 0 phr, (B) 10 phr, (C) 15 phr and (D)
20 phr.
114 J.Y. Lee et al. / Thermochimica Acta 343 (2000) 111±117
formation of termolecular transition state with the
epoxide group of DGEBA and amine group of
MDA as follows [12,13]:
Therefore, the effect of catalytic cure reaction is
increased by the increment of PGE-AcAm content at
the early stage. The times for reaction to reach � � 0.6
for the systems with 0, 10 and 20 phr of PGE-AcAm
content are 76.0, 56.1 and 46.3 min and the order of
cure rate is 20 phr > 10 phr > 0 phr. The relative cure
rates for 10 and 20 phr are 1.35 and 1.64 times faster
than the cure rate for 0 phr. However, above � � 0.84,
the order of conversion is 10 phr > 20 phr > 0 phr,
which is different from the result at early stage. This
is caused by the effect of increasing diffusion control
due to the rising viscosity and cross-link structure as a
result of the developing within the reacting mixture.
4. Conclusions
From these results, the following conclusions were
drawn:
1. With the increment of PGE-AcAm, the cure rate
increased due to the catalytic role of hydroxyl
groups in PGE-AcAm, which come from the
reaction between epoxide group of PGE and
amine group of AcAm.
2. Ea2for catalytic reaction was smaller than Ea1
for
noncatalytic reaction, and k2 for catalytic reaction
was larger than k1 for noncatalytic reaction.
3. Regardless of the PGE-AcAm content, the
conversion curves were sigmoid indicating that
the cure reactions of the systems were autocata-
lytic.
4. From the comparison between theoretical predic-
tion and experimental data, it was found that the
autocatalytic kinetic expression was correct to
analyze the cure kinetics of these systems.
Table 2
Temperature dependence of cure kinetic variables for DGEBA/MDA system with various contents of PGE-AcAm
PGE-AcAm Temperature _�p � 102 ap ma k1 � 102 k2 � 102 Ea (kJ/mol) A � 10ÿ4 (minÿ1)
content (phr) (8C) (minÿ1) (minÿ1) (minÿ1)Ea1
Ea2A1 A2
0 80 1.11 0.42 0.92 0.28 4.03 49.12 44.41 5.34 16.41
90 1.84 0.52 1.09 0.42 6.76
100 2.76 0.47 1.01 0.71 9.57
110 3.95 0.42 0.92 1.03 12.97
120 5.51 0.41 0.90 1.51 20.00
10 80 1.55 0.50 1.08 0.40 5.40 48.96 45.33 7.63 26.97
90 2.20 0.48 1.01 0.66 7.48
100 3.33 0.43 0.96 1.12 10.82
110 4.78 0.43 0.95 1.48 16.55
120 7.62 0.42 0.92 2.24 26.19
15 80 1.51 0.35 0.90 0.82 4.14 47.12 45.29 8.20 21.45
90 2.29 0.34 0.91 1.42 5.95
100 3.47 0.36 0.89 1.79 9.85
110 5.42 0.30 0.84 3.42 13.28
120 7.85 0.30 0.79 4.23 20.02
20 80 1.49 0.29 0.86 1.20 3.41 47.37 47.12 10.75 34.11
90 2.44 0.28 0.82 1.62 5.76
100 3.48 0.28 0.82 2.28 8.09
110 5.13 0.30 0.88 3.45 12.22
120 7.42 0.29 0.81 5.50 18.06
a n � 2 ± m (Eq. (3)).
J.Y. Lee et al. / Thermochimica Acta 343 (2000) 111±117 115
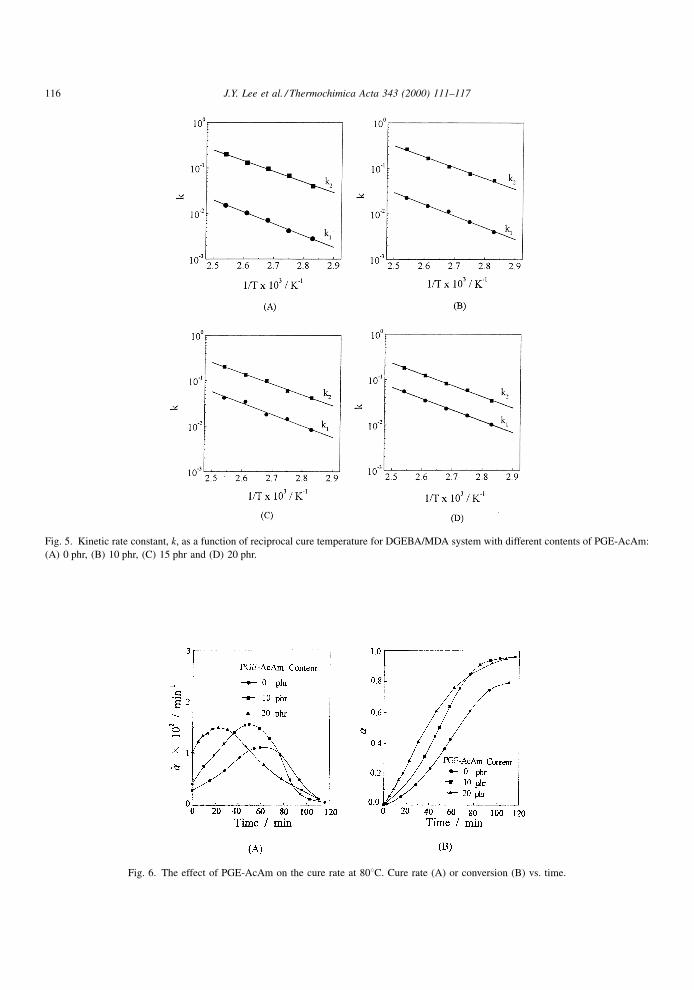
Fig. 5. Kinetic rate constant, k, as a function of reciprocal cure temperature for DGEBA/MDA system with different contents of PGE-AcAm:
(A) 0 phr, (B) 10 phr, (C) 15 phr and (D) 20 phr.
Fig. 6. The effect of PGE-AcAm on the cure rate at 808C. Cure rate (A) or conversion (B) vs. time.
116 J.Y. Lee et al. / Thermochimica Acta 343 (2000) 111±117
Acknowledgements
This work was supported by Jeong Moon Informa-
tion Co. Ltd. and Keuk Dong Design & Communica-
tion Co. Ltd. in Korea.
References
[1] P. Bajaj, N.K. Jha, R.A. Kumar, J. Appl. Polym. Sci. 40
(1990) 203.
[2] A. Dutta, M.E. Ryan, J. Appl. Polym. Sci. 24 (1979) 635.
[3] M.E. Ryan, A. Dutta, Polymer 20 (1979) 203.
[4] M.R. Keenan, J. Appl. Polym. Sci. 33 (1987) 1725.
[5] M.G. Lu, M.J. Shim, S.W. Kim, Thermochim. Acta 323
(1998) 37.
[6] M.G. Lu, M.J. Shim, S.W. Kim, Polym. Eng. Sci. 39 (1999)
274.
[7] E.M. Woo, J.C. Seferis, J. Appl. Polym. Sci. 40 (1990) 237.
[8] S.N. Lee, W.B. Yuo, Polym. Eng. Sci. 27 (1987) 1317.
[9] J.D. Faires, R.L. Burden, Numerical Methods, PWS Publish-
ing, Boston, 1993, p. 161.
[10] J.Y. Lee, M.J. Shim, S.W. Kim, Mater. Chem. Phys. 44 (1996)
74.
[11] C.S. Chern, G.W. Poehlein, Polym. Eng. Sci. 27 (1987) 788.
[12] C.C. Riccardi, H.E. Adabbo, R.J.J. Williams, J. Appl. Polym.
Sci. 29 (1984) 2481.
[13] J.Y. Lee, H.K. Choi, M.J. Shim, S.W. Kim, Mater. Chem.
Phys. 52 (1998) 272.
J.Y. Lee et al. / Thermochimica Acta 343 (2000) 111±117 117