Embed Size (px)
Citation preview

Article
Kinetic Insights into the Binding between the nSH3Domain of CrkII and Proline-Rich Motifs in cAbl
Danyun Zeng,1 Veer S. Bhatt,1 Qingliang Shen,1 and Jae-Hyun Cho1,*1Department of Biochemistry and Biophysics, Texas A&M University, College Station, Texas
ABSTRACT The interaction between CrkII and cAbl is implicated in diverse cellular processes. This interaction starts with thebinding of the N-terminal Src homology 3 (nSH3) domain of CrkII to the proline-rich motifs of cAbl (PRMscAbl). Despite its criticalimportance, the detailed binding mechanism between the nSH3 domain and PRMs remains elusive. In this study, we usednuclear magnetic resonance Carr-Purcell-Meiboom-Gill relaxation dispersion experiment to study the binding kinetics betweenthe nSH3 domain of CrkII and PRMscAbl. Our results highlight that the nSH3 domain binds to three PRMscAbl with very high on-and off-rate constants, indicating the transient nature of the binding. To further characterize the binding transition state, weconducted the Eyring and linear free energy relationship analyses using temperature-dependent kinetic data. These dataindicate that the binding transition state of the nSH3 domain and PRM is accompanied by small activation enthalpy, owing topartial desolvation of the transition state. These results also highlight the similarity between the transition and free states, interms of structure and energetics. Although the binding of the nSH3 domain and PRM displays the features consistent with adiffusion-limited process within our experimental conditions, further tests are necessary to determine if the binding is a truediffusion-limited process.
INTRODUCTION
The interaction between CrkII and cAbl has been implicatedin a number of cellular processes such as cell migration, pro-liferation, and apoptosis (1–6). In addition, this interactionis highly significant in human cancer cells, as highlightedby various methods (7,8). CrkII consists of three Src homol-ogy (SH) domains: SH2, and the N- and C-terminal SH3(nSH3 and cSH3) domains (Fig. 1 A). The C-terminal halfof cAbl protein mainly consists of structurally disorderedregions and contains multiple proline-rich motifs (PRMs)(Fig. 1 A) (9). Recently, we identified that the nSH3 domainof CrkII recognizes three PRMs in cAbl (10). Although theinteraction between CrkII and cAbl takes place at multiplesites in the two proteins (11–13), it is generally believedthat binding through the nSH3 domain and PRMs is the firststep of the interactions. Hence, it is important to understandthe binding mechanism between nSH3 and PRMcAbl.
Intrinsically disordered proteins (IDPs) and proteins withintrinsically disordered regions (IDRs) play diverse roles inprotein-protein interactions (14–17). Many functional (ortarget-binding) regions in IDPs/IDRs are composed of shortlinear motifs (18), and PRMs are commonly found motifs in
Submitted June 6, 2016, and accepted for publication September 22, 2016.
*Correspondence: [email protected]
Editor: Jeff Peng.
http://dx.doi.org/10.1016/j.bpj.2016.09.029
� 2016 Biophysical Society.
IDPs (19,20). Hence, the interactions mediated by PRMsand their recognizing domains, such as SH3 and WW,constitute an important part of protein-protein interactionnetworks (21–23). In this light, the study of the interactionsbetween the nSH3 domain and PRMscAbl is important to un-derstand not only the interaction between CrkII and cAblbut also the binding mechanism of IDPs/IDRs-mediatedprotein-protein interactions. The study of binding mecha-nism of flexible proteins like IDPs is challenging, becauseassociation often accompanies large-scale conformationalchange or folding (16,24–27).
Investigation of the energetics and structure of the bind-ing transition state is essential to elucidate the bindingmechanism. A basic mechanism of interaction between aprotein (P) and a ligand (L) consists of two steps:
Pþ L#P , L�#PL (Scheme 1)
The first step corresponds to the association of two compo-
nents, and the second step to the formation of a final complexstructure. The loosely bound complex ðP,L�Þ is often calledthe transient or encounter complex (28,29). The transitionstate takes place in between the transient and final productcomplexes. In the binding-induced folding mechanism ofIDPs, the binding takes place through the formation ofthe encounter complex, i.e., the intermediate state, andBiophysical Journal 111, 1843–1853, November 1, 2016 1843

FIGURE 1 Interaction between CrkII and cAbl. (A) Domain organiza-
tions of CrkII and cAbl. (Arrows) Recognition of PRMs in cAbl by the
nSH3 domain of CrkII. (Gray boxes) Three PRMs in human cAbl-1A are
shown with residue numbers. (B) Crystal structure of nSH3:PRM758 (Pro-
tein Data Bank (PDB): 5IH2). (Blue spheres) Backbone amide nitrogen
atoms that are used for NMR CPMG-RD experiments. (Green) PRM758.
To see this figure in color, go online.
Zeng et al.
subsequent folding to the final complex structure (24,30). Insome other cases, however, the two processes are not wellseparated, resulting in a single-step association—a so-calledtwo-state binding process. For example, the interactions be-tween SH3 domains and PRMs are typically described as atwo-state process (31,32). However, this does not auto-matically exclude the presence of an encounter complex.Instead, this indicates that the characteristics of the encountercomplex and transition state must be very similar in thecourse of binding between SH3 and PRM, and that a partic-ular experiment cannot distinguish the two binding steps.
Recently, we have identified that the nSH3 domain bindsto three PRMs in cAbl with virtually identical affinities(Kd z 1 mM) (10). This result naturally raises questionsabout the binding kinetics between the nSH3 domain andPRMs. Association and dissociation kinetics are importantto understand the molecular basis of protein-protein interac-tions (14,29,33–35). Although a large number of thermody-namic studies of interactions between SH3 and PRM doexist, the molecular basis of their binding kinetics is notwell understood. This is because the binding is so rapidthat fast-mixing techniques, such as the stopped-flowmethod, are limited to low temperatures (32,36).
Here, we investigated the binding kinetics of the nSH3domain and all three PRMscAbl, using nuclear magneticresonance (NMR) Carr-Purcell-Meiboom-Gill (CPMG)relaxation dispersion (RD) experiments (37–39). Allthe PRMscAbl bind to the nSH3 domain with kon z108 M�1 s�1 and koff z 500 s�1. These results highlight
1844 Biophysical Journal 111, 1843–1853, November 1, 2016
the transient nature of the interactions between CrkII andcAbl. Furthermore, we investigated the binding transitionstate using temperature-dependent kinetic experiments.Overall, the binding transition state seems to be highlysimilar to the free state, in terms of the energetic and struc-tural response to the temperature variation. Based on theanalysis of viscosity-dependent kinetics, we also suggestthat the association of the nSH3 and PRMs may proceedvia an induced-fit binding mechanism.
MATERIALS AND METHODS
Sample preparation
The protein samples used in this study were prepared as described in Bhatt
et al. (10). Synthetic peptides were purchased in a crude form, and further
purified using reverse-phase high-performance liquid chromatography in
our laboratory. The N- and C-termini of peptides were acetylated and
amidated, respectively. The peptide concentration was determined by
measuring the UV absorption at 280 nm of a single tyrosine at the N- or
C-terminal ends of the peptide.
NMR spectroscopy
All NMR experiments were conducted using protein samples in 20 mM
sodium phosphate (pH 6.1), 80 mM NaCl, 0.02% sodium azide, 1 mM
EDTA, 10 mM DSS (4,4-dimethyl-4-silapentane-sulfonate), and 10%
D2O at 25�C. NMR spectra were acquired on AVANCE 600 MHz and
800MHz spectrometers (Bruker, Billerica, MA), equipped with a cryogenic
probe. NMR spectra were processed with NMRPipe (40) and analyzed with
NMRViewJ (One Moon Scientific, Westfield, NJ) and CARA (41). The
assignment of 1H, 13C, and 15N resonances was carried out using a set of
experiments: (1H, 15N) heteronuclear single quantum coherence (HSQC),
(1H, 13C) HSQC, HNCO (42), HNCACB (43), HN(CO)CA (44), HNCA
(45), HN(CA)CO (46), CBCA(CO)NH (47), HBHA(CO)NH (48), and
HC(C)H-TOCSY (49). 1H chemical shifts were referenced with respect
to DSS, and 13C and 15N chemical shifts were referenced indirectly (50).
The temperatures of the NMR sample were calibrated using deuterated
methanol-d4 (51). The assignment of 1H, 13C, and 15N resonances of the
free nSH3 domain was deposited to the Biological Magnetic Resonance
Bank (BMRB: 26870).
Binding kinetic measurements
The association and dissociation rate constants of nSH3:PRM complexes
were measured using constant relaxation time Carr-Purcell-Meiboom-Gill
(CPMG) single quantum relaxation dispersion (RD) experiments (37,52).
The concentration of the nSH3 domain was 200 mM. The molar ratios of
nSH3 and PRMs were adjusted to make the population ratio of the complex
become 5% of the entire nSH3 population. CPMG RD experiments were
recorded with 14–16 different CPMG frequencies ðnCPMGÞ, ranging from
50 to 1000 Hz, for each dispersion curve. CPMG RD data were acquired
at two static magnetic fields (600 and 800 MHz). R2;effðnCPMGÞ values
were calculated from the peak intensities according to:
R2;effðnCPMGÞ ¼ �1
Trelax
ln
�IðnCPMGÞIð0Þ
�; (1)
where Trelax is the length of relaxation delay, and Ið0Þ and IðnCPMGÞ are theintensities of the peak at Trelax ¼ 0 and 40 ms with a given CPMG fre-
quency, respectively. The uncertainty of R2;effðnCPMGÞ was estimated by

Binding Kinetics of nSH3 and PRM
comparing the peak intensities of duplicated spectra of Ið0Þ and Ið50 HzÞ.Using these differences in peak intensities, 100 Monte Carlo simulations
were performed to measure the uncertainty: data fitting were repeated
100 times, and randomly selected uncertainties were added to peak
intensities at each time. We assumed that the uncertainty is Gaussian
distributed. In our experimental conditions, the uncertainties were ~5%
of R2;effð50 HzÞ. The estimated uncertainty was applied to all
R2;effðnCPMGÞ. The CPMG-RD profiles were fitted using the Carver-Ri-
chards equation (Eq. 2) (53,54) or the Luz-Meiboom equation (Eq. 3)
(55) depending on the chemical exchange regime in the NMR timescale
(56). The reported kinetic parameters are the results of the global fitting
of multiple peaks using either the Carver-Richards or Luz-Meiboom
equations:
R2ðvCPMGÞ ¼ 0:5�R
�2;free þ R
�2;bound þ kex � 2vCPMG cosh
�1
� ðDþ coshðhþÞ�D� coshðh�ÞÞ�;
D5 ¼ 0:5
5 1þJþ 2Du2ffiffiffiffiffiffiffiffiffiffiffiffiffiffiffiffi
J2 þ x2p
!;
h5 ¼
ffiffiffiffiffiffiffiffiffiffiffiffiffiffiffiffiffiffiffiffiffiffiffiffiffiffiffiffiffiffiffiffiffiffiffiffiffiffiffiffiffiffiffiffi�5Jþ
ffiffiffiffiffiffiffiffiffiffiffiffiffiffiffiffiJ2 þ x2
p �r2ffiffiffi2
pvCPMG
;
J ¼ k2ex � Du2;
x ¼ � 2Du�pfreekex � pboundkex
�:
(2)
� Fex
4vCPMG
kex
FIGURE 2 Representative 15N CPMG-RD profiles (W169) measured for
the binding of the nSH3 domain to (A) PRM524, (B) PRM568, and (C)
PRM758. Data obtained at 14.1 Tesla (solid circles) and 18.8 Tesla (open
circles) magnetic fields. The population of PRM-bound nSH3 domain is
R2ðvCPMGÞ ¼ R2 þ kex1�
kextanh
4vCPMG
;
R�2 ¼ pfreeR
�2;free þ pboundR
�2;bound;
Fex ¼ pfreepboundDu2:
(3)
Binding assay
The dissociation constant (Kd) of nSH3:PRM758 complex was measured
by monitoring the change of tryptophan fluorescence signal. Excitation
wavelength was 295 nm. All binding assays were performed in a
stirred 1 cm path-length cuvette using a QM-400 fluorimeter (Photon
Technology International, HORIBA Scientific, Edison, NJ). Protein con-
centration used for the fluorescence-based binding assays was 0.1 mM.
The measurements were done in 20 mM sodium phosphate (pH 6.1) and
80 mM or 1 M NaCl at 25�C. The Kd was calculated by assuming a 1:1
complex, and by the global fitting of the repeatedly measured fluorescence
intensities to:
DF ¼ DFmax
�0@½Pt� þ ½Lt� þ Kd 5
ffiffiffiffiffiffiffiffiffiffiffiffiffiffiffiffiffiffiffiffiffiffiffiffiffiffiffiffiffiffiffiffiffiffiffiffiffiffiffiffiffiffiffiffiffiffiffiffiffiffiffiffiffiffiffið½Pt� þ ½Lt�þKdÞ2�4½Pt�½Lt�
q2½Pt�
1A;
(4)
where DF and DFmax are the change and the maximum amplitude of signal
change, respectively. P is the total protein concentration and L is the total
adjusted to be 5% of the entire protein population.
t tligand concentration at each titration point.
RESULTS
The binding kinetics of nSH3 domain andPRMscAbl
We have measured the binding kinetics of the nSH3 domainand PRMs using backbone 15N NMR CPMG-RD experi-ments (Figs. 1 B and 2). Overall, PRM758 binds and dissoci-ates to the nSH3 domain slightly faster than other two PRMs(Table 1). The data fitting results for individual residues areshown in Fig. S1 and Table S1 in the Supporting Material.All three PRMs bound to the nSH3 domain with kon closeto the diffusion-limited rate constant (108–109 M�1 s�1) un-der some biasing forces such as electrostatics. Because ourmeasurements were conducted with a low salt concentration(i.e., 80 mM NaCl), the measured kon values are partially bylong-range electrostatics (see Discussion). The dissociationrate constants (koff) of the nSH3:PRM complexes also show
Biophysical Journal 111, 1843–1853, November 1, 2016 1845

TABLE 1 Kinetic Parameters for the Interactions between the
nSH3 Domain and PRMs at 298 K
PRMs kon (108 M�1 s�1) koff (s
�1)
PRM524 (QAPELPTKTRTSY) 2.01 5 0.58 345.2 5 32.0
PRM568 (VSPLLPRKERGY) 2.38 5 0.26 689.1 5 60.5
PRM758 (YEKPALPRKR) 5.48 5 0.20 933.5 5 104.9
Zeng et al.
modest variation, and this result indicates that the lifetime ofthe complexes is very short (~1 ms).
In the CPMG-RD experiments, we adjusted the popula-tion of the minor state (i.e., ligand-bound state) to 5% ofthe total population, based on the measured Kd values.Because the minor state population is small, a relativelysmall number of peaks displayed dispersion profiles. Onaverage, we observed ~12–15 peaks showing dispersionprofile in each sample. However, considering the qualityof dispersion profiles of the peaks as described below,several peaks from each sample were analyzed to measurethe kinetic parameters (Table S1). Most of the peaks thatshowed dispersion behavior correspond to the residues atthe nSH3:PRM interface (Fig. 1 B). In addition, these peaksshowed gradual chemical shift changes during the titrationof ligand to the nSH3 domain (Fig. S2). This demonstratesthat they undergo chemical exchange in intermediate-to-fastNMR timescales. CPMG-RD profiles were analyzed usingthe Carver-Richards (53,54) or Luz-Meiboom equations(55), depending on kex (¼ kon(L) þ koff) relative to Du (¼u15N,free � u15N,complex) (56). Because of the complexityof the Carver-Richards equation, and interdependency be-tween fitting parameters (57), the Carver-Richards equationwas only applied when Rex > 2.5 s�1. The analyzed peaksdid not display CPMG-RD profiles in the free and PRM-saturated nSH3 domains (Fig. S3).
The kon and koff values obtained for the nSH3:PRMcAbl
complexes agree well with those of nSH3:PRMSos, whichwere measured using NMR line-shape analysis (58). Inaddition, the kon and koff values measured for thenSH3:PRMC3G complex were 1.0 � 108 M�1 s�1 and50 s�1, respectively, using the stopped-flow fluorescencemethod (36). However, because of the fast binding kinetics,the authors measured the rate constants at 15�C. To comparethis with our results, we assumed that the kinetic activationenergy is between 3 and 10 kcal mol�1. This assumption isvalid based on the Eyring analysis (see below). In this rangeof activation energy, the rate constant doubles when the tem-perature increases by 10�C. Therefore, the estimated kon andkoff values for the nSH3:PRMC3G at 25�C agree well withour results. The binding kinetics of the Fyn SH3 domainand PRM has comparable temperature dependence (31).The binding kinetics was also measured for several otherSH3:PRM interactions using NMR CPMG-RD experimentor line-shape analysis (31,58,59). Despite some variationin the experimental conditions, reported kon and koff valuesare ~108 M�1 s�1 and 100 s�1, respectively.
1846 Biophysical Journal 111, 1843–1853, November 1, 2016
Although surface plasmon resonance (SPR) has beenused to measure the binding kinetics of SH3 domains andPRMs, the results are often significantly different from thoseobtained by NMR methods (31,60). The difference wasattributed to slow diffusion through the hydrated matrix inthe SPR study. The binding kinetics of PRM derived fromDOCK180 to nSH3 was measured by SPR. Although thedirect comparison is not possible, because the sequence ofPRMDOCK180 is different from our PRMscAbl, the reportedkon and koff of the nSH3:PRMDOCK180 complex differ fromour results by >1000-fold (60).
Validation of a two-state binding model of nSH3and PRM interaction
Fitting of the CPMG-RD profiles using the Carver-Richardsor Luz-Meiboom equations provides additional parameters,Du and fex (¼ p1p2Du
2), respectively, in addition to kex.The value Du is the 15N chemical shift difference betweenthe major (p1) and minor (p2) conformational states. In thecontext of our study, the major and minor states correspondto the free and PRM-bound states, respectively. These pa-rameters are useful for validation of the fitting model.Throughout this study, we use a two-state binding model.Hence, to examine if a two-state model is valid to studythe binding of the nSH3 domain to PRMs, we comparedthe Du from the data fitting with the Dd measured bycomparing HSQC spectra of free and ligand-saturated sam-ples (Fig. 3, A and B). When a ligand binds to a protein in atwo-state manner, the plot of Du and Dd is expected to forma linear curve with a slope of 1, as shown in Fig. 3. Theobservation of linear correlation between Du and Dd doesnot exclude the presence of the alternative binding model,and instead, these results demonstrate that the two-statemodel is appropriate for the analysis of CPMG-RD data.
The binding of the nSH3 domain and PRM758 was mainlyanalyzed using the Luz-Meiboom equation. The populationof the minor (ligand-bound) state was calculated using theplot of fex versus Dd
2 (Fig. 3 C). The slope of this plot rep-resents p1p2 and was calculated to be 0.051. This agrees wellwith the expected value (0.047), based on the Kd of thenSH3:PRM758 complex. This plot also provides experi-mental evidence for a two-state binding model. If thePRMs were binding to the nSH3 domain through a processmore complicated than the two-state model, the plot wouldshow a nonlinear curve.
Temperature-dependent chemical shiftperturbation upon nSH3:PRM complexation
We measured the NMR chemical shift changes (Dd) be-tween the free and PRM758-bound states of the nSH3domain at six different temperatures, ranging from 15 to40�C. The purpose of this experiment is twofold. First, theobserved Dd (15N) values serve as important probes to
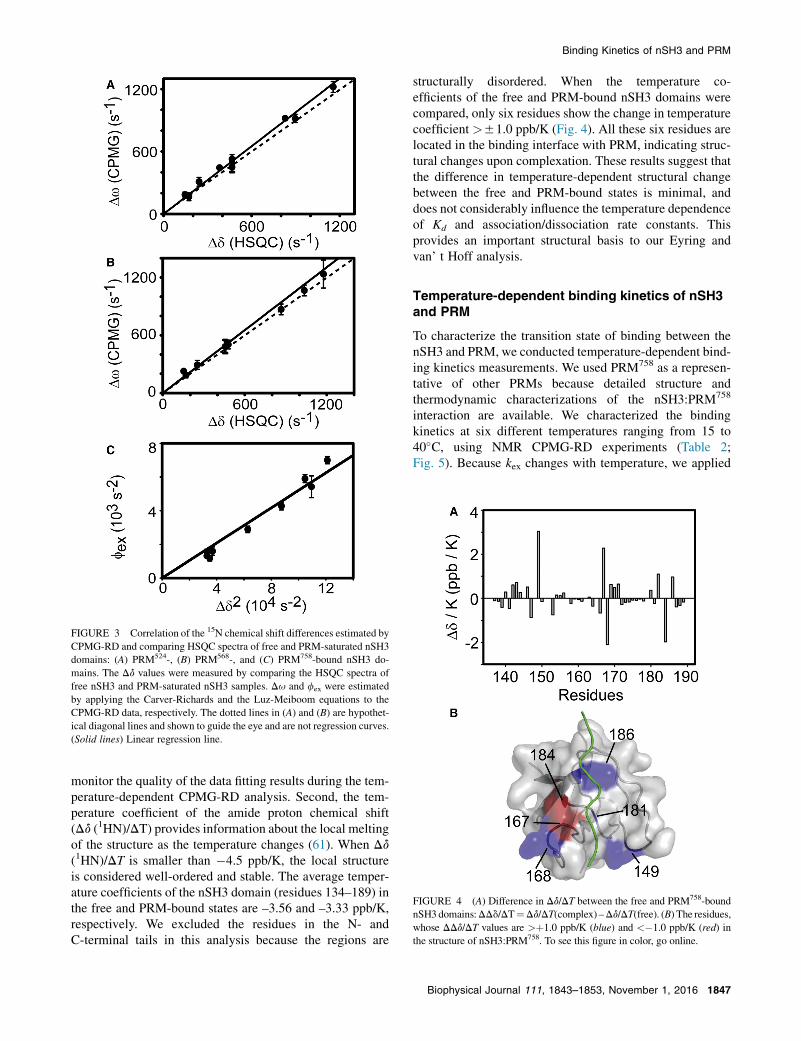
FIGURE 3 Correlation of the 15N chemical shift differences estimated by
CPMG-RD and comparing HSQC spectra of free and PRM-saturated nSH3
domains: (A) PRM524-, (B) PRM568-, and (C) PRM758-bound nSH3 do-
mains. The Dd values were measured by comparing the HSQC spectra of
free nSH3 and PRM-saturated nSH3 samples. Du and fex were estimated
by applying the Carver-Richards and the Luz-Meiboom equations to the
CPMG-RD data, respectively. The dotted lines in (A) and (B) are hypothet-
ical diagonal lines and shown to guide the eye and are not regression curves.
(Solid lines) Linear regression line.
FIGURE 4 (A) Difference in Dd/DT between the free and PRM758-bound
nSH3 domains:DDd/DT¼Dd/DT(complex) –Dd/DT(free). (B) The residues,
whose DDd/DT values are >þ1.0 ppb/K (blue) and <�1.0 ppb/K (red) in
the structure of nSH3:PRM758. To see this figure in color, go online.
Binding Kinetics of nSH3 and PRM
monitor the quality of the data fitting results during the tem-perature-dependent CPMG-RD analysis. Second, the tem-perature coefficient of the amide proton chemical shift(Dd (1HN)/DT) provides information about the local meltingof the structure as the temperature changes (61). When Dd(1HN)/DT is smaller than �4.5 ppb/K, the local structureis considered well-ordered and stable. The average temper-ature coefficients of the nSH3 domain (residues 134–189) inthe free and PRM-bound states are –3.56 and –3.33 ppb/K,respectively. We excluded the residues in the N- andC-terminal tails in this analysis because the regions are
structurally disordered. When the temperature co-efficients of the free and PRM-bound nSH3 domains werecompared, only six residues show the change in temperaturecoefficient >51.0 ppb/K (Fig. 4). All these six residues arelocated in the binding interface with PRM, indicating struc-tural changes upon complexation. These results suggest thatthe difference in temperature-dependent structural changebetween the free and PRM-bound states is minimal, anddoes not considerably influence the temperature dependenceof Kd and association/dissociation rate constants. Thisprovides an important structural basis to our Eyring andvan’ t Hoff analysis.
Temperature-dependent binding kinetics of nSH3and PRM
To characterize the transition state of binding between thenSH3 and PRM, we conducted temperature-dependent bind-ing kinetics measurements. We used PRM758 as a represen-tative of other PRMs because detailed structure andthermodynamic characterizations of the nSH3:PRM758
interaction are available. We characterized the bindingkinetics at six different temperatures ranging from 15 to40�C, using NMR CPMG-RD experiments (Table 2;Fig. 5). Because kex changes with temperature, we applied
Biophysical Journal 111, 1843–1853, November 1, 2016 1847

TABLE 2 Temperature-dependent Kinetic Parameters for the
Interactions between the nSH3 Domain and PRM758
Temperature (K) kon (108 M�1 s�1) koff (s
�1) Kd (mM)a
288 4.39 5 0.18 375.8 5 44.0 0.85 5 0.11
293 5.26 5 0.14 648.1 5 72.2 1.23 5 0.10
298 5.48 5 0.20 933.5 5 104.9 1.70 5 0.48
303 7.03 5 0.18 1641.9 5 72.7 2.34 5 0.41
308 7.42 5 0.18 2519.3 5 299.2 3.39 5 0.47
313 9.79 5 0.25 4233.2 5 380 4.32 5 1.03
aThe equilibrium dissociation constants were determined by detecting
fluorescence intensity change of nSH3 domain upon binding to nSH3
domain (10).
Zeng et al.
the Carver-Richards equation to all the data obtained at 15and 20�C and several residues at 25�C. We applied theLuz-Meiboom equation to the data obtained at 25, 30, 35,and 40�C. To confirm that the binding of the nSH3 domainand PRM maintains a two-state process over the tempera-ture range, we compared the fitted parameters, Du andfex, with HSQC-derived Dd. The good agreement of theseparameters indicates that the two-state mechanism is a validmodel for the binding between the nSH3 and PRM in thistemperature range (Fig. S4).
The temperature-dependent kon and koff values wereanalyzed using the Eyring equation. The Eyring plots ofboth kon and koff of the nSH3:PRM interaction showed nosign of curvature (Fig. 6). The nonlinear Eyring plot (orvan’ t Hoff plot) indicates a considerable change in heat ca-pacity upon protein-ligand complexation. Including theheat capacity term in the fitting equation did not result instatistically significant improvement of the result, basedon the F-test, with a ¼ 0.05. Similarly, the plot from ourprevious van’ t Hoff analysis of the nSH3:PRM758 interac-tion did not show curvature. Structure-based calculationyielded a DCp of �200 cal mol�1 K�1 for nSH3:PRM758
complexation (10). Given the temperature range coveredin this study, this value is too small to generate a statisti-cally significant curvature in the Eyring plot. Hence, weused a linear Eyring equation to calculate the activationenthalpy and entropy associated with binding and unbind-ing of the nSH3 and PRM758. It is of note that the calcu-lated activation entropy should not be consideredinaccurate because the value is obtained by extrapolationof the data. Lente et al. (62) showed that the DS can becalculated from the slope, not from the intercept after sim-ple rearrangement of the equation. The authors demon-strated that whether the DS is calculated from the slopeor from the intercept, the result does not change signifi-cantly. We tested both methods and found that the calcu-lated DS values do not differ. In addition, symmetricdistribution of the temperature points at ~298 K improvesthe reliability of the fit result.
The kon value increases by approximately threefold overthe temperature range of the experiment (from 15 to40�C), resulting in the modest slope in the Eyring plot
1848 Biophysical Journal 111, 1843–1853, November 1, 2016
(Fig. 6 A). The slope and y intercept correspond to the acti-vation enthalpy and entropy for association, �DHz
a=R, andDSza=R, respectively. Linear fit to the data yieldedDHz
a ¼ 4.81 5 0.55 kcal mol�1 and DSza ¼ �2.22 5 1.86cal mol�1 K�1. These results indicate that the associationof nSH3 and PRM is accompanied by an enthalpic activa-tion barrier. The activation free energy of the associationprocess was 5.47 kcal mol�1 at 298 K. This value is veryclose to the theoretical activation energy (~5 kcal mol�1)for protein-small molecule reactions exhibiting a diffu-sion-limited binding (63,64). This small enthalpic barrieris associated with a change in viscosity upon temperaturechange (28,64).
The dissociation rate constant (koff) was more sensitive tothe change in temperature (Fig. 6 B). The linear fit tothe data yielded DHz
d ¼ 16.53 5 0.46 kcal mol�1 andDSzd ¼ 10.7 5 1.53 cal mol�1 K�1. This suggests that thedissociation transition state of the complex is also character-ized by a large enthalpic barrier and is only slightly compro-mised by a favorable entropy change. To further assess thequality of the activation parameters obtained from theEyring analysis, we compared these results with thosefrom the previous van’ t Hoff analysis. The DHbind
and TDSbind values associated with the nSH3:PRM758 inter-action at 298 K were �11.5 5 0.31 kcal mol�1 and�3.64 5 0.31 kcal mol�1, respectively. The sum ofDHz
a and �DHzd yielded �11.72 5 0.71 kcal mol�1, and
the sum of TDSza and �TDSzd yielded –3.85 5 0.72 kcalmol�1 at 298 K. This is an exceptionally good agreementof results obtained by equilibrium and kinetic experiments,using two independent methods, fluorescence and NMRspectroscopy, respectively. This demonstrates that our datais internally consistent.
DISCUSSION
Transient interactions between the nSH3 domainand PRM
In this study, we characterized the binding kinetics betweenthe nSH3 domain of CrkII and three PRMs from cAbl. ThenSH3 domain binds to all three PRMs with similar kon andkoff values. Taken together with the previous results of equi-librium study (10), these data indicate that the three PRMsites are thermodynamically and kinetically equivalent interms of interactions with CrkII. The functional significanceof the binding of CrkII to individual PRM sites remains to beelucidated.
Transient protein-protein interactions are critical formany biochemical pathways (65,66). Diffusion-limited as-sociation and fast dissociation of the nSH3 domain andPRMs highlight that the interaction between CrkII andcAbl is intrinsically transient. This suggests that the initialtransient binding via nSH3 and PRM leads to different sta-ble modes of interactions between CrkII and cAbl. For

FIGURE 5 Representative 15N CPMG-RD profiles (W169) of the nSH3 domain partially saturated by PRM758 at (A) 15, (B) 20, (C) 25, (D) 30, (E) 35, and
(F) 40�C. Data were obtained at 14.1 Tesla (solid circles) and 18.8 Tesla (open circles) magnetic fields. The population of the PRM-bound nSH3 domain is
adjusted to be 5% of the entire protein population in NMR samples.
Binding Kinetics of nSH3 and PRM
example, binding between CrkII and cAbl results in phos-phorylation of CrkII (67). This leads to subsequent interac-tion between the SH3 domain of cAbl and the SH2 domainof CrkII (13). In this light, the transient nature of thenSH3:PRM interaction may play an important role inswitching the binding modes, because a stable interactionmight inhibit the facile transition between them.
FIGURE 6 Eyring plots of the (A) association and (B) dissociation rate
constants of nSH3 domain and PRM758.
Linear free energy relationship analysis indicatesthat the transition state is similar to the free state
Analysis of the binding transition state is essential to un-derstand the molecular basis of protein-ligand interactions.Binding of PRM to the nSH3 domain is driven by a largefavorable enthalpy. A small enthalpic activation barrier inthe course of the association might be the result of temper-ature-dependent viscosity changes (63,64). A smallentropic barrier was observed in the association, whichsuggests that small positive entropy change upon partialdesolvation of the binding interface might be compromisedby the small unfavorable conformational entropy change.In addition, a positive entropy change in the course ofdissociation indicates that the nSH3 domain and PRMmaintain considerable conformational dynamics in thetransition state.
To further characterize the transition state, we conductedthe linear free energy relationship (LFER) analysis (68).Direct observation of the transition state is extremely diffi-cult. Instead, this analysis provides information on the sim-ilarity between the transition and the ground states in termsof free energy change upon perturbations such as changes inpH and temperature or mutations. The resulting Lefflerað¼ vDGz
a=vDG�eqÞ value can be interpreted to assess the
position of the transition state on the reaction coordinate(69,70). However, it is of special note that the interpretationof this result critically depends on whether the perturbationpredominantly affects either the free or ligand-bound states(see below) (71–73).
Previously, we reported the result of the van’ t Hoff anal-ysis of the nSH3:PRM758 interactions (10). Here, wecombine the results of the Eyring and van’ t Hoff analysesto perform LFER analysis. The plot of DGz
d versus DG�
Biophysical Journal 111, 1843–1853, November 1, 2016 1849

FIGURE 8 (A and B) Two potential scenarios to explain the result of
LFER analysis. (Arrows) Change in the free energy level as temperature in-
creases.
Zeng et al.
shows that the change in the ground state free energy ishighly correlated with the change in the dissociation rateconstant (ad ¼ �0.93 5 0.20) (Fig. 7 A). This is a sharpcontrast with the association transition state free energy(Fig. 7 B), in which DGz
a does not correlate at all withDG� (aa ¼ �0.07 5 0.21). To rationalize the results, wepostulate two different mechanisms (Fig. 8). The first mech-anism assumes that the free energy of the PRM-bound stateis destabilized (increased) as the temperature increases,whereas the free energy of the transition and free states donot change (Fig. 8 A). The free energy difference betweenthe free and PRM-bound states decreases as the temperatureincreases. This mechanism implies that the transition state ishighly similar to the free state, in terms of structure and en-ergetics. On the other hand, a second mechanism assumesthat the free energy of the PRM-bound state does notchange, while the free and transition state energy leveldecrease similarly, as the temperature increases (Fig. 8 B).
FIGURE 7 LFER between equilibrium binding free energy (DG�) andtransition state free energy of the (A) association ðDGz
aÞ and (B) dissociationðDGz
dÞ processes. (C) Temperature-corrected viscosity plot. (Solid line)
Expected relationship between k0onT=konT0 and h/h0, with slope ¼ 1.
(Dotted line) Linear regression line with a slope ¼ 1.02 5 0.19.
1850 Biophysical Journal 111, 1843–1853, November 1, 2016
Both models explain why there is no correlation betweenDGz
a and DG�, whereas the DGzd correlates well with DG�.
A key difference between the two mechanisms is whetherthe temperature-dependent change in Kd is owing to thestabilization of the free state or destabilization of thePRM-bound state. However, it should be noted that bothmodels indicate that the transition state is highly similarto the free state, rather than to the PRM-bound state. Theseresults highlight that the interpretation of the LFER analysisshould be cautious.
Because of the very fast binding kinetics, the Eyring anal-ysis of binding between SH3 domain and PRM is rarely con-ducted. Demers and Mittermaier (31) conducted a carefulstudy on the temperature-dependent binding kinetics ofFyn SH3 and PRM. The authors found that DHz
a ¼ 3.4 50.5 kcal mol�1 for the binding of Fyn SH3 to PRM, whichis consistent with our result. The authors also found thatthe activation barrier for dissociation of the FynSH3:PRMcomplex is accompanied by a considerable heat capacitychange. This suggests that the transition state is onlypartially desolvated in the course of association. Recently,Xue et al. (58) reported the results of detailed molecular dy-namics simulation of the nSH3 domain complexed withPRM derived from Sos. The authors found that the electro-static interaction is the dominant player in the binding ofnSH3 and PRMSos, but the encounter complex holds consid-erable conformational dynamics, resulting in a ‘‘fuzzy com-plex’’ (58). Partial electrostatic interactions might result inpartial desolvation in the transition state. This is consistentwith our result that the transition state is similar to thefree state.
Is the nSH3:PRM binding a pure diffusion-limitedprocess?
By determining if binding proceeds through a diffusion-limited process, we can provide an important clue to under-stand the binding mechanism between nSH3 domain andPRMs. Although the observed kon values for all threePRMs are very close to the diffusion-limited rate constant,this is not sufficient evidence that binding is predominantlya diffusion-limited process (74). To test if the binding be-tween the nSH3 and PRM is a diffusion-limited process,we investigated if the kon linearly changes according tothe change in viscosity. The diffusion-limited rate constant

Binding Kinetics of nSH3 and PRM
under the influence of electrostatic interaction during asso-ciation is explained by (28,29):
k ¼ k0 expð � hUi�=kBTÞ; (5)
where k0 is the basal rate constant in the absence of a biasingforce such as long-range electrostatics. The effect of electro-static interactions is treated by the Boltzmann factor (29).Hence, U is the interaction energy that is the sum of theenergetically favorable (typically, long-range electrostatics)and unfavorable interactions. In the presence of high saltconcentration, the diffusion rate constant is equivalent tothe basal rate constant (k0), which is proportional to thediffusion constant, D ¼ RT=N6phr (28). The values R andN are the ideal gas constant and the Avogadro’s number,respectively; r is the Stokes’ radius of the transient complex;and h is solvent viscosity. Hence, the effect of changing sol-vent viscosity linearly affects the k0.
The solvent viscosity can be changed by adding coso-lutes, such as glucose or polymers, or changing the temper-ature. In the latter case, the linear relationship can be testedby plotting kon versus T/h. Alternatively, the linearity can betested by plotting the relative association rate constantsðk0onT=konT0Þ versus the relative change in solvent viscosity(h/h0) (74,75). When solvent viscosity changes with varyingtemperature, this plot takes into account the effects fromchanges in both temperature and viscosity. The k0 and h0represent the corresponding values in the reference temper-ature, T0. In this study, we used T0 ¼ 293 K because h0 ¼ 1at this temperature. If the binding is a pure diffusion-limitedprocess, then k0onT=konT
0 should be linearly dependent onh/h0 with a slope of exp½�ðhUi=RÞð1=T0 � 1=TÞ�. Thisplot is less sensitive to the effects of long-range electro-statics, relative to the plot of kon versus T/h, which has anexpected slope of exp½�ðhUi=RTÞ�. This is an additionalbenefit for us because the presence of a high salt concentra-tion (>1 M) prevents the application of the high powerCPMG pulse.
Fig. 7 C shows that k0onT=konT0 agrees well with the tem-
perature-induced relative viscosity changes, h/h0. It shouldbe noted that the activation enthalpy (DHz) probed by theEyring analysis is taken into account by the change in vis-cosity of water (28). Hence, this agreement indicates thatthe result of the Eyring analysis is consistent with the effectof viscosity change on the association process. Furthermore,this result indicates that hUi is close to zero in the presenceof 80 mM NaCl and that the basal rate constant, k0, is high(~108 M�1 s�1) in the binding between nSH3 and PRM.Although it is not clear why the basal rate constant is sohigh for the binding between nSH3 and PRM, a recent studyof binding between the Fyn SH3 domain and PRM alsoshowed that the basal rate constant is very high (~5 �107 M�1 s�1) (32). This may indicate that the binding tran-sition state between SH3 domain and PRM is highly nonspe-cific and less restricted in translation/rotation, compared to
other protein-protein binding processes. This interpretationis also consistent with the result of our LFER analysis.
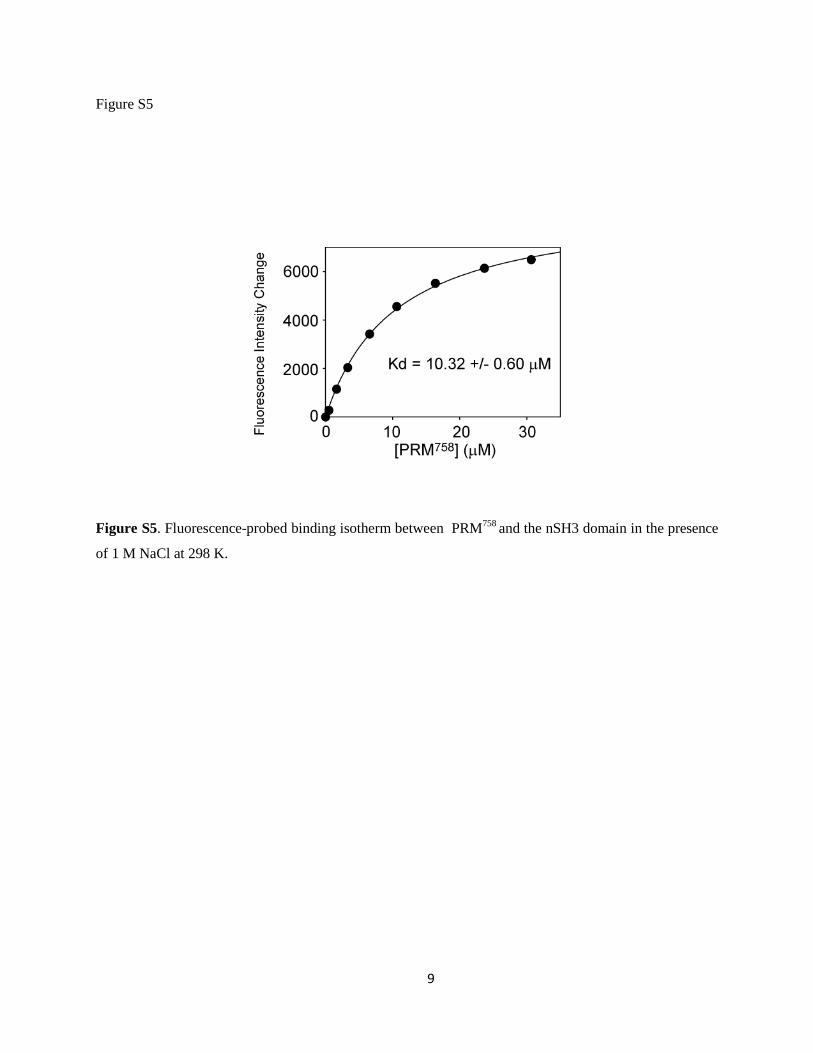
To further examine the contribution of electrostatics inthe binding between nSH3 and PRM, we measured the Kd
value of the nSH3:PRM758 complex in the presence of1 M NaCl. The Kd increased by sixfold in the presence of1 M NaCl (Fig. S5), relative to that in 80 mM NaCl. Thedissociation rate constant is typically determined by short-range electrostatics and hence, is not influenced signifi-cantly by the screening of long-range electrostatics usinghigh salt concentration (29,32,76). If we assume that thechange in koff is modest upon the increase in salt concentra-tion, this result implies that kon would decrease by ~10-foldin 1 M NaCl, relative to that in 80 mM NaCl, which is ourexperimental condition. This suggests that our estimatedbasal kon would be ~107 M�1 s�1 in the presence of 1 MNaCl. Therefore, our result is consistent with that of bindingbetween Fyn SH3 and PRM (32).
Although our results agree reasonably well with diffu-sion-limited binding, there are some caveats. First, the rangeof temperature-induced viscosity change is narrow. It isdesirable to use cosolutes to change solvent viscosity, butthe NMR signal intensity decreases as the cosolute concen-tration increases, owing to increased tumbling time. Hence,it is necessary to use higher protein concentrations tocompensate the loss of signal intensity. However, it was re-ported that the nSH3 domain forms a mixture of a monomerand nonspecific dimers (or multimers) at high protein con-centrations (58). This raised a concern about technical diffi-culties associated with analyzing multistate equilibria usingNMR CPMG data. These limitations prevented us from us-ing cosolutes to change viscosity. A systematic study will berequired to address these problems. In this study, the proteinconcentration of our NMR experiments was kept low (200mM) to prevent the nonspecific dimerization of the nSH3domain. Second, we cannot exclude the possibility that aPRM undergoes a conformational exchange between bind-ing-incompetent and -competent states before binding tothe nSH3 domain. Our NMR experiments probe the signalfrom nSH3 domain, not from PRMs. Moreover, the concen-tration of PRM was only 5% of protein concentration in ourNMR samples. Even if 10% of the entire PRM populated thebinding-incompetent conformation, it constitutes only 0.1�0.05 ¼ 0.5% of the entire population. Hence, it might bedifficult to detect its effect on dispersion profiles.
The results of the Eyring and LFER analyses providedstructural and energetic characteristics of the binding transi-tion state between nSH3 and PRM. However, our data do notconclusively define that the binding between nSH3 andPRM is a diffusion-limited process. Observation of a fastkon does not automatically grant diffusion-limited binding.Rogers et al. (74) reported that the binding of PUMA andMCL-1 also showed a nonlinear plot of k0onT=konT
0 versush/h0, although the basal rate constant was consistent withthat of a diffusion-limited process.
Biophysical Journal 111, 1843–1853, November 1, 2016 1851
Zeng et al.
SUPPORTING MATERIAL
Five figures and two tables are available at http://www.biophysj.org/
biophysj/supplemental/S0006-3495(16)30830-X.
AUTHOR CONTRIBUTIONS
J.-H.C. conceived and coordinated the study and wrote the article; D.Z.,
Q.S., V.S.B., and J.-H.C. performed experiments; J.-H.C. analyzed experi-
ments; and all authors reviewed the results and approved the final version of
the article.
ACKNOWLEDGMENTS
This research was supported by startup funds from Texas A&M University.
REFERENCES
1. Salameh, A., F. Galvagni, ., S. Oliviero. 2005. Direct recruitment ofCRK and GRB2 to VEGFR-3 induces proliferation, migration, andsurvival of endothelial cells through the activation of ERK, AKT,and JNK pathways. Blood. 106:3423–3431.
2. Rodrigues, S. P., K. E. Fathers,., M. Park. 2005. CrkI and CrkII func-tion as key signaling integrators for migration and invasion of cancercells. Mol. Cancer Res. 3:183–194.
3. Takino, T., M. Tamura, ., K. M. Yamada. 2003. Tyrosine phosphory-lation of the CrkII adaptor protein modulates cell migration. J. Cell Sci.116:3145–3155.
4. Smith, J. J., E. K. Evans, ., S. Kornbluth. 2000. Wee1-regulatedapoptosis mediated by the Crk adaptor protein in Xenopus egg extracts.J. Cell Biol. 151:1391–1400.
5. Feller, S. M. 2001. Crk family adaptors-signalling complex formationand biological roles. Oncogene. 20:6348–6371.
6. Mintz, P. J., M. Cardo-Vila, ., R. Pasqualini. 2009. An unrecognizedextracellular function for an intracellular adapter protein released fromthe cytoplasm into the tumor microenvironment. Proc. Natl. Acad. Sci.USA. 106:2182–2187.
7. Brehme, M., O. Hantschel, ., G. Superti-Furga. 2009. Charting themolecular network of the drug target Bcr-Abl. Proc. Natl. Acad. Sci.USA. 106:7414–7419.
8. Savitski, M. M., F. B. Reinhard,., G. Drewes. 2014. Tracking cancerdrugs in living cells by thermal profiling of the proteome. Science.346:1255784.
9. Hantschel, O., and G. Superti-Furga. 2004. Regulation of the c-Abl andBcr-Abl tyrosine kinases. Nat. Rev. Mol. Cell Biol. 5:33–44.
10. Bhatt, V. S., D. Zeng, ., J. H. Cho. 2016. Binding mechanism of theN-terminal SH3 domain of CrkII and proline-rich motifs in cAbl.Biophys. J. 110:2630–2641.
11. Sriram, G., W. Jankowski, ., R. B. Birge. 2015. Iterative tyrosinephosphorylation controls non-canonical domain utilization in Crk.Oncogene. 34:4260–4269.
12. Reichman, C., K. Singh, ., R. B. Birge. 2005. Transactivation of Ablby the Crk II adapter protein requires a PNAY sequence in the CrkC-terminal SH3 domain. Oncogene. 24:8187–8199.
13. Donaldson, L. W., G. Gish,., J. D. Forman-Kay. 2002. Structure of aregulatory complex involving the Abl SH3 domain, the Crk SH2domain, and a Crk-derived phosphopeptide. Proc. Natl. Acad. Sci.USA. 99:14053–14058.
14. Wright, P. E., and H. J. Dyson. 2015. Intrinsically disordered proteinsin cellular signalling and regulation. Nat. Rev. Mol. Cell Biol.16:18–29.
15. Dunker, A. K., C. J. Brown, ., Z. Obradovi�c. 2002. Intrinsic disorderand protein function. Biochemistry. 41:6573–6582.
1852 Biophysical Journal 111, 1843–1853, November 1, 2016
16. Flock, T., R. J. Weatheritt, ., M. M. Babu. 2014. Controlling entropyto tune the functions of intrinsically disordered regions. Curr. Opin.Struct. Biol. 26:62–72.
17. Babu, M. M., R. W. Kriwacki, and R. V. Pappu. 2012. Structuralbiology. Versatility from protein disorder. Science. 337:1460–1461.
18. Das, R. K., A. H. Mao, and R. V. Pappu. 2012. Unmasking functionalmotifs within disordered regions of proteins. Sci. Signal. 5:pe17.
19. Lee, C., L. Kalmar,., K. H. Han. 2014. Contribution of proline to thepre-structuring tendency of transient helical secondary structure ele-ments in intrinsically disordered proteins. Biochim. Biophys. Acta.1840:993–1003.
20. Theillet, F.-X., L. Kalmar, ., V. N. Uversky. 2013. The alphabet ofintrinsic disorder. Intrins. Disord. Proteins. http://dx.doi.org/10.4161/idp.24360.
21. Li, S. S.-C. 2005. Specificity and versatility of SH3 and other proline-recognition domains: structural basis and implications for cellularsignal transduction. Biochem. J. 390:641–653.
22. Ekman, D., S. Light, ., A. Elofsson. 2006. What properties charac-terize the hub proteins of the protein-protein interaction network ofSaccharomyces cerevisiae? Genome Biol. 7:R45.
23. Wang, X., B. J. Mahoney, ., J. W. Peng. 2015. Negative regulation ofpeptidyl-prolyl isomerase activity by interdomain contact in humanPin1. Structure. 23:2224–2233.
24. Sugase, K., H. J. Dyson, and P. E. Wright. 2007. Mechanism of coupledfolding and binding of an intrinsically disordered protein. Nature.447:1021–1025.
25. Verkhivker, G. M., D. Bouzida, ., P. W. Rose. 2003. Simulating dis-order-order transitions in molecular recognition of unstructured pro-teins: where folding meets binding. Proc. Natl. Acad. Sci. USA.100:5148–5153.
26. Shammas, S. L., M. D. Crabtree, ., J. Clarke. 2016. Insights intocoupled folding and binding mechanisms from kinetic studies.J. Biol. Chem. 291:6689–6695.
27. Eliezer, D. 2009. Biophysical characterization of intrinsically disor-dered proteins. Curr. Opin. Struct. Biol. 19:23–30.
28. Berg, O. G., and P. H. von Hippel. 1985. Diffusion-controlledmacromolecular interactions. Annu. Rev. Biophys. Biophys. Chem.14:131–160.
29. Schreiber, G., G. Haran, and H. X. Zhou. 2009. Fundamental aspects ofprotein-protein association kinetics. Chem. Rev. 109:839–860.
30. Zhou, H. X., and P. A. Bates. 2013. Modeling protein association mech-anisms and kinetics. Curr. Opin. Struct. Biol. 23:887–893.
31. Demers, J.-P., and A. Mittermaier. 2009. Binding mechanism of an SH3domain studied by NMR and ITC. J. Am. Chem. Soc. 131:4355–4367.
32. Meneses, E., and A. Mittermaier. 2014. Electrostatic interactions in thebinding pathway of a transient protein complex studied by NMR andisothermal titration calorimetry. J. Biol. Chem. 289:27911–27923.
33. Copeland, R. A., D. L. Pompliano, and T. D. Meek. 2006. Drug-targetresidence time and its implications for lead optimization. Nat. Rev.Drug Discov. 5:730–739.
34. Radi�c, Z., P. D. Kirchhoff, ., P. Taylor. 1997. Electrostatic influenceon the kinetics of ligand binding to acetylcholinesterase. Distinctionsbetween active center ligands and fasciculin. J. Biol. Chem.272:23265–23277.
35. Gianni, S., J. Dogan, and P. Jemth. 2016. Coupled binding and foldingof intrinsically disordered proteins: what can we learn from kinetics?Curr. Opin. Struct. Biol. 36:18–24.
36. Schmidpeter, P. A., and F. X. Schmid. 2014. Molecular determinants ofa regulatory prolyl isomerization in the signal adapter protein c-CrkII.ACS Chem. Biol. 9:1145–1152.
37. Loria, J. P., M. Rance, and A. G. Palmer. 1999. A relaxation-compen-sated Carr-Purcell-Meiboom-Gill sequence for characterizing chemicalexchange by NMR spectroscopy. J. Am. Chem. Soc. 121:2331–2332.

Binding Kinetics of nSH3 and PRM
38. Carr, H. Y., and E. M. Purcell. 1954. Effects of diffusion on free preces-sion in nuclear magnetic resonance experiments. Phys. Rev.94:630–638.
39. Meiboom, S., and D. Gill. 1958. Modified spin-echo method formeasuring nuclear relaxation times. Rev. Sci. Instrum. 29:688–691.
40. Delaglio, F., S. Grzesiek, ., A. Bax. 1995. NMRPipe: a multidimen-sional spectral processing system based on UNIX pipes. J. Biomol.NMR. 6:277–293.
41. Keller, R. L. J. 2004. The Computer Aided Resonance AssignmentTutorial. CANTINA, Goldau, Switzerland.
42. Ikura, M., L. E. Kay, and A. Bax. 1990. A novel approach for sequentialassignment of proton, carbon-13, and nitrogen-15 spectra of larger pro-teins: heteronuclear triple-resonance three-dimensional NMR spectros-copy. Application to calmodulin. Biochemistry. 29:4659–4667.
43. Grzesiek, S., and A. Bax. 1992. An efficient experiment for sequentialbackbone assignment of medium-sized isotopically enriched proteins.J. Magn. Reson. 99:201–207.
44. Bax, A., and M. Ikura. 1991. An efficient 3D NMR technique for corre-lating the proton and 15N backbone amide resonances with the a-car-bon of the preceding residue in uniformly 15N/13C enriched proteins.J. Biomol. NMR. 1:99–104.
45. Kay, L. E., M. Ikura, ., A. Bax. 1990. Three-dimensional triple-reso-nance NMR spectroscopy of isotopically enriched proteins. J. Magn.Reson. 89:496–514.
46. Clubb, R. T., V. Thanabai, and G. Wagner. 1992. A constant-time three-dimensional triple-resonance pulse scheme to correlate intraresidue1HN, 15N, and 13C0 chemical shifts in 15N–13C labeled proteins.J. Magn. Reson. 97:213–217.
47. Wittekind, M., and L. Mueller. 1993. HNCACB, a high-sensitivity 3DNMR experiment to correlate amide-proton and nitrogen resonanceswith the a- and b-carbon resonances in proteins. J. Magn. Reson. B.B101:201–205.
48. Grzesiek, S., and A. Bax. 1993. Amino acid type determination in thesequential assignment procedure of uniformly 13C/15N-enriched pro-teins. J. Biomol. NMR. 3:185–204.
49. Bax, A., G. M. Clore, and A. M. Gronenborn. 1990. 1H–1H correlationvia isotropic mixing of 13C magnetization, a new three-dimensionalapproach for assigning 1H and 13C spectra of 13C-enriched proteins.J. Magn. Reson. 88:425–431.
50. Wishart, D. S., C. G. Bigam, ., B. D. Sykes. 1995. 1H, 13C and 15Nchemical shift referencing in biomolecular NMR. J. Biomol. NMR.6:135–140.
51. Findeisen, M., T. Brand, and S. Berger. 2007. A 1H-NMR thermometersuitable for cryoprobes. Magn. Reson. Chem. 45:175–178.
52. Mulder, F. A., N. R. Skrynnikov, ., L. E. Kay. 2001. Measurement ofslow (ms-ms) time scale dynamics in protein side chains by 15N relax-ation dispersion NMR spectroscopy: application to Asn and Glnresidues in a cavity mutant of T4 lysozyme. J. Am. Chem. Soc.123:967–975.
53. Carver, J. P., and R. E. Richards. 1972. A general state-site solution forthe chemical exchange produced dependence of T2 upon the Carr-Pur-cell pulse separation. J. Magn. Reson. 6:89–105.
54. Davis, D. G., M. E. Perlman, and R. E. London. 1994. Direct measure-ments of the dissociation-rate constant for inhibitor-enzyme complexesvia the T1 r and T2 (CPMG) methods. J. Magn. Reson. B.104:266–275.
55. Luz, Z., and S. Meiboom. 1963. Nuclear magnetic resonance study ofthe protolysis of trimethylammonium ion in aqueous solution—orderof the reaction with respect to solvent. J. Chem. Phys. 39:366–370.
56. Palmer, A. G., C. D. Kroenke, and J. P. Loria. 2001. Nuclear magneticresonance methods for quantifying microsecond-to-millisecond mo-tions in biological macromolecules. Methods Enzymol. 339:204–238.
57. Kovrigin, E. L., J. G. Kempf, ., J. P. Loria. 2006. Faithful estimationof dynamics parameters from CPMG relaxation dispersion measure-ments. J. Magn. Reson. 180:93–104.
58. Xue, Y., T. Yuwen, ., N. R. Skrynnikov. 2014. Role of electrostaticinteractions in binding of peptides and intrinsically disordered proteinsto their folded targets. 1. NMR andMD characterization of the complexbetween the c-Crk N-SH3 domain and the peptide Sos. Biochemistry.53:6473–6495.
59. Hansen, D. F., P. Vallurupalli, ., L. E. Kay. 2008. Probing chemicalshifts of invisible states of proteins with relaxation dispersion NMRspectroscopy: how well can we do? J. Am. Chem. Soc. 130:2667–2675.
60. Matsuda, M., S. Ota, ., T. Kurata. 1996. Interaction between theamino-terminal SH3 domain of CRK and its natural target proteins.J. Biol. Chem. 271:14468–14472.
61. Tomlinson, J. H., and M. P. Williamson. 2012. Amide temperature co-efficients in the protein G B1 domain. J. Biomol. NMR. 52:57–64.
62. Lente, G., I. Fabian, and A. J. Poe. 2005. A common misconceptionabout the Eyring equation. New J. Chem. 29:759–760.
63. van Holde, K. E. 2002. A hypothesis concerning diffusion-limited pro-tein-ligand interactions. Biophys. Chem. 101–102:249–254.
64. Pilling, M. J., and P. W. Seakins. 1995. Reaction Kinetics. OxfordUniversity Press, New York.
65. Perkins, J. R., I. Diboun, ., C. Orengo. 2010. Transient protein-pro-tein interactions: structural, functional, and network properties. Struc-ture. 18:1233–1243.
66. Rudolph, J. 2007. Inhibiting transient protein-protein interactions: les-sons from the Cdc25 protein tyrosine phosphatases. Nat. Rev. Cancer.7:202–211.
67. Feller, S. M., B. Knudsen, and H. Hanafusa. 1994. c-Abl kinase regu-lates the protein binding activity of c-Crk. EMBO J. 13:2341–2351.
68. Leffler, J. E. 1953. Parameters for the description of transition states.Science. 117:340–341.
69. Fersht, A. R. 2004. Relationship of Leffler (Bronsted) a-values andprotein folding f-values to position of transition-state structures on re-action coordinates. Proc. Natl. Acad. Sci. USA. 101:14338–14342.
70. Fersht, A. R., and T. N. Wells. 1991. Linear free energy relationships inenzyme binding interactions studied by protein engineering. ProteinEng. 4:229–231.
71. Sanchez, I. E., and T. Kiefhaber. 2003. Hammond behavior versusground state effects in protein folding: evidence for narrow free energybarriers and residual structure in unfolded states. J. Mol. Biol.327:867–884.
72. Cho, J. H., and D. P. Raleigh. 2006. Electrostatic interactions in the de-natured state and in the transition state for protein folding: effects ofdenatured state interactions on the analysis of transition state structure.J. Mol. Biol. 359:1437–1446.
73. Cho, J. H., W. Meng,., D. P. Raleigh. 2014. Energetically significantnetworks of coupled interactions within an unfolded protein. Proc.Natl. Acad. Sci. USA. 111:12079–12084.
74. Rogers, J. M., A. Steward, and J. Clarke. 2013. Folding and binding ofan intrinsically disordered protein: fast, but not ‘diffusion-limited’.J. Am. Chem. Soc. 135:1415–1422.
75. Schreiber, G. 2002. Kinetic studies of protein-protein interactions.Curr. Opin. Struct. Biol. 12:41–47.
76. Selzer, T., S. Albeck, and G. Schreiber. 2000. Rational design of fasterassociating and tighter binding protein complexes. Nat. Struct. Biol.7:537–541.
Biophysical Journal 111, 1843–1853, November 1, 2016 1853

Biophysical Journal, Volume 111
Supplemental Information
Kinetic Insights into the Binding between the nSH3 Domain of CrkII and
Proline-Rich Motifs in cAbl
Danyun Zeng, Veer S. Bhatt, Qingliang Shen, and Jae-Hyun Cho

1
Supporting Material
Table S1. The results of CPMG-RD data fitting of individual residues.
a These are not analyzed because either no-dispersion was observed or peaks overlap with other peaks.
Residues kex (s-1) PRM524 PRM568 PRM758
146 386.7 ± 44.2 706.0 ± 31.3 1132.3 ± 54.5 147 362.3 ± 74.2 790.7 ± 62.7 875.7 ± 168.7 148 401.3 ± 32.9 742.4 ± 24.1 1157.5 ± 42.5 149 311.4 ± 98.9 597.8 ± 22.7 804.2 ± 37.8 150 349.1 ± 44.6 746.3 ± 25.7 888.8 ± 35.9 163 -a -a 985.3 ± 126.1 164 -a -a 1097.8 ± 94.4 166 412.2 ± 41.3 742.7 ± 35.7 1141.1 ± 88.5 169 385.1 ± 56.2 784.2 ± 36.5 832.8 ± 40.4 181 -a 806.3 ± 176.2 -a 186 -a -a 1128.9 ± 76.9

2
Table S2. Individual 15N CPMG-RD data fitting results of binding between nSH3 and PRM758 at
different temperatures.
a Data obtained at 25 °C are shown in Table S1.
b Data were not analyzed because of either peak overlap or absence or small Rex.
Residues kex (s-1)a 15 °C 20 °C 30 °C 35 °C 40 °C
146 370.5 ± 65.8 843.0 ± 82.0 -b 2347 ± 390 -b 147 -b 611.1 ± 45.6 1848 ± 529 -b -b 148 397.0 ± 66.9 634.2 ± 28.7 1844 ± 109 -b -b 149 465.0 ± 28.2 740.2 ± 46.5 1510 ± 100 2918 ± 113 4434.0 ± 337 150 532.0 ± 50.6 780.9 ± 44.9 1719 ± 85 2912 ± 99 4677.1 ± 313 164 -b 615.8 ± 43.1 1697 ± 340 -b -b 166 270.4 ± 41.8 811.7 ± 140.8 1760 ± 106 2645 ± 258 4424.6 ± 1087 169 531.6 ± 61.2 740.9 ± 65.2 1600 ± 123 2895 ± 111 4487.5 ± 332 186 314.9 ± 42.9 751.1 ± 30.2 1733 ± 182 2196 ± 352 -b
Global fit 393 ± 86.8 681 ± 57.9 1728 ± 76.5 2651 ± 315 4883 ± 80.7

3
Figure 1
Figure S1a. 15N CPMG-RD profiles of the nSH3 domain, which is mixed with PRM524. Based on the Kd,
the population of the nSH3:PRM524 complex is estimated to be ~5 % of the entire population of nSH3
domain. The residue numbers are shown in each figure. The blue and red circles represent the data
acquired at 14.1 T and 18.8 T, respectively. The solid lines represent the best fit to the individual residues.
The results of individual fit (kex values) are shown in Table S1.

4
Figure S1 continued
Figure S1b. 15N CPMG-RD profiles of the nSH3 domain, which is mixed with PRM568. Based on the Kd,
the population of the nSH3:PRM568 complex is estimated to be ~5 % of the entire population of nSH3
domain. The residue numbers are shown in each figure. The blue and red circles represent the data
acquired at 14.1 T and 18.8 T, respectively. The solid lines represent the best fit to the individual residues.
The results of individual fit (kex values) are shown in Table S1.

5
Figure S1 continued
Figure S1c. 15N CPMG-RD profiles of the nSH3 domain, which is mixed with PRM758. Based on the Kd,
the population of the nSH3:PRM758 complex is estimated to be ~5 % of the entire population of nSH3
domain. The residue numbers are shown in each figure. The blue and red circles represent the data
acquired at 14.1 T and 18.8 T, respectively. The solid lines represent the best fit to the individual residues.
The results of individual fit (kex values) are shown in Table S1.

6
Figure S2
Figure S2. The NMR titration result showing the binding between the nSH3 domain and PRM758. The
gradual changes of peaks indicate that the binding process occurs in the intermediate – fast NMR
timescales.

7
Figure S3
Figure S3. The 15N CPMG-RD profiles of the peaks that were included in the analysis of binding
between nSH3 domain and PRMs. The residue numbers are shown on top of each panel. The blue and red
circles represent the CPMG-RD data for for the free and PRM-saturated nSH3 domains, respectively. For
clarity, only the data obtained at 800MHz are shown.

8
Figure S4
Figure S4. Correlation of ∆δ and (a) ∆ω or (b) φex at different temperatures. The diagonal line in (a) is
shown to guide the eye and is not a regression curve. The line in (b) is a linear regression line.
9
Figure S5
Figure S5. Fluorescence-probed binding isotherm between PRM758 and the nSH3 domain in the presence
of 1 M NaCl at 298 K.