Embed Size (px)
Citation preview
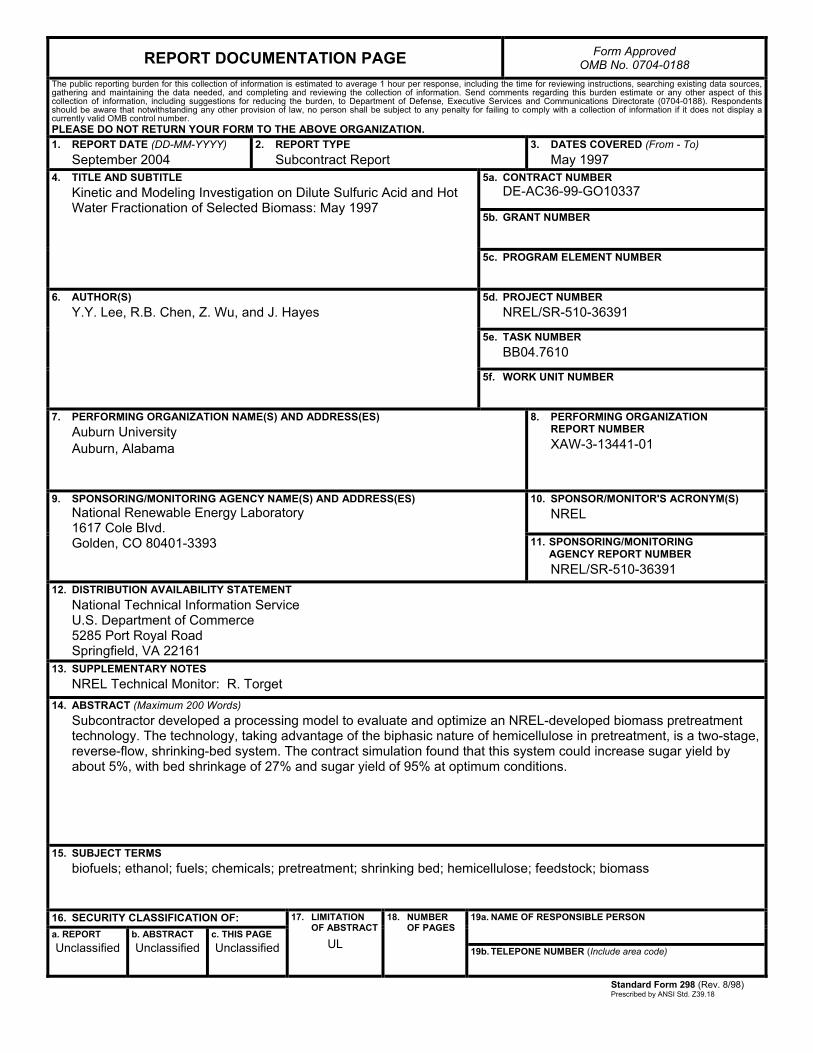
September 2004 • NREL/SR-510-36391
Y.Y. Lee, R.B. Chen, Z. Wu, and J. Hayes Auburn University Auburn, Alabama
Kinetic and Modeling Investigation on Dilute Sulfuric Acid and Hot Water Fractionation of Selected Biomass Plan May 1997
National Renewable Energy Laboratory 1617 Cole Boulevard, Golden, Colorado 80401-3393 303-275-3000 • www.nrel.gov
Operated for the U.S. Department of Energy Office of Energy Efficiency and Renewable Energy by Midwest Research Institute • Battelle
Contract No. DE-AC36-99-GO10337
September 2004 • NREL/SR-510-36391
Kinetic and Modeling Investigation on Dilute Sulfuric Acid and Hot Water Fractionation of Selected Biomass Plan May 1997
Y.Y. Lee, R.B. Chen, Z. Wu, and J. Hayes Auburn University Auburn, Alabama
NREL Technical Monitor: R. Torget Prepared under Subcontract No. XAW-3-13441-01
National Renewable Energy Laboratory 1617 Cole Boulevard, Golden, Colorado 80401-3393 303-275-3000 • www.nrel.gov
Operated for the U.S. Department of Energy Office of Energy Efficiency and Renewable Energy by Midwest Research Institute • Battelle
Contract No. DE-AC36-99-GO10337
This publication was reproduced from the best available copy Submitted by the subcontractor and received no editorial review at NREL
NOTICE
This report was prepared as an account of work sponsored by an agency of the United States government. Neither the United States government nor any agency thereof, nor any of their employees, makes any warranty, express or implied, or assumes any legal liability or responsibility for the accuracy, completeness, or usefulness of any information, apparatus, product, or process disclosed, or represents that its use would not infringe privately owned rights. Reference herein to any specific commercial product, process, or service by trade name, trademark, manufacturer, or otherwise does not necessarily constitute or imply its endorsement, recommendation, or favoring by the United States government or any agency thereof. The views and opinions of authors expressed herein do not necessarily state or reflect those of the United States government or any agency thereof.
Available electronically at http://www.osti.gov/bridge
Available for a processing fee to U.S. Department of Energy and its contractors, in paper, from:
U.S. Department of Energy Office of Scientific and Technical Information P.O. Box 62 Oak Ridge, TN 37831-0062 phone: 865.576.8401 fax: 865.576.5728 email: mailto:[email protected]
Available for sale to the public, in paper, from: U.S. Department of Commerce National Technical Information Service 5285 Port Royal Road Springfield, VA 22161 phone: 800.553.6847 fax: 703.605.6900 email: [email protected] online ordering: http://www.ntis.gov/ordering.htm
Printed on paper containing at least 50% wastepaper, including 20% postconsumer waste
TABLE OF CONTENTS
Task 1 . Modeling and Simulation of a Shrinking bed Reactor Operation of Pretreatment . Summary ....................................................................................................................... 4 Introduction .................................................................................................................. 5 Model Development ...................................................................................................... 6 Results and Discussion ................................................................................................ 12 Conclusions ................................................................................................................ 24 References .................................................................................................................. 27
Task2 . Biomass Pretreatment with Carbonic Acid ............................................................... 28 Summary ..................................................................................................................... 28 Introduction ................................................................................................................ 29 Materidmethod .......................................................................................................... 31 Results and Discussion ................................................................................................ 3 5
Carbonic acid as a pretreatment agent ................................................................. 35 Effect of presoaking ............................................................................................ 35 Effect of pumping ............................................................................................... 35 Carbonic acid pretreatment with ambient front pressure ...................................... 3 8 Carbonic acid pretreatment with front and back pressure ..................................... 41 Optimization of pressurized carbonic acid pretreatment ....................................... 43 Enzymatic Digestibility ....................................................................................... 45 Hemicellulose removal and parameters optimization ............................................ 45 Variation of second stage reaction temperature .................................................. -48 Variation of first stage reaction temperature ........................................................ 50 Reaction time per stage ....................................................................................... 54 Delignification .................................................................................................... 5 6 Future Work ....................................................................................................... 56
. . . . .
* .
Task 3 . NREL Sample Analysis ............................................................................................. 57
Appendix 1 . Fortran Source Codes for Modeling and Simulation of a Shrinking bed Reactor Operation of Pretreatment .
2
ABBREVIATIONS
Greek
Y rl
Pi
e 6
Subscript 0
overall nS
S
Superscript i
initial xylan concentration in percolation, % concentration of hemicellulose as xylose in the reactor frequency factor for rate constant = A”’kOiexp(Ei/RT), min*’ reactor length, cm velocity inside percolation reactor, cdmin reactor volume yield
k;L/u ratio of solubilized lignin to solubilized hemicellulose composition of hemicellulose in solid biomass conversion of hemicellulose during hydrolysis shrinking factor, the ratio of the reactor volume after a compression operation to that of before the compression operation tu/L
value at t = 0 non-shrinking bed operation overall value based on initial condition shrinking bed operation
ith operation j th operation
3
Task 1. Modeling and Simulation of a Shrinking Bed Reactor Operation of Pretreatment.
ABSTRACT
For many lignocellulosic substrates, hemicellulose is known to be biphasic upon
dilute acid treatment. The biphasic nature of the substrate led to a modified percolation process
employing simulated two-stage reverse-flow . This process has been proven, both theoretically
and experimentally, to improve the process attaining substantially higher sugar yield and
concentration over the conventional percolation process. The dilute-acid pretreatment of biomass
is basically a solubilization of the hemicellulose fraction in the solid biomass. As the reaction
proceeds the hemicellulose is removed leaving less amount of solid biomass in the reactor. Ths
creates a situation whereby the depth of the bed is continually reduces. A bed-shrinking model
was therefore developed to describe the two-stage reverse flow reactor operated for hydrolysis of
a biphasic substrates including hemicellulose in corn cobhtover mixture (CCSM). The simulation
results indicate that the shrinking bed operation increases the sugar yield by about 5% in
comparison to the non-shrinking bed operation at a representative t value of 1 .O. A simulated
optimal run Eurther reveals that fast portion of hemicellulose is almost completed hydrolyzed in
the first stage, the slow portion of hemicellulose being hydrolyzed in the second stage. Under
optimum condition, the bed shrinkage reached 27% (a near maximum value) and the sugar yield
upward of 95% was attainable.
4
INTRODUCTION
Pretreatment is a necessary a necessary element in the bioconversion of lignocellulosic
biomass into firels and chemicals. Treatment with dilute sulfbric acid is one of viable process
options in the biomass pretreatment. A concern, however, arises in this approach that the sugars
are decomposed under high temperature and low pH to form undesirable components that are
toxic to the subsequent fermentation microorganism. It is an important issue to select proper
reaction conditions, reactor configurations, and operation conditions. Previous studies along
these lines( 1-4) have established that a percolation reactor (packed-bed flow through type) is one
of the reactor types most suitable for biomass pretreatment. In operation of this reactor, the sugar
products are discharged from the reactor as they are formed thus reducing sugar decomposition.
High sugar concentration can also be attained due to high solid to liquid ratio that exists in a
packed-bed reactor. In the ensuing modeling and experimental work (5,6) it was demonstrated
that a two-stage, two-temperature, reverse-flow scheme significantly enhances the overall
performance of the percolation reactor. This particular design was introduced to simulate
counter-current flow of the biomass solid and hydrolysis liquor and to exploit from the fact that
hemicellulose exhibits a biphasic behavior upon dilute acid hydrolysis. In the temperature policy, a
low temperature is applied in the first stage to hydrolyze the easily hydrolyzable xylan, then a high
temperatures applied in the second stage to hydrolyze the resilient fraction of the xylan.
The acid based pretreatment of biomass is basically a solubilization of hemicellulose in
biomass. In our previous modeling work (9, an assumption was made that the bulk packing
volume of the solid biomass in the reactor remains constant during the hydrolysis. It was done so
to retain the linearity of the governing equations. However, in actual operation, the bulk packing
5
density of the solid biomass in the reactor is indeed changing due to solubilization of the
hemicellulose. As the reaction proceeds the hemicellulose is removed leaving less solid biomass in
the reactor. To fbrther optimize the pretreatment process, a shrinking bed reactor was proposed
by NREL (7). It was designed to keep the bulk packing density of the solid biomass in the reactor
at a constant level such that a high so1id:liquid ratio, consequently a high product concentration
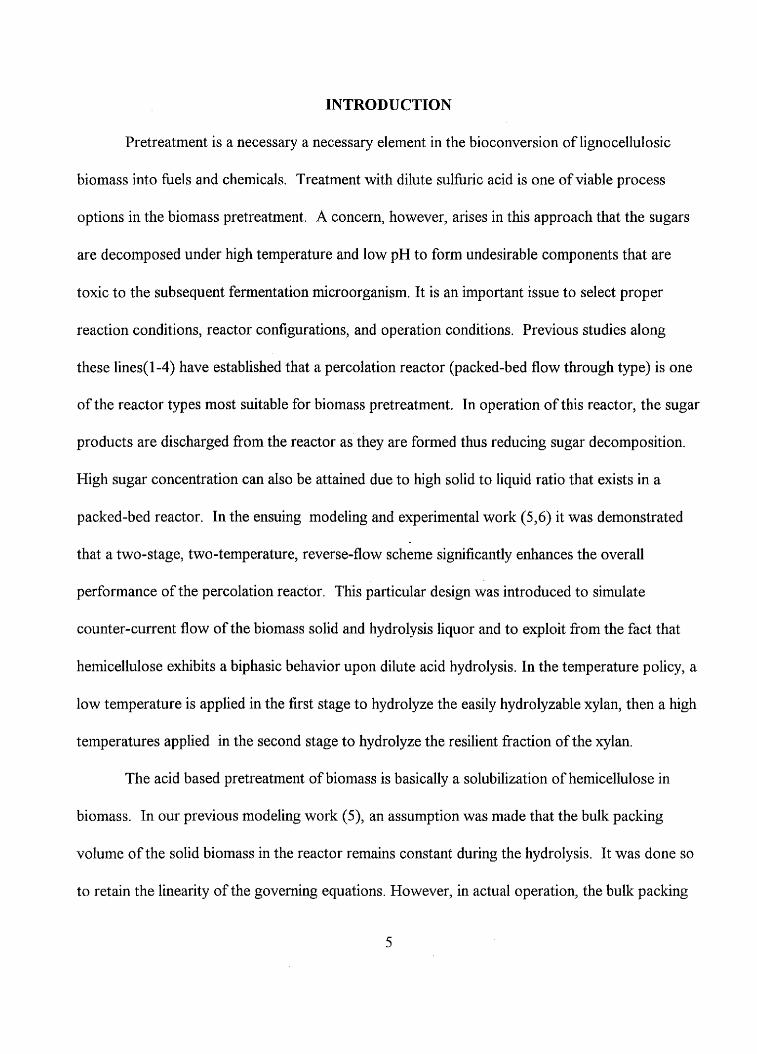
can be obtained. Figure 1 shows a simplified diagram of a shrinking bed, percolation reactor.
The reactor has a fixed and a movable end. The movable end is supported by a compressed
spring. The gradual depletion of the packed solid biomass as the reaction progresses in the bed
causes the particle structure to be less dense. The spring-attached movable end then moves
forward to press the loose biomass particles closer. By this mechanism, the bulk packing density
of the lignocellulosic biomass can be maintained at a constant level. In this work, a process
modeling and simulation was carried out for this shrinking bed reactor as it is applied to the acid
hydrolysis of lignocellulosic.
The investigation was undertaken to establish a process model for the shrinking bed
reactor operating prehydrolysis reaction on the hemicellulose of corn cobs/stover mixture
(CCSM). The modeling work was directed toward optimal operation of the shrinking-bed reactor
and analysis on the bed-shrinking phenomena. The issues addressed in the modeling and
simulation were the extent and the effect of bed-shrinking, substrate variation in the reactor,
product yield and concentration.
MODEL DEVELOPMENT
The shrinking bed reactor is still a percolation reactor with solid bed gradually shrinking
6
during the hydrolysis. The shrinkage occurs because of solubilization of hemicellulose in solid
biomass (Figure 1). The effective volume of the reactor (or length of solid bed of biomass in the
percolation reactor) is related to hemicellulose conversion. For a differential value of zi, or a
differential amount of acid fluid, the percolation process can be assumed to be a non-shrinking
bed reactor since a differential amount of hemicellulose is removed during that time span. The
non-shrinking process is then followed by a compression stage in which only compression of the
biomass occurs to regain its original packing density. It is assumed that no reaction occurs in this
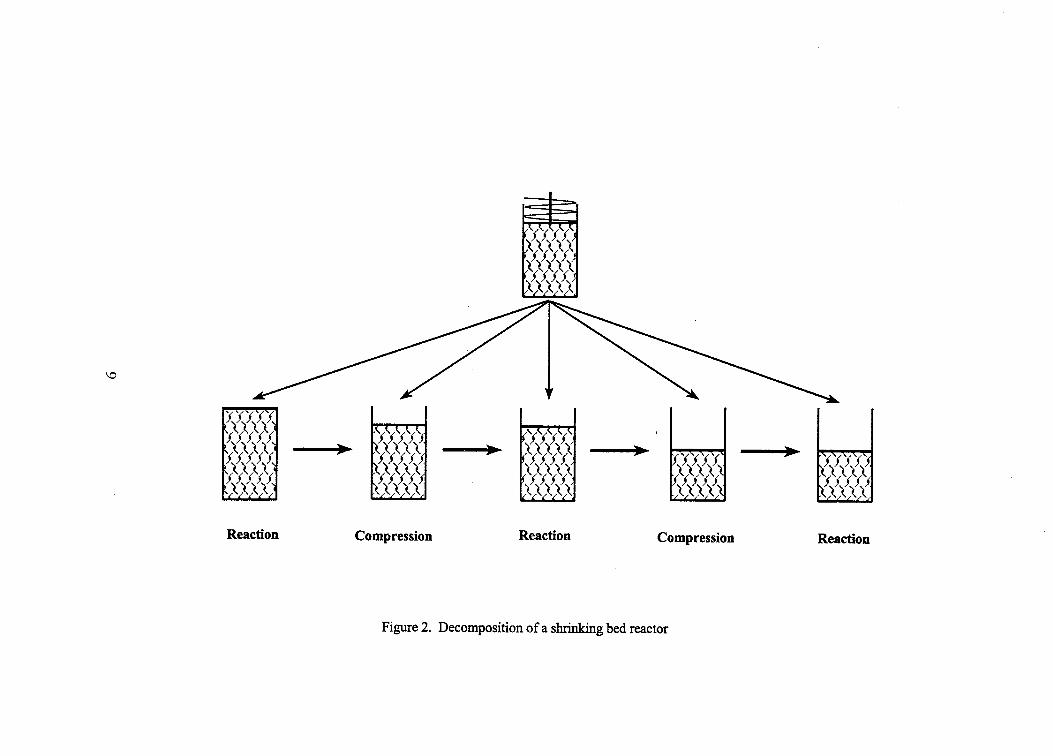
stage. The model development for the shrinking bed reactor operation can be decoupled as
shown in Figure 2, to repeated operation of non-shrinking bed reaction with a differential amount
of liquid ti followed by a compression process. Adoption of this method allows the governing
partial differential equations to be in linear form. Therefore the analytical solution previously
obtained for non-shrinlung bed operation (5) becomes directly applicable to the present case..
A shrinking factor is defined as the ratio of the reactor volume after the ith compression
operation to that before the ith compression operation.
5'=- V ' vi-1
For the cylinder reactor, Equation (1) can also be expressed as, in terms of reactor length,
(I 1) is the hnction of hemicellulose conversion only
7
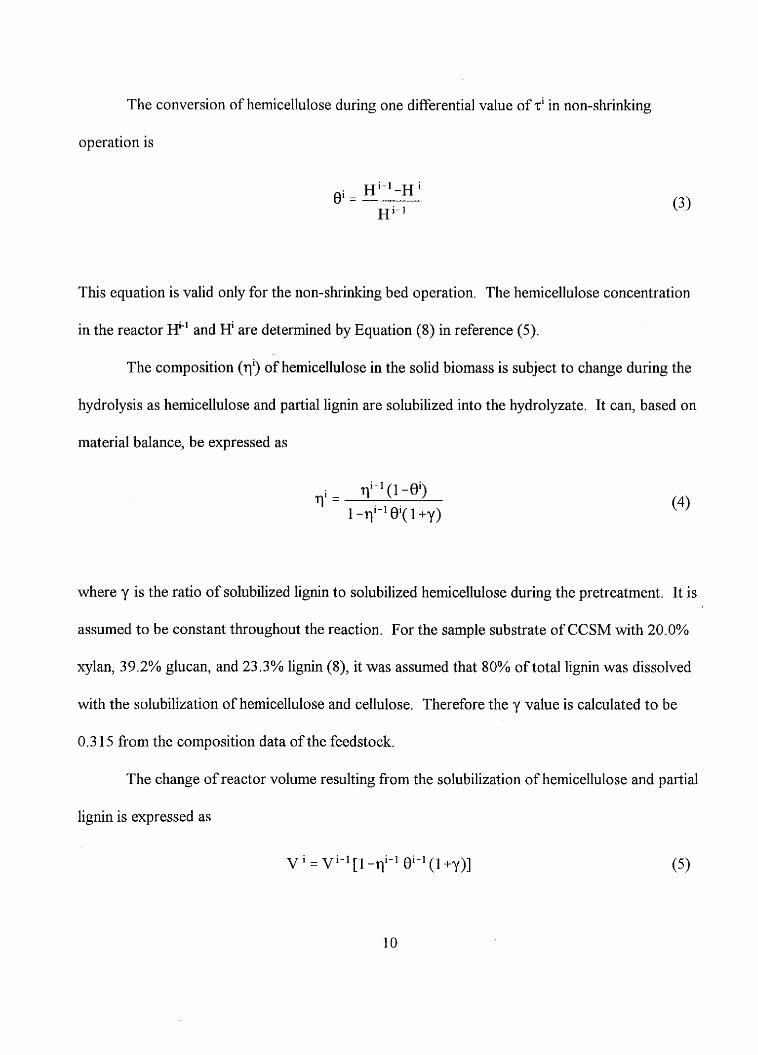
The conversion of hemicellulose during one differential value of z' in non-shrinking
operation is
This equation is valid only for the non-shrinking bed operation. The hemicellulose concentration
in the reactor IT1 and €€ are determined by Equation (8) in reference (5).
The composition (qi) of hemicellulose in the solid biomass is subject to change during the
hydrolysis as hemicellulose and partial lignin are solubilized into the hydrolyzate. It can, based on
material balance, be expressed as
where y is the ratio of solubilized lignin to solubilized hemicellulose during the pretreatment. It is
assumed to be constant throughout the reaction. For the sample substrate of CCSM with 20.0%
xylan, 39.2% glucan, and 23.3% lignin (S), it was assumed that 80% of total lignin was dissolved
with the solubilization of hemicellulose and cellulose. Therefore the y value is calculated to be
0.3 15 from the composition data of the feedstock.
The change of reactor volume resulting from the solubilization of hemicellulose and partial
lignin is expressed as
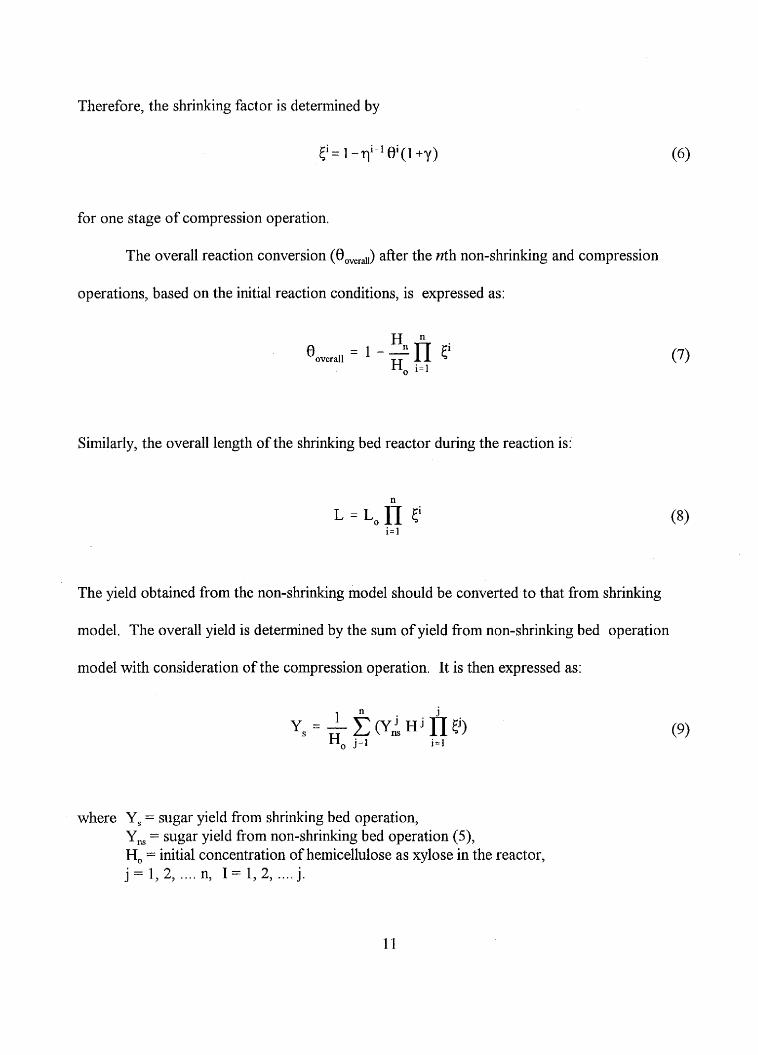
Therefore, the shrinking factor is determined by
5' = 1 - li-l @(I +r)
for one stage of compression operation.
The overall reaction conversion (€loverall) after the nth non-shrinking and compression
operations, based on the initial reaction conditions, is expressed as:
Similarly, the overall length of the shrinking bed reactor during the reaction is:
n L = Lo rI ti
i= 1
The yield obtained from the non-shrinking model should be converted to that from shrinking
model. The overall yield is determined by the sum of yield from non-shrinhng bed operation
model with consideration of the compression operation. It is then expressed as:
where Y, = sugar yield from shrinking bed operation, Y,, = sugar yield from non-shrinking bed operation (9, H, = initial concentration of hemicellulose as xylose in the reactor, j = 1 , 2 , . . . . n, I = 1 , 2 ,.... j .
11
FWSULTS AND DISCUSSION
The shrinking bed operation is quite similar to the non-shrinking bed operation except that
there is a compression stage between each non-shrink reaction process which undergoes a
differential reaction period of z' in the shrinking bed operation. The compression process
increases the solid packing density to its previous level. This compression process will not change
the biomass composition but only the initial solid concentration. Therefore, the optimum
temperature step-change applied to the non-shrinking operation is also applied to the shrinking
bed operation, and they were used in the shrinking process. The bed depth in the shrinking bed
operation is changing during the reaction. The optimum flow rate therefore needs to be adjusted
in response to the reduced liquid residence time. The actual computation of the modeling work
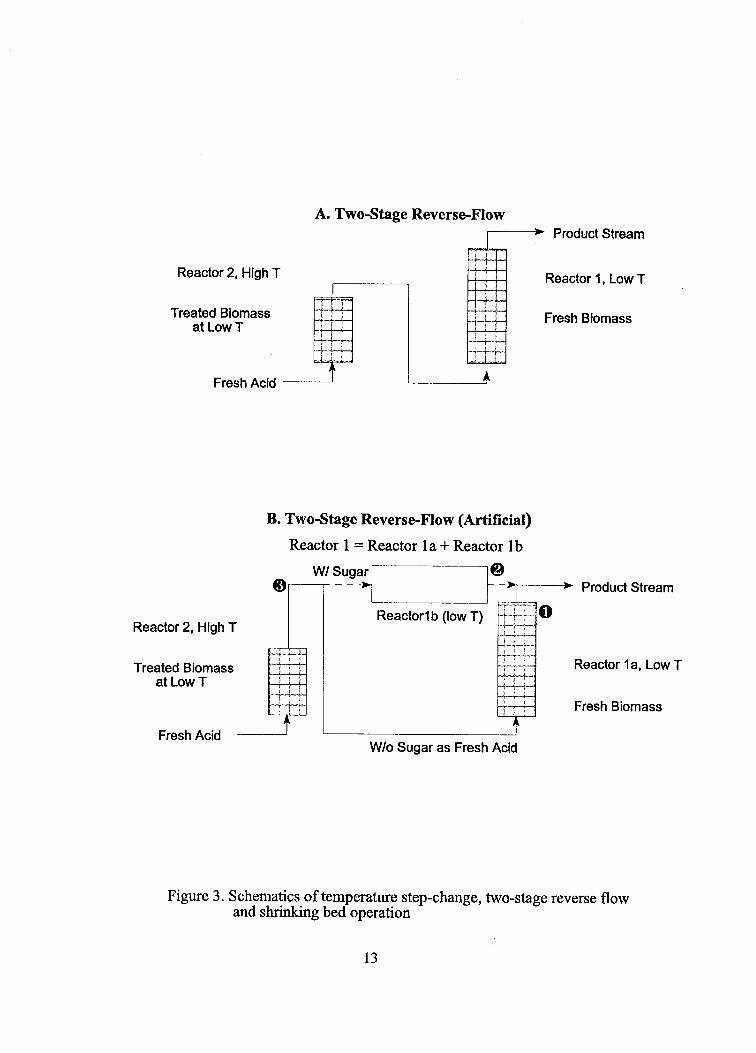
was done for CCSM. A two-stage reverse flow operation (Figure 3A), is identical in theory to
the process shown in Figure 3B(5). The shrinking bed process was modeled and simulated on the
basis of the scheme of Figure 3B.
Effect of acid flow rate and T
In the previous non-shrinking bed model, the optimum flow rate (from pi = kL/u) is
obtained for a given reactor length at certain temperature (5). The term pi is an optimized
operational parameter. If the length of the reactor is reduced, the flow rate of the liquid u should
also be reduced to maintain the parameter at its optimum. However, this operation is not
convenient in the practical application. We have studied the effect of flow rate of acid fluid on
sugar yield by applying a constant flow rate operation. Figure 4 shows the effect of flow rate on
sugar yield at optimum temperature step change (140 - 170 "C). For a given T, there is an
12
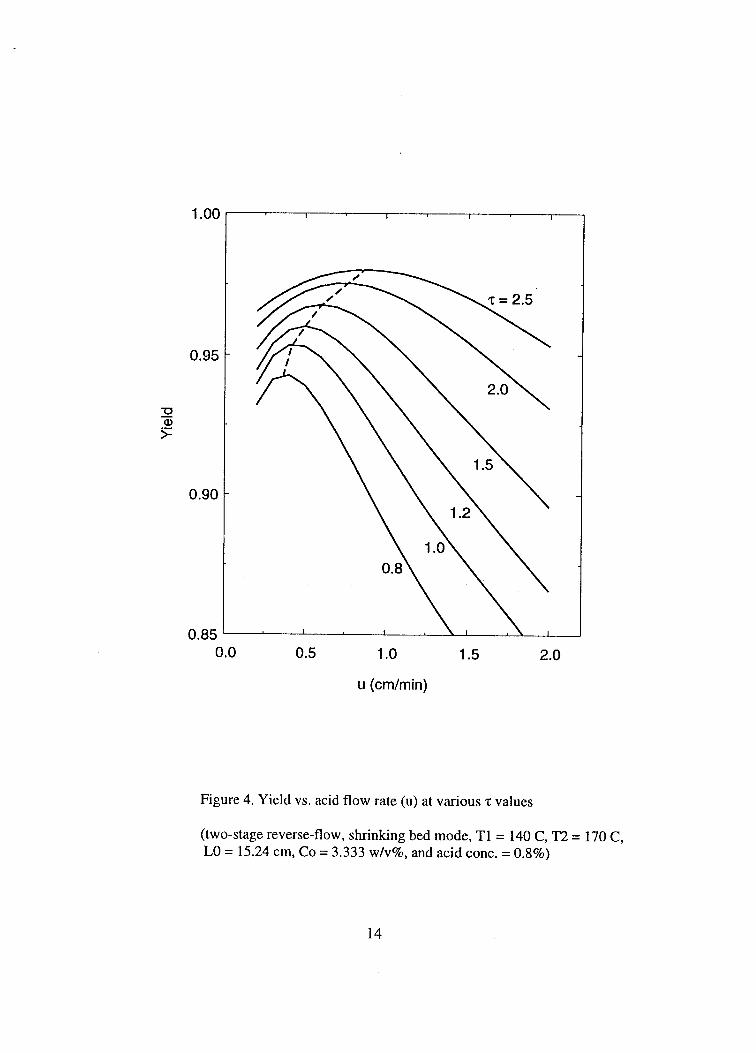
optimum u to obtain the maximum yield. For ~=0.8 , maximum yield of 0.94 is obtained at u =
0.4 cdmin, whereas ~ = 2 . 5 , the maximum yield of 0.98 is obtained at u = 0.8. High T value gives
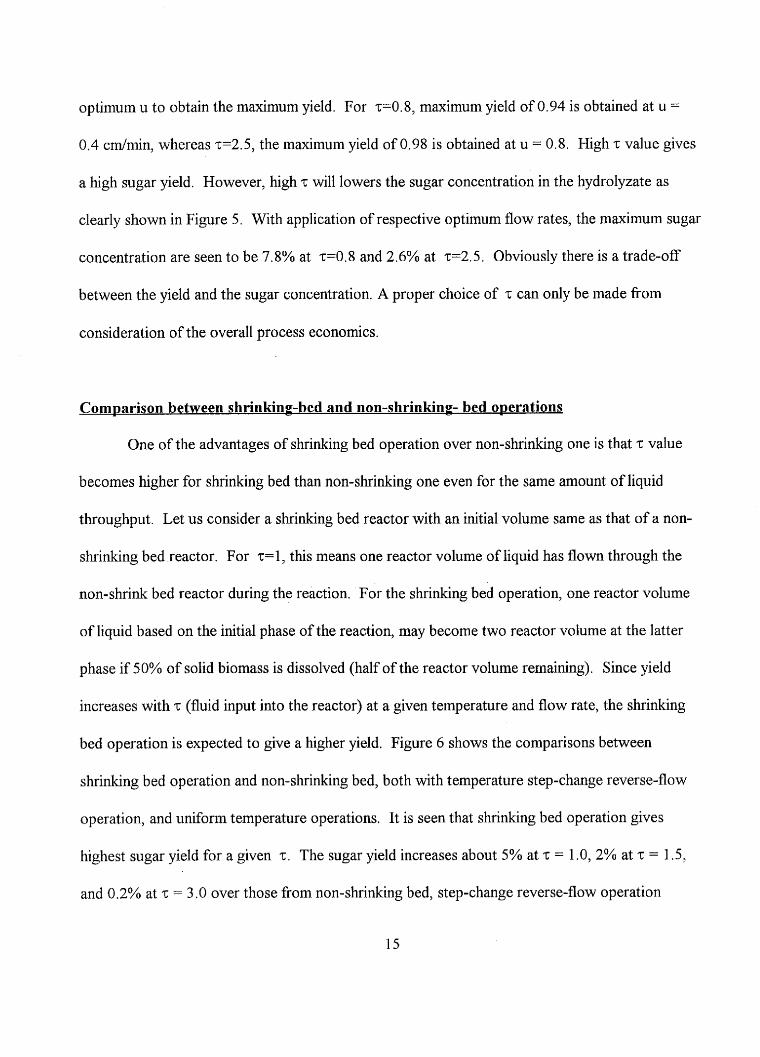
a high sugar yield. However, high T will lowers the sugar concentration in the hydrolyzate as
clearly shown in Figure 5. With application of respective optimum flow rates, the maximum sugar
concentration are seen to be 7.8% at ~ 0 . 8 and 2.6% at a=2.5, Obviously there is a trade-off
between the yield and the sugar concentration. A proper choice of ‘I; can only be made from
consideration of the overall process economics.
Corn paris on between s h rin kin g- bed and no n-s h r in kin g- bed operations
One of the advantages of shrinking bed operation over non-shrinking one is that z value
becomes higher for shrinking bed than non-shrinking one even for the same amount of liquid
throughput. Let us consider a shrinking bed reactor with an initial volume same as that of a non-
shrinking bed reactor. For ~ = l , this means one reactor volume of liquid has flown through the
non-shrink bed reactor during the reaction. For the shrinking bed operation, one reactor volume
of liquid based on the initial phase of the reaction, may become two reactor volume at the latter
phase if 50% of solid biomass is dissolved (half of the reactor volume remaining). Since yield
increases with T (fluid input into the reactor) at a given temperature and flow rate, the shrinking
bed operation is expected to give a higher yield. Figure 6 shows the comparisons between
shrinking bed operation and non-shrinking bed, both with temperature step-change reverse-flow
operation, and uniform temperature operations. It is seen that shrinking bed operation gives
highest sugar yield for a given T. The sugar yield increases about 5% at a = 1 .O, 2% at ‘G = 1.5,
and 0.2% at ?; = 3 .O over those from non-shrinking bed, step-change reverse-flow operation
15
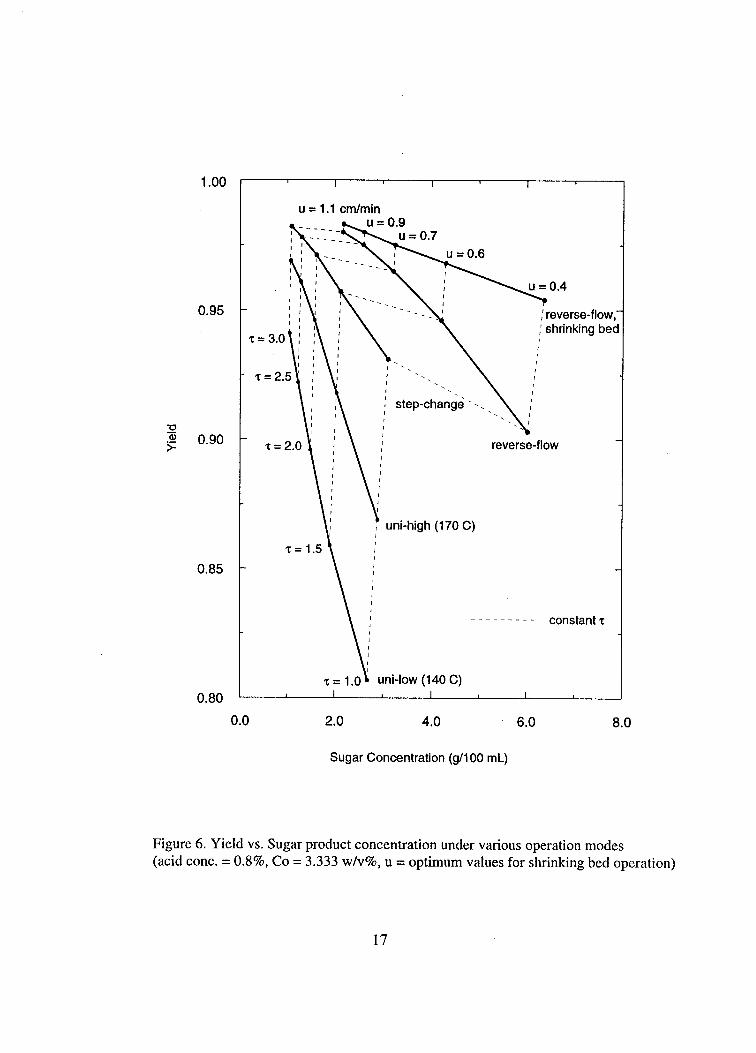
modes. The sugar concentration from the shrinking bed operation is sightly higher than that of
non- shrinking bed operation.
Overa11 liernicellulose conversion
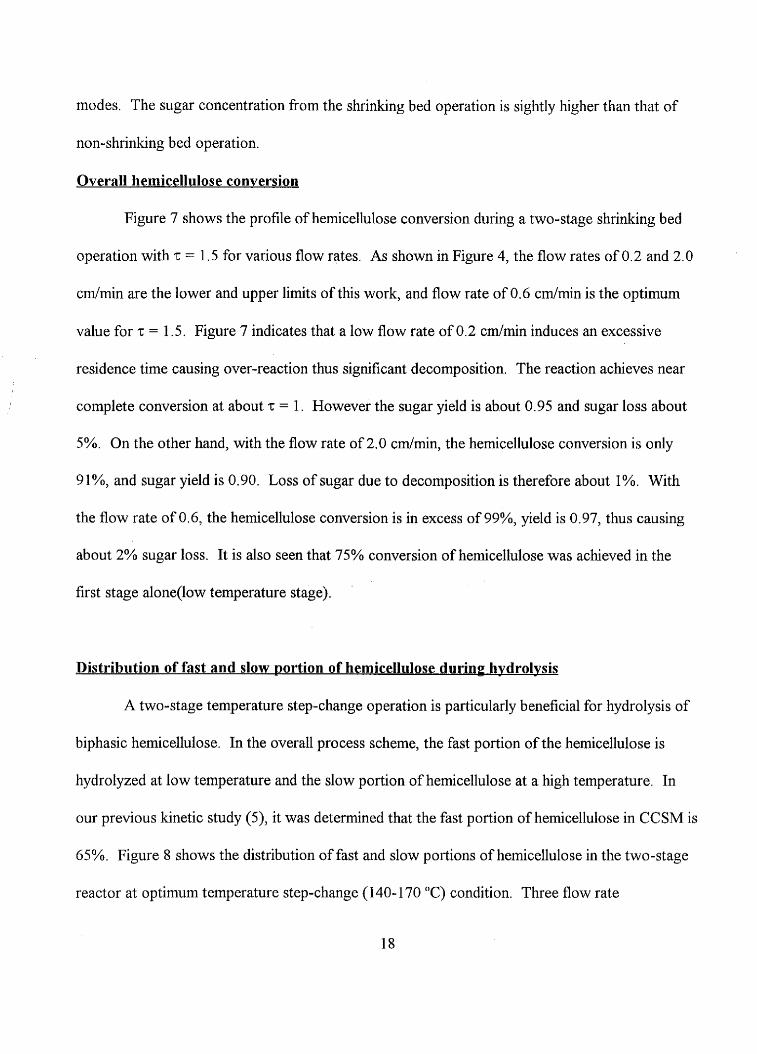
Figure 7 shows the profile of hemicellulose conversion during a two-stage shrinking bed
operation with t = 1.5 for various flow rates. As shown in Figure 4, the flow rates of 0.2 and 2.0
crdmin are the lower and upper limits of this work, and flow rate of 0.6 c d m i n is the optimum
value for T = I S . Figure 7 indicates that a low flow rate of 0.2 cdmin induces an excessive
residence time causing over-reaction thus significant decomposition. The reaction achieves near
complete conversion at about T = 1. However the sugar yield is ab.out 0.95 and sugar loss about
5%. On the other hand, with the flow rate of 2.0 cdmin, the hemicellulose conversion is only
91%, and sugar yield is 0.90. Loss of sugar due to decomposition is therefore about I%. With
the flow rate of 0.6, the hemicellulose conversion is in excess of 99%, yield is 0.97, thus causing
about 2% sugar loss. It is also seen that 75% conversion of hemicellulose was achieved in the
first stage alone(1ow temperature stage).
Distribution of fast and slow portion of hemicellulose during hydrolvsis
A two-stage temperature step-change operation is particularly beneficial for hydrolysis of
biphasic hemicellulose. In the overall process scheme, the fast portion of the hemicellulose is
hydrolyzed at low temperature and the slow portion of hemicellulose at a high temperature. In
our previous kinetic study (5), it was determined that the fast portion of hemicellulose in CCSM is
65%. Figure 8 shows the distribution of fast and slow portions of hemicellulose in the two-stage
reactor at optimum temperature step-change ( I 40- 170 "C) condition. Three flow rate
18
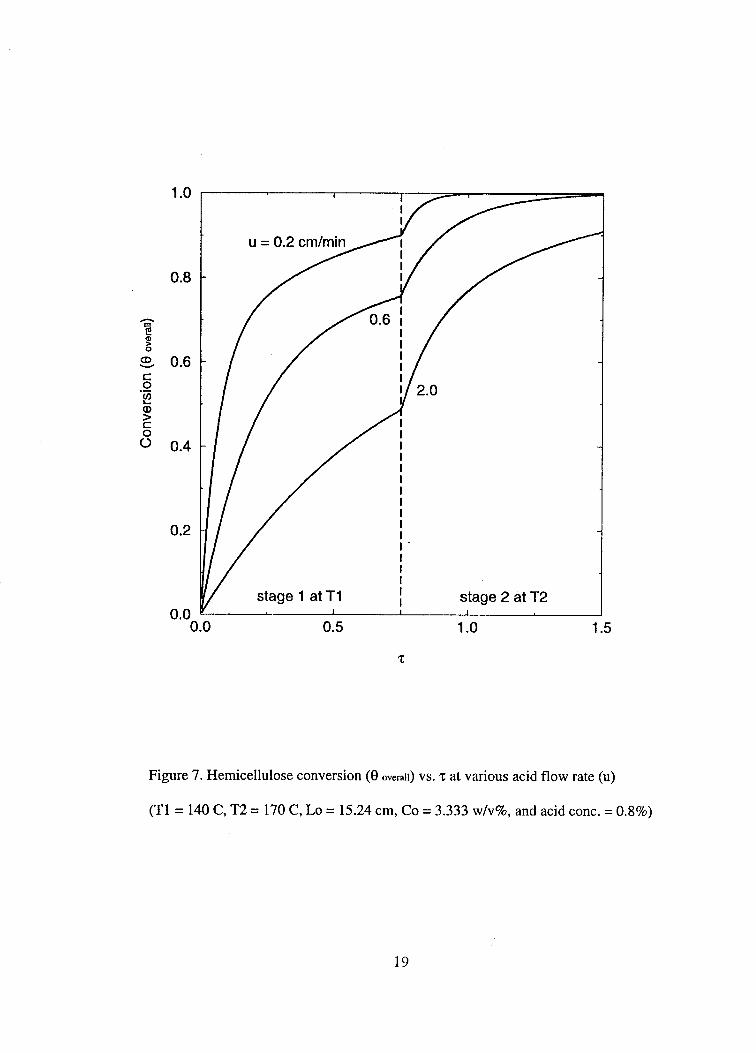
conditions of 0.2, 0.6, and 2.0 crdmin at ~ 1 . 5 , were applied in the study. For the case of u = 0,2
cm/min, fast portion of hemicellulose was quickly dissolved at the early stage, at T less than 0.5,
and about 60% slow portion of hemicellulose was hydrolyzed after first stage’. The remaining
slow portion of hemicellulose was completely hydrolyzed in the second stage with it final sugar
yield of 0.95. For u = 2.0, only about 60% fast portion and no slow portion of hemicellulose
were hydrolyzed after the first stage. The remaining fast portion and about 61% slow portion of
hemicellulose were dissolved after the second stage, giving sugar yield of only 0.90 due to
incomplete hydrolysis. With ~ ~ 0 . 4 and z = I .5 (the optimum point), about 97%of the fast portion
and 19%of the slow portion of were hydrolyzed after the first stage. The remainder of the fast
portion and W%of the slow portion of were hydrolyzed after second stage to give the total of
97% yield.
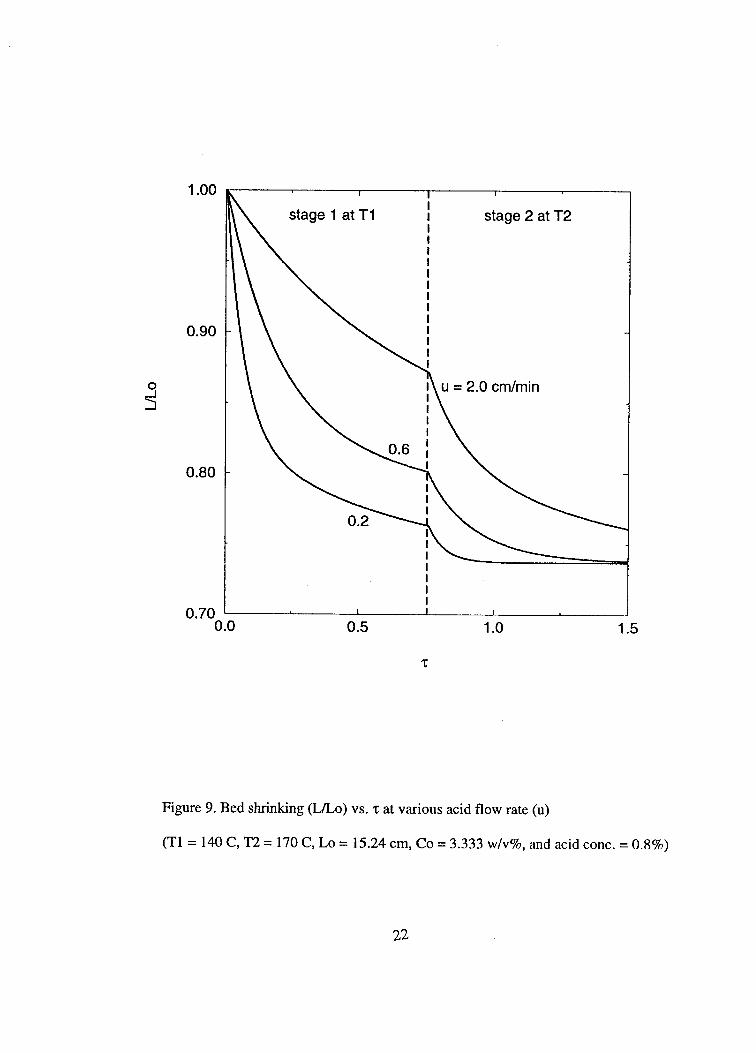
Bed shrinkinp durinp hpdrolvsis
In the bed-shrinking model, the shrinking process is terminated when the hydrolysis
reaction of hemicellulose is completed. Figure 9 shows the extent of shrinkage for the period of
T = 1.5 at various liquid flow rates (u). For the flow rate of 0.2 cdmin, the shrinking process
was terminated at about ‘G = 1 .O due to the completion of the hydrolysis process. The bed
shrinkage was 27% at the completion of the hydrolysis. The shrinkage was about 24% after the
first stage. For the flow rate of 2.0 cdmin, it is only 13% after the first stage, and 24% after
second stage. The reaction wits not completed after the second stage, At the flow rate of 0.6
cdmin, the solid bed shrank 20% after the first stage and to the maximum 27% after second
stage. The reaction was indeed completed at end of second stage.
21
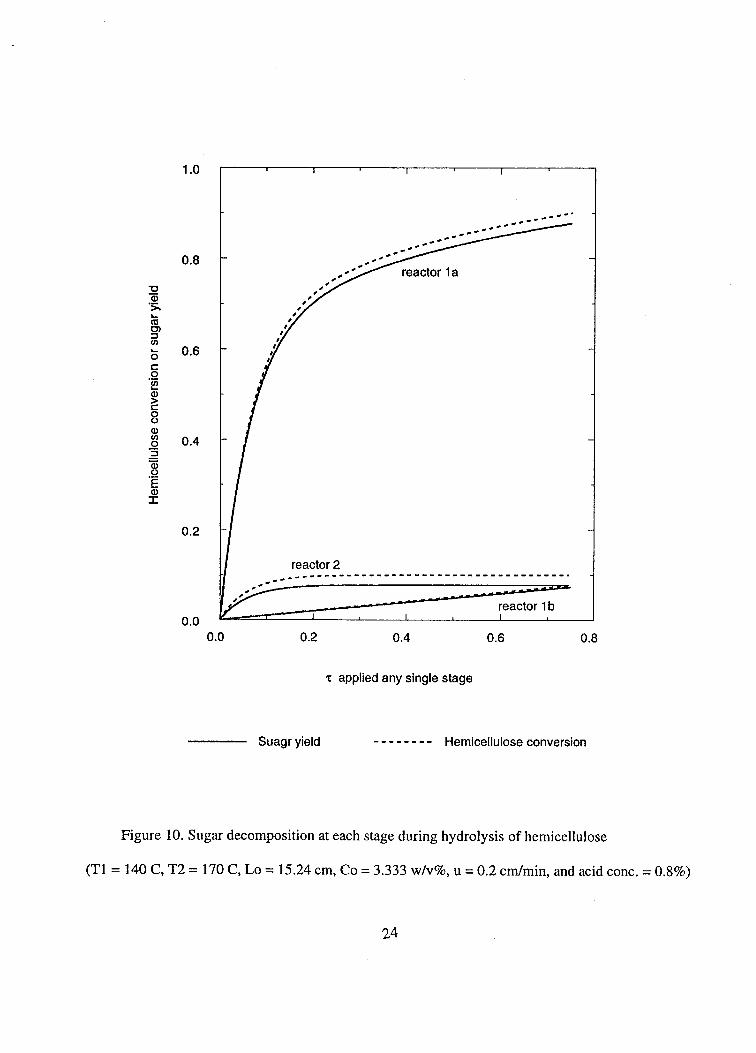
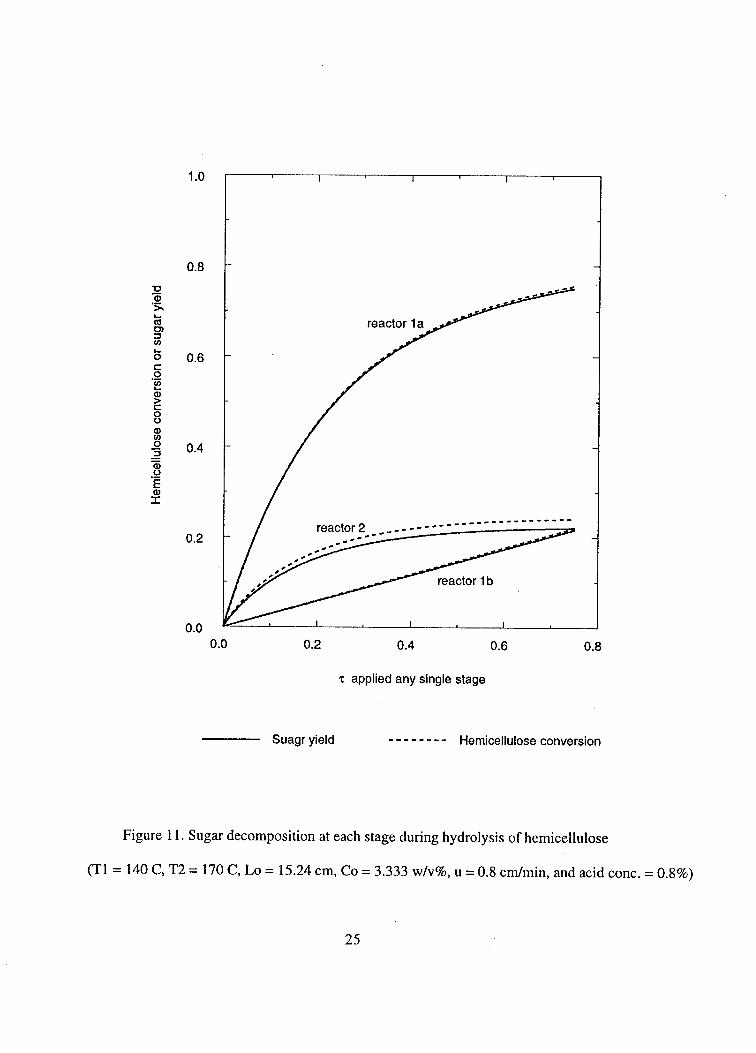
Analysis of suyar loss durinp hvdrolpsis of hemicellulose
Sugar produced from the hydrolysis of hemicellulose is subject to decomposition. Figures
10 and I 1 show how the sugar product is decomposed in each stage. The overall z is 1.5 for the
two stage operation (F 0.75 for each stage). With u = 0.2 cdmin, about 2.3% sugar is
decomposed in reactor 1 a, a reactor packed with fresh biomass at low temperature(refer to Fig.
3B for reactors la, lb, 2). About 2.7% sugar is decomposed in reactor 2, a reactor packed with
treated biomass at high temperature. There is only a trace amount of sugar loss from reactor lb,
an artificial reactor without solid biomass. For the optimum run of u = 0.6 cdmin, there is about
2% sugar loss from reactor 2, and much less in reactors la and lb. The improved performance is
attributed to the low temperature condition in reactor la.
23
CONCLUSIONS
A modeling and sirnulation was performed on the shrinking bed, two-stage reverse-flow
reactor operating for dilute acid pretreatment of CCSM. The simulation results have shown that
the shrinking bed operation increases the sugar yield by about 5% in comparison to the non-
shrinking bed operation at a representative ‘I; value of 1 .O. The flow rate has emerged as an
important parameter acutely affecting the performance of the two-stage reactor. A simulated
optimal run at t = 1.5 reveals that fast portion of hemicellulose is almost completed hydrolyzed
after the first stage reaction. Most of the slow portion of hemicellulose is hydrolyzed in the
second stage. The simulation results fhrther proves that the two-stage operation is well suited for
hydrolysis of a biphasic substrates including hemicellulose in CCSM. With application of
optimum flow rate, the bed shrinkage reached near maximum of 27% giving almost complete
conversion of hemicellulose in CCSM. The corresponding yield was upward of 95%. About three
quarters of the total shrinkage occurred after the first stage. Almost all the sugar decomposition
occurred at second stage (the high temperature reactor).
26
REFERENCES
1.
2. 3. 4. 5. 6.
8.
Lee, Y.Y., Lin, C.M., Johnson, T., and Chambers, R.P, (1978), Biotechnol. Bioeng. Symp. 8,
Lirnbaugh, M.L. (1 980), MS Thesis, Auburn University, AL. Cahela, D.R., Lee, Y.Y., and Chambers, R.P. (1983), Biotechnol. Bioeng. 25, 3-17. Kim, B.J., Lee, Y.Y., and Torget, R. W. (1993), Appl. Biotechnol. Bioeng. 39, 119-129. Chen, R. , Lee, Y .Y ., and Torget, R. W. (1 996), Appl. Biotechnol. Bioeng. 57/58, 13 3 - 146.
Torget, R.W., Hayward, T.K., Hatzis, C., and Philippidis, G.P. (1996), Appl. Biotechnol. Bioeng. 57/58, 1 19- 129. Torget, R.W.,Hayward, T. K.,and Elander, R. (1 997), “Total hydrolysis of lignocellulosic biomass using very dilute acid for ethanol production- a novel continual shrinking bed counter-current reactor design’, 1 9th Symposium on Biotechnology for Fuels & Chemicals, Colorado Springs, CO. Chen, R. (1 997), Ph.D. Dissertation, Auburn University AL
75-88.
27
Task 2: Evaluating Carbonic Acid as a Percolation Pretreatment Agent
SUMMARY
The use of carbonic acid as a pretreatment agent has yielded some interesting results. In
comparison to sulfuric acid, carbonic acid has been equally effective in separating the cellulose
and hemicellulose components. The retention of glucose in the remaining solid and the overall
percent solid remaining are higher for the carbonic acid pretreatment than for the sulhric acid
treatment pretreatment. Under optimized conditions, the lignin left in the solid is less for carbonic
acid pretreatment than for sulfbric acid pretreatment.
The enzymatic digestibility is slightly higher for the sulfuric acid treated samples than for the
carbonic acid treated samples. However, due to the greater percent of original biomass retained
in the solid following carbonic acid pretreatment, and the relatively small difference in
digestibility, the overall enzymatic digestibility based on original dry biomass reacted is slightly
greater for carbonic acid pretreatment than for sulfbric acid Pretreatment.
The optimized conditions for the two pretreatment processes differs slightly, in that the
carbonic acid pretreatment conditions are slightly more severe. For the carbonic acid
pretreatment, the optimized reaction conditions are: low temperature 140- 1 SO C, high
temperature 190-200 C, reaction time per stage 20 minutes, flow rate 4.0 mLJmin, with a back
pressure of 450 psi, and a front pressure of 350 psi. The previously determined optimized
conditions for sulfbric acid pretreatment are: low temperature 150 C, high temperature 190 C,
reaction time per stage 15 minutes, flow rate 4.0 ml/min, back pressure 350 psi. The flow rates
and initial low temperatures are relatively the same for the two treatments, whereas the high
28
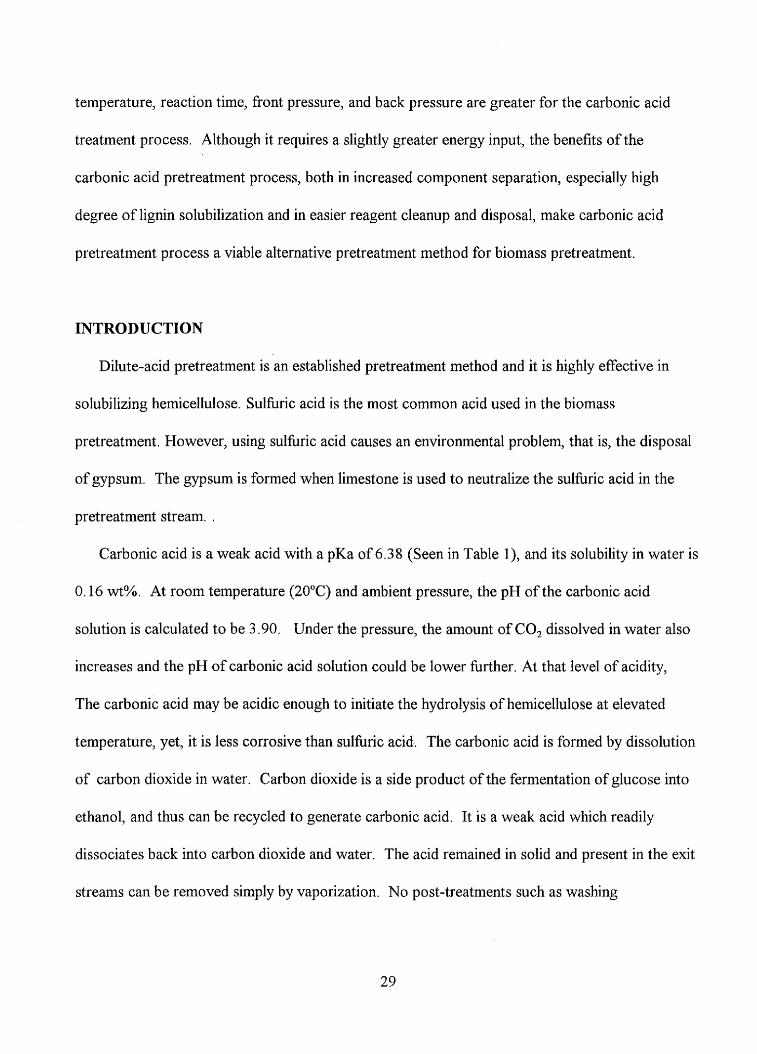
temperature, reaction time, front pressure, and back pressure are greater for the carbonic acid
treatment process. Although it requires a slightly greater energy input, the benefits of the
carbonic acid pretreatment process, both in increased component separation, especially high
degree of lignin solubilization and in easier reagent cleanup and disposal, make carbonic acid
pretreatment process a viable alternative pretreatment method for biomass pretreatment.
INTRODUCTION
Dilute-acid pretreatment is an established pretreatment method and it is highly effective in
solubilizing hemicellulose. Sulfuric acid is the most common acid used in the biomass
pretreatment. However, using sulfbric acid causes an environmental problem, that is, the disposal
of gypsum. The gypsum is formed when limestone is used to neutralize the sulhric acid in the
pretreatment stream. .
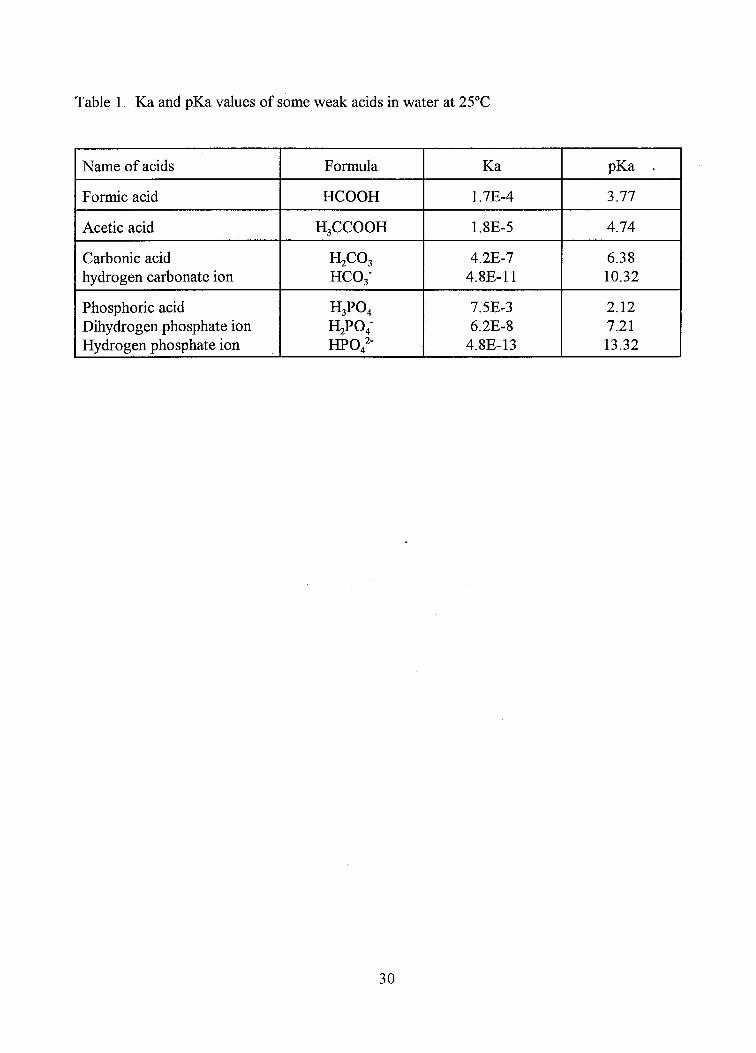
Carbonic acid is a weak acid with a pKa of 6.38 (Seen in Table l), and its solubility in water is
0.16 wt%. At room temperature (20°C) and ambient pressure, the pH of the carbonic acid
solution is calculated to be 3.90. Under the pressure, the amount of CO, dissolved in water also
increases and the pH of carbonic acid solution could be lower further. At that level of acidity,
The carbonic acid may be acidic enough to initiate the hydrolysis of hemicellulose at elevated
temperature, yet, it is less corrosive than sulfbric acid,. The carbonic acid is formed by dissolution
of carbon dioxide in water. Carbon dioxide is a side product of the fermentation of glucose into
ethanol, and thus can be recycled to generate carbonic acid. It is a weak acid which readily
dissociates back into carbon dioxide and water. The acid remained in solid and present in the exit
streams can be removed simply by vaporization. No post-treatments such as washing
29
and neutralization are needed. Carbonic acid based pretreatment therefore has the potential to be
an ecomomical, clean, and environmentally benign method for biomass pretreatment.
Another important feature of carbonic acid as an acidic pretreatment agent is its buffer
property. Because carbonic acid is diprotic, there are two different buffer systems, that is, HC0,-
/H2C03 and CO3-/flCO3-. Bicarbonate ion HC03- acts as the conjugate base of the first system
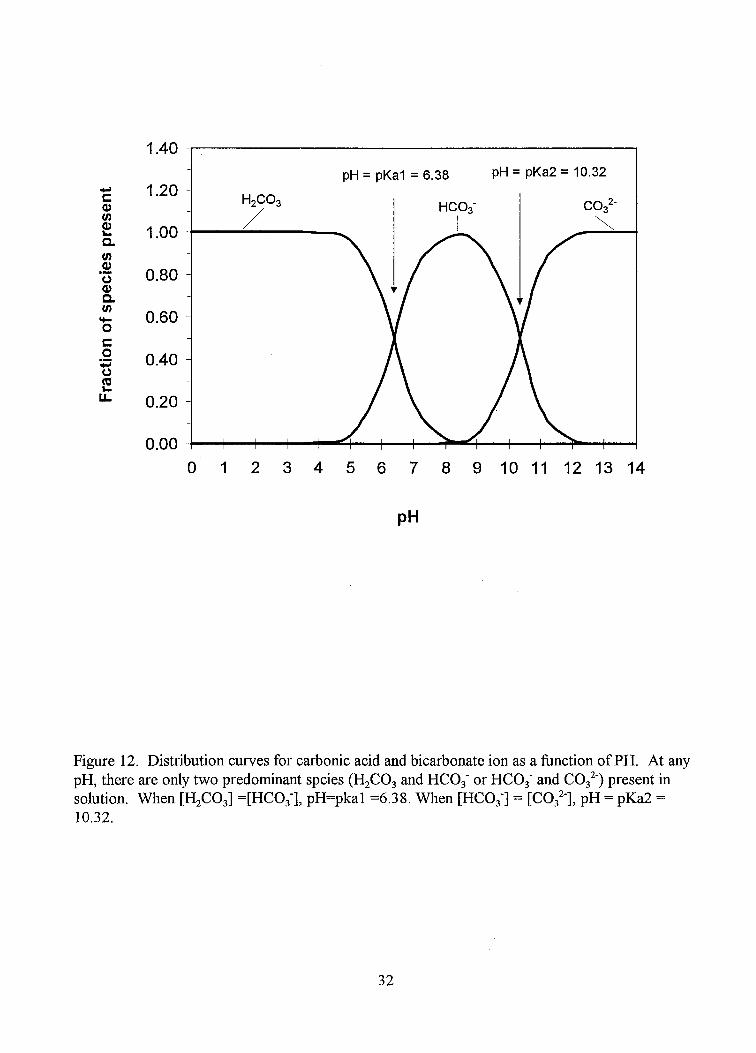
and the acid of the second. The distribution curve of carbonic acid is shown in Figure 12. Its
buffering capacity clearly fbnctions over quite different pH regions. The buffering capability of
carbonic acid may play an important role in the pretreatment. At the initial phase of the
pretreatment, carbonic acid dissociates and forms hydrogen ion to promote the hydrolysis of
hemicellulose. When the acidic component of the hemicellulose fraction dissolves in the solution
and increase the acidity of solution, the carbonic acid buffer can neutralize an appreciable amount
of formed acids and keep pH relatively constant. Consequently, it minimizes the sugar
decomposition.
The purpose of this study is to evaluate carbonic acid as an acidic pretreatment agent. Process
factors such as reaction temperature, time, presoaking etc. were investigated. The Pretreatment
effectiveness was evaluated based the extent of solubilization of hemicellulose and retention of
glucan in solid residue.
MATERIALSMETHODS
Materials
Dry yellow poplar feedstock milled and screened to 10-40 mesh was supplied by the National
Renewable Energy Laboratory (NREL) and used as the lignocellulosic substrate. There was
slight variation in the composition, as determined by NREL Standard Procedures, of the
31
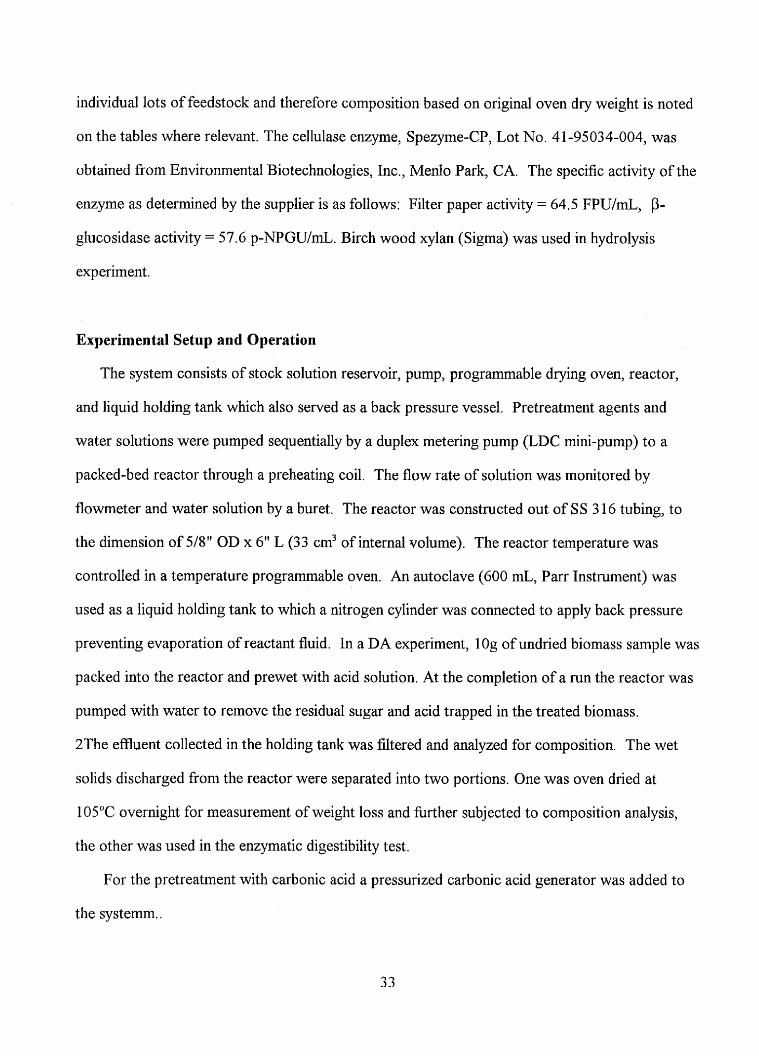
individual lots of feedstock and therefore composition based on original oven dry weight is noted
on the tables where relevant. The cellulase enzyme, Spezyme-CP, Lot No. 41-95034-004, was
obtained from Environmental Biotechnologies, Inc., Menlo Park, CA. The specific activity of the
enzyme as determined by the supplier is as follows: Filter paper activity = 64.5 FPU/mL, p-
glucosidase activity = 57.6 p-NPGU/mL. Birch wood xylan (Sigma) was used in hydrolysis
experiment ,
Experimental Setup and Operation
The system consists of stock solution reservoir, pump, programmable drying oven, reactor,
and liquid holding tank which also served as a back pressure vessel. Pretreatment agents and
water solutions were pumped sequentially by a duplex metering pump (LDC mini-pump) to a
packed-bed reactor through a preheating coil. The flow rate of solution was monitored by
flowmeter and water solution by a buret. The reactor was constructed out of SS 3 16 tubing, to
the dimension of 5/8" OD x 4" L (33 cm3 of internal volume). The reactor temperature was
controlled in a temperature programmable oven. An autoclave (600 mL, Parr Instrument) was
used as a liquid holding tank to which a nitrogen cylinder was connected to apply back pressure
preventing evaporation of reactant fluid. In a DA experiment, 1 Og of undried biomass sample was
packed into the reactor and prewet with acid solution. At the completion of a run the reactor was
pumped with water to remove the residual sugar and acid trapped in the treated biomass.
2The effluent collected in the holding tank was filtered and analyzed for composition. The wet
solids discharged from the reactor were separated into two portions. One was oven dried at
105°C overnight for measurement of weight loss and fkrther subjected to composition analysis,
the other was used in the enzymatic digestibility test.
For the pretreatment with carbonic acid a pressurized carbonic acid generator was added to
the systemrn..
33
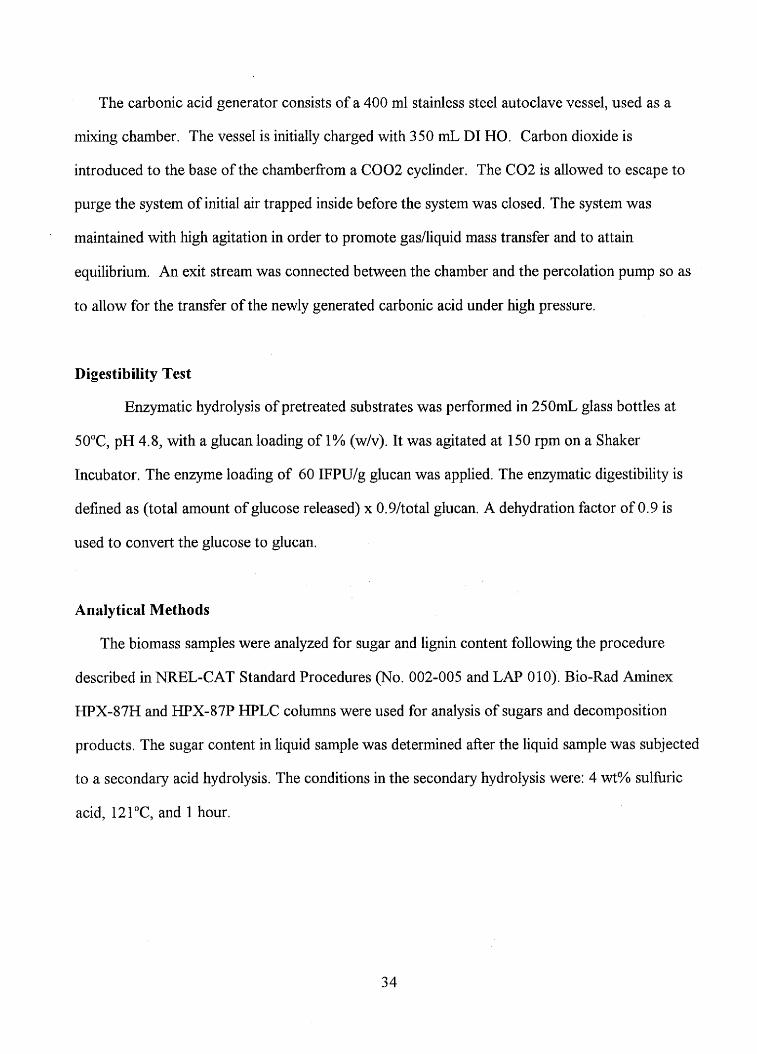
The carbonic acid generator consists of a 400 ml stainless steel autoclave vessel, used as a
mixing chamber. The vessel is initially charged with 350 mL DI HO. Carbon dioxide is
introduced to the base of the chamberfrom a COO2 cyclinder. The C02 is allowed to escape to
purge the system of initial air trapped inside before the system was closed. The system was
maintained with high agitation in order to promote gas/liquid mass transfer and to attain
equilibrium. An exit stream was connected between the chamber and the percolation pump so as
to allow for the transfer of the newly generated carbonic acid under high pressure.
Digestibility Test
Enzymatic hydrolysis of pretreated substrates was performed in 250mL glass bottles at
50°C, pH 4.8, with a glucan loading of 1% (w/v). It was agitated at 150 rpm on a Shaker
Incubator, The enzyme loading of 60 IFPU/g glucan was applied.
defined as (total amount of glucose released) x 0.9/total glucan. A
used to convert the glucose to glucan.
The enzymatic digestibility is
dehydration factor of 0.9 is
AnalyticaI Methods
The biomass samples were analyzed for sugar and lignin content following the procedure
described in hWL-CAT Standard Procedures (No. 002-005 and LAP 0 10). Bio-Rad Aminex
HPX-87H and HPX-87P HPLC columns were used for analysis of sugars and decomposition
products. The sugar content in liquid sample was determined after the liquid sample was subjected
to a secondary acid hydrolysis. The conditions in the secondary hydrolysis were: 4 wt% sulfbric
acid, 121°C, and 1 hour.
34
RESULTS AND DISCUSSION
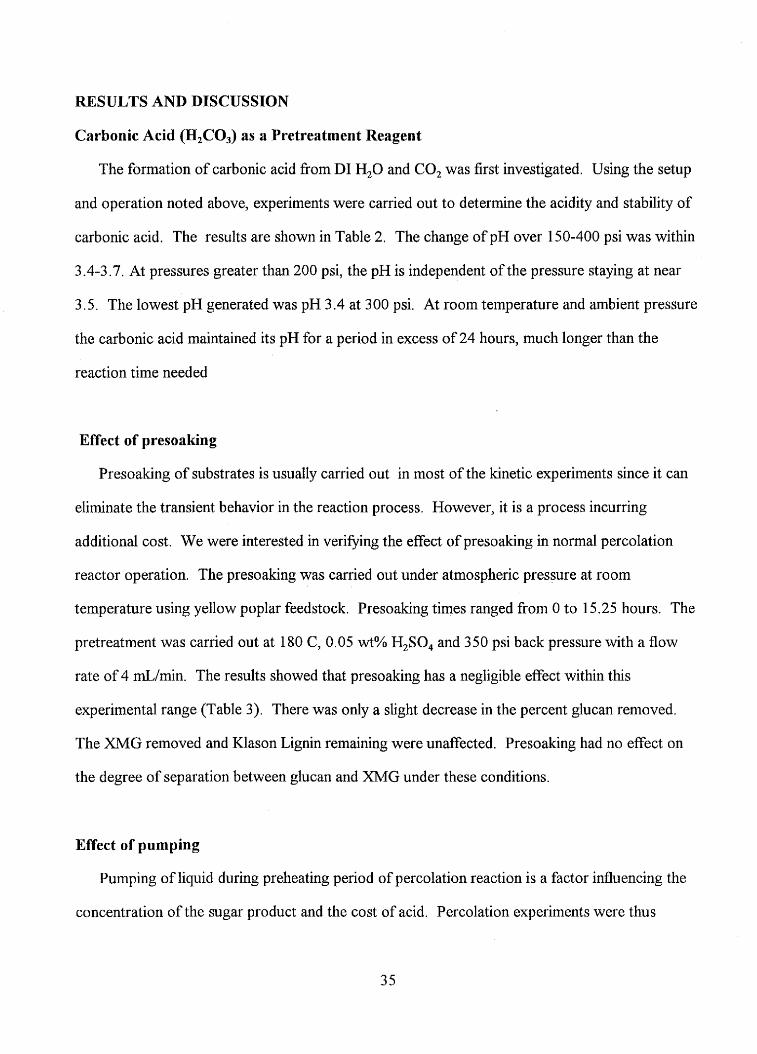
Carbonic Acid (H,CO,) as a Pretreatment Reagent
The formation of carbonic acid from DI H,O and CO, was first investigated. Using the setup
and operation noted above, experiments were carried out to determine the acidity and stability of
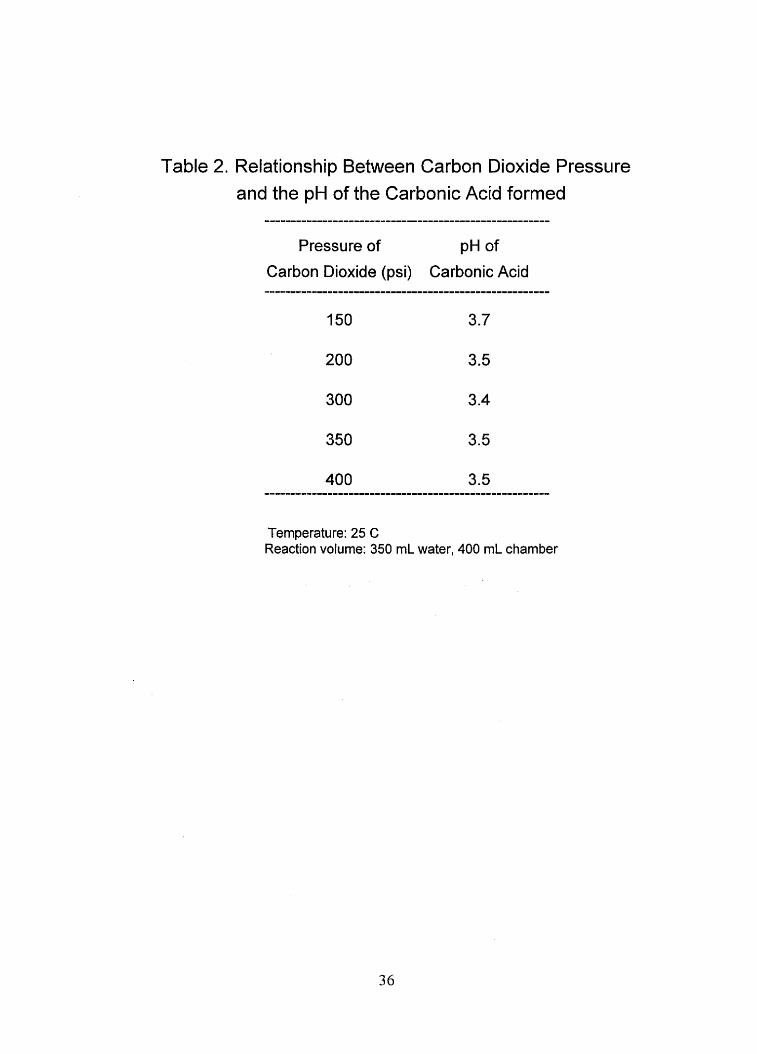
carbonic acid. The results are shown in Table 2. The change of pH over 150-400 psi was within
3.4-3.7. At pressures greater than 200 psi, the pH is independent of the pressure staying at near
3 .5 , The lowest pH generated was pH 3.4 at 3 00 psi. At room temperature and ambient pressure
the carbonic acid maintained its pH for a period in excess of 24 hours, much longer than the
reaction time needed
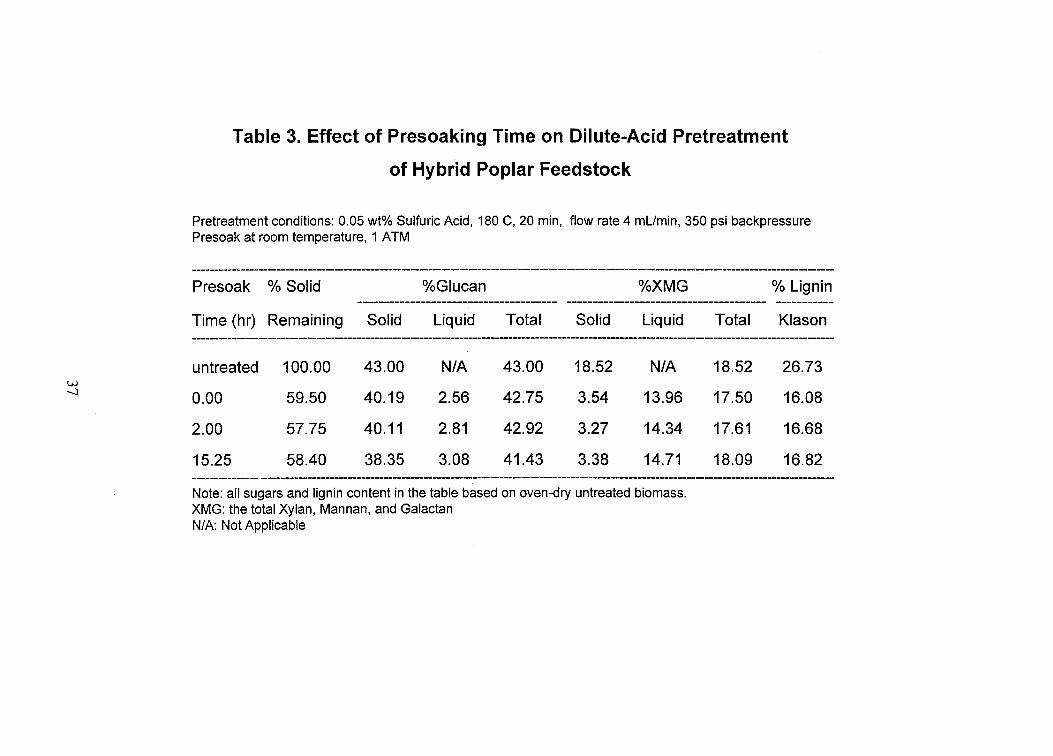
Effect of presoaking
Presoaking of substrates is usually carried out in most of the kinetic experiments since it can
eliminate the transient behavior in the reaction process. However, it is a process incurring
additional cost. We were interested in veriQing the effect of presoaking in normal percolation
reactor operation. The presoaking was carried out under atmospheric pressure at room
temperature using yellow poplar feedstock. Presoaking times ranged from 0 to 15.25 hours. The
pretreatment was carried out at 180 C, 0.05 wt% H,SO, and 350 psi back pressure with a flow
rate of 4 mL/min. The results showed that presoaking has a negligible effect within this
experimental range (Table 3). There was only a slight decrease in the percent glucan removed.
The XMG removed and Klason Lignin remaining were unaffected. Presoaking had no effect on
the degree of separation between glucan and XMG under these conditions.
Effect of pumping
Pumping of liquid during preheating period of percolation reaction is a factor influencing the
concentration of the sugar product and the cost of acid. Percolation experiments were thus
35
200 3.5
300 3 -4
350 3.5
400 3.5
Temperature: 25 C Reaction volume: 350 mL water, 400 mL chamber
36
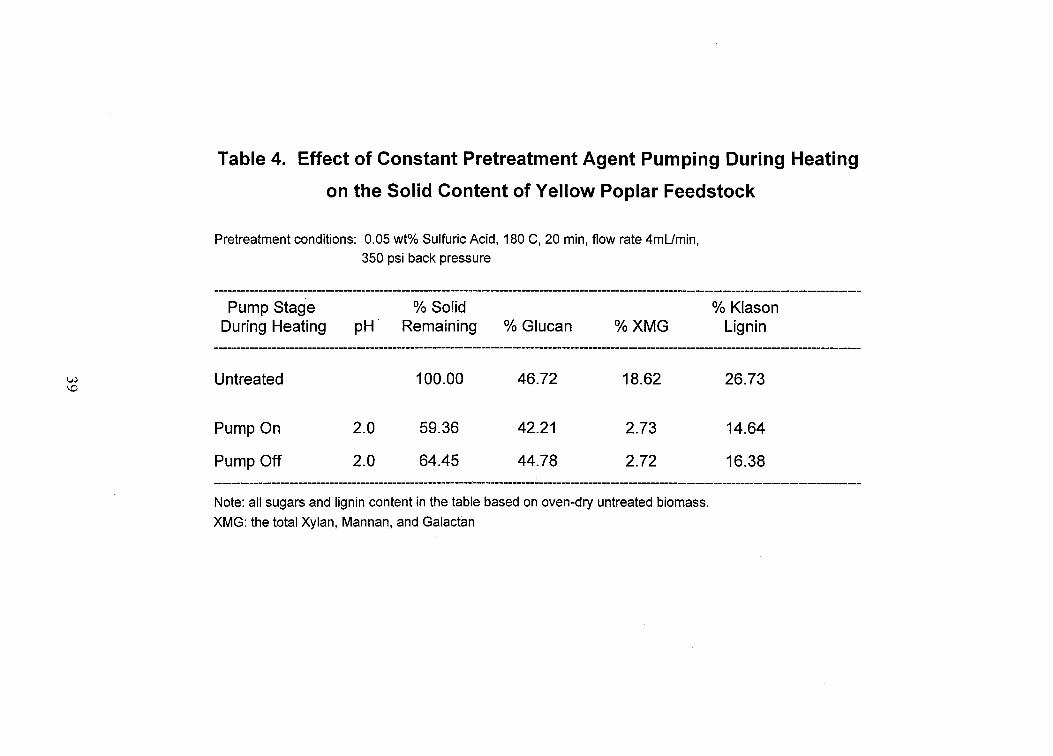
carried out: one with constant pumping during the preheating phase and the other with pumping
only after the reaction temperature was reached. The constant pumping cuased decrease in the
percent solid remaining (Table 4). The percent glucan content and the percent Klason lignin in
the solid were slightly lower with constant pumping, whereas the percent XMG removed was
unaffected by pumping mode. This indicates that the reaction times selected were sufficient for
solubilizing the hemicellulose. For the interest of reducing the input of the pretreatment reagent
and retaining high concentration of the product, we conclude that it is highly desirable to go with
the pump off mode during preheating in normal operation of a percolation reactor.
Carbonic Acid Pretreatment (ambient front pressure)
The effect of pretreatment reagent was investigated using the yellow poplar as the feedstock.
Pretreatment conditions of 180 'C, 20 minutes, 4 mL/min flow rate, and 3 50 psi of back pressure
were applied. The pretreatment reagents were 0.05 wt% H,SO,, deionized H,O, and carbonic acid
(H2C03). The carbonic acids used were of pH 3.7, (formed under 150 psi) and pH 3.4 (formed
under 300 psi). The carbonic acid has displayed the ability to maintain its pH for a period of at
least 24 hours. Therefore our initial trials were conducted with a separate carbonic acid generator
not connected to the percolation system. Once the acid was formed it was introduced to the
percolation system from storage reservoirs at ambient pressure, in the same manner sulfbric acid
and water are introduced. The pH was monitored before and after the reaction to insure that
there wasn't significant acid dissociation. In all cases the pH of the intake acid was the same
before and aRer the percolation process, thus indicating that if any dissociation takes place it
must happen when the temperatures and pressures are higher, after the acid is introduced into the
system. Preliminary results (Table 5) have shown carbonic acid (Runs #3 and #4) to react in
much the same way as water (Run #2). For
(based on dry weight of untreated biomass)
both reagents the percent glucan remaining was 47%
This is equal to almost 100% of
38
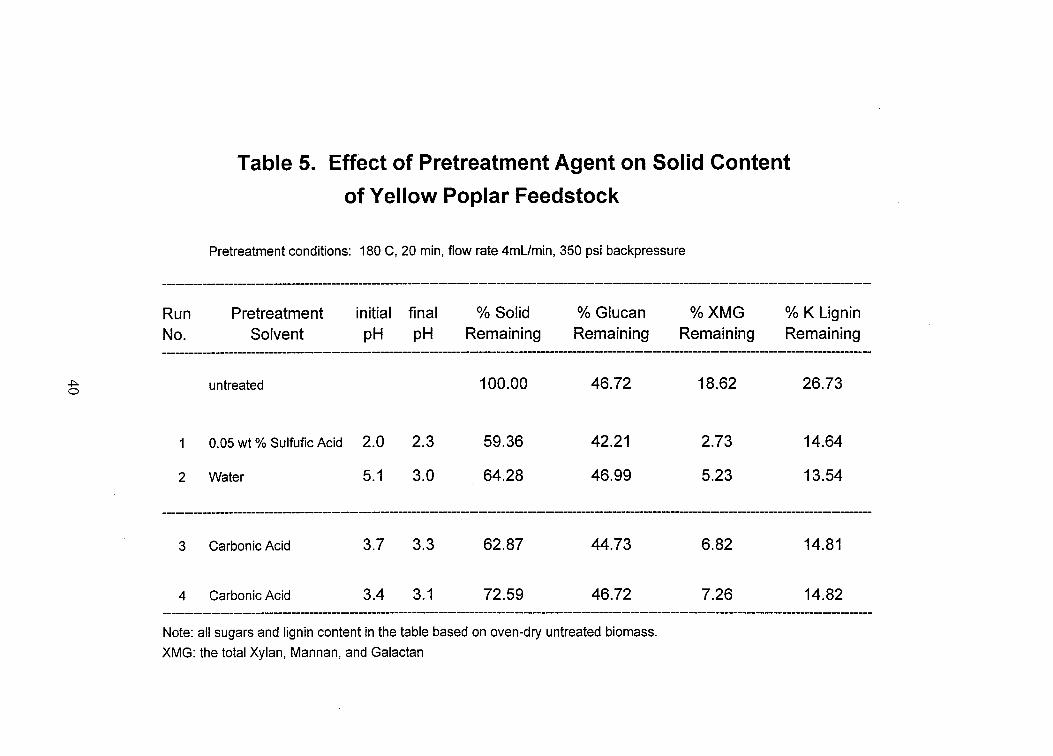
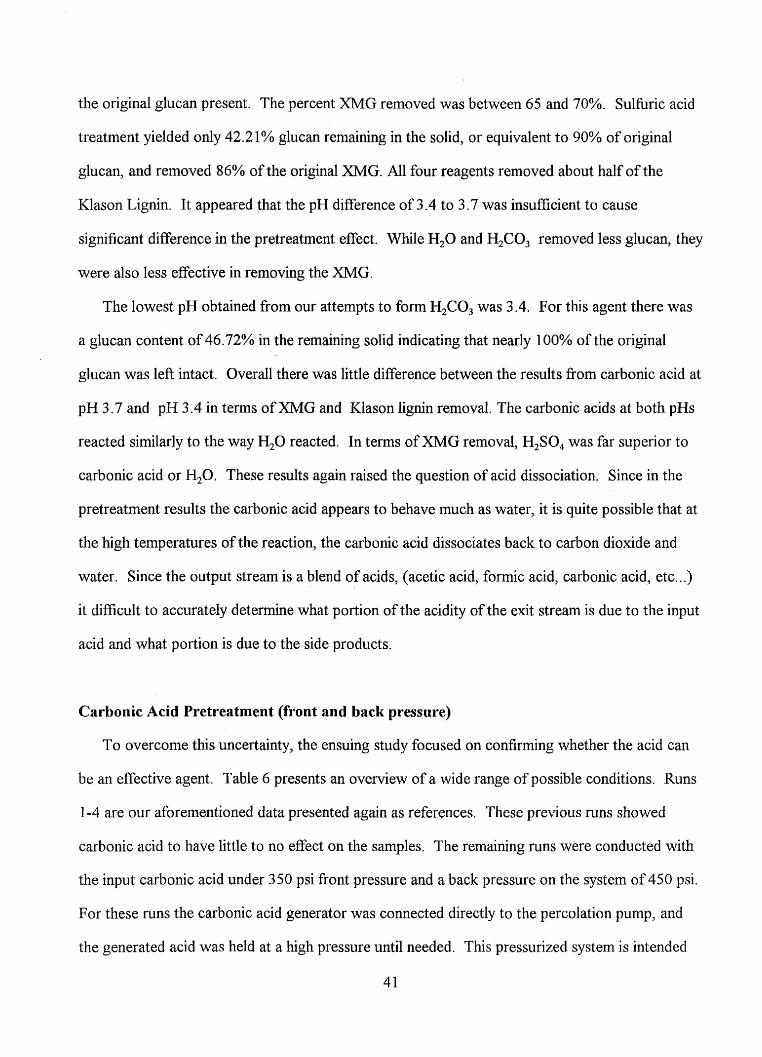
the original glucan present. The percent XMG removed was between 65 and 70%. Sulhric acid
treatment yielded only 42.2 I YO glucan remaining in the solid, or equivalent to 90% of original
glucan, and removed 86Yo of the original XMG. All four reagents removed about half of the
Klason Lignin. It appeared that the pH difference of 3.4 to 3.7 was insufficient to cause
significant difference in the pretreatment effect. While H,O and H&O, removed less glucan, they
were also less effective in removing the XMG.
The lowest pH obtained from our attempts to form H,CO, was 3.4. For th s agent there was
a glucan content of 46.72% in the remaining solid indicating that nearly 100% of the original
glucan was left intact. Overall there was little difference between the results from carbonic acid at
pH 3.7 and pH 3.4 in terms of XMG and Klason lignin removal. The carbonic acids at both pHs
reacted similarly to the way H20 reacted. In terms of XMG removal, H,SO, was far superior to
carbonic acid or H,O. These results again raised the question of acid dissociation. Since in the
pretreatment results the carbonic acid appears to behave much as water, it is quite possible that at
the high temperatures of the reaction, the carbonic acid dissociates back to carbon dioxide and
water, Since the output stream is a blend of acids, (acetic acid, formic acid, carbonic acid, etc.. .)
it difficult to accurately determine what portion of the acidity of the exit stream is due to the input
acid and what portion is due to the side products.
Carbonic Acid Pretreatment (front and back pressure)
To overcome this uncertainty, the ensuing study focused on confirming whether the acid can
be an effective agent. Table 6 presents an overview of a wide range of possible conditions. Runs
1-4 are our aforementioned data presented again as references. These previous runs showed
carbonic acid to have little to no effect on the samples. The remaining runs were conducted with
the input carbonic acid under 350 psi front pressure and a back pressure on the system of 450 psi.
For these runs the carbonic acid generator was connected directly to the percolation pump, and
the generated acid was held at a high pressure until needed. This pressurized system is intended
41
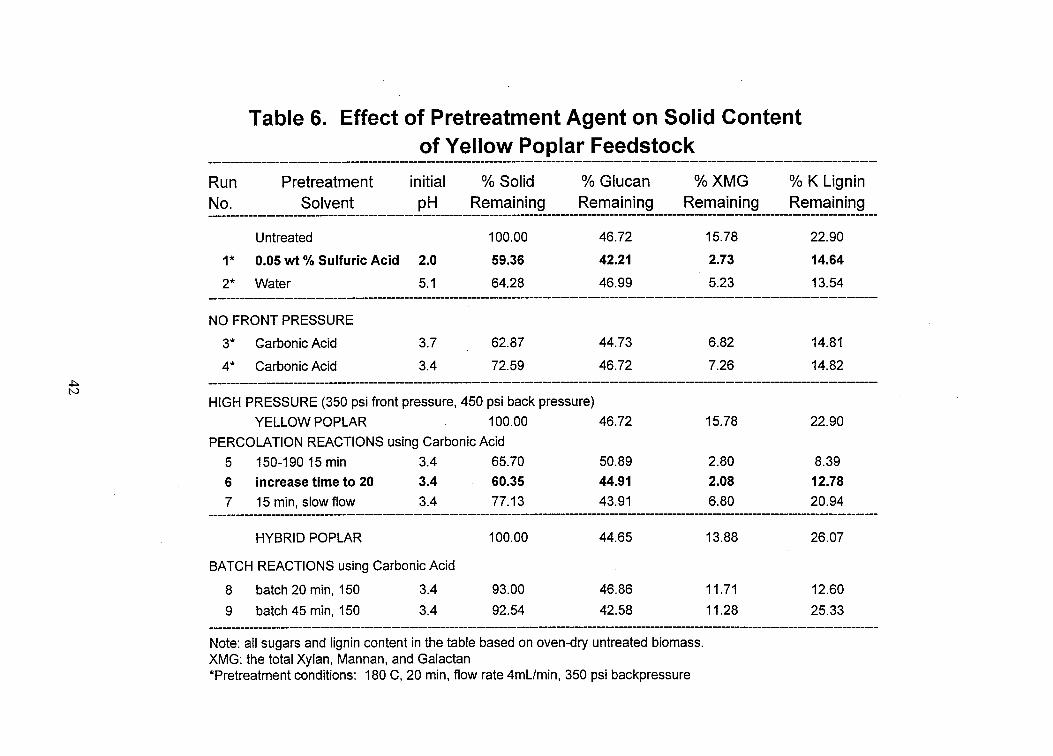
to eliminate any dissociation prior to the percolation unit, and to minimize the carbonic acid
dissociation within the percolation unit. Runs 5, 6, and 7 show the results under randomly
chosen reaction conditions. The time and temperature intervals were centered around the known
optimal conditions for sulfhic acid pretreatment with variations above and below. Trial 6, run at
the optimal temperature with a slightly lengthened reaction time, proved to be the most promising.
Data in the run was comparable to single stage sulfiu-ic acid pretreatment.
.
In Runs 8 and 9, highly pressurized batch reactions were carried out. Neither reaction proved
to be successfbl in removing XMG or lignin. Further investigation may provide better results.
However, due to the low stability (high dissociation) of carbonic acid, it seems that pressurized
batch reactions will prove to be an effective treatment method.
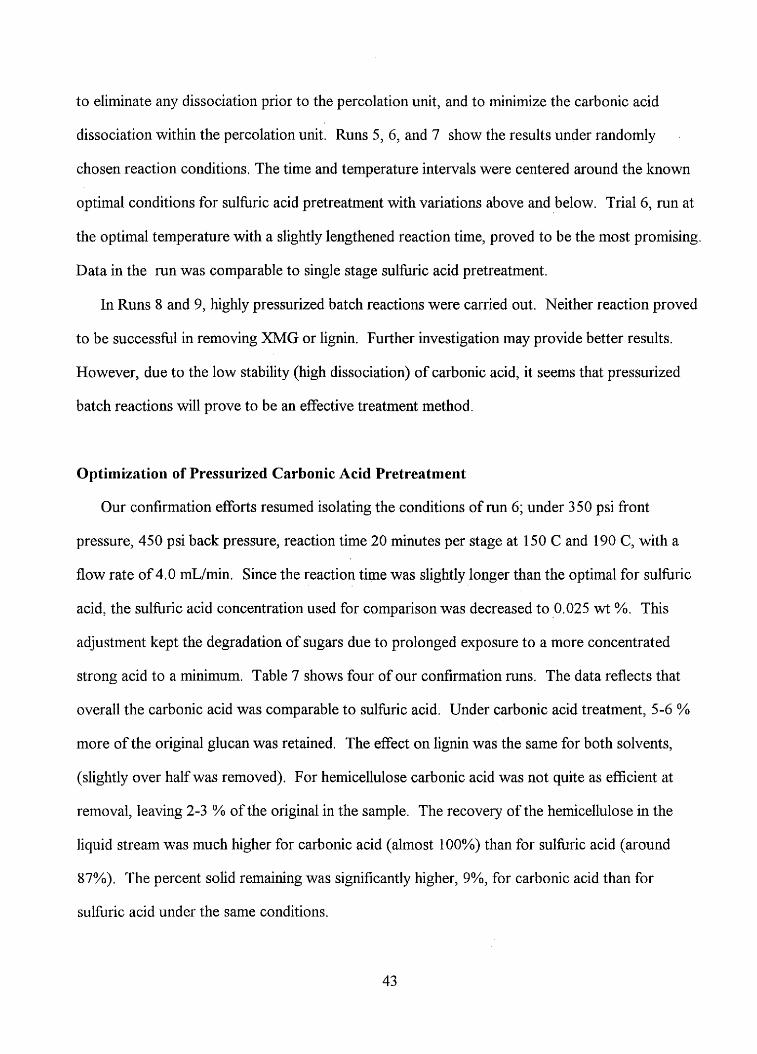
Optimization of Pressurized Carbonic Acid Pretreatment
Our confirmation efforts resumed isolating the conditions of run 6; under 350 psi front
pressure, 450 psi back pressure, reaction time 20 minutes per stage at 150 C and 190 C, with a
flow rate of 4.0 mL/min. Since the reaction time was slightly longer than the optimal for sulhric
acid, the sulfbric acid concentration used for comparison was decreased to 0.025 wt %. This
adjustment kept the degradation of sugars due to prolonged exposure to a more concentrated
strong acid to a minimum. Table 7 shows four of our confirmation mns. The data reflects that
overall the carbonic acid was comparable to sulhric acid. Under carbonic acid treatment, 5-4 %
more of the original glucan was retained. The effect on lignin was the same for both solvents,
(slightly over half was removed). For hemicellulose carbonic acid was not quite as efficient at
removal, leaving 2-3 % of the original in the sample. The recovery of the hemicellulose in the
liquid stream was much higher for carbonic acid (almost 100%) than for sulfbric acid (around
87%). The percent solid remaining was significantly higher, 9%, for carbonic acid than for
sulhric acid under the same conditions.
43
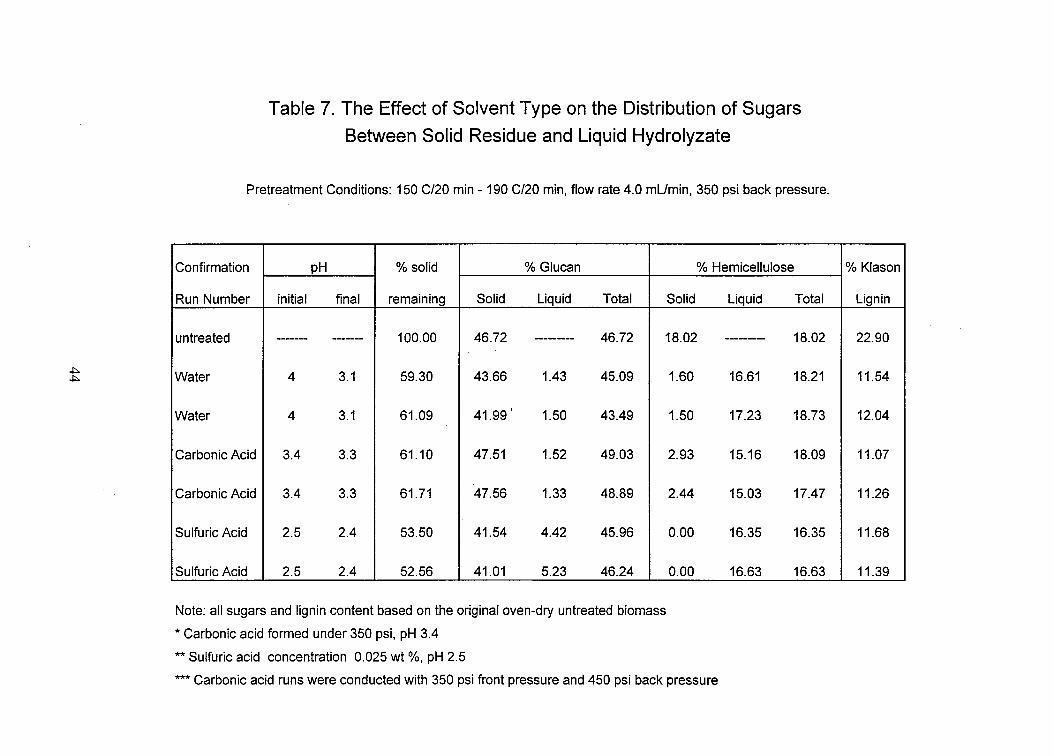
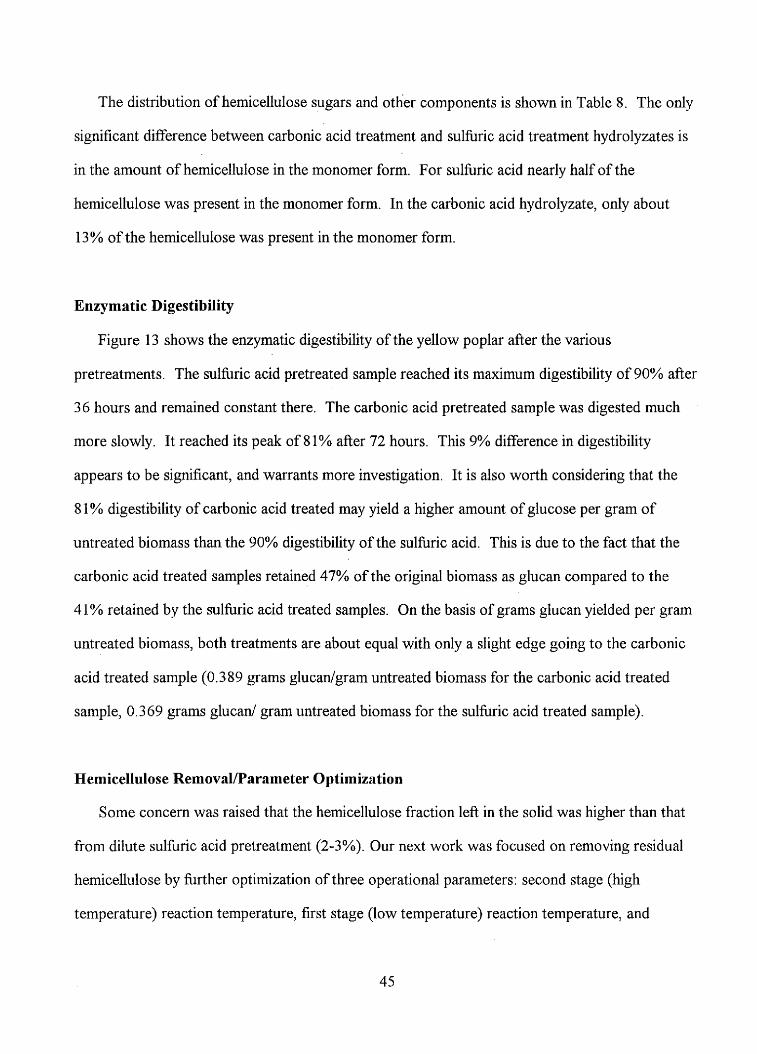
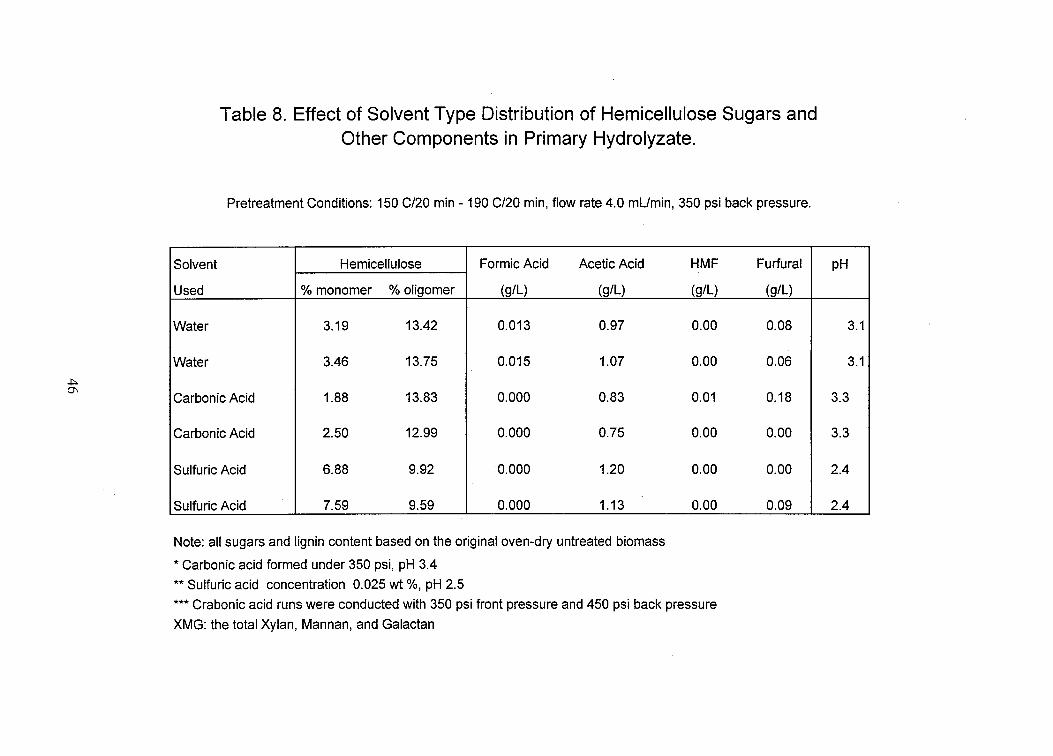
The distribution of hemicellulose sugars and other components is shown in Table 8. The only
significant difference between carbonic acid treatment and sulfbric acid treatment hydrolyzates is
in the amount of hemicellulose in the monomer form. For sulfbric acid nearly half of the
hemicellulose was present in the monomer form. In the carbonic acid hydrolyzate, only about
13 % of the hemicellulose was present in the monomer form.
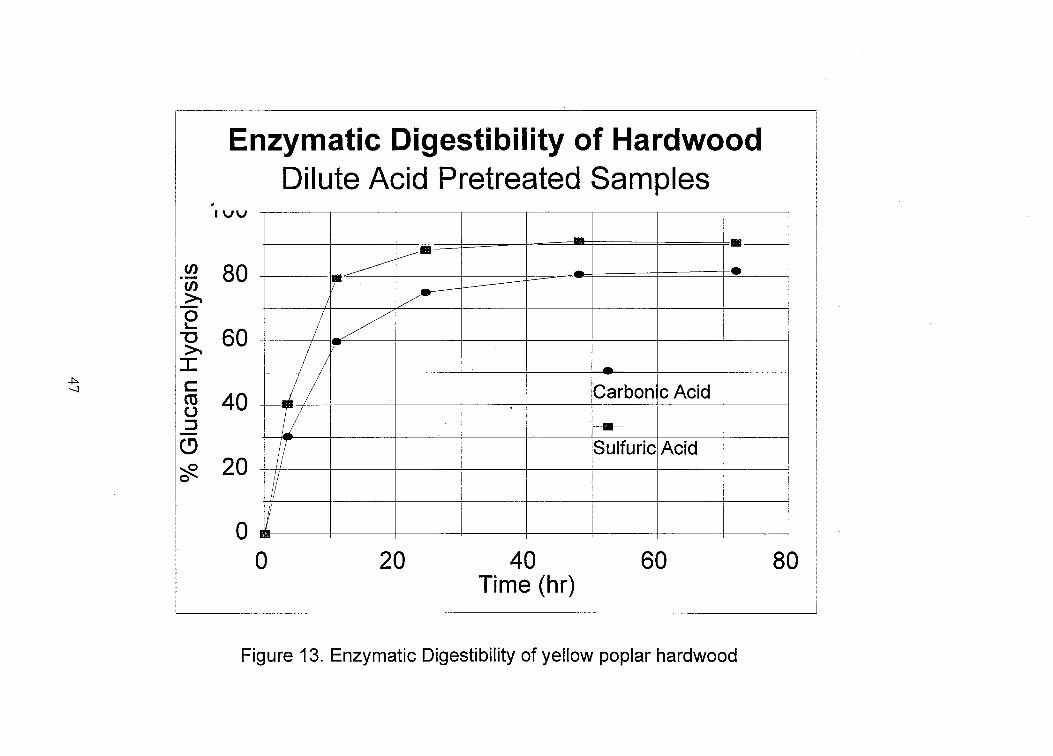
Enzymatic Digestibility
Figure 13 shows the enzymatic digestibility of the yellow poplar after the various
pretreatments. The sulfbric acid pretreated sample reached its maximum digestibility of 90% after
36 hours and remained constant there. The carbonic acid pretreated sample was digested much
more slowly. It reached its peak of 8 1 % after 72 hours. This 9% difference in digestibility
appears to be significant, and warrants more investigation. It is also worth considering that the
81% digestibility of carbonic acid treated may yield a higher amount of glucose per gram of
untreated biomass than the 90% digestibility of the sulfuric acid. This is due to the fact that the
carbonic acid treated samples retained 47% of the original biomass as glucan compared to the
4 1 % retained by the sulhric acid treated samples. On the basis of grams glucan yielded per gram
untreated biomass, both treatments are about equal with only a slight edge going to the carbonic
acid treated sample (0.389 grams glucadgram untreated biomass for the carbonic acid treated
sample, 0.369 grams glucard gram untreated biomass for the sulfbric acid treated sample).
Hemicellulose FternovallParameter Optimization
Some concern was raised that the hemicellulose fraction left in the solid was higher than that
from dilute sulfuric acid pretreatment (2-3%). Our next work was focused on removing residual
hemicellulose by fh-ther optimization of three operational parameters: second stage (high
temperature) reaction temperature, first stage (low temperature) reaction temperature, and
45
reaction time per stage. The base pretreatment conditions were 150 O C / 20 minutes - 190 O C /
20 minutes, 4.0 mL / min flow rate, 350 psi front pressure, and 450 psi back pressure. The feed
carbonic acid was prepared by saturation of DI water with pure CO, at 350 psi, room
temperature.
Variation of Second Stage Reaction Temperature
For this series of experiments, the first stage temperature was maintained at 150 "C while the
second stage temperature varied from 180 "C to 200 "C. Table 9 shows the distribution of sugars
and other components at various second stage temperatures. The results show little change
between the 180 O C and 190 O C runs. However a notable decrease in the percent hemicellulose
retained in the solid is seen between the 190 O C and 200 O C runs, (2.41% , 0.79%).
Unfortunately this decrease in hemicellulose is accompanied by a decrease in the overall
hemicellulose balance. The nearly 3% missing from the hemicellulose balance may be due to
decomposition. The overall glucan balance is also slightly less at 200 "C than at 190 "C. This
again indicates some possible sugar decomposition.
The results also revealed a notable point in the delignification effects of the pretreatment. In
the higher temperature pretreatment runs (200 " C), unusually high delignification was observed.
To this point, we have not fblly explored the delignification aspect in carbonic acid pretreatment.
The early data in these experiments indicate that at least 60% and even as much as 80% of the
lignin can be removed by treatment with carbonic acid. It is much higher than those observed
under pure water or sulhric acid treatment. It is speculated that introduction of carbonic acid
creates reaction conditions less acidic than those of pure water because of the buffering action of
carbonates. It is also to be noted that carbonic acid is less acidic than acetic acid which is a
product of pure water treatment.
48
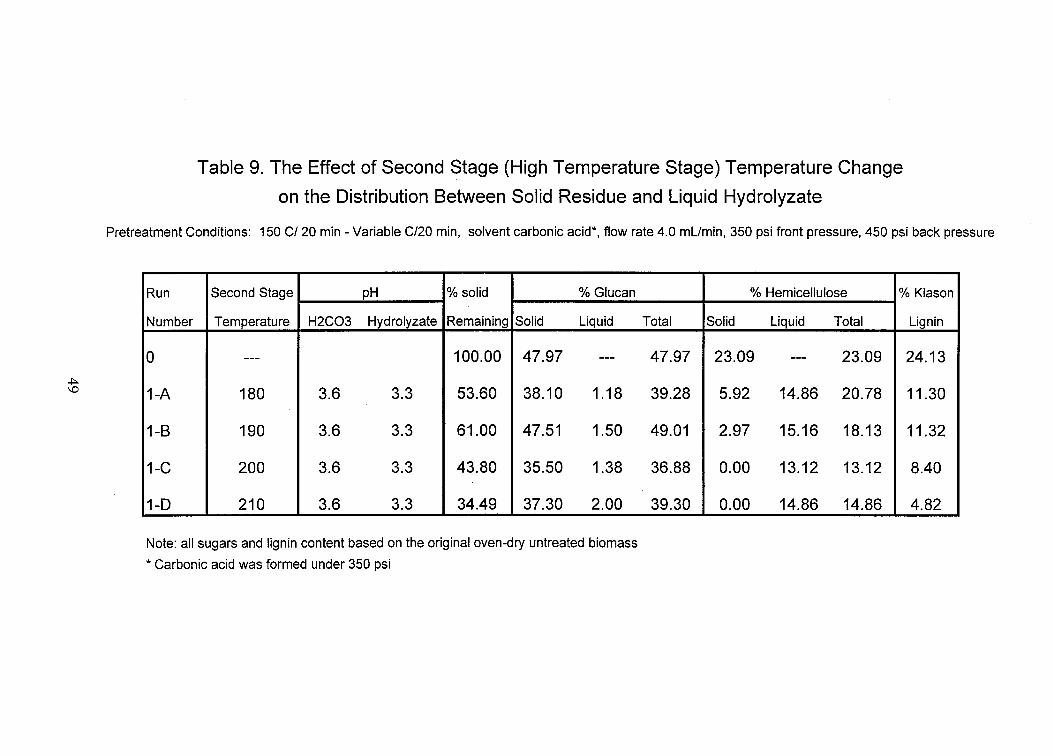
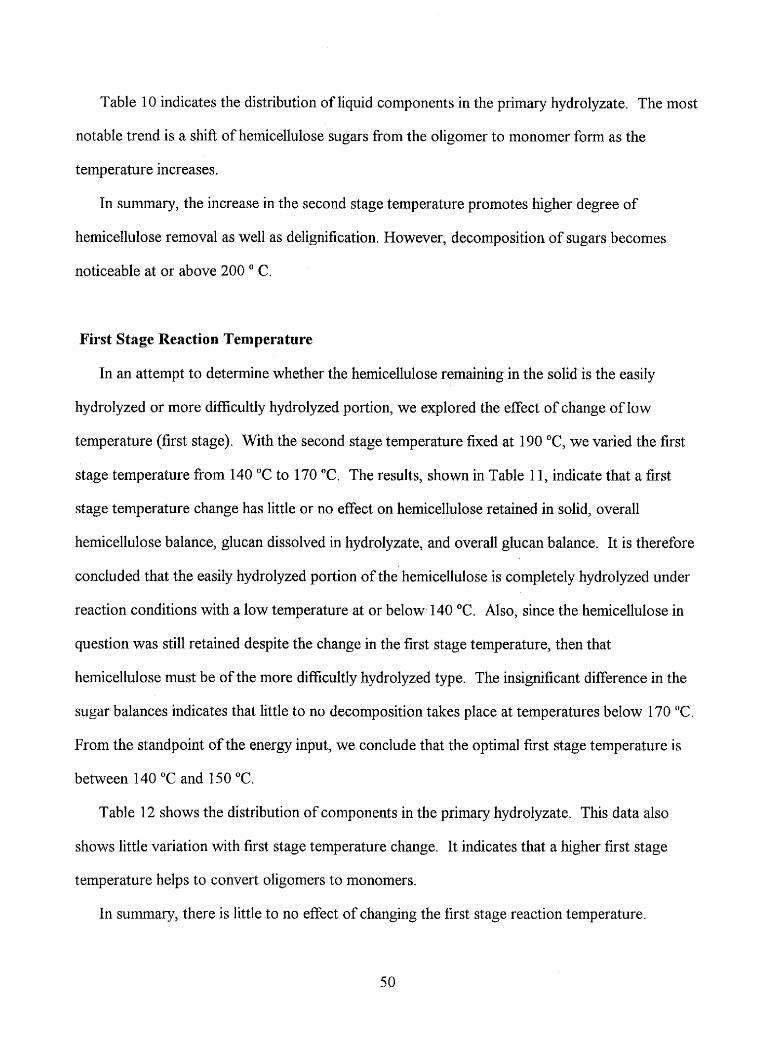
Table 10 indicates the distribution of liquid components in the primary hydrolyzate. The most
notable trend is a shift of hemicellulose sugars from the oligomer to monomer form as the
temperature increases.
In summary, the increase in the second stage temperature promotes higher degree of
hemicellulose removal as well as delignification. However, decomposition of sugars becomes
noticeable at or above 200 O C.
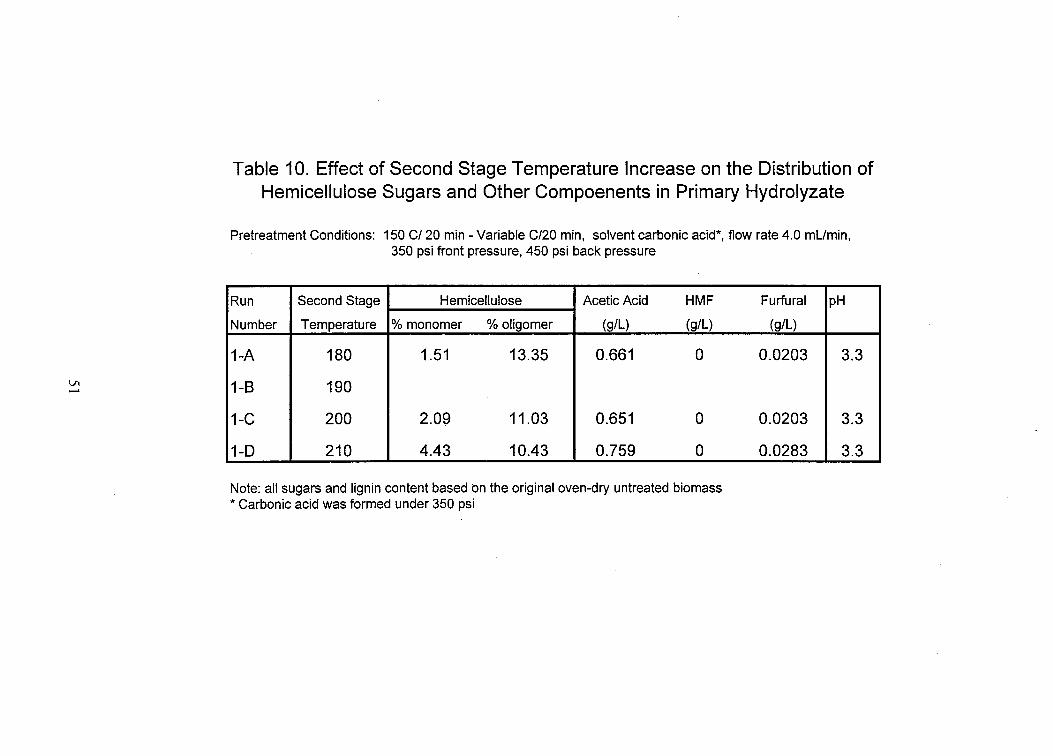
First Stage Reaction Temperature
In an attempt to determine whether the hemicellulose remaining in the solid is the easily
hydrolyzed or more difficultly hydrolyzed portion, we explored the effect of change of low
temperature (first stage). With the second stage temperature fixed at 190 "C, we varied the first
stage temperature from 140 "C to 170 "C. The results, shown in Table 1 1 , indicate that a first
stage temperature change has little or no effect on hemicellulose retained in solid, overall
hemicellulose balance, glucan dissolved in hydrolyzate, and overall glucan balance. It is therefore
concfuded that the easily hydrolyzed portion of the hemicellulose is completely hydrolyzed under
reaction conditions with a low temperature at or below 140 "C. Also, since the hemicellulose in
question was still retained despite the change in the first stage temperature, then that
hemicellulose must be of the more difficultly hydrolyzed type. The insignificant difference in the
sugar balances indicates that little to no decomposition takes place at temperatures below 170 "C.
From the standpoint of the energy input, we conclude that the optimal first stage temperature is
between 140 "C and 150 "C.
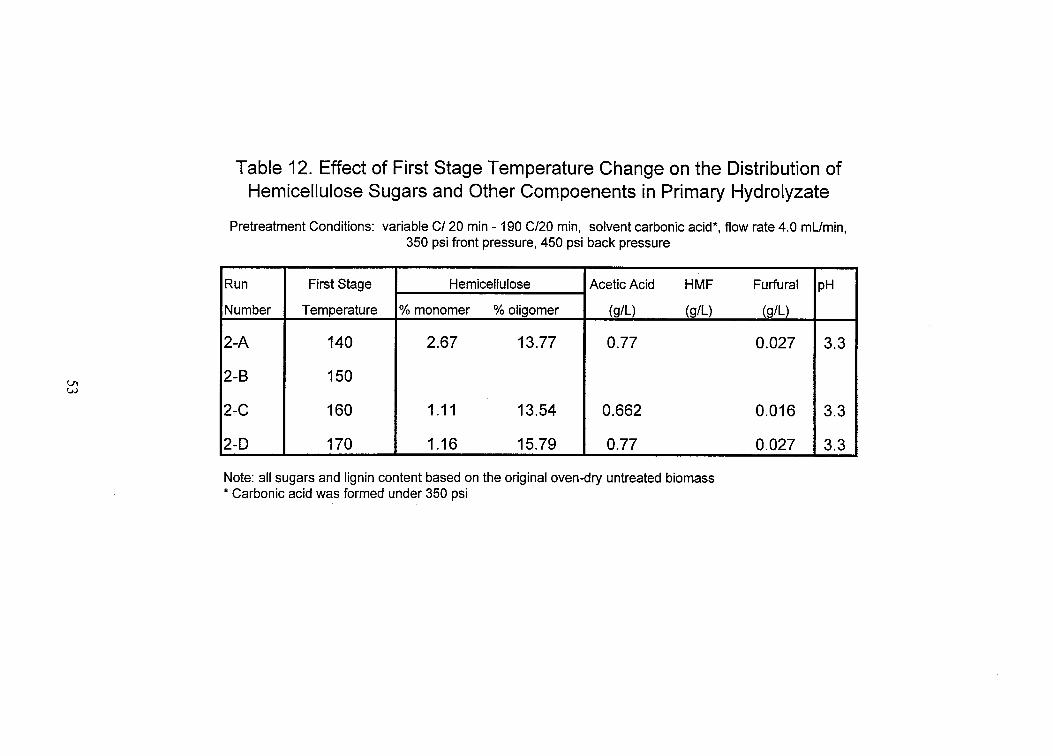
Table 12 shows the distribution of components in the primary hydrolyzate. This data also
shows little variation with first stage temperature change. It indicates that a higher first stage
temperature helps to convert oligomers to monomers.
In summary, there is little to no effect of changing the first stage reaction temperature.
50
Reaction Time Per Stage
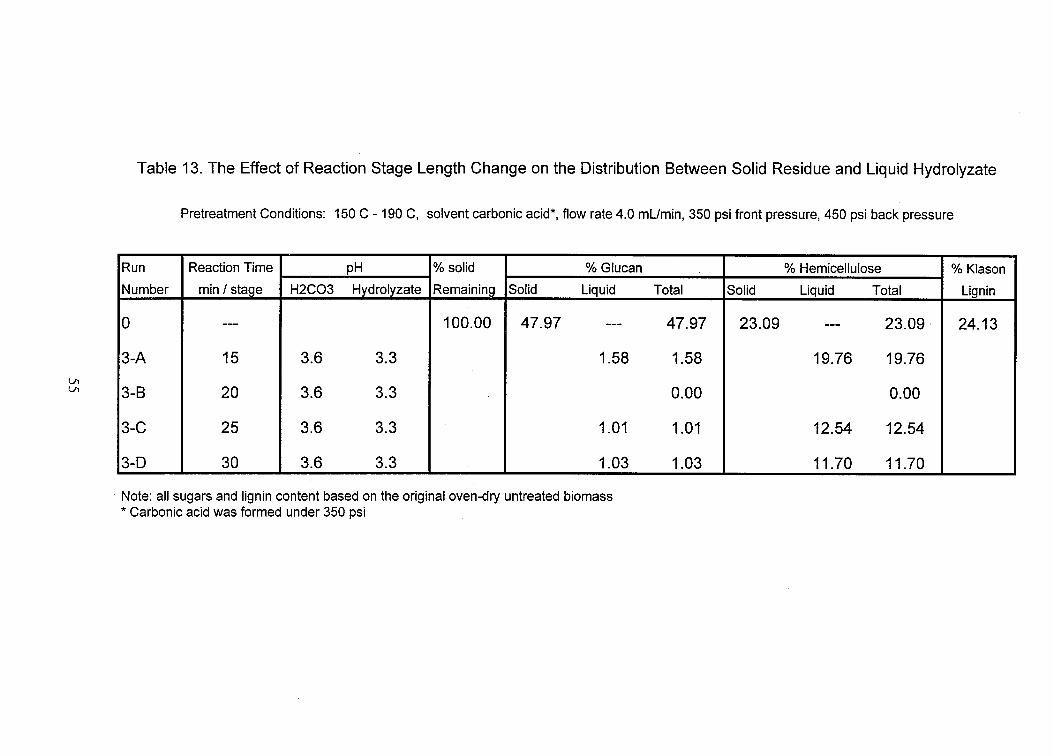
For the study on reaction time, we chose the base treatment conditions of 150 "C first stage
and 190 "C second stage. The reaction time per stage varied from 15 to 30 minutes. Table 13
shows the distribution of sugars and other components for various reaction times, The
distribution of sugars and the overall balances are almost identical to those of first stage
temperature change experiments (seen in Table 12). Hemicellulose retained, glucan dissolved,
and overall sugar balances change only slightly as the reaction time was changed from 15 to 30
minutes per stage. As stated previously it appears that the sugars are not decomposed when they
are exposed to temperatures at or below 170 "C. The amount of decomposition is a hnction
both of temperature and exposure time. Since it is observed that the total recovery for the sugars
is approximately constant as the exposure time increases in these runs, then it can be concluded
that relatively little decomposition takes place at these selected temperatures. In the case of 190
"C second stage treatment, the overall sugar balance does not vary with reaction time indicating
that there is little decomposition. We thus conclude that carbonic acid treatment at 190 "C is
insuficient to completely hydrolyze the hemicellulose portion, even with increased reaction times
(3 0 minutes).
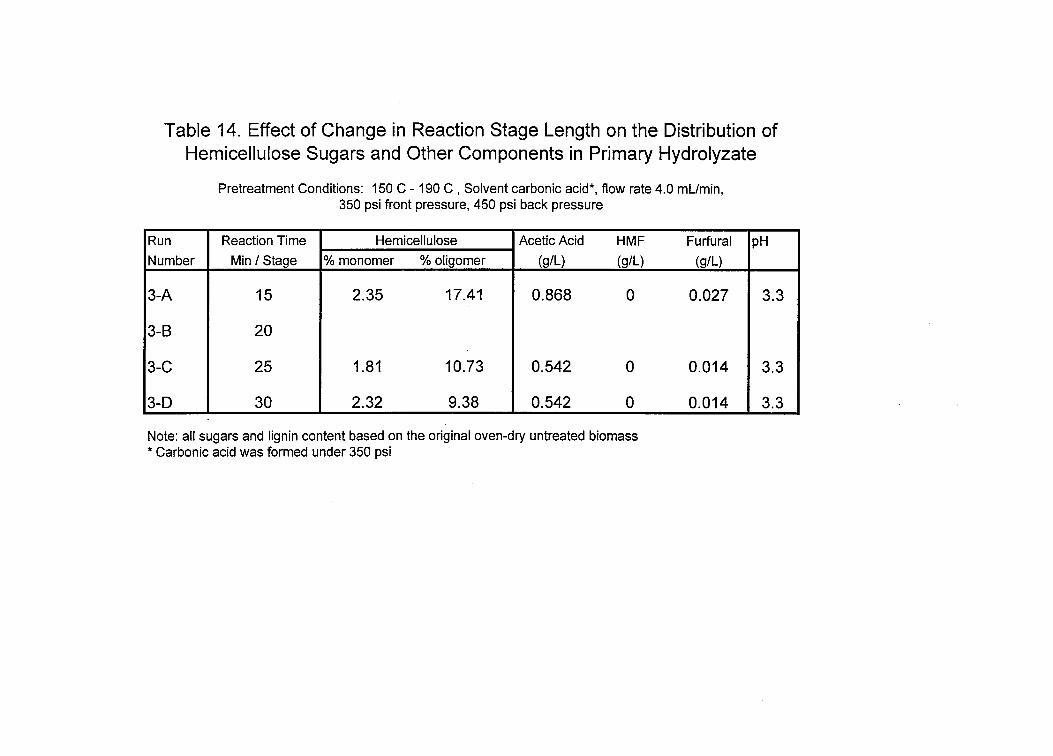
The component distribution in the liquid, shown in Table 14, shows a slight increase in the
amount of hemicellulose present in the monomer form. This indicates that 190 "C is adequate
cleavage of the oligomer if given sufficient reaction time.
In summary, 190 "C is a high enough temperature to hydrolyze the oligomers into monomers,
but is insufficient to fully hydrolyze the more difficultly hydrolyzed fraction of the two
hemicelluloses. Extended exposure to 190 "C has little effect on the overall sugar balances and
therefore causes little decomposition. We therefore project that a temperature between 190 "C
and 200 "C (Table 9) may allow complete hydrolysis of the difficultly hydrolyzed portion of the
hemicellulo se.
54
Delignification
As previously stated, the study in this segment has raised our interest in using carbonic acid
as a potential delignification agent as we have observed 60% to 80% delignification in a number
of carbonic acid experiments. The most notable case is shown on Table 13. In the case where
both stage temperatures were set, and only reaction times were changed, there was high degree of
dilignification. During this treatment there was no noticable difference in sugar distribution or
overall balance. This indicates that operations near 190 "C may find its way to a method that
faciiit ates deiig ni fication without decomposing the desired sugars .
Future Study
If the opportunity is presented for fbture work. We plan to investigate the temperature range
from 190 "C to 200 "C over extended reaction times, in terms of hemicellulose retained in the
solid and for sugar decomposition. We plan to experiment with on-line hydrolyzate sampling
during the stages to determine under which conditions the hemicellulose is dissolved, We also
propose to apply a progressive change in second stage temperature, that is to allowing the reactor
to continually increase from the first stage temperature. We intend to verify if this improves the
process in maximizing hemicellulose solulilization and minimizing overall sugar decomposition.
With regard to lignin experimentation, we plan to reconfirm our delignification results and
examine the temperature effect more closely.
56
Task 3. NREL Sample Analysis
The following biomass solid and liquid samples were analyzed and reported directly to the
NREL project coordinator, Mi. Robert Torget:
Solid Analysis (analyzed for sugar content, Klason Lignin, acid soluble lignin, and ash)
HW 220 A H W 240 A INHPOP 42 2264-55 A 2264-56 A 2264-57 A 2264-58 A 2264-59 A 2264-60 A 2264-6 1 A 2264-62 A 2264-63 A 2264-70 A 2264-71 A 2264-72 A 2264-73 A 2264-74 A 2264-77 A 2264-78 A 2264-79 A
Douglas fir (reported to Nick Nagle) INHFIR 170 INHFIR 190 mIR 210 INE-FIR 220
Reactor series (reported to Nick Nagle) Reactor 1 Reactor 2 Reactor 3 Reactor 4 Reactor 5
Corn stover solids Water - 95 Water - 120
57
Water- 140 Water- 160 Acid - 140 Acid - 160 Acid - 180 Acid - 210 Acid - 195/225
Total solid samples: 38
Liquid Analysis (analyzed for sugars, acetic acid, firfinal, formic acid, and HMF) HW 200 A H W 200 B HW 220 A H W 220 A washate HW 240 A INHPOP 42 2264-53 A Effluent 1 2264-53 A Effluent 2 2264-54 A Effluent 1 2264-54 A Effluent 2 2264-55 A Effluent 1 2264-55 A Effluent 2 2264-56 A Effluent 1 2264-56 A Effluent 2 2264-57 A Effluent 1 2244-57 A Effluent 2 2264-58 AEffluent 1 2264-58 A Effluent 2 2264-59 A Effluent 1 2264-59 A Effluent 2 2264-60 A Effluent 1 2264-60 A Effluent 2 2264-61 A Effluent 1 2264-61 A Effluent 2 2264-62 A Effluent 1 2264-62 A Effluent 2 2264-63 A Effluent 1 2264-63 A Emuent 2 2264-70 A Effluent 1 2264-70 A Effluent 2 2264-7 1 A Effluent 1 2264-71 A Effluent 2 2264-72 AEffluent 1 2264-72 A Effluent 2
58
2264-73 AEmuent 1 2244-73 A Effluent 2 2264-74 A Effluent 1 2264-74 A Eflluent 2 2264-77 A Effluent 1 2264-77 A Effluent 2 2264-78 A Effluent I 2264-78 A Effluent 2 2264-79 A Effluent 1 2264-79 A Effluent 2
Douglas fir 170, 5 minutes
INHFIR 170, 30 minutes =IR 190, 30 minutes INHFIR 210, 5 minutes INHFIR 2 10, 3 0 minutes 1"HFIR 220, 5 minutes INHFLR 220, 10 minutes INHFIR 220, 15 minutes rN€-€FIR220, 20 minutes INHFIR 220, 30 minutes
Reactor series Reactor 1 Reactor 2 Reactor 3 Reactor 4
Corn stover liquids Water - 95/20 Water - 95/40 Water - 95/60 Water - 120/10 Water - 120/20 Water - 120/30 Water - 120/leakage Water - 140/10 Water - 140/20 Water - 140/30 Water - 14O/leakage Acid- 140/10 Acid - 140/20 Acid - 140/30 Water - 160D 0
59
Water - 160/20 Water - 160/30 Water - 160/leakage Acid - 160/10 Acid - 160/20 Acid - 160/30 Acid - 160Aeakage Acid - 180/10 Acid - 180/20 Acid - 180/30 Acid - 195/30 Acid - 210/10 Acid - 210/20 Acid - 2 10/3O
' Acid - 225/30
Total liquid samples: 100
60

Appendix 3
Fortran Source Codes for Modeling and Simulation of Shrinking Bed Percolation Reactor Operation
61
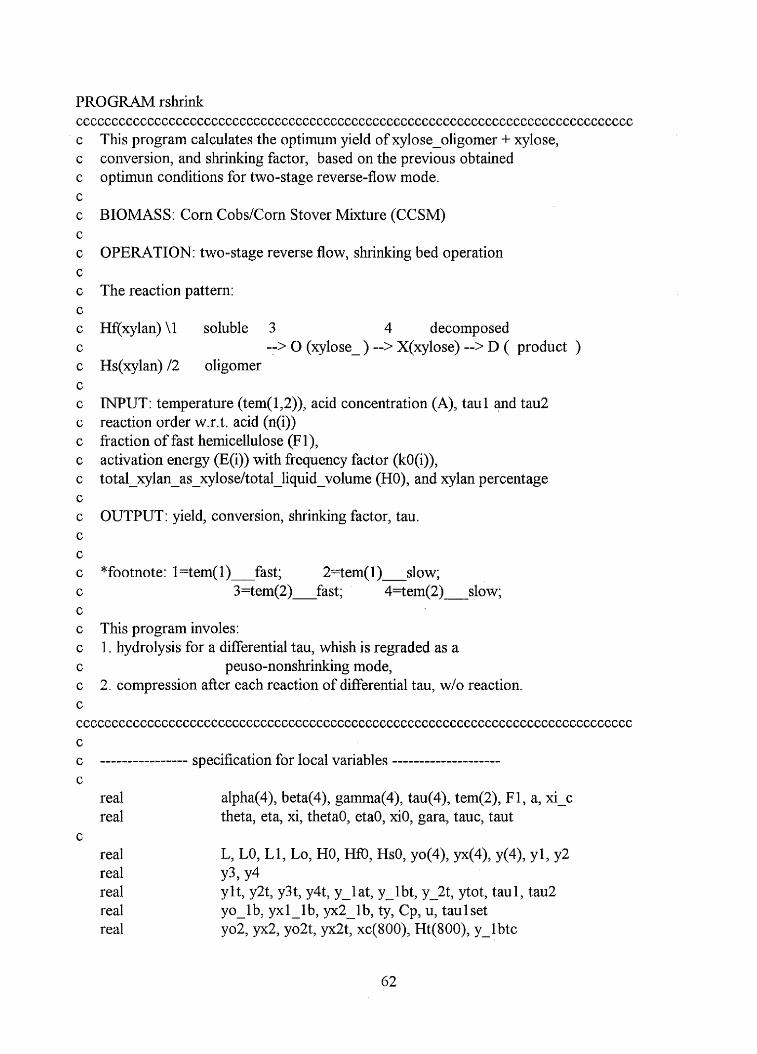
PROGRAM rshrink ccccccccccccccccccccccccccccccccccccccccccccccccccccccccccccccccccccccccccccccc C
C
C
C
C
C
C
C
C
C
C
C
C
C
C
C
C
C
C
C
C
C
C
C
C
C
C
C
C
C
C
This program calculates the optimum yield of xylose - oligomer + xylose, conversion, and shrinking factor, based on the previous obtained optimun conditions for two-stage reverse-flow mode.
BIOMASS: Corn CobdCorn Stover Mixture (CCSM)
OPERATION: two-stage reverse flow, shrinking bed operation
The reaction pattern:
Hf(xy1an) \1 soluble 3 4 decomposed
Hs(xy1an) /2 oligomer --> 0 (xylose - ) --> X(xy1ose) --> D ( product )
N U T : temperature (tern( l,2)), acid concentration (A), taul and tau2 reaction order w,r.t. acid (n(i)) fraction of fast hemicellulose (Fl), activation energy (E(i)) with frequency factor (kO(i)), tot al-xylan-as-xylo se/t o t al-liquid-volume (HO), and xylan percent age
OUTPUT: yield, conversion, shrinking factor, tau.
*footnote: I=tem( 1 ) f a s t ; 2=tem( l)-slow; 3=tem(2)fast ; 4=tem(2)-slow;
This program involes: 1. hydrolysis for a differential tau, whish is regraded as a
peuso-nonshrinking mode, 2. compression afier each reaction of differential tau, w/o reaction.
ccccccccccccccccccccccccccccccccccccccccccccc~ccccccccccccccccccccccccccccccccc C
c --."."3- ---c------ specification for local variables ....................
real real
real real Y3, Y4 real real real
C
alpha(4), beta@), gamma(4), tau(4), tem(2), F1, a, xi - c theta, eta, xi, theta0, eta0, xi0, gara, tauc, taut
C
L, LO, L1, Lo, HO, HfO, HsO, Y0(4), yx(41, Y(4), Yl, Y2
ylt, yZt, y3t, y4t, y-lat, y-lbt, y_2t, ytot, taul, tau2 yo-lb, yxl-lb, yx2_lb, ty, Cp, u, taulset y02, yx2, yo2t, yxZt, xc(800), Ht(800), y-lbtc
62
C C C
a tern( I) tem(2) n m
beta(1) bet a(2) beta(3) bet a(4)
C
C
C
C
tau( 1) tau(2) tau(3) tau(4)
C
C
C
C
C
C
C
Fl HO Ho Hfo HsO Lo LO
U tau 1 set
theta0 eta0 xi0 gara
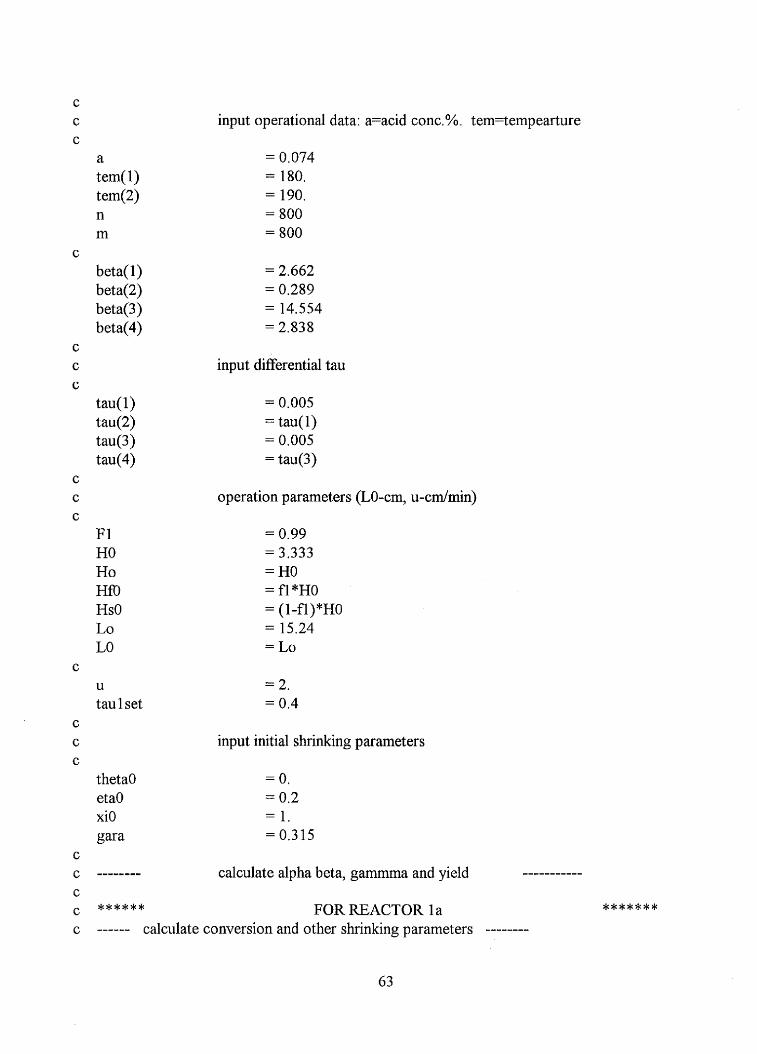
input operational data: a=acid conc. % . tem=t emp earture
= 0.074 = 180. = 190. = 800 = 800
= 2.662 = 0.289 = 14.554 = 2.838
input differential tau
= 0.005 = tau( 1) = 0.005 = tau(3)
operation parameters (LO-cm, u-cdmin)
= 0.99 = 3.333 = HO = fl*HO
= 15.24 = Lo
= (1-fl)*HO
= 2, = 0.4
input initial shrinking parameters
= 0, = 0.2 = 1. = 0.315
-------- calculate alpha beta, gammma and yield c-c--------
******* FOR REACTOR l a ****** ------ calculate conversion and other shrinking parameters --------
63
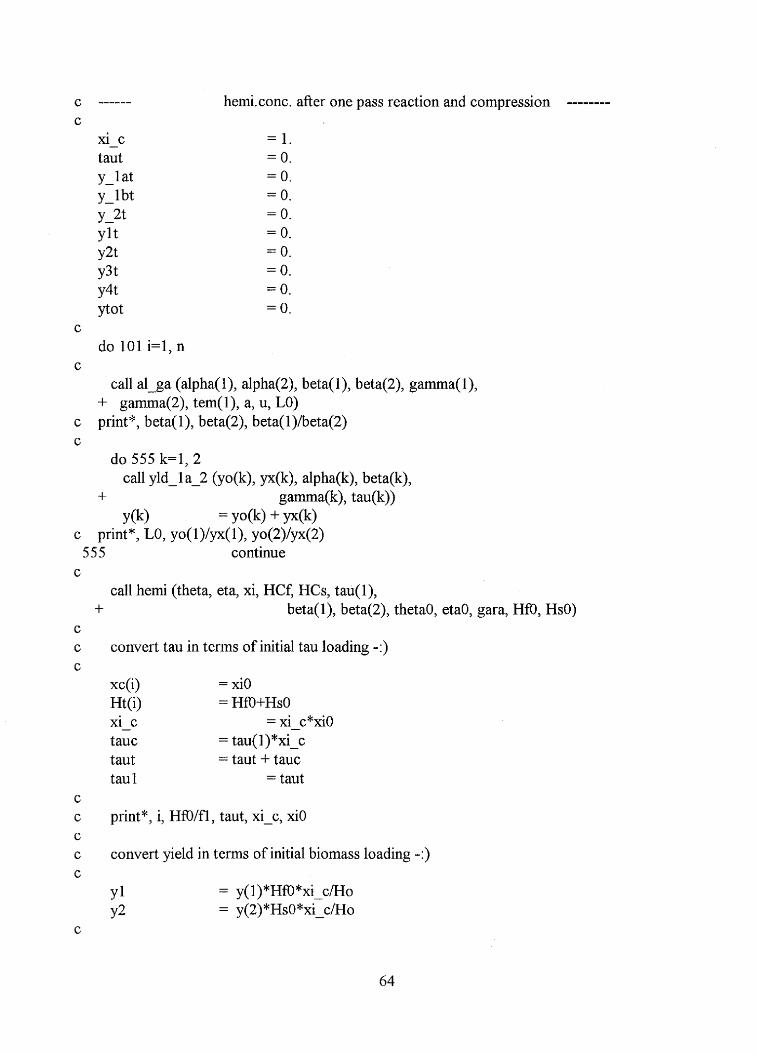
c ------ herni.conc. after one pass reaction and compression C
xi-c = 1 .
Y J a t = 0. Y J b t = 0. Y 2 t = 0, Y I t = 0. Y2t = 0. Y3t = 0, Y4t = 0. yt ot = 0.
taut = 0.
C
do 101 i=l, n C
call al-ga (alpha( l), alpha(2), beta( l), beta(2), gamma( l), + gamma(2), tem(l), a, u, LO) print", beta( l), beta(2), beta( l)/beta(2) c
C do 555 k=l, 2
call yld-1 a-2 (yo&), yx(k), alpha(k), beta(k), + gamma@), W k ) )
Y (k) = YO(k) + F ( k ) c Print", LO, Y0(l)/yx(l), YO(2)/Yx(2)
555 continue C
C
C C
C
C
C
C
C
C
call hemi (theta, eta, xi, HCf, HCs, tau( l), + beta( l), beta(2), theta0, eta0, gara, HfO, HsO)
convert tau in terms of initial tau loading -:)
xc(i) = xi0 Ht(i) = HfD+HsO xi-c =xi c*xiO tauc = tau(l)*xiIc taut = taut + tauc tau 1 = taut
print*, i, HfOlfl , taut, xi-c, xi0
convert yield in terms of initial biomass loading -:)
Y l = y(l)*Hrn*xi c m o Y2 = y(2)*HsO*xic/Ho
64
Y I t = ylt + y l Y2t = y2t + y2 YJa t = ylt + y2t
C c print*, taut, y-lat C
theta0 = theta et a0 = eta xi0 = xi H = HCf + HCs HfO = HCf HsO = HCs LO = Lo*xi_c L1 = LO
if (tau1 .GE. taulset) go to 202
print*, taut, i, L1, (HsO+Hfo)*xi~c/Ho
C
C c C
101 continue C
FOR REACTOR 2 c ****** C
202 YO2 = 0. yx2 = 0. yo2t = 0. yx2t = 0.
C do 222 j=1, m
+ call a l g a (alpha(3), alpha(4), beta(3), beta(4),
gamma@), gamma(4), tem(2), a, u, LO) C c print*, beta(3), beta(4)
do 666 k=3,4 C
call yld-1 a-2 (yo(k), yx(k), alpha(k), beta(k), + gamma( k), tau( k))
Y(k) = YO(k) + F ( k ) C print*, Y0(3)? Yx(3)? Y(4) 666 continue
*******
C call hemi (theta, eta, xi, HCf, HCs, tau(3),
+ beta(3), beta(4), theta0, eta0, gara, Hm, HsO) C
c convert tau in terms of initial tau loading -:)
65
C
C
C
C
C
C
C
C
C
C
C
C
C
xi I c = xi_c*xiO tauc = tau( 3) * xi-c taut = taut + tauc tau2 = taut - taul
convert yield in terms of initial biomass loading -:)
Y3 = y( 3) *HfO *xi-c/Ho Y4 = y(4) *HsO*xi-c/Ho
= y3t + y3 = y4t + y4 = y3 t + y4t
Y3t Y4t Y-2t
---1-.. calculate olig. monomer yield respectively from reactor 2 ------
theta0 eta0 xi0 H m HsO LO L
if (tau2 .GE.
(yo(3) * HfO+yo(4) *HsO) *xi-c/Ho (yx(3)*Hfo+yx(4) *HsO) *xi-c/Ho yo2 + yo2t yx2 + yx2t
xi HCf + HCs HCf HCS
LO Lo*xi - c
taul) go to 303
222 continue C ****** FOR REACTOR 1 b, DECOMPOSITION ****** . . . . . . . . . . . . . . . . . . . . . . . . . . . . . . . . . . . . . . . . . . . . . . . . . . . . . . . . . . . . . . . . . . . . . +++++++++++
3 03 xi-c = 1 . taut = 0.
LO = Lo Y J b t = 0.
C
66
do 777 i = 1, n C
xi-c = xi-c*xc(i) tauc = tau( l)*xi-c taut = taut + tauc
call a l g a (alpha( l), alpha(2), beta( l), beta(2), C
+ gamma( l), gamma(2), tern( I), a, u, LO) C
yo l b y x i l b yx2-lb y-1 btc YJbt = y-lbt + y-lbtc
LO = Lo*xi-c
= yo2 t/t au2 * exp (- alpha( 1 )*bet a( 1)) *tau( 1 ) = yx2t/tau2*exp(-gamma( l)*beta( l))*tau( 1) = yo2t/tau2*( I-exp(-alpha( l)*beta( l)))*tau( 1) = (yo-lb + yxl-lb + yxZ_lb)*xi-c
C
C
print", i, taut, y-1 at+yo2t+yx2t7 y_lat+y_2t, y-1 at+y-1 bt C
if (taut .GE. taul) go to 888 777 conti nu e 888 ty = y - lat+yJbt
C
CP = ty*Ho/tau 1 set
print*, i, j, taul, taut, ty, Cp, Ll, L open(unit=3, file='sk. out')
end
C
C c-------------------------- B E G W G OF S B R O U T N S _--________________________ C
C SUBROUTINE TO CALCULATE ALPHA, AND GAMMA C
subroutine a l 2 a (alphal, alpha2, betal , beta2, gammal , gamma2, + tern, a, u, LO)
real real
C
alphal, gammal, tern, an(4), k0(4), e(4), k(4), kk(4) alpha2, gamma2, betal, beta2, u, LO
C
C input kinetic data
c an(l)=l.O c an(2)=1.0 c an(3)=1.2 c an(4)=1+0
C
67
kO( 1)= 1.998E 10 k0(2)=1.237E13 k0(3)=1.046E14 k0(4)=8.990Ell e( 1)=20. BE3 e(2)=27.7E3 e(3)=27.5E3 e(4)=28.2E3
an( 1)=I .34 an(2)= I . 0 an(3)= 1.0 an(4)= I . 02 kO( 1)=1.73E19 k0(2)=1.237E15
k0(4)=2.3 8E14 e( 1)=42.9E3 e(2)=27,7E3 e(3)=27.5E3 e( 4)=3 2.87E3
k0(3)=1.044E14
C calculate kk(i)=k*a* *an(i) C
do lOi=l, 4 k(i)=kO(i) * exp (-e(i)/ 1 -9 8 7/( t em+273 .15)) kk(i)=a* *an(i)* k(i)
10 continue C
C calculate alpha1 , alpha2 and gammal, and gamma2 C
alp ha 1 =kk( 3 )/kk( 1 ) alpha2=kk( 3 )/kk( 2) gammal =kk(4)/kk( 1) gamma2=kk(4)/kk(2)
betal=kk( l)*LO/u beta2=kk(2) *LO/u
return end
C
C
C
68
C
C
C HEMI. CONC. VARIATION
SUBROUTINE TO CALCULATE onegass HEMI. CONVERSION (THETA),
COMPOSITION FACTOR (ETA), AND S W G FACTOR (Xl)
C subroutine hemi (theta, eta, xi, HCf, HCs, tau, + real real HCf, HCs, Hfo, HsO
Hf = HfO*exp(-beta1 *tau) HS = HsO * exp (- b et a2 * tau)
betal, beta2, theta0, eta0, gara, HfO, HsO) theta, eta, xi, tau, betal, beta2, theta0, eta0, gara
C
C theta = 1 - (Hf+€€s)/(HfO +Hs 0) eta
----- gara=reation of solubized lignin to sohbifized hernicellulose)
= (etaO*( 1-theta))/( 1 -etaO*theta*( l+gara)) C
c C
xi = I -etaO*theta*( l+gara) c xi=l. C
HCf = Hf/xi HCs = Hdxi
return end
C
C
C
x = beta
subroutine yld-la-2 (yo, yx, alpha, x, gamma, tau) real real
YXL yx2, Yx3, Yx4, F5, F6 yo, yx, alpha, x, gamma, tau
C c print", 'test', x
C
C calculate xylose oligomer yield
CALCULATE YIELD FROM RECTOR - 1 a C
C yo = (I -exp(-alpha"))*
69
C C C
+ (I -exp(-x*tau))/alpha/x
calculate xylose yield
C
yx2 = (exp(-x*( l+gamma)*(tau+].))- + exp(-x*( 1 +garnma)))/x/ + (1 +gamma)
C yx3 = (1 -exp(-( I+gamma)*x*tau))/
+ ( 1 +gamma)/x C
yx4 = (exp(-x*tau)- l)/x C
yx5 = (exp(x*( 1 -gamma))-exp(x* + ( 1. -alpha)))/(gamma-alpha)
C
C
C C
yx6 = (exp(-x)-exp(-x*(tau+ l)))/x
yx = exp(x)/gamma*(yxl+yx2)+ + exp( -x * g amma)/g amma * + ~yx3+F4)+yx5*yx~
print", yo, yx return end
C
70
REPORT DOCUMENTATION PAGE Form Approved OMB No. 0704-0188
The public reporting burden for this collection of information is estimated to average 1 hour per response, including the time for reviewing instructions, searching existing data sources, gathering and maintaining the data needed, and completing and reviewing the collection of information. Send comments regarding this burden estimate or any other aspect of this collection of information, including suggestions for reducing the burden, to Department of Defense, Executive Services and Communications Directorate (0704-0188). Respondents should be aware that notwithstanding any other provision of law, no person shall be subject to any penalty for failing to comply with a collection of information if it does not display a currently valid OMB control number. PLEASE DO NOT RETURN YOUR FORM TO THE ABOVE ORGANIZATION. 1. REPORT DATE (DD-MM-YYYY)
September 2004 2. REPORT TYPE
Subcontract Report 3. DATES COVERED (From - To)
May 1997 5a. CONTRACT NUMBER
DE-AC36-99-GO10337
5b. GRANT NUMBER
4. TITLE AND SUBTITLE Kinetic and Modeling Investigation on Dilute Sulfuric Acid and Hot Water Fractionation of Selected Biomass: May 1997
5c. PROGRAM ELEMENT NUMBER
5d. PROJECT NUMBER NREL/SR-510-36391
5e. TASK NUMBER BB04.7610
6. AUTHOR(S) Y.Y. Lee, R.B. Chen, Z. Wu, and J. Hayes
5f. WORK UNIT NUMBER
7. PERFORMING ORGANIZATION NAME(S) AND ADDRESS(ES) Auburn University Auburn, Alabama
8. PERFORMING ORGANIZATION REPORT NUMBER XAW-3-13441-01
10. SPONSOR/MONITOR'S ACRONYM(S) NREL
9. SPONSORING/MONITORING AGENCY NAME(S) AND ADDRESS(ES) National Renewable Energy Laboratory 1617 Cole Blvd. Golden, CO 80401-3393 11. SPONSORING/MONITORING
AGENCY REPORT NUMBER NREL/SR-510-36391
12. DISTRIBUTION AVAILABILITY STATEMENT National Technical Information Service U.S. Department of Commerce 5285 Port Royal Road Springfield, VA 22161
13. SUPPLEMENTARY NOTES NREL Technical Monitor: R. Torget
14. ABSTRACT (Maximum 200 Words) Subcontractor developed a processing model to evaluate and optimize an NREL-developed biomass pretreatment technology. The technology, taking advantage of the biphasic nature of hemicellulose in pretreatment, is a two-stage, reverse-flow, shrinking-bed system. The contract simulation found that this system could increase sugar yield by about 5%, with bed shrinkage of 27% and sugar yield of 95% at optimum conditions.
15. SUBJECT TERMS biofuels; ethanol; fuels; chemicals; pretreatment; shrinking bed; hemicellulose; feedstock; biomass
16. SECURITY CLASSIFICATION OF: 19a. NAME OF RESPONSIBLE PERSON a. REPORT
Unclassified b. ABSTRACT Unclassified
c. THIS PAGE Unclassified
17. LIMITATION OF ABSTRACT
UL
18. NUMBER OF PAGES
19b. TELEPONE NUMBER (Include area code)
Standard Form 298 (Rev. 8/98) Prescribed by ANSI Std. Z39.18


![(GXFDWLRQ CHEMISTRY 0620/43 - … (0620)/0620_w17_qp_43.pdfWrite a chemical equation for the reaction..... [1] (ii) When iron(III) oxide is added to dilute sulfuric acid, an aqueous](https://img.pdfslide.us/doc/110x75/5a9f0b037f8b9a67178c4470/pdfgxfdwlrq-chemistry-062043-06200620w17qp43pdfwrite-a-chemical.jpg)