Embed Size (px)
Citation preview

Kindergarten Readiness Survey
Results2014-2015
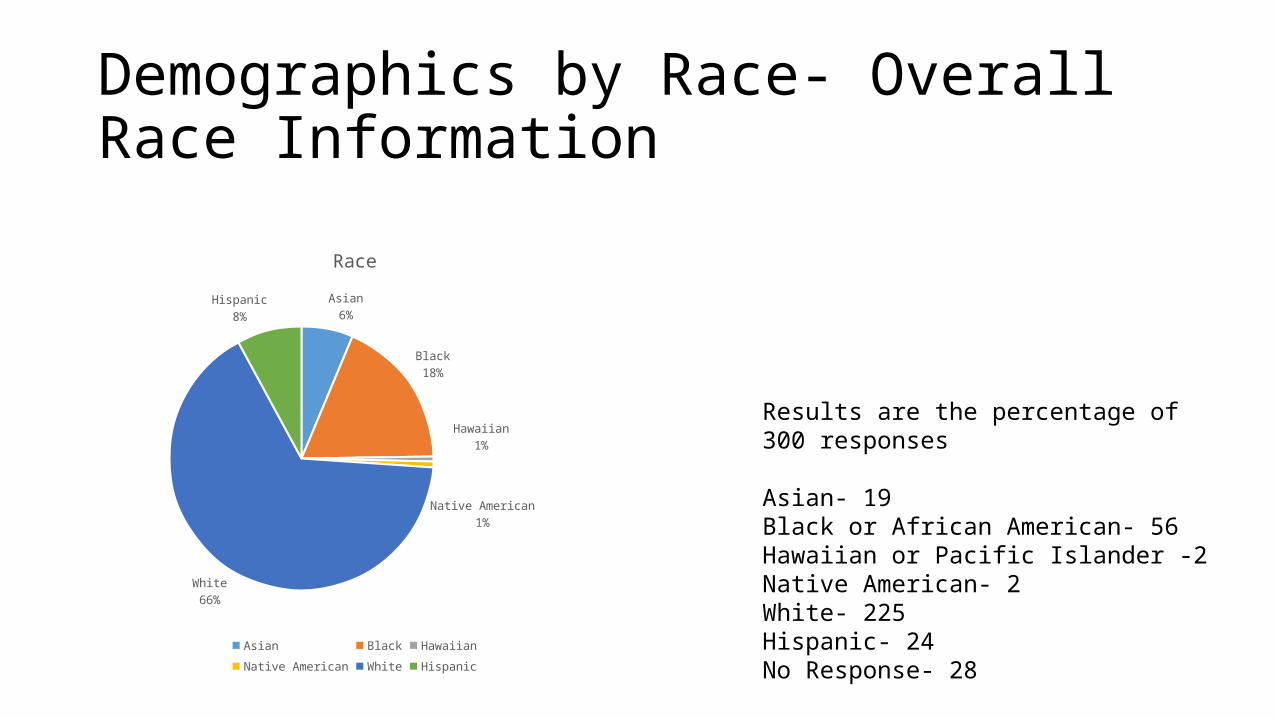
Demographics by Race- Overall Race Information
Results are the percentage of 300 responses
Asian- 19Black or African American- 56Hawaiian or Pacific Islander -2Native American- 2White- 225Hispanic- 24No Response- 28
Asian6%
Black18%
Hawaiian1%
Native American1%
White66%
Hispanic8%
Race
Asian Black Hawaiian Native American White Hispanic
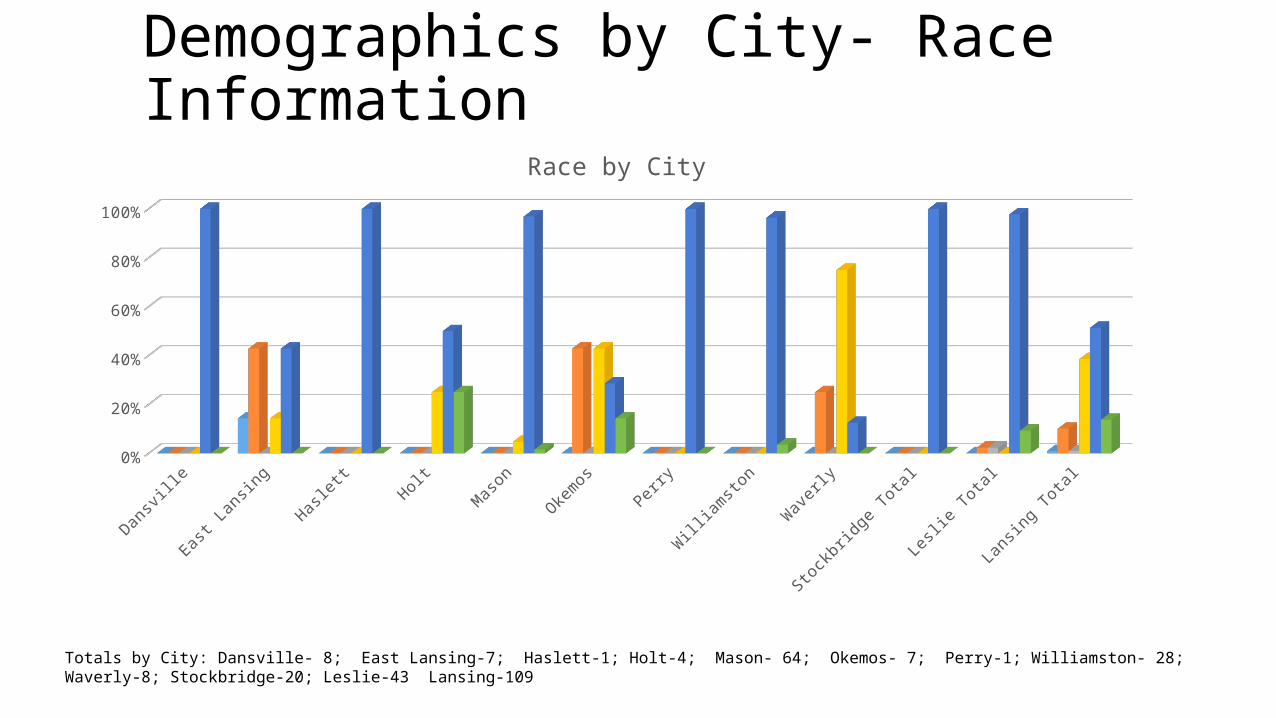
Demographics by City- Race Information
Dansville
East Lans-ing
Haslett Holt Mason Oke-mos
Perry Williamston
Wa-verly
Stock-bridge Total
Leslie Total
Lans-ing To-
tal
NATIVE AMER-ICAN
0 0.14285714285714
3
0 0 0 0 0 0 0 0 0 0.00917431192660
551
ASIAN 0 0.42857142857142
9
0 0 0 0.42857142857142
9
0 0 0.25 0 0.02325581395348
84
0.10091743119266
1
HAWAI-IAN
0 0 0 0 0 0 0 0 0 0 0.02325581395348
84
0.00917431192660
551
BLACK 0 0.14285714285714
3
0 0.25 0.04761904761904
76
0.42857142857142
9
0 0 0.75 0 0 0.38532110091743
1
WHITE 1 0.42857142857142
9
1 0.5 0.96875
0.28571428571428
6
1 0.96428571428571
4
0.125 1 0.97674418604651
2
0.51376146788990
8
HIS-PANIC
0 0 0 0.25 0.015625
0.14285714285714
3
0 0.03571428571428
57
0 0 0.09302325581395
35
0.13761467889908
3
10%
30%
50%
70%
90%
Race by City
Totals by City: Dansville- 8; East Lansing-7; Haslett-1; Holt-4; Mason- 64; Okemos- 7; Perry-1; Williamston- 28; Waverly-8; Stockbridge-20; Leslie-43 Lansing-109
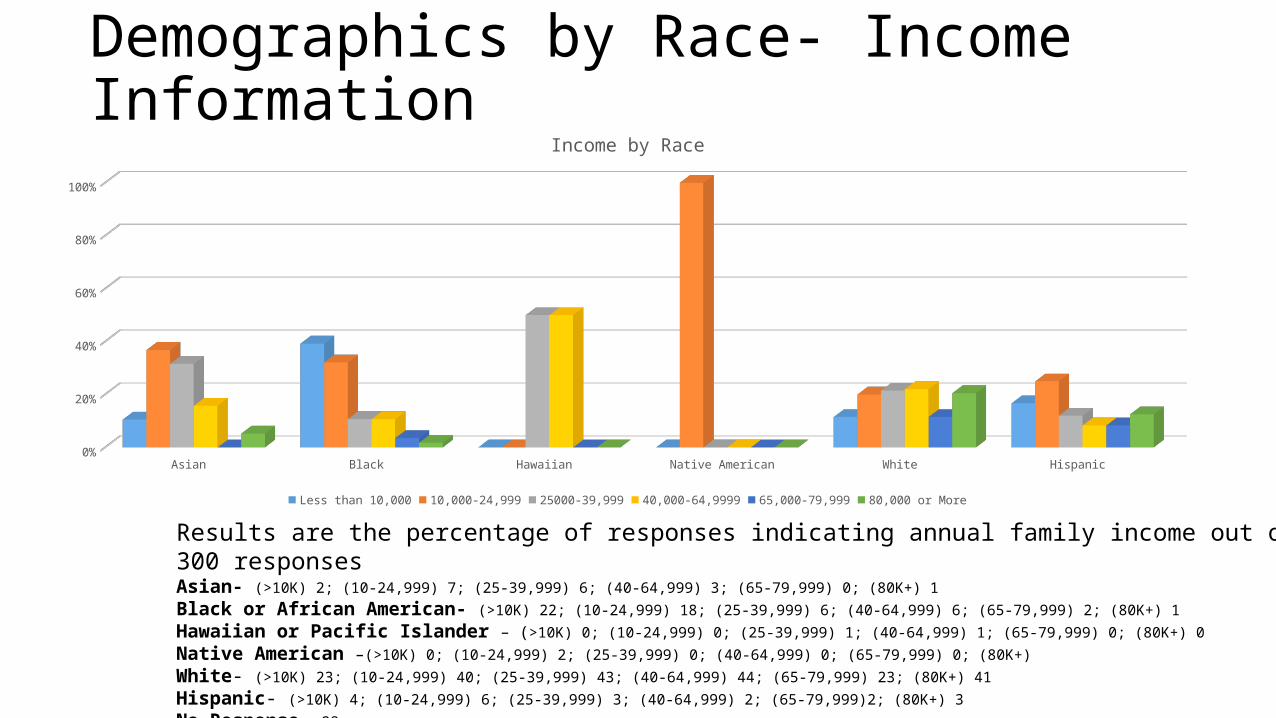
Demographics by Race- Income Information
Results are the percentage of responses indicating annual family income out of 300 responsesAsian- (>10K) 2; (10-24,999) 7; (25-39,999) 6; (40-64,999) 3; (65-79,999) 0; (80K+) 1
Black or African American- (>10K) 22; (10-24,999) 18; (25-39,999) 6; (40-64,999) 6; (65-79,999) 2; (80K+) 1
Hawaiian or Pacific Islander – (>10K) 0; (10-24,999) 0; (25-39,999) 1; (40-64,999) 1; (65-79,999) 0; (80K+) 0
Native American –(>10K) 0; (10-24,999) 2; (25-39,999) 0; (40-64,999) 0; (65-79,999) 0; (80K+)
White- (>10K) 23; (10-24,999) 40; (25-39,999) 43; (40-64,999) 44; (65-79,999) 23; (80K+) 41
Hispanic- (>10K) 4; (10-24,999) 6; (25-39,999) 3; (40-64,999) 2; (65-79,999)2; (80K+) 3
No Response- 28
Asian Black Hawaiian Native American White Hispanic
Less than 10,000 0.105263157894737 0.392857142857143 0 0 0.115 0.166666666666667
10,000-24,999 0.368421052631579 0.321428571428571 0 1 0.2 0.25
25000-39,999 0.315789473684211 0.107142857142857 0.5 0 0.215 0.12
40,000-64,9999 0.157894736842105 0.107142857142857 0.5 0 0.22 0.0833333333333333
65,000-79,999 0 0.0357142857142857 0 0 0.115 0.0833333333333333
80,000 or More 0.0526315789473684 0.0178571428571429 0 0 0.205 0.125
10%
30%
50%
70%
90%
Income by Race
Less than 10,000 10,000-24,999 25000-39,999 40,000-64,9999 65,000-79,999 80,000 or More
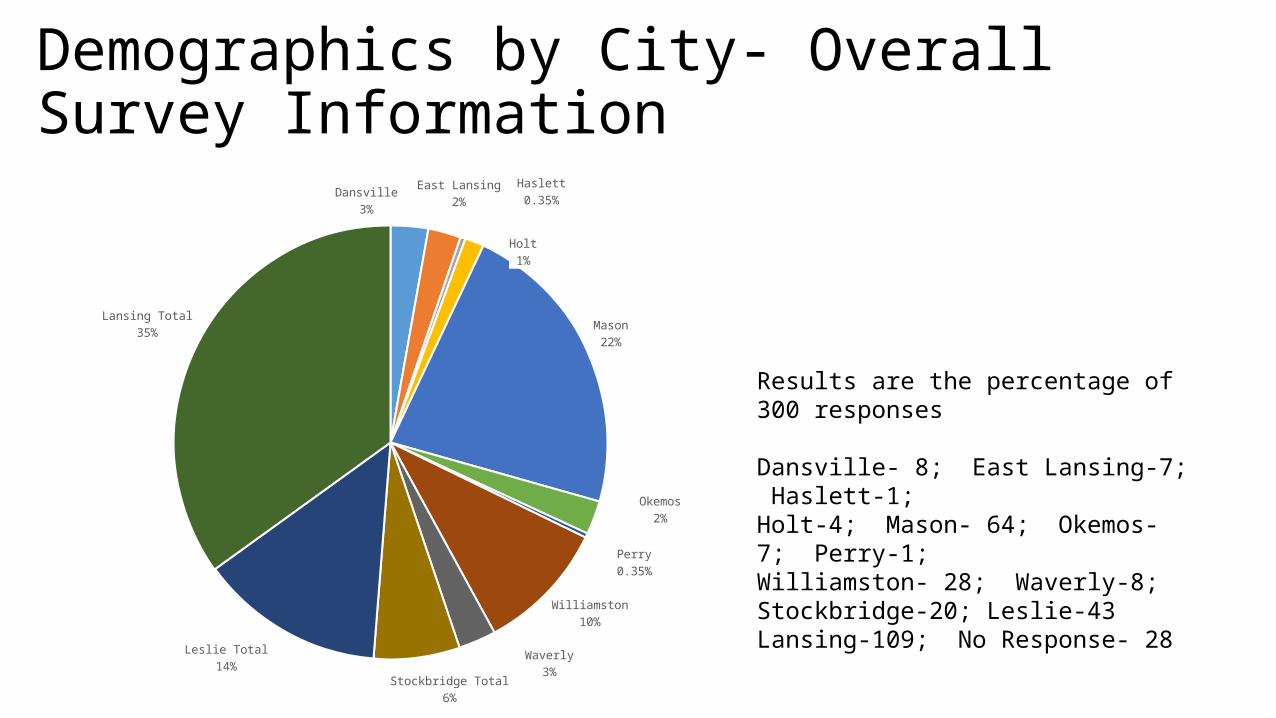
Demographics by City- Overall Survey Information
Results are the percentage of 300 responses
Dansville- 8; East Lansing-7; Haslett-1;Holt-4; Mason- 64; Okemos- 7; Perry-1;Williamston- 28; Waverly-8; Stockbridge-20; Leslie-43 Lansing-109; No Response- 28
Dansville3%
East Lansing2%
Haslett0.35%
Holt1%
Mason22%
Okemos2%
Perry0.35%
Williamston10%
Waverly3%
Stockbridge Total6%
Leslie Total14%
Lansing Total35%
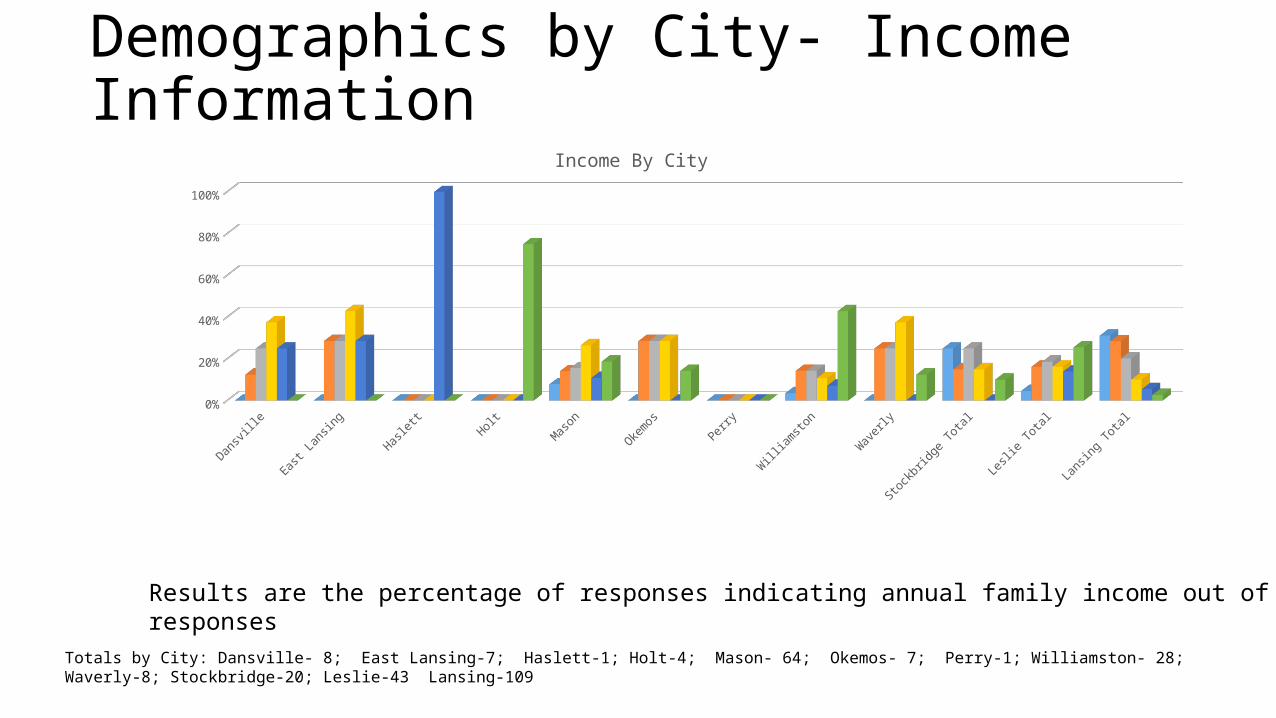
Demographics by City- Income Information
Results are the percentage of responses indicating annual family income out of 300 responses
Totals by City: Dansville- 8; East Lansing-7; Haslett-1; Holt-4; Mason- 64; Okemos- 7; Perry-1; Williamston- 28; Waverly-8; Stockbridge-20; Leslie-43 Lansing-109
Dansville East Lansing Haslett Holt Mason Okemos Perry Williamston Waverly Stockbridge Total
Leslie Total Lansing Total
LESS THAN 10 0 0 0 0 0.078125 0 0 0.0357142857142857
0 0.25 0.0465116279069767
0.311926605504587
10,000-24,999 0.125 0.285714285714286
0 0 0.140625 0.285714285714286
0 0.142857142857143
0.25 0.15 0.162790697674419
0.284403669724771
25,000-39,000 0.25 0.285714285714286
0 0 0.15625 0.285714285714286
0 0.142857142857143
0.25 0.25 0.186046511627907
0.201834862385321
40,000-64,999 0.375 0.428571428571429
0 0 0.265625 0.285714285714286
0 0.107142857142857
0.375 0.15 0.162790697674419
0.100917431192661
65,000-79,999 0.25 0.285714285714286
1 0 0.109375 0 0 0.0714285714285714
0 0 0.13953488372093
0.055045871559633
80,000 OR MORE 0 0 0 0.75 0.1875 0.142857142857143
0 0.428571428571429
0.125 0.1 0.255813953488372
0.0275229357798165
10%
30%
50%
70%
90%
Income By City
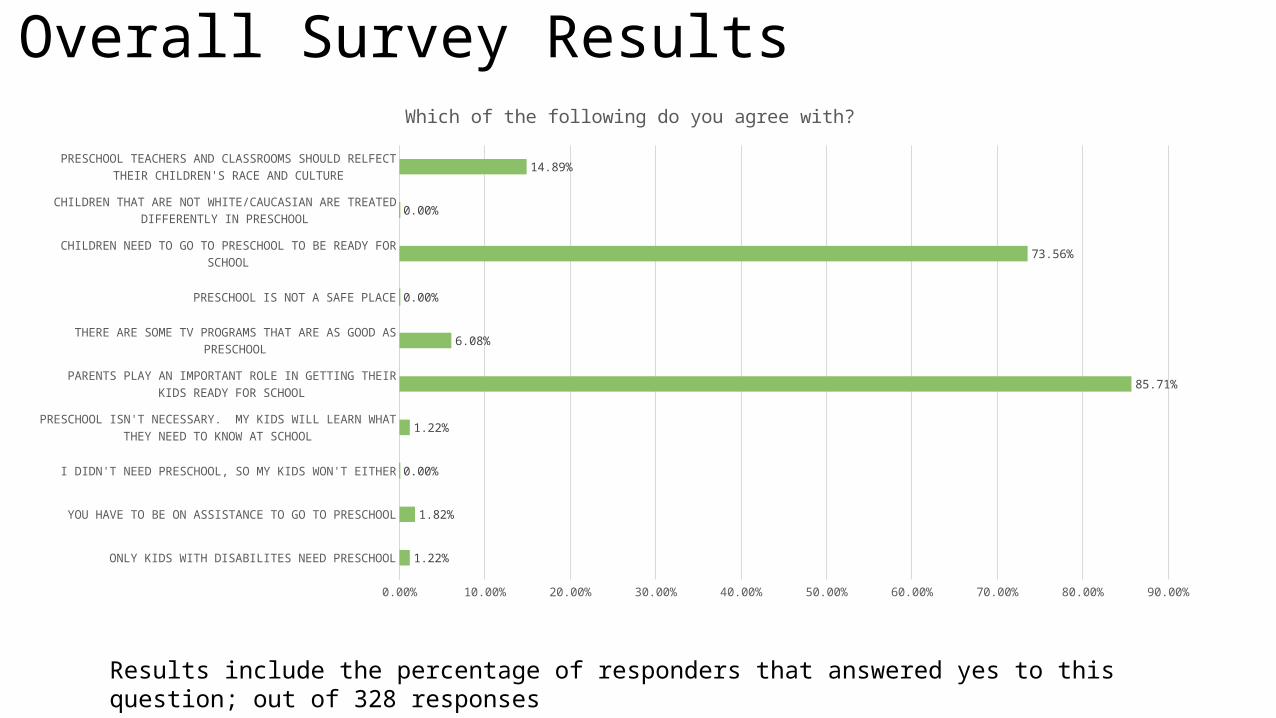
Overall Survey Results
ONLY KIDS WITH DISABILITES NEED PRESCHOOL
YOU HAVE TO BE ON ASSISTANCE TO GO TO PRESCHOOL
I DIDN'T NEED PRESCHOOL, SO MY KIDS WON'T EITHER
PRESCHOOL ISN'T NECESSARY. MY KIDS WILL LEARN WHAT THEY NEED TO KNOW AT SCHOOL
PARENTS PLAY AN IMPORTANT ROLE IN GETTING THEIR KIDS READY FOR SCHOOL
THERE ARE SOME TV PROGRAMS THAT ARE AS GOOD AS PRESCHOOL
PRESCHOOL IS NOT A SAFE PLACE
CHILDREN NEED TO GO TO PRESCHOOL TO BE READY FOR SCHOOL
CHILDREN THAT ARE NOT WHITE/CAUCASIAN ARE TREATED DIFFERENTLY IN PRESCHOOL
PRESCHOOL TEACHERS AND CLASSROOMS SHOULD RELFECT THEIR CHILDREN'S RACE AND CULTURE
0.00% 10.00% 20.00% 30.00% 40.00% 50.00% 60.00% 70.00% 80.00% 90.00%
1.22%
1.82%
0.00%
1.22%
85.71%
6.08%
0.00%
73.56%
0.00%
14.89%
Which of the following do you agree with?
Results include the percentage of responders that answered yes to this question; out of 328 responses
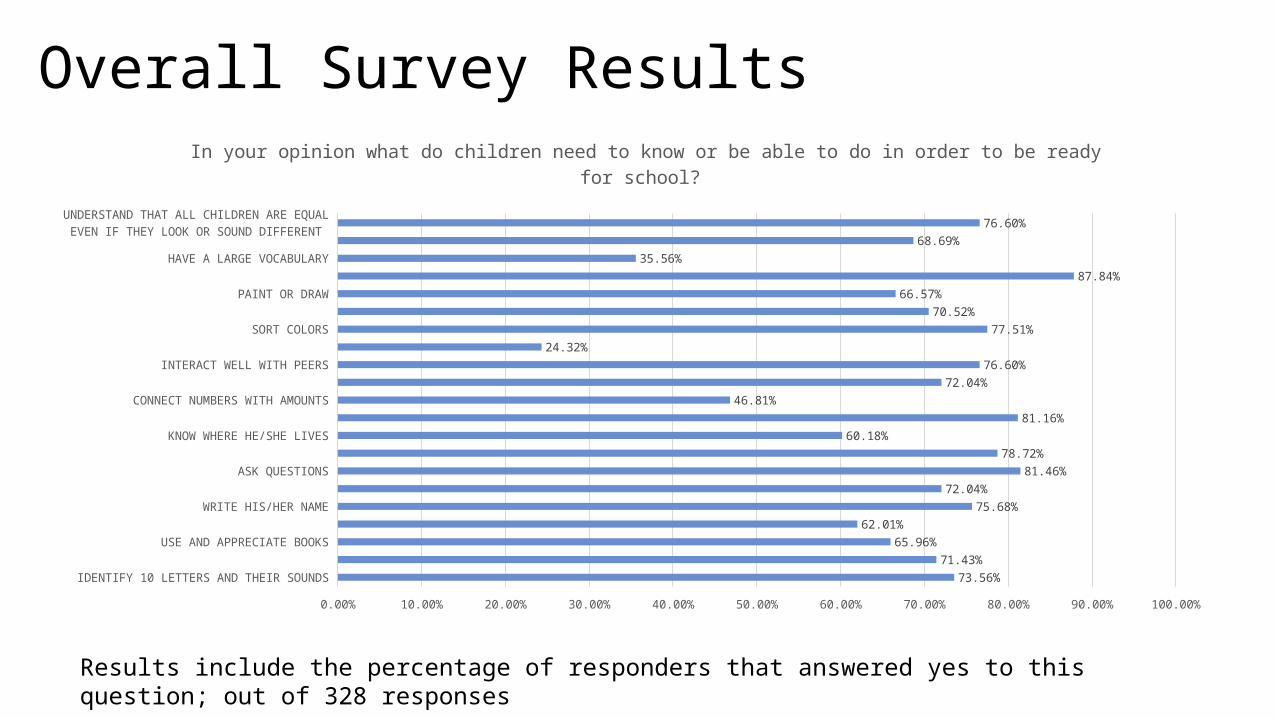
Overall Survey Results
IDENTIFY 10 LETTERS AND THEIR SOUNDS
HAVE LETTER SOUND KNOWLEDGE
USE AND APPRECIATE BOOKS
RETELL STORIES HE/SHE HAS HEARD
WRITE HIS/HER NAME
COUNT TO 20
ASK QUESTIONS
UNDERSTAND SHAPES
KNOW WHERE HE/SHE LIVES
USE PENCILS AND CRAYONS
CONNECT NUMBERS WITH AMOUNTS
UNDERSTAND AND BE ABLE TO HANDLE THEIR EMOTIONS IN A POSITIVE WAY
INTERACT WELL WITH PEERS
SOLVE SOCIAL PROBLEMS
SORT COLORS
JUMP AND HOP
PAINT OR DRAW
FOLLOW DIRECTIONS
HAVE A LARGE VOCABULARY
HAVE A CONVERSATION
UNDERSTAND THAT ALL CHILDREN ARE EQUAL EVEN IF THEY LOOK OR SOUND DIFFERENT
0.00% 10.00% 20.00% 30.00% 40.00% 50.00% 60.00% 70.00% 80.00% 90.00% 100.00%
73.56%
71.43%
65.96%
62.01%
75.68%
72.04%
81.46%
78.72%
60.18%
81.16%
46.81%
72.04%
76.60%
24.32%
77.51%
70.52%
66.57%
87.84%
35.56%
68.69%
76.60%
In your opinion what do children need to know or be able to do in order to be ready for school?
Results include the percentage of responders that answered yes to this question; out of 328 responses
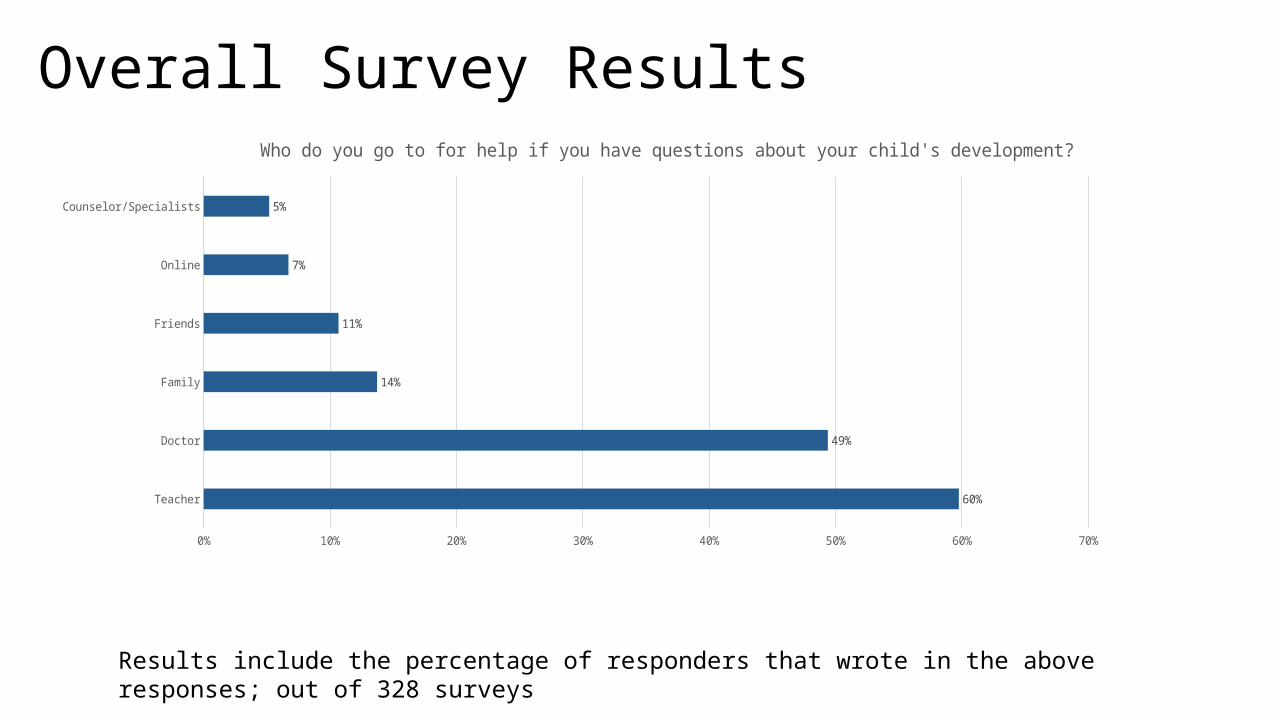
Teacher
Doctor
Family
Friends
Online
Counselor/Specialists
0% 10% 20% 30% 40% 50% 60% 70%
60%
49%
14%
11%
7%
5%
Who do you go to for help if you have questions about your child's development?
Overall Survey Results
Results include the percentage of responders that wrote in the above responses; out of 328 surveys
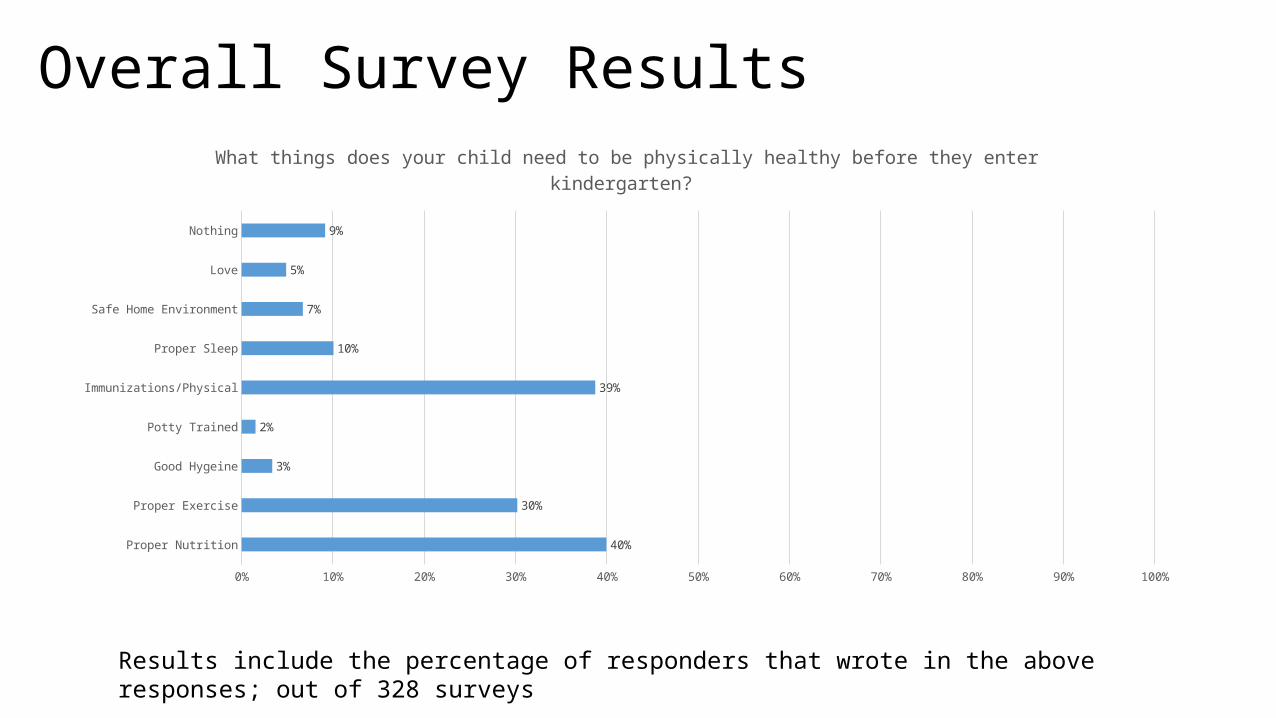
Overall Survey Results
Results include the percentage of responders that wrote in the above responses; out of 328 surveys
Proper Nutrition
Proper Exercise
Good Hygeine
Potty Trained
Immunizations/Physical
Proper Sleep
Safe Home Environment
Love
Nothing
0% 10% 20% 30% 40% 50% 60% 70% 80% 90% 100%
40%
30%
3%
2%
39%
10%
7%
5%
9%
What things does your child need to be physically healthy before they enter kindergarten?
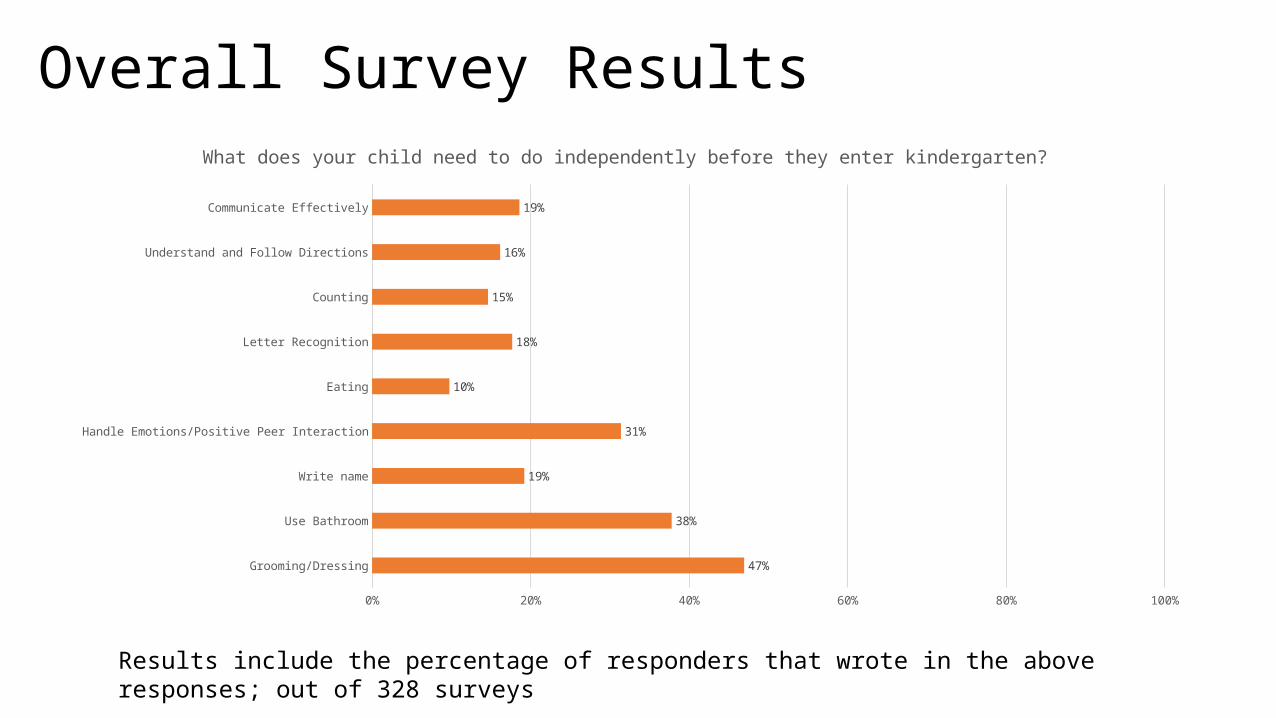
Overall Survey Results
Results include the percentage of responders that wrote in the above responses; out of 328 surveys
Grooming/Dressing
Use Bathroom
Write name
Handle Emotions/Positive Peer Interaction
Eating
Letter Recognition
Counting
Understand and Follow Directions
Communicate Effectively
0% 20% 40% 60% 80% 100%
47%
38%
19%
31%
10%
18%
15%
16%
19%
What does your child need to do independently before they enter kindergarten?
• Think on your own, write down your key observations.
• Share with a partner and write down what additional information you might want.
• Who else needs this information?
• Next steps

![2021 Race Reporting - NOTRA2021 Race Reporting The Rule Book [2.2 SUBMITTALS TO NOTRA: 2.2.1 Results] requires that all club race secretaries report the results of a race meet within](https://img.pdfslide.us/doc/110x75/60fc3e33698c6954a17aabb8/2021-race-reporting-2021-race-reporting-the-rule-book-22-submittals-to-notra.jpg)