Embed Size (px)
Citation preview
AIS201830th Anniversary
© Copyright 2018 NCCI Holdings, Inc. All Rights Reserved.
AIS201830th Anniversary
Killer Pain ReliefOpioids in Workers Compensation
Raji ChadarevianDirector, Medical Regulation and InformaticsNCCI
AIS201830th Anniversary© Copyright 2018 NCCI Holdings, Inc. All Rights Reserved.
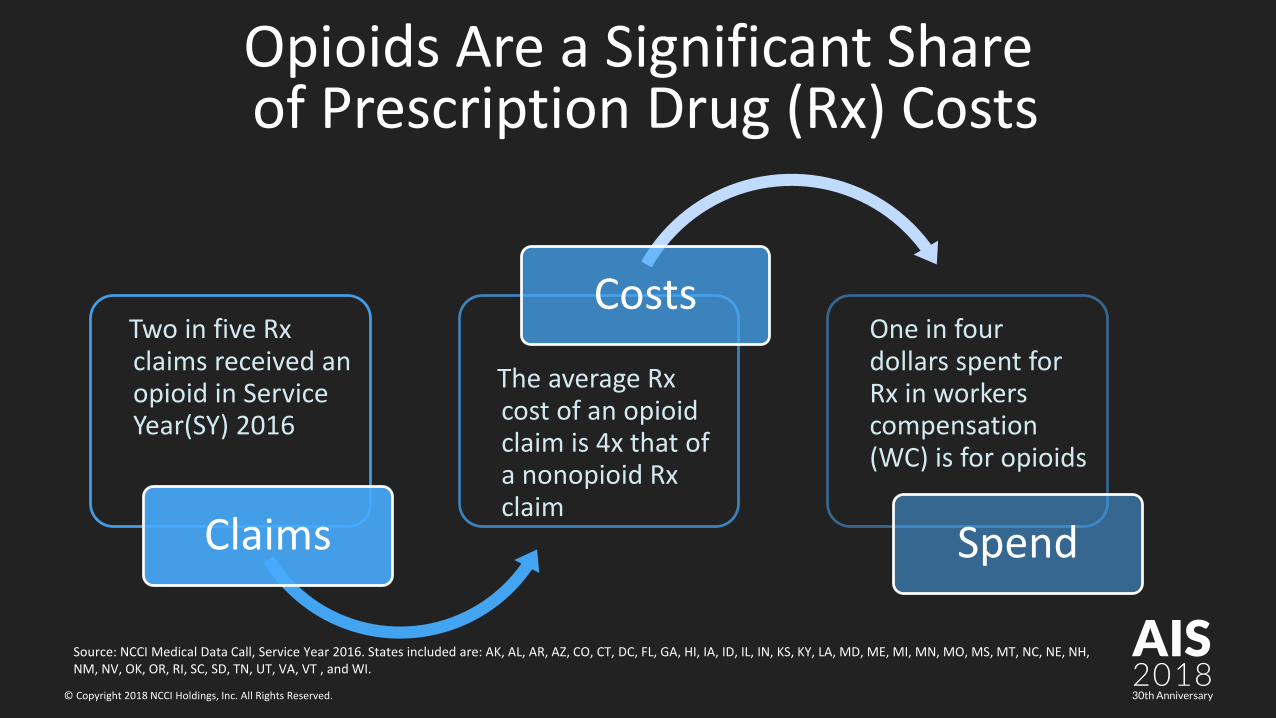
Opioids Are a Significant Shareof Prescription Drug (Rx) Costs
Two in five Rx claims received an opioid in Service Year(SY) 2016
Claims
The average Rx cost of an opioid claim is 4x that of a nonopioid Rx claim
CostsOne in four dollars spent for Rx in workers compensation (WC) is for opioids
Spend
Source: NCCI Medical Data Call, Service Year 2016. States included are: AK, AL, AR, AZ, CO, CT, DC, FL, GA, HI, IA, ID, IL, IN, KS, KY, LA, MD, ME, MI, MN, MO, MS, MT, NC, NE, NH, NM, NV, OK, OR, RI, SC, SD, TN, UT, VA, VT , and WI.
AIS201830th Anniversary© Copyright 2018 NCCI Holdings, Inc. All Rights Reserved.
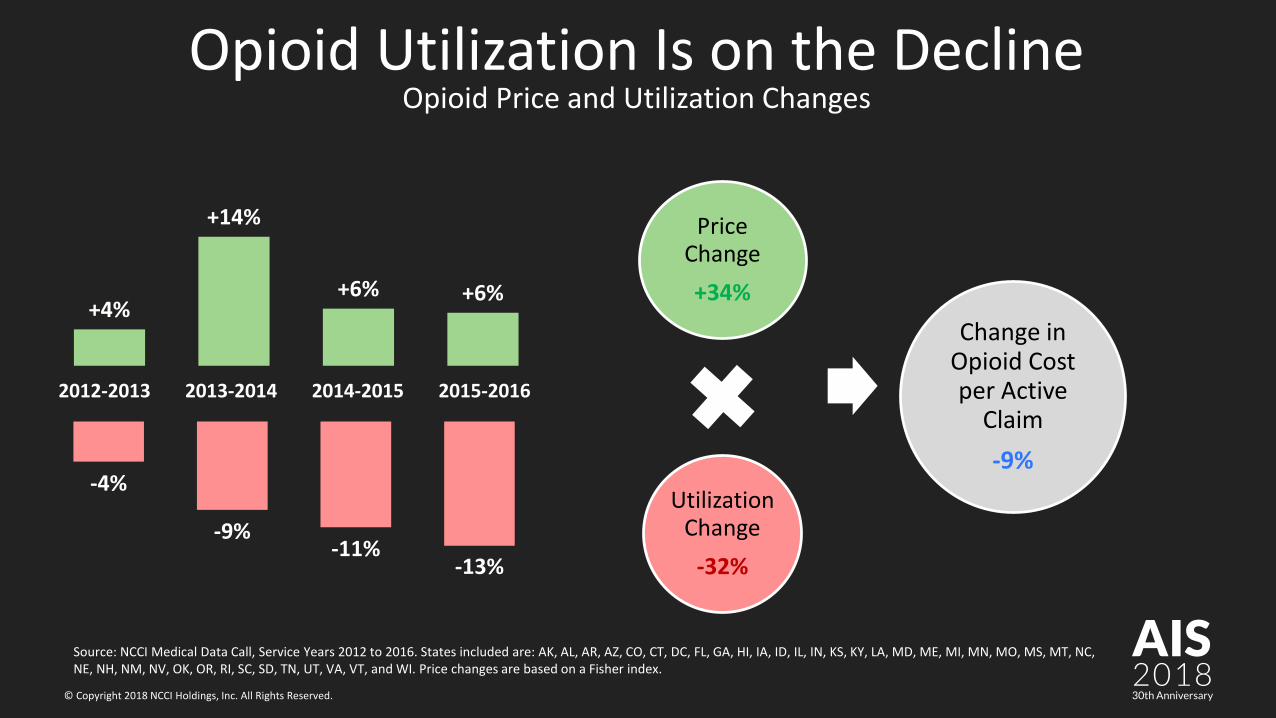
Opioid Utilization Is on the DeclineOpioid Price and Utilization Changes
+4%
+14%
+6% +6%
-4%
-9%-11%
-13%
Price Change+34%
Utilization Change
-32%
Change in Opioid Cost per Active
Claim-9%
2012-2013 2013-2014 2014-2015 2015-2016
Source: NCCI Medical Data Call, Service Years 2012 to 2016. States included are: AK, AL, AR, AZ, CO, CT, DC, FL, GA, HI, IA, ID, IL, IN, KS, KY, LA, MD, ME, MI, MN, MO, MS, MT, NC, NE, NH, NM, NV, OK, OR, RI, SC, SD, TN, UT, VA, VT, and WI. Price changes are based on a Fisher index.
AIS201830th Anniversary© Copyright 2018 NCCI Holdings, Inc. All Rights Reserved.
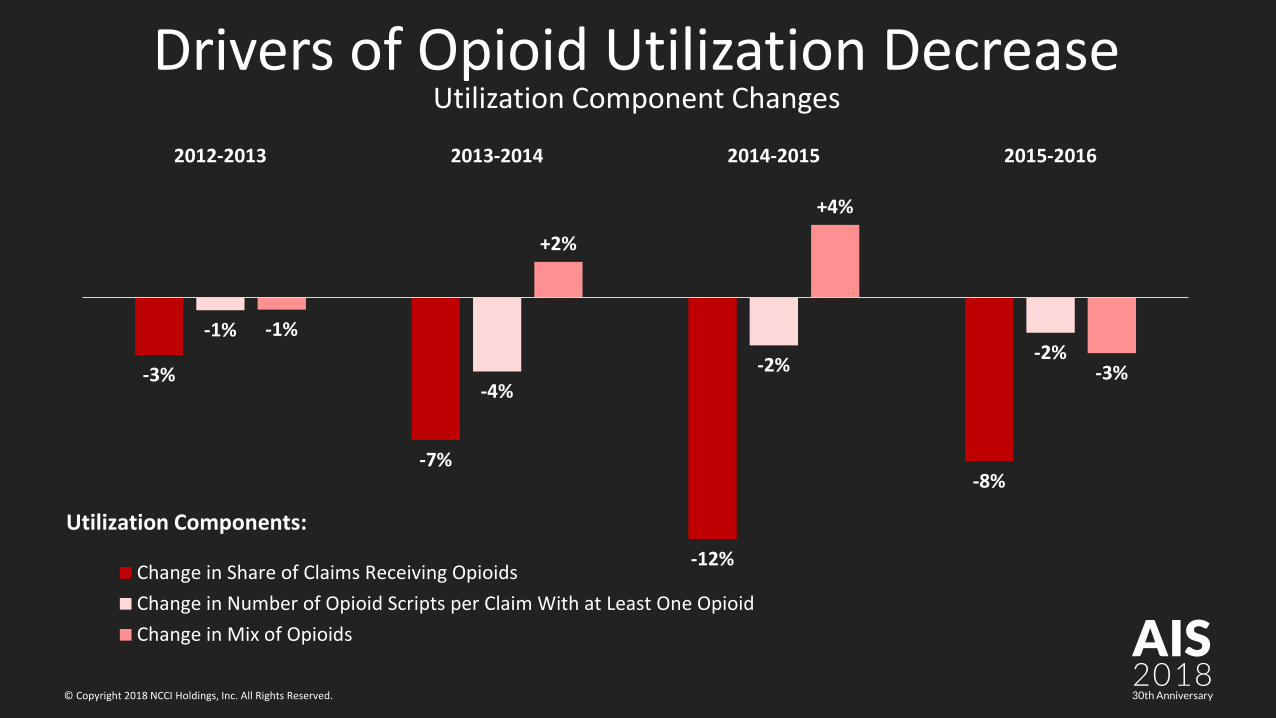
Drivers of Opioid Utilization DecreaseUtilization Component Changes
-3%
-7%
-12%
-8%
-1%
-4%-2% -2%
-1%
+2%
+4%
-3%
2012-2013 2013-2014 2014-2015 2015-2016
Change in Share of Claims Receiving OpioidsChange in Number of Opioid Scripts per Claim With at Least One OpioidChange in Mix of Opioids
Utilization Components:
AIS201830th Anniversary© Copyright 2018 NCCI Holdings, Inc. All Rights Reserved.
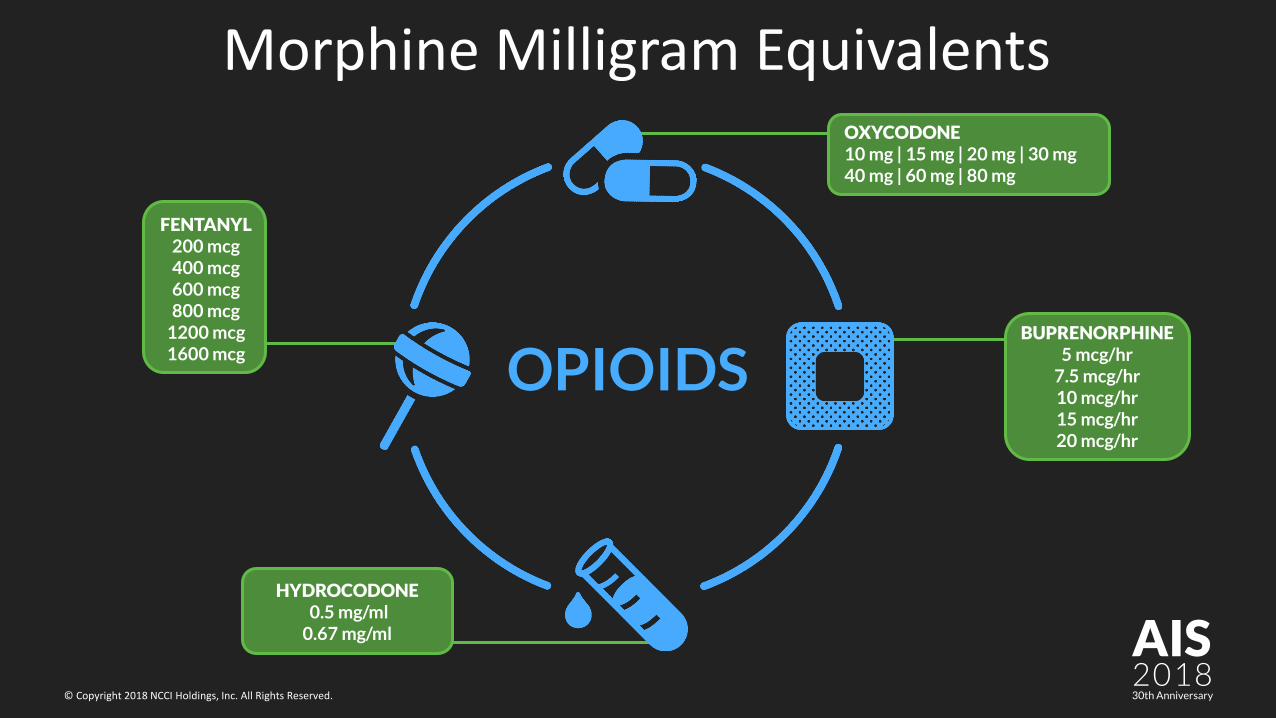
Morphine Milligram Equivalents
FENTANYL 200 mcg400 mcg600 mcg800 mcg
1200 mcg1600 mcg
HYDROCODONE 0.5 mg/ml
0.67 mg/ml
BUPRENORPHINE5 mcg/hr
7.5 mcg/hr10 mcg/hr15 mcg/hr20 mcg/hr
OXYCODONE10 mg | 15 mg | 20 mg | 30 mg 40 mg | 60 mg | 80 mg
OPIOIDS
AIS201830th Anniversary© Copyright 2018 NCCI Holdings, Inc. All Rights Reserved.
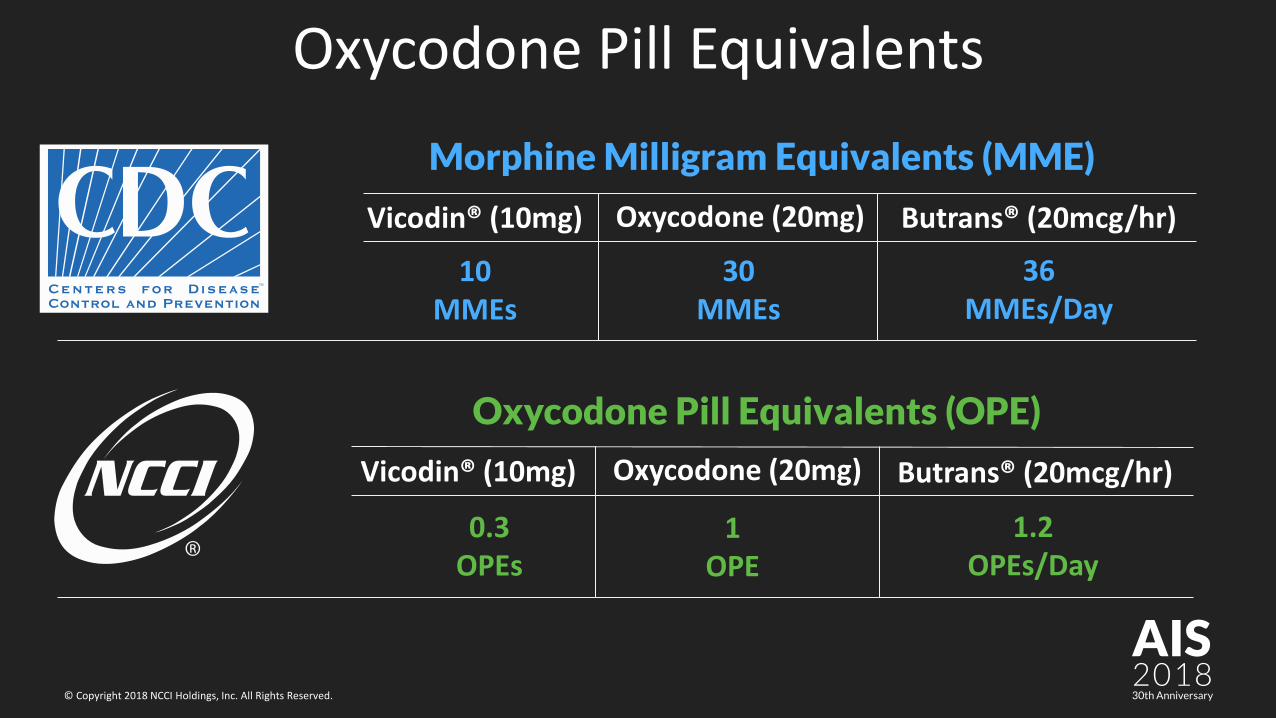
Oxycodone Pill Equivalents
Vicodin® (10mg)
Morphine Milligram Equivalents (MME)
Butrans® (20mcg/hr)Oxycodone (20mg)
10 MMEs
30 MMEs
36 MMEs/Day
Oxycodone Pill Equivalents (OPE)
Oxycodone (20mg)
0.3OPEs
1 OPE
1.2 OPEs/Day
Butrans® (20mcg/hr)Vicodin® (10mg)
AIS201830th Anniversary© Copyright 2018 NCCI Holdings, Inc. All Rights Reserved.
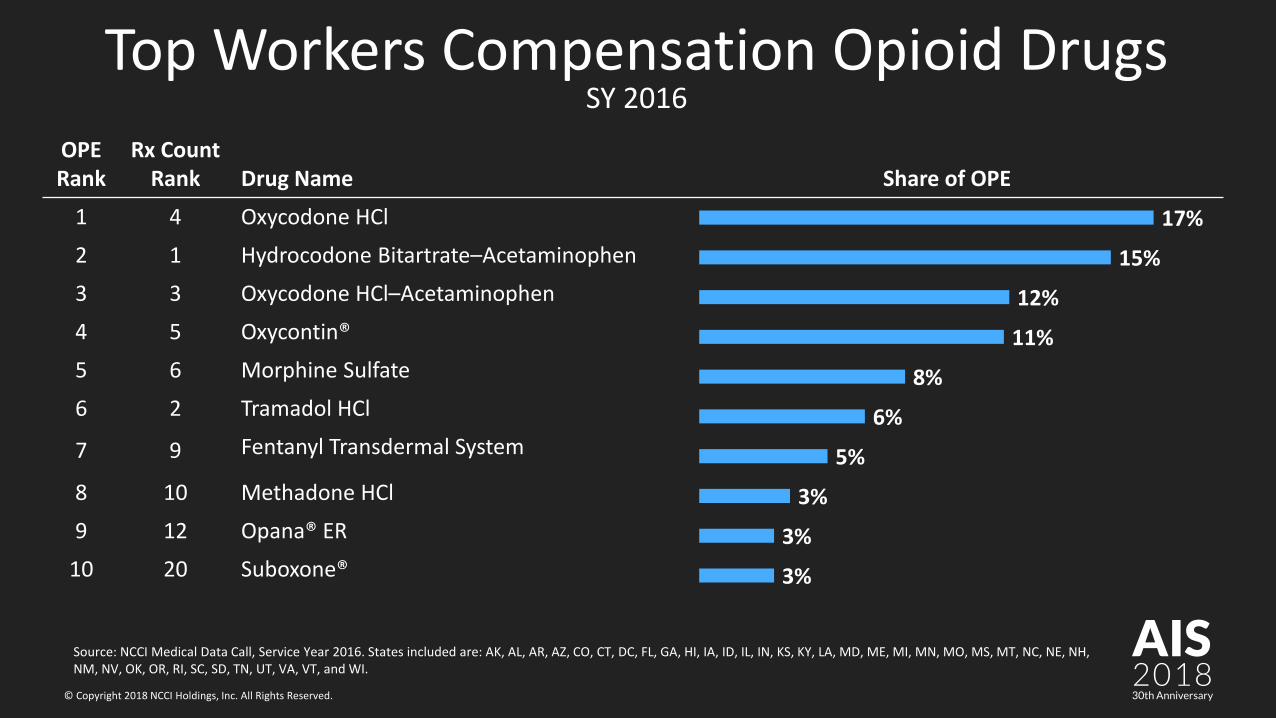
Top Workers Compensation Opioid DrugsSY 2016
OPE Rank
Rx Count Rank Drug Name Share of OPE
1 4 Oxycodone HCl
2 1 Hydrocodone Bitartrate–Acetaminophen
3 3 Oxycodone HCl–Acetaminophen
4 5 Oxycontin®
5 6 Morphine Sulfate
6 2 Tramadol HCl
7 9 Fentanyl Transdermal System
8 10 Methadone HCl
9 12 Opana® ER
10 20 Suboxone® 3%
3%
3%
5%
6%
8%
11%
12%
15%
17%
Source: NCCI Medical Data Call, Service Year 2016. States included are: AK, AL, AR, AZ, CO, CT, DC, FL, GA, HI, IA, ID, IL, IN, KS, KY, LA, MD, ME, MI, MN, MO, MS, MT, NC, NE, NH, NM, NV, OK, OR, RI, SC, SD, TN, UT, VA, VT, and WI.
AIS201830th Anniversary© Copyright 2018 NCCI Holdings, Inc. All Rights Reserved.
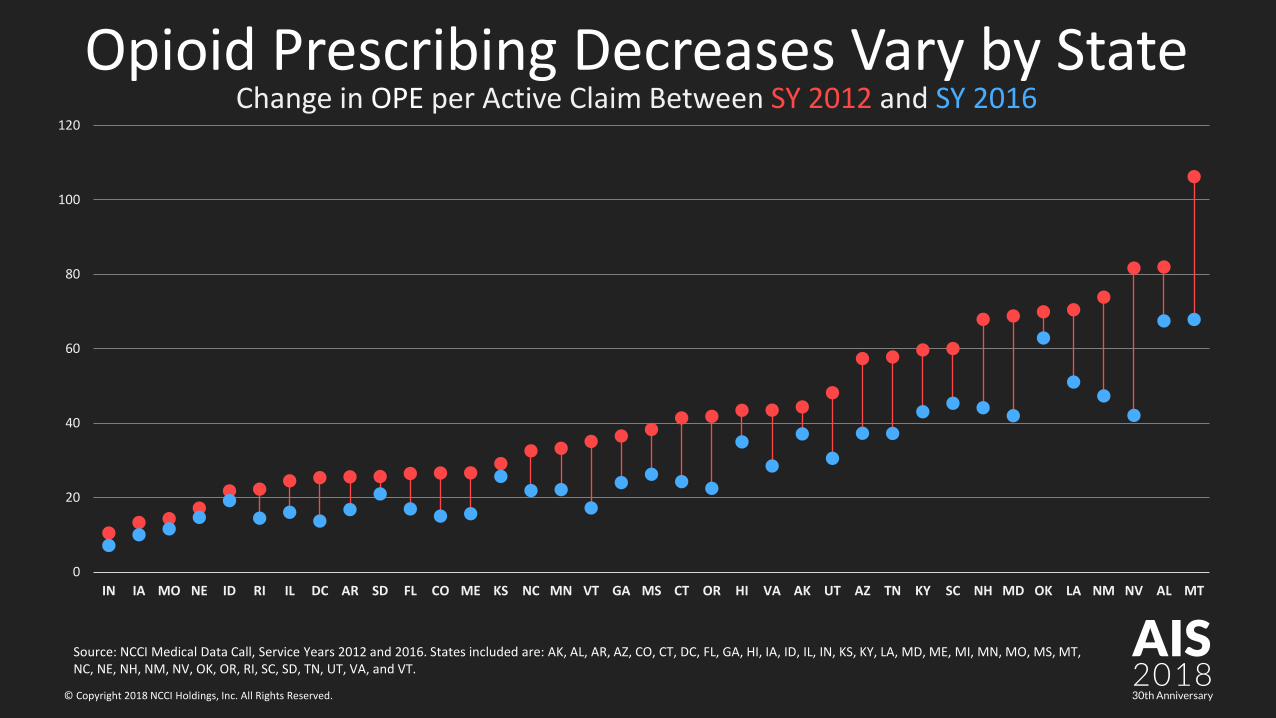
Opioid Prescribing Decreases Vary by StateChange in OPE per Active Claim Between SY 2012 and SY 2016
0
20
40
60
80
100
120
IN IA MO NE ID RI IL DC AR SD FL CO ME KS NC MN VT GA MS CT OR HI VA AK UT AZ TN KY SC NH MD OK LA NM NV AL MT
Source: NCCI Medical Data Call, Service Years 2012 and 2016. States included are: AK, AL, AR, AZ, CO, CT, DC, FL, GA, HI, IA, ID, IL, IN, KS, KY, LA, MD, ME, MI, MN, MO, MS, MT, NC, NE, NH, NM, NV, OK, OR, RI, SC, SD, TN, UT, VA, and VT.
AIS201830th Anniversary© Copyright 2018 NCCI Holdings, Inc. All Rights Reserved.
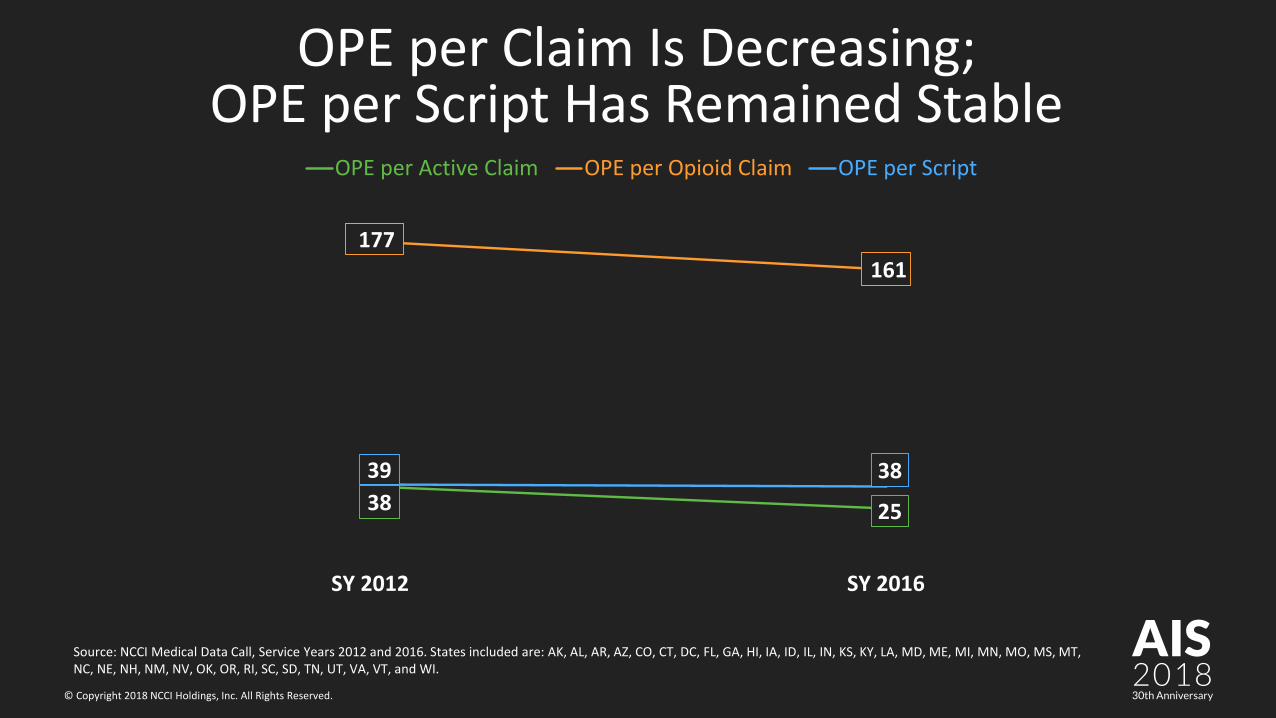
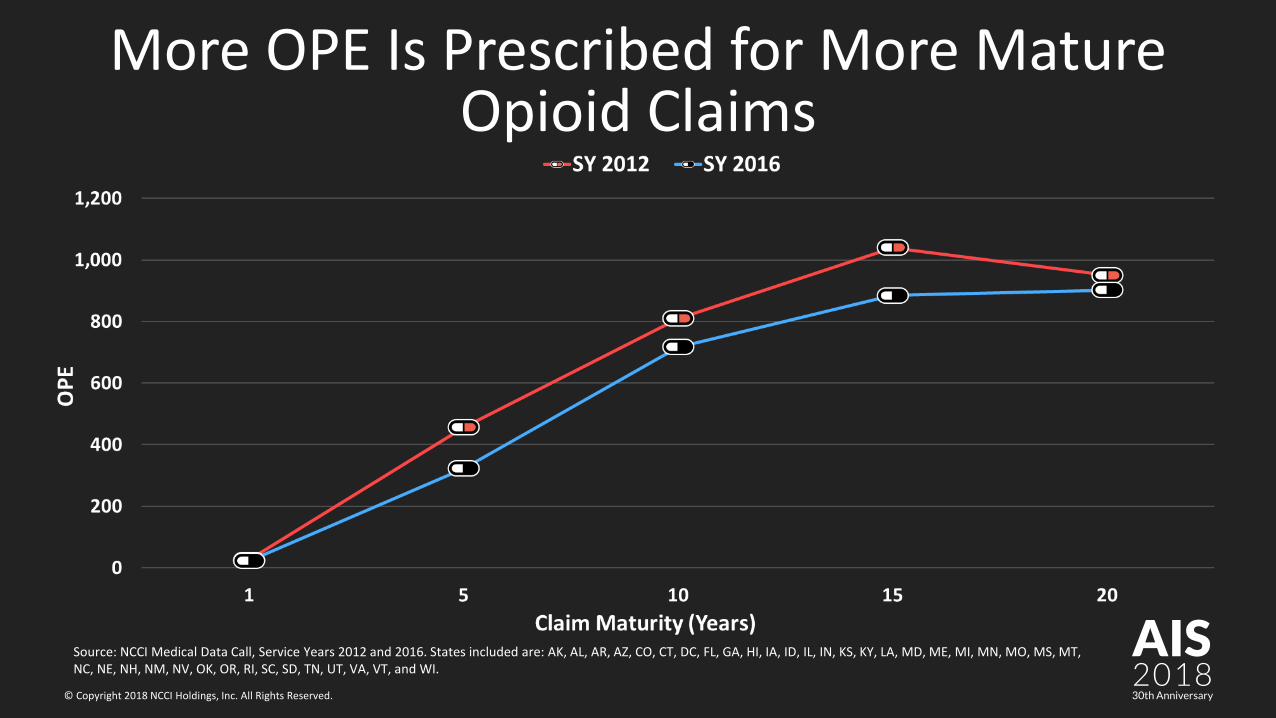
OPE per Claim Is Decreasing;OPE per Script Has Remained Stable
38 25
177 161
39 38
SY 2012 SY 2016
OPE per Active Claim OPE per Opioid Claim OPE per Script
Source: NCCI Medical Data Call, Service Years 2012 and 2016. States included are: AK, AL, AR, AZ, CO, CT, DC, FL, GA, HI, IA, ID, IL, IN, KS, KY, LA, MD, ME, MI, MN, MO, MS, MT, NC, NE, NH, NM, NV, OK, OR, RI, SC, SD, TN, UT, VA, VT, and WI.
AIS201830th Anniversary© Copyright 2018 NCCI Holdings, Inc. All Rights Reserved.
More OPE Is Prescribed for More Mature Opioid Claims
Source: NCCI Medical Data Call, Service Years 2012 and 2016. States included are: AK, AL, AR, AZ, CO, CT, DC, FL, GA, HI, IA, ID, IL, IN, KS, KY, LA, MD, ME, MI, MN, MO, MS, MT, NC, NE, NH, NM, NV, OK, OR, RI, SC, SD, TN, UT, VA, VT, and WI.
AIS201830th Anniversary© Copyright 2018 NCCI Holdings, Inc. All Rights Reserved.
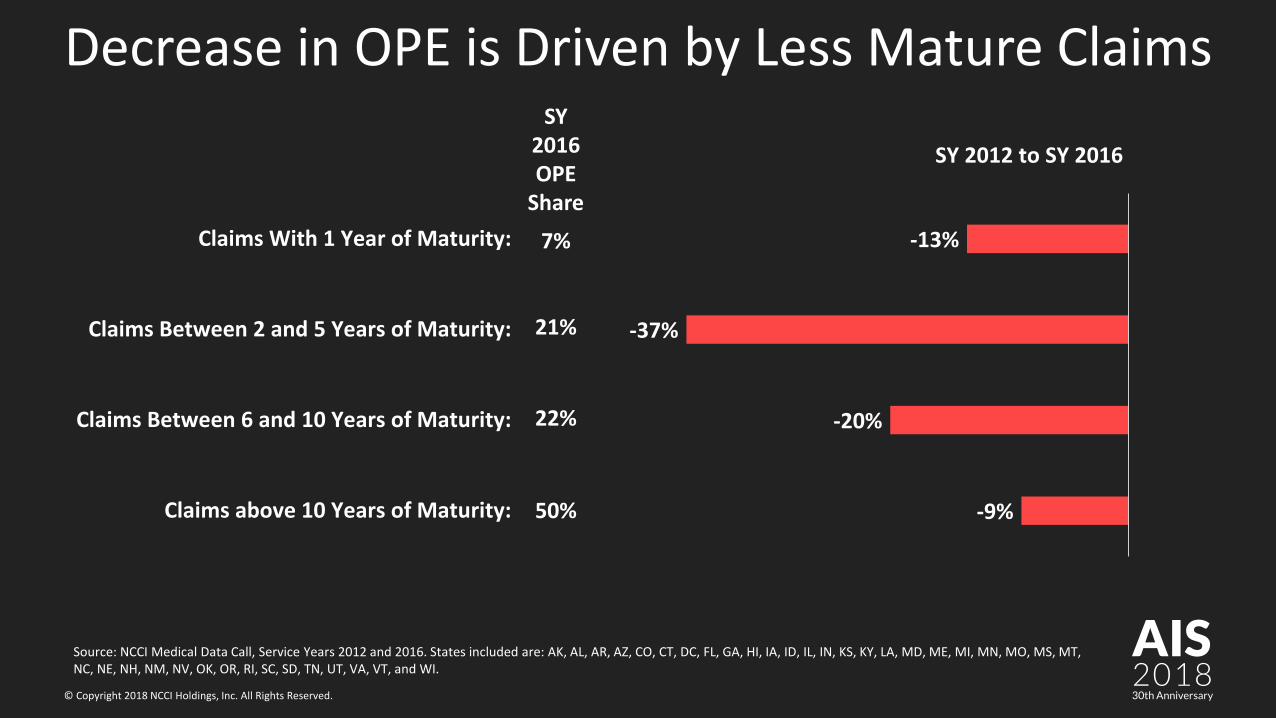
-9%
-20%
-37%
-13%
Claims above 10 Years of Maturity:
Claims Between 6 and 10 Years of Maturity:
Claims Between 2 and 5 Years of Maturity:
Claims With 1 Year of Maturity:
SY 2012 to SY 2016
Decrease in OPE is Driven by Less Mature ClaimsSY
2016 OPE
Share
7%
21%
22%
50%
Source: NCCI Medical Data Call, Service Years 2012 and 2016. States included are: AK, AL, AR, AZ, CO, CT, DC, FL, GA, HI, IA, ID, IL, IN, KS, KY, LA, MD, ME, MI, MN, MO, MS, MT, NC, NE, NH, NM, NV, OK, OR, RI, SC, SD, TN, UT, VA, VT, and WI.
AIS201830th Anniversary© Copyright 2018 NCCI Holdings, Inc. All Rights Reserved.
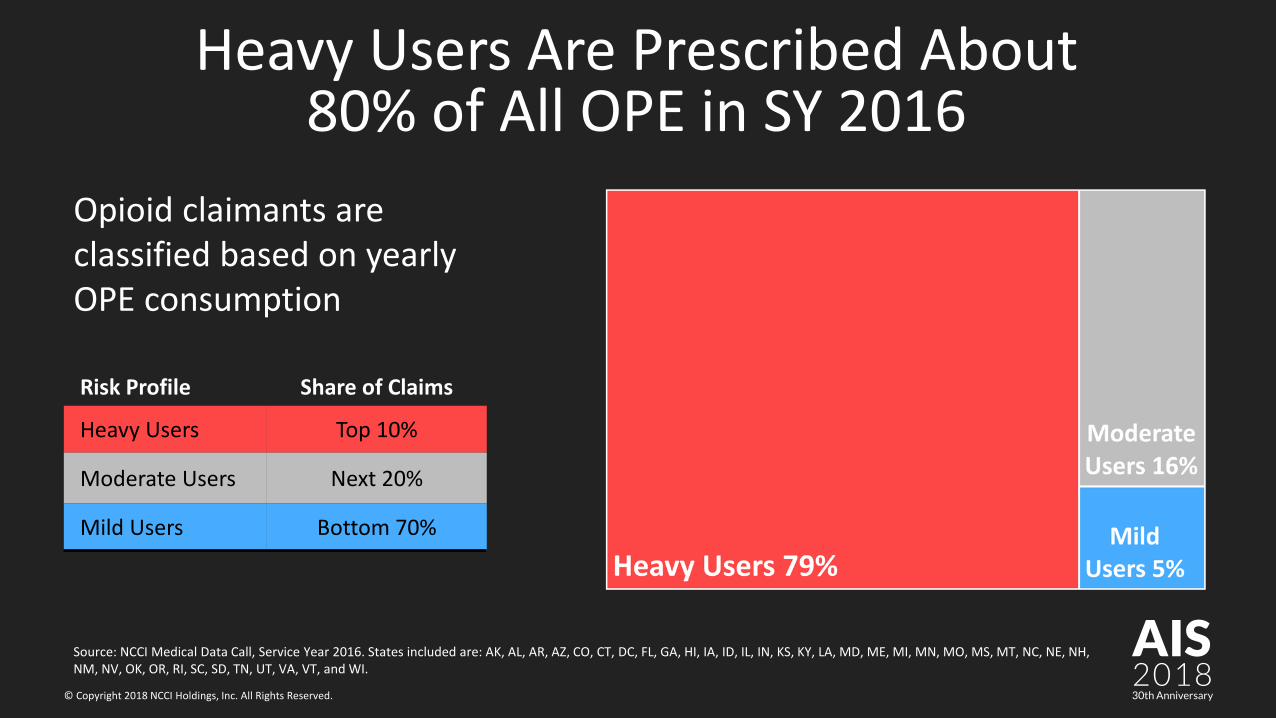
Opioid claimants are classified based on yearly OPE consumption
Heavy Users Are Prescribed About 80% of All OPE in SY 2016
Risk Profile Share of Claims
Heavy Users Top 10%
Moderate Users Next 20%
Mild Users Bottom 70%
Source: NCCI Medical Data Call, Service Year 2016. States included are: AK, AL, AR, AZ, CO, CT, DC, FL, GA, HI, IA, ID, IL, IN, KS, KY, LA, MD, ME, MI, MN, MO, MS, MT, NC, NE, NH, NM, NV, OK, OR, RI, SC, SD, TN, UT, VA, VT, and WI.
AIS201830th Anniversary© Copyright 2018 NCCI Holdings, Inc. All Rights Reserved.
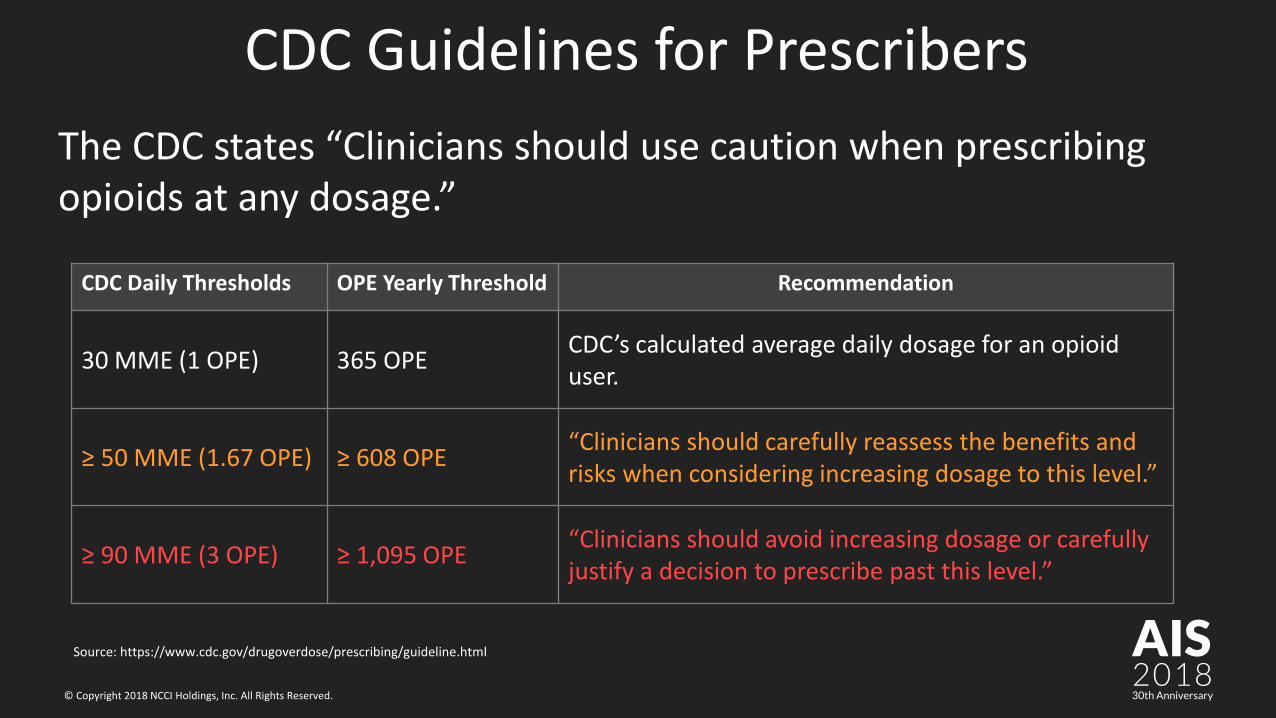
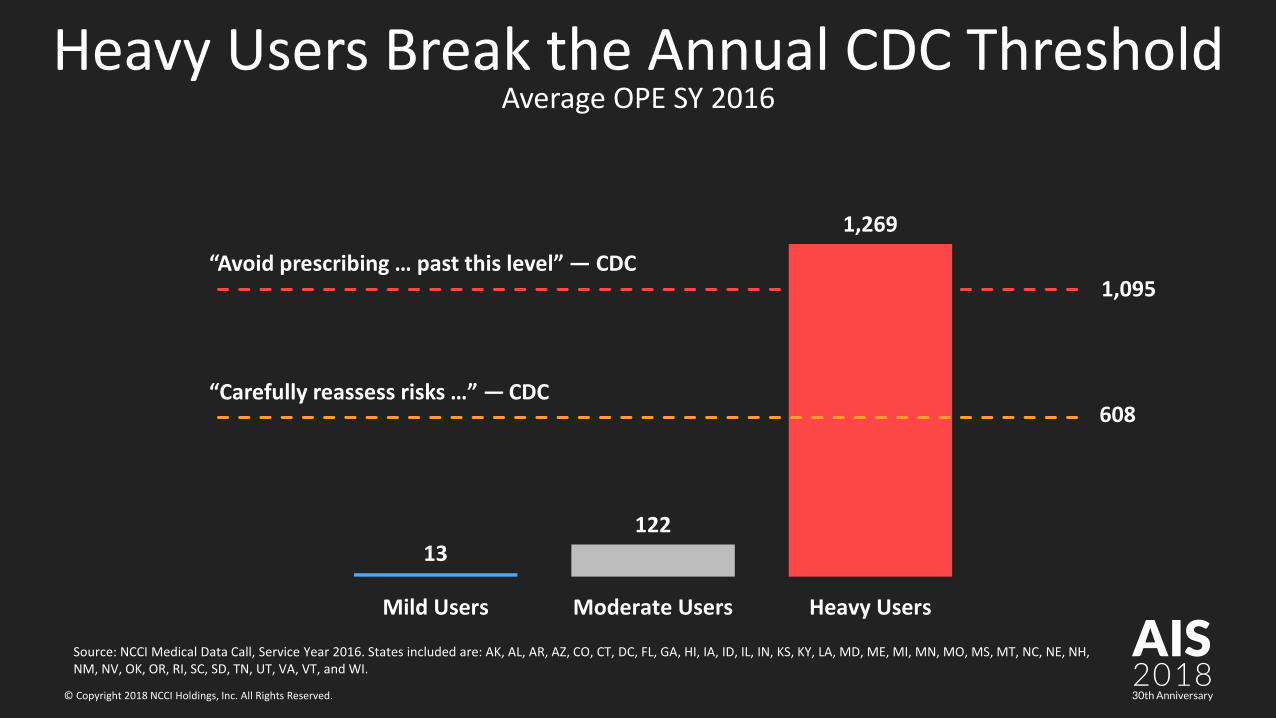
The CDC states “Clinicians should use caution when prescribing opioids at any dosage.”
CDC Guidelines for Prescribers
CDC Daily Thresholds OPE Yearly Threshold Recommendation
30 MME (1 OPE) 365 OPE CDC’s calculated average daily dosage for an opioid user.
≥ 50 MME (1.67 OPE) ≥ 608 OPE “Clinicians should carefully reassess the benefits and risks when considering increasing dosage to this level.”
≥ 90 MME (3 OPE) ≥ 1,095 OPE “Clinicians should avoid increasing dosage or carefully justify a decision to prescribe past this level.”
Source: https://www.cdc.gov/drugoverdose/prescribing/guideline.html
AIS201830th Anniversary© Copyright 2018 NCCI Holdings, Inc. All Rights Reserved.
Heavy Users Break the Annual CDC ThresholdAverage OPE SY 2016
13122
1,269
608
1,095
Mild Users Moderate Users Heavy Users
“Avoid prescribing … past this level” — CDC
“Carefully reassess risks …” — CDC
Source: NCCI Medical Data Call, Service Year 2016. States included are: AK, AL, AR, AZ, CO, CT, DC, FL, GA, HI, IA, ID, IL, IN, KS, KY, LA, MD, ME, MI, MN, MO, MS, MT, NC, NE, NH, NM, NV, OK, OR, RI, SC, SD, TN, UT, VA, VT, and WI.
AIS201830th Anniversary© Copyright 2018 NCCI Holdings, Inc. All Rights Reserved.
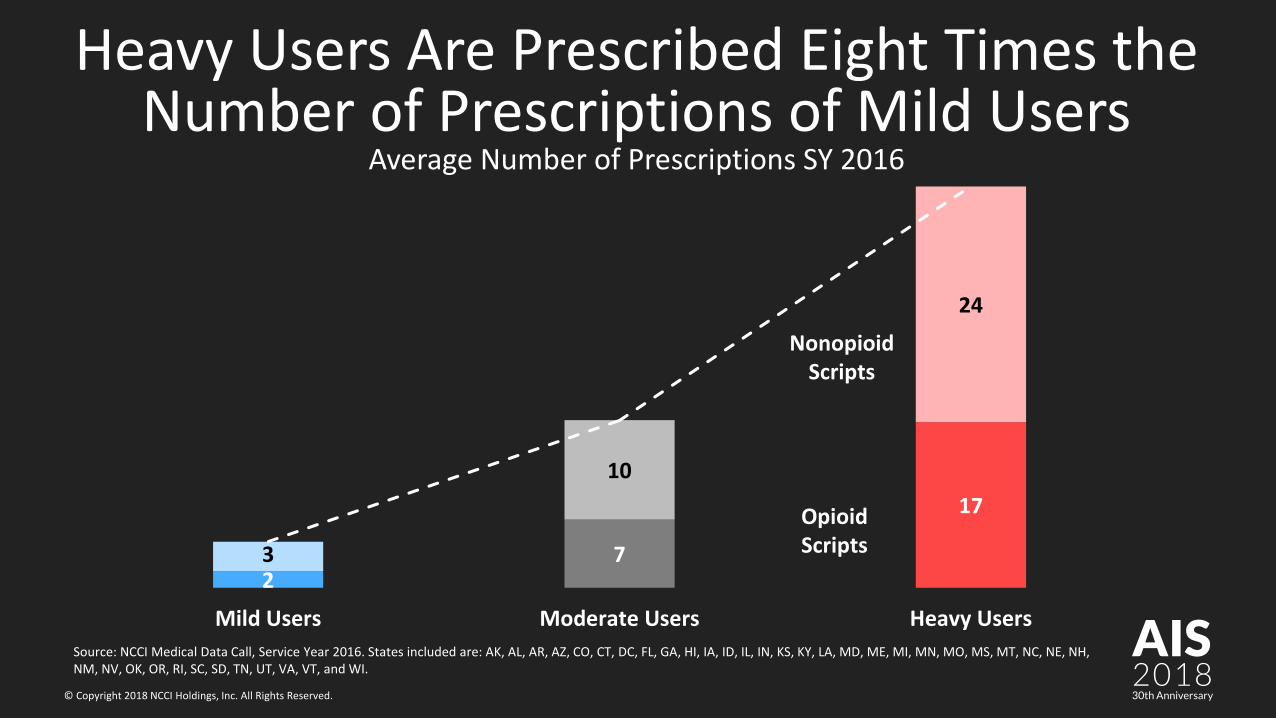
Heavy Users Are Prescribed Eight Times the Number of Prescriptions of Mild Users
Average Number of Prescriptions SY 2016
27
17
3
10
24
Mild Users Moderate Users Heavy Users
Nonopioid Scripts
Opioid Scripts
Source: NCCI Medical Data Call, Service Year 2016. States included are: AK, AL, AR, AZ, CO, CT, DC, FL, GA, HI, IA, ID, IL, IN, KS, KY, LA, MD, ME, MI, MN, MO, MS, MT, NC, NE, NH, NM, NV, OK, OR, RI, SC, SD, TN, UT, VA, VT, and WI.
AIS201830th Anniversary© Copyright 2018 NCCI Holdings, Inc. All Rights Reserved.
Polypharmacy
AIS201830th Anniversary© Copyright 2018 NCCI Holdings, Inc. All Rights Reserved.
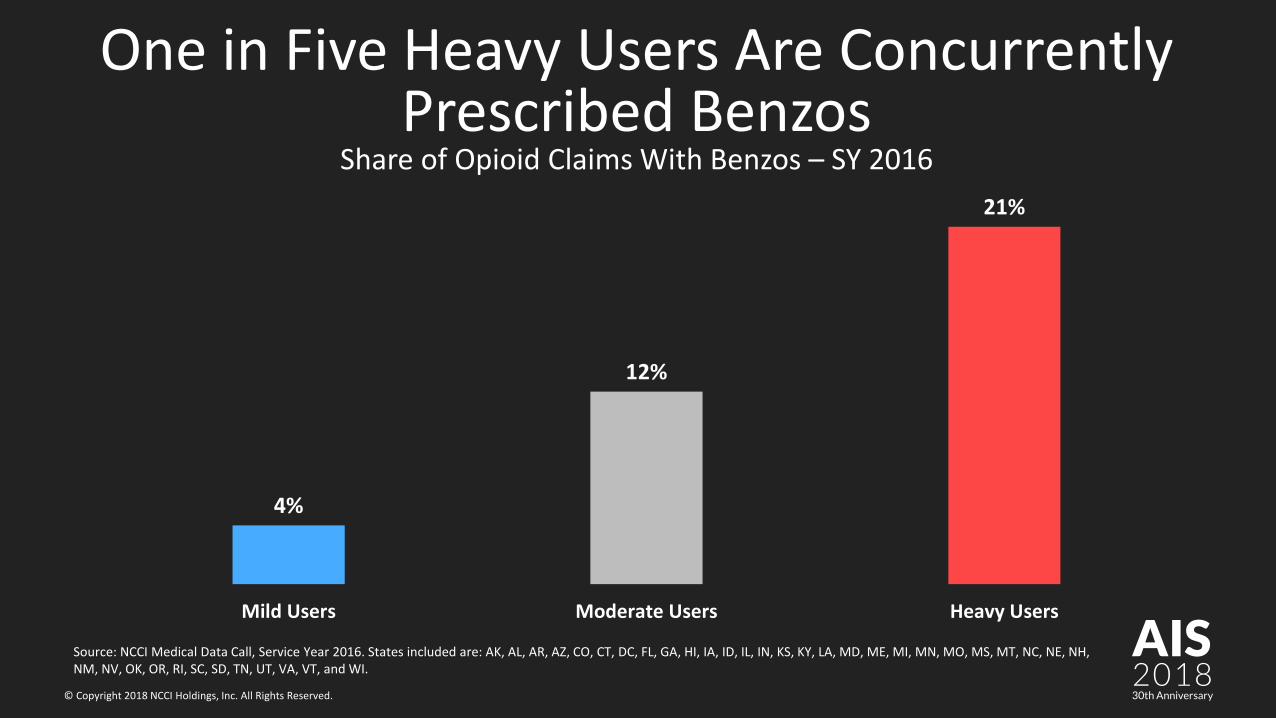
One in Five Heavy Users Are Concurrently Prescribed Benzos
Share of Opioid Claims With Benzos – SY 2016
4%
12%
21%
Mild Users Moderate Users Heavy Users
Source: NCCI Medical Data Call, Service Year 2016. States included are: AK, AL, AR, AZ, CO, CT, DC, FL, GA, HI, IA, ID, IL, IN, KS, KY, LA, MD, ME, MI, MN, MO, MS, MT, NC, NE, NH, NM, NV, OK, OR, RI, SC, SD, TN, UT, VA, VT, and WI.
AIS201830th Anniversary© Copyright 2018 NCCI Holdings, Inc. All Rights Reserved.
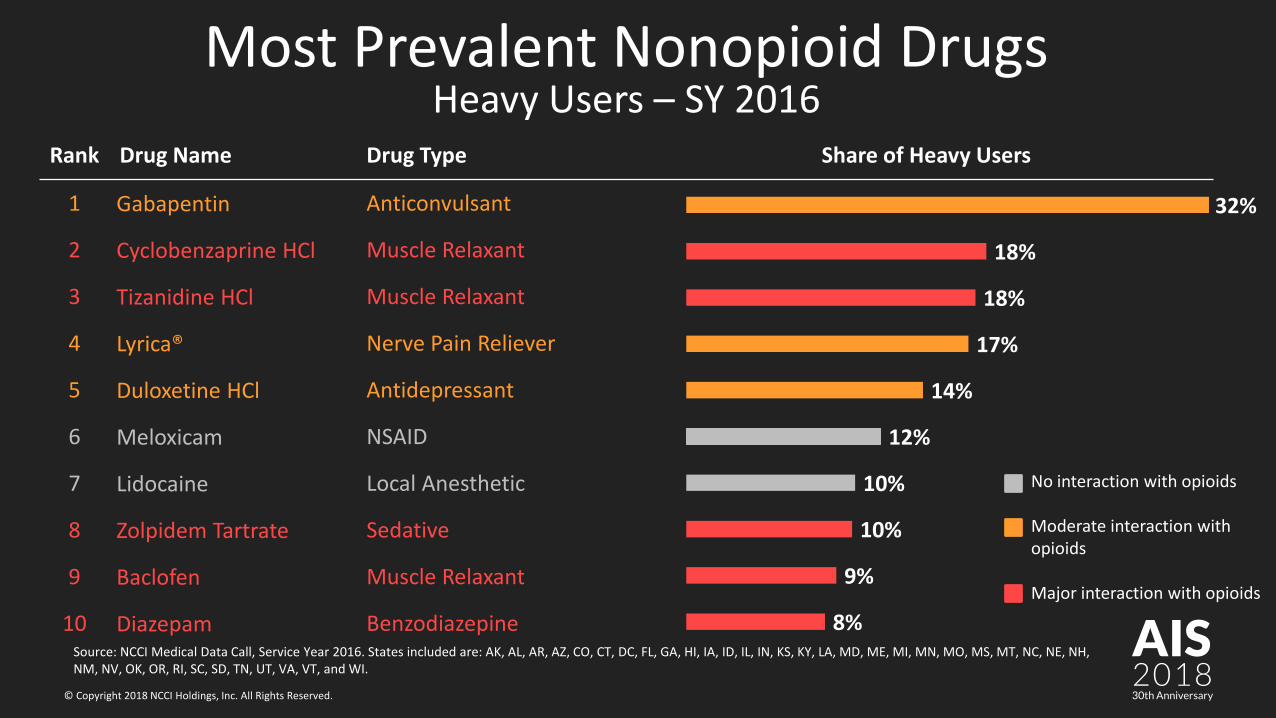
Most Prevalent Nonopioid DrugsHeavy Users – SY 2016
8%
9%
10%
10%
12%
14%
17%
18%
18%
32%
Rank Drug Name Drug Type Share of Heavy Users
1 Gabapentin Anticonvulsant
2 Cyclobenzaprine HCl Muscle Relaxant
3 Tizanidine HCl Muscle Relaxant
4 Lyrica® Nerve Pain Reliever
5 Duloxetine HCl Antidepressant
6 Meloxicam NSAID
7 Lidocaine Local Anesthetic
8 Zolpidem Tartrate Sedative
9 Baclofen Muscle Relaxant
10 Diazepam Benzodiazepine
No interaction with opioids
Moderate interaction with opioids
Major interaction with opioids
Source: NCCI Medical Data Call, Service Year 2016. States included are: AK, AL, AR, AZ, CO, CT, DC, FL, GA, HI, IA, ID, IL, IN, KS, KY, LA, MD, ME, MI, MN, MO, MS, MT, NC, NE, NH, NM, NV, OK, OR, RI, SC, SD, TN, UT, VA, VT, and WI.
AIS201830th Anniversary© Copyright 2018 NCCI Holdings, Inc. All Rights Reserved.
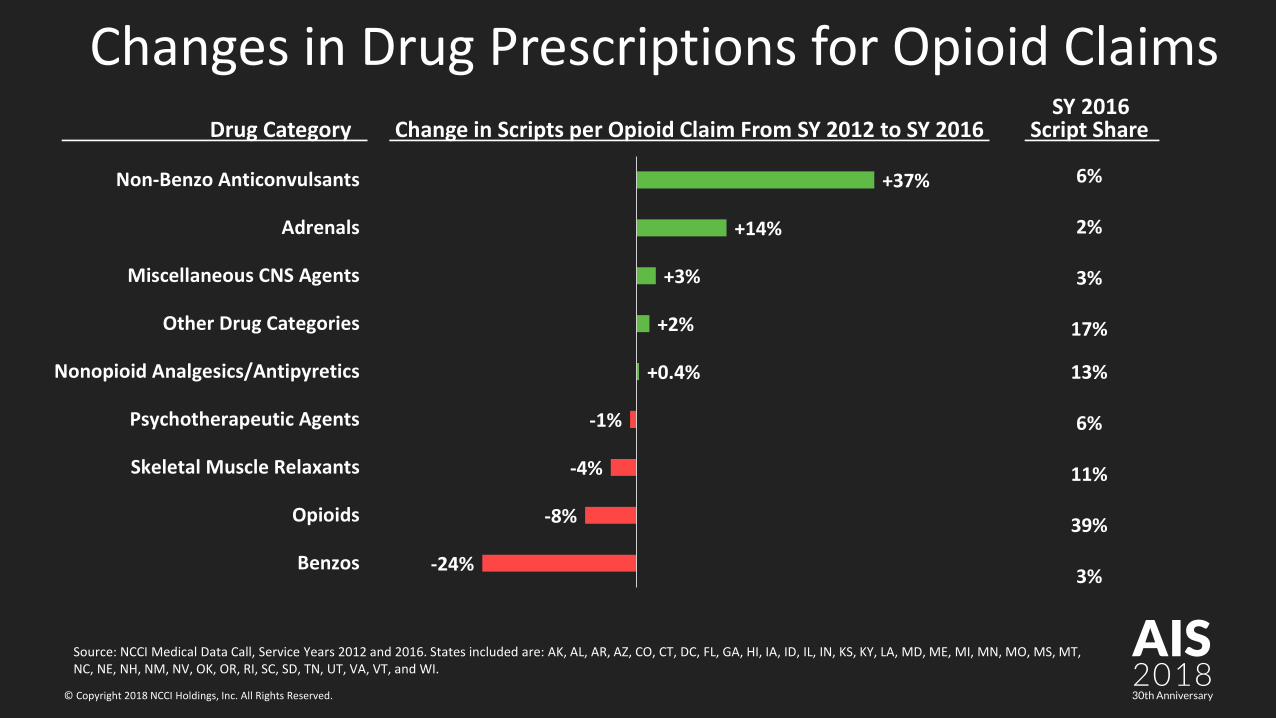
Changes in Drug Prescriptions for Opioid Claims
6%
2%
3%
17%
SY 2016Drug Category Change in Scripts per Opioid Claim From SY 2012 to SY 2016 Script Share
-24%
-8%
-4%
-1%
+0.4%
+2%
+3%
+14%
+37%
Benzos
Opioids
Skeletal Muscle Relaxants
Psychotherapeutic Agents
Nonopioid Analgesics/Antipyretics
Other Drug Categories
Miscellaneous CNS Agents
Adrenals
Non-Benzo Anticonvulsants
13%
6%
11%
39%
3%
Source: NCCI Medical Data Call, Service Years 2012 and 2016. States included are: AK, AL, AR, AZ, CO, CT, DC, FL, GA, HI, IA, ID, IL, IN, KS, KY, LA, MD, ME, MI, MN, MO, MS, MT, NC, NE, NH, NM, NV, OK, OR, RI, SC, SD, TN, UT, VA, VT, and WI.
AIS201830th Anniversary© Copyright 2018 NCCI Holdings, Inc. All Rights Reserved.
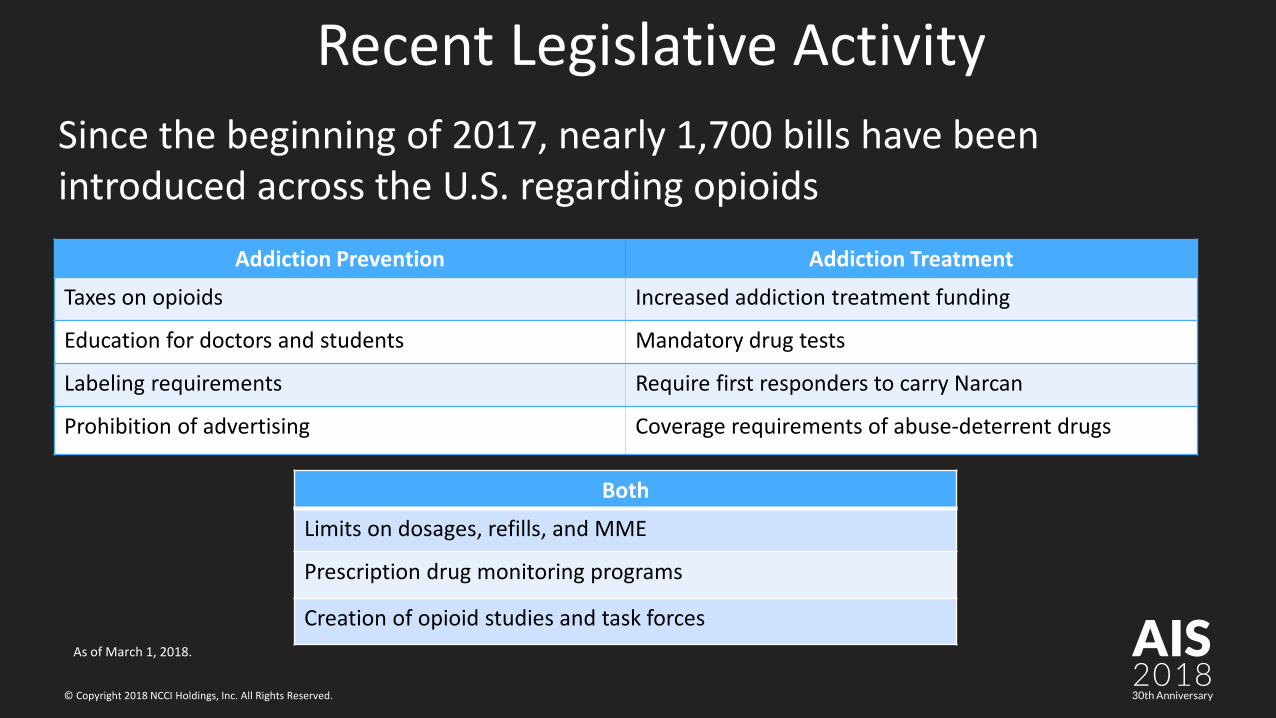
Since the beginning of 2017, nearly 1,700 bills have been introduced across the U.S. regarding opioids
Recent Legislative Activity
Both
Limits on dosages, refills, and MME
Prescription drug monitoring programs
Creation of opioid studies and task forces
Addiction Prevention Addiction Treatment
Taxes on opioids Increased addiction treatment funding
Education for doctors and students Mandatory drug tests
Labeling requirements Require first responders to carry Narcan
Prohibition of advertising Coverage requirements of abuse-deterrent drugs
As of March 1, 2018.
AIS201830th Anniversary© Copyright 2018 NCCI Holdings, Inc. All Rights Reserved.
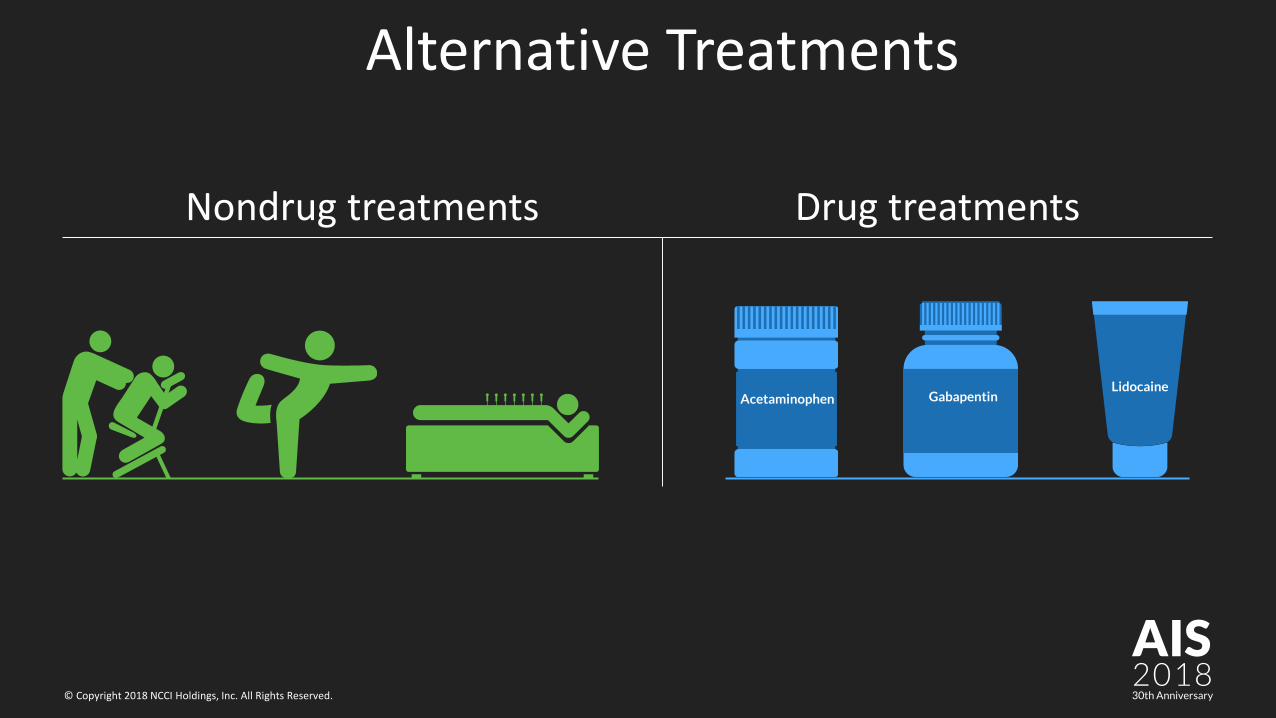
Alternative Treatments
Nondrug treatments Drug treatments
GabapentinLidocaine
Acetaminophen