Embed Size (px)
Citation preview
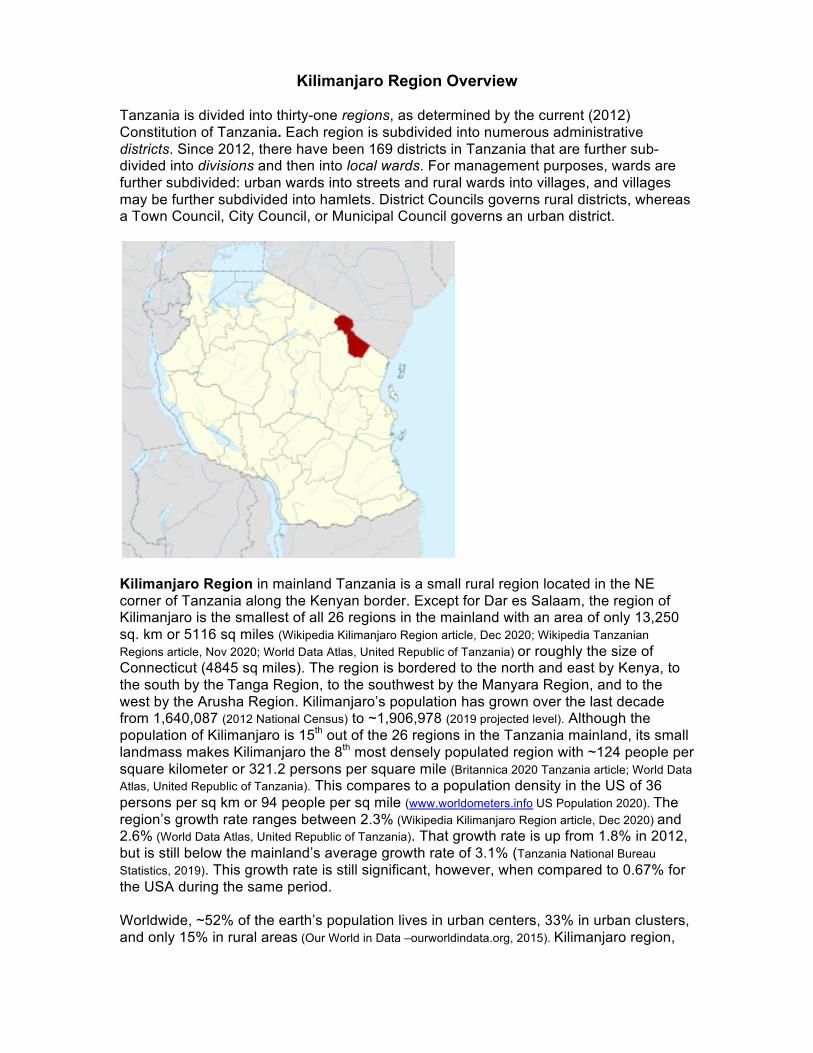
Kilimanjaro Region Overview Tanzania is divided into thirty-one regions, as determined by the current (2012) Constitution of Tanzania. Each region is subdivided into numerous administrative districts. Since 2012, there have been 169 districts in Tanzania that are further sub-divided into divisions and then into local wards. For management purposes, wards are further subdivided: urban wards into streets and rural wards into villages, and villages may be further subdivided into hamlets. District Councils governs rural districts, whereas a Town Council, City Council, or Municipal Council governs an urban district.
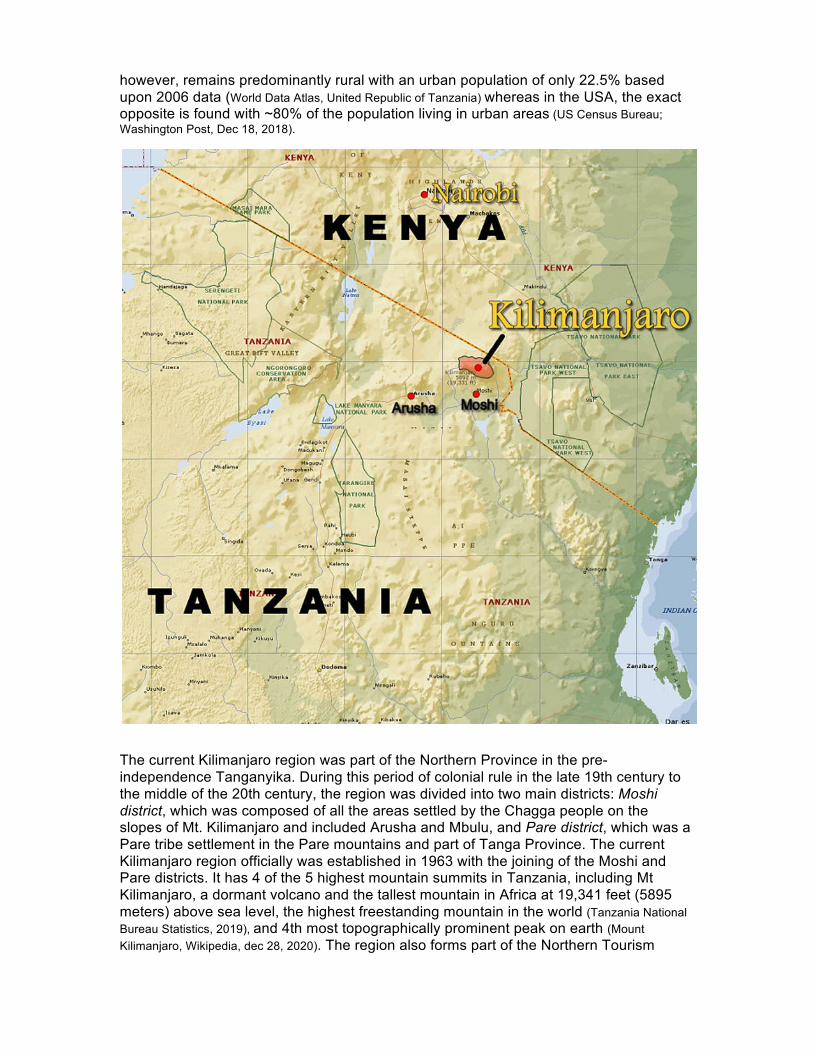
Kilimanjaro Region in mainland Tanzania is a small rural region located in the NE corner of Tanzania along the Kenyan border. Except for Dar es Salaam, the region of Kilimanjaro is the smallest of all 26 regions in the mainland with an area of only 13,250 sq. km or 5116 sq miles (Wikipedia Kilimanjaro Region article, Dec 2020; Wikipedia Tanzanian Regions article, Nov 2020; World Data Atlas, United Republic of Tanzania) or roughly the size of Connecticut (4845 sq miles). The region is bordered to the north and east by Kenya, to the south by theTanga Region, to the southwest by the Manyara Region, and to the west by the Arusha Region. Kilimanjaro’s population has grown over the last decade from 1,640,087 (2012 National Census) to ~1,906,978 (2019 projected level). Although the population of Kilimanjaro is 15th out of the 26 regions in the Tanzania mainland, its small landmass makes Kilimanjaro the 8th most densely populated region with ~124 people per square kilometer or 321.2 persons per square mile (Britannica 2020 Tanzania article; World Data Atlas, United Republic of Tanzania). This compares to a population density in the US of 36 persons per sq km or 94 people per sq mile (www.worldometers.info US Population 2020). The region’s growth rate ranges between 2.3% (Wikipedia Kilimanjaro Region article, Dec 2020) and 2.6% (World Data Atlas, United Republic of Tanzania). That growth rate is up from 1.8% in 2012, but is still below the mainland’s average growth rate of 3.1% (Tanzania National Bureau Statistics, 2019). This growth rate is still significant, however, when compared to 0.67% for the USA during the same period. Worldwide, ~52% of the earth’s population lives in urban centers, 33% in urban clusters, and only 15% in rural areas (Our World in Data –ourworldindata.org, 2015). Kilimanjaro region,
however, remains predominantly rural with an urban population of only 22.5% based upon 2006 data (World Data Atlas, United Republic of Tanzania) whereas in the USA, the exact opposite is found with ~80% of the population living in urban areas (US Census Bureau; Washington Post, Dec 18, 2018).
The current Kilimanjaro region was part of the Northern Province in the pre-independence Tanganyika. During this period of colonial rule in the late 19th century to the middle of the 20th century, the region was divided into two main districts: Moshi district, which was composed of all the areas settled by the Chagga people on the slopes of Mt. Kilimanjaro and included Arusha and Mbulu, and Pare district, which was a Pare tribe settlement in the Pare mountains and part of Tanga Province. The current Kilimanjaro region officially was established in 1963 with the joining of the Moshi and Pare districts. It has 4 of the 5 highest mountain summits in Tanzania, including Mt Kilimanjaro, a dormant volcano and the tallest mountain in Africa at 19,341 feet (5895 meters) above sea level, the highest freestanding mountain in the world (Tanzania National Bureau Statistics, 2019), and 4th most topographically prominent peak on earth (Mount Kilimanjaro, Wikipedia, dec 28, 2020). The region also forms part of the Northern Tourism
Circuit in Tanzania and is home to the Kilimanjaro National Park, the Mkomazi National Park, the Pare Mountains, Lake Jape, Lake Chala, tropical forests and waterfalls (Marangu Waterfall). In addition, the region is rich in wildlife. Because of its unique geography, Kilimanjaro Region has variations in climate based on elevation, prevailing winds, and rainfall. The major climate in this region is considered Sub-Tropical Dry using Koeppen’s Climate Classification and, as with most of mainland Tanzania, the average daily and monthly temperatures in this part of the region varies little due to its proximity to the equator and the Indian Ocean (Geo 121 Wiki: Fall 2011: Mount Kilimanjaro, Tanzania). Over the last 5 years, maximum temperatures ranged from 84.9-86.7’F (29.4-30.4’C), although they can go into the low 90’s F during December and January; minimums ranged from 63.7-68.5’F (17.6-20.3’C) with some drops to 60’F (Tanzania NBS, 2019). Humidity is the highest in March through June at ~77% during the major rainy season and lowest in the summer months (October through February) at ~57% (Geo 121 Wiki: Fall 2011: Mount Kilimanjaro, Tanzania).
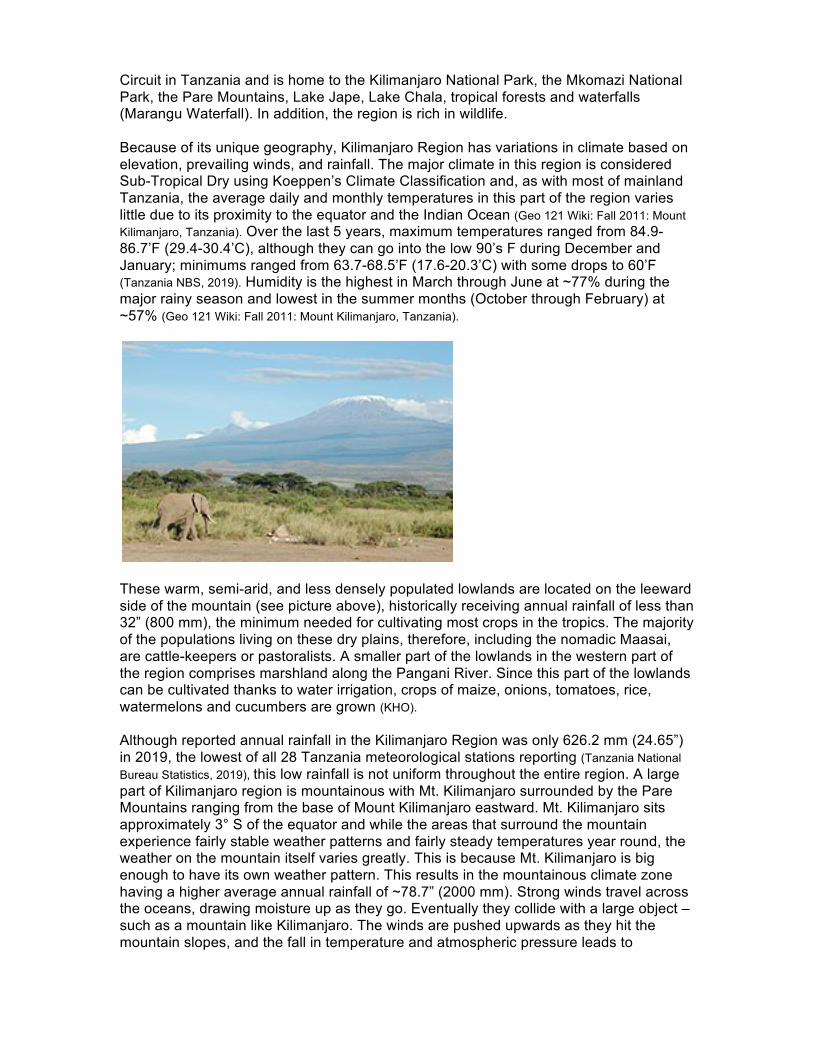
These warm, semi-arid, and less densely populated lowlands are located on the leeward side of the mountain (see picture above), historically receiving annual rainfall of less than 32” (800 mm), the minimum needed for cultivating most crops in the tropics. The majority of the populations living on these dry plains, therefore, including the nomadic Maasai, are cattle-keepers or pastoralists. A smaller part of the lowlands in the western part of the region comprises marshland along the Pangani River. Since this part of the lowlands can be cultivated thanks to water irrigation, crops of maize, onions, tomatoes, rice, watermelons and cucumbers are grown (KHO). Although reported annual rainfall in the Kilimanjaro Region was only 626.2 mm (24.65”) in 2019, the lowest of all 28 Tanzania meteorological stations reporting (Tanzania National Bureau Statistics, 2019), this low rainfall is not uniform throughout the entire region. A large part of Kilimanjaro region is mountainous with Mt. Kilimanjaro surrounded by the Pare Mountains ranging from the base of Mount Kilimanjaro eastward. Mt. Kilimanjaro sits approximately 3° S of the equator and while the areas that surround the mountain experience fairly stable weather patterns and fairly steady temperatures year round, the weather on the mountain itself varies greatly. This is because Mt. Kilimanjaro is big enough to have its own weather pattern. This results in the mountainous climate zone having a higher average annual rainfall of ~78.7” (2000 mm). Strong winds travel across the oceans, drawing moisture up as they go. Eventually they collide with a large object – such as a mountain like Kilimanjaro. The winds are pushed upwards as they hit the mountain slopes, and the fall in temperature and atmospheric pressure leads to
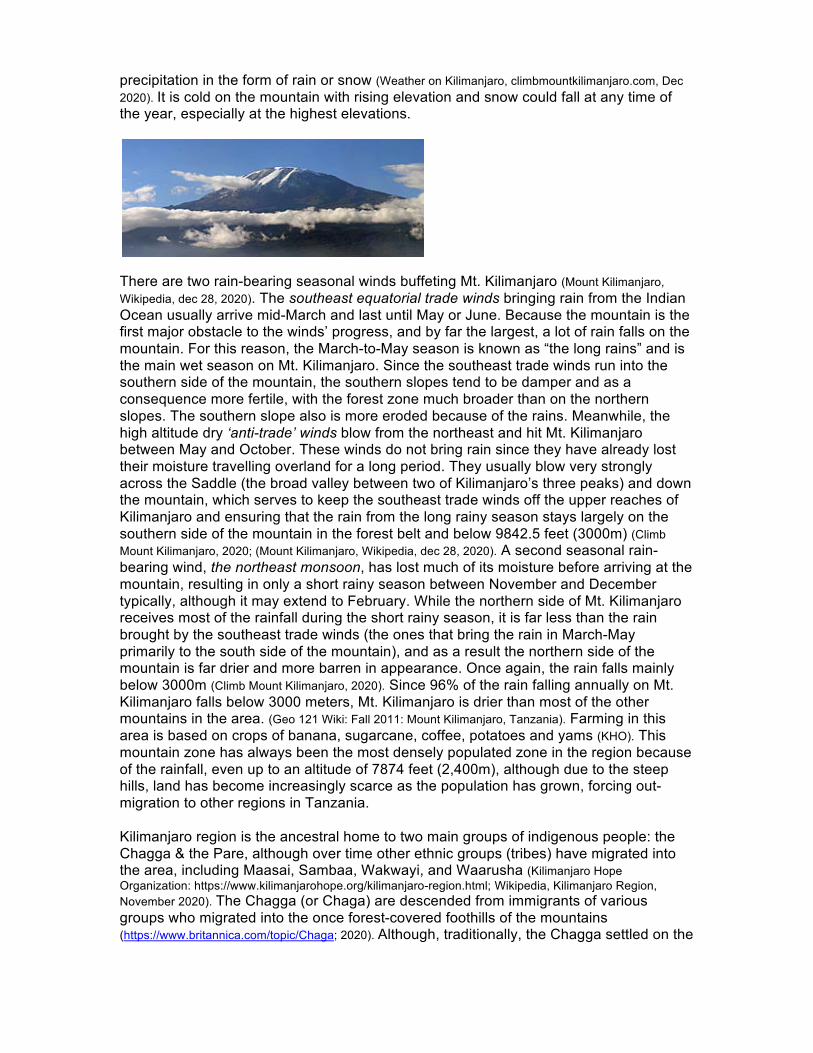
precipitation in the form of rain or snow (Weather on Kilimanjaro, climbmountkilimanjaro.com, Dec 2020).It is cold on the mountain with rising elevation and snow could fall at any time of the year, especially at the highest elevations.
There are two rain-bearing seasonal winds buffeting Mt. Kilimanjaro (Mount Kilimanjaro, Wikipedia, dec 28, 2020). The southeast equatorial trade winds bringing rain from the Indian Ocean usually arrive mid-March and last until May or June. Because the mountain is the first major obstacle to the winds’ progress, and by far the largest, a lot of rain falls on the mountain. For this reason, the March-to-May season is known as “the long rains” and is the main wet season on Mt. Kilimanjaro. Since the southeast trade winds run into the southern side of the mountain, the southern slopes tend to be damper and as a consequence more fertile, with the forest zone much broader than on the northern slopes. The southern slope also is more eroded because of the rains. Meanwhile, the high altitude dry ‘anti-trade’ winds blow from the northeast and hit Mt. Kilimanjaro between May and October. These winds do not bring rain since they have already lost their moisture travelling overland for a long period. They usually blow very strongly across the Saddle (the broad valley between two of Kilimanjaro’s three peaks) and down the mountain, which serves to keep the southeast trade winds off the upper reaches of Kilimanjaro and ensuring that the rain from the long rainy season stays largely on the southern side of the mountain in the forest belt and below 9842.5 feet (3000m) (Climb Mount Kilimanjaro, 2020; (Mount Kilimanjaro, Wikipedia, dec 28, 2020). A second seasonal rain-bearing wind, the northeast monsoon, has lost much of its moisture before arriving at the mountain, resulting in only a short rainy season between November and December typically, although it may extend to February. While the northern side of Mt. Kilimanjaro receives most of the rainfall during the short rainy season, it is far less than the rain brought by the southeast trade winds (the ones that bring the rain in March-May primarily to the south side of the mountain), and as a result the northern side of the mountain is far drier and more barren in appearance. Once again, the rain falls mainly below 3000m (Climb Mount Kilimanjaro, 2020). Since 96% of the rain falling annually on Mt. Kilimanjaro falls below 3000 meters, Mt. Kilimanjaro is drier than most of the other mountains in the area. (Geo 121 Wiki: Fall 2011: Mount Kilimanjaro, Tanzania). Farming in this area is based on crops of banana, sugarcane, coffee, potatoes and yams (KHO). This mountain zone has always been the most densely populated zone in the region because of the rainfall, even up to an altitude of 7874 feet (2,400m), although due to the steep hills, land has become increasingly scarce as the population has grown, forcing out-migration to other regions in Tanzania. Kilimanjaro region is the ancestral home to two main groups of indigenous people: the Chagga & the Pare, although over time other ethnic groups (tribes) have migrated into the area, including Maasai, Sambaa, Wakwayi, and Waarusha (Kilimanjaro Hope Organization: https://www.kilimanjarohope.org/kilimanjaro-region.html; Wikipedia, Kilimanjaro Region, November 2020). The Chagga (or Chaga) are descended from immigrants of various groups who migrated into the once forest-covered foothills of the mountains (https://www.britannica.com/topic/Chaga; 2020). Although, traditionally, the Chagga settled on the
slopes of Mount Kilimanjaro and its neighboring areas in Hai, Moshi (Urban & Rural), Rombo and Shia, they are present throughout the entire Kilimanjaro region now. The Chagga are known for their trading and overall enterprise. Historically they often travelled to neighboring or far lands in search of business or to establish one, leading to their spread nationwide and making them the third largest ethnic group in Tanzania. Their businesses have made them one of the wealthiest and most highly organized of all the Tanzanian tribes. Their fertile lands on the southern slopes of Mt. Kilimanjaro and their cultivation methods have enabled a very dense population. They practice intensive irrigated agriculture on terraced fields and keep the fields under permanent cultivation through the use of animal manure as fertilizer. Millet and plantains are staple crops while coffee is the primary cash crop (Britannica, Tanzania/Chaga People, Elizabeth Prine Pauls, editor 2020). The Pare (pronounced "Pahray") are members of an ethnic group indigenous to the Pare Mountains (Zoom Tanzania, Feb 2017). Pareland lies on one of the northern routes for historic east-African long-distance trade, connecting the hinterland with the Indian Ocean coast. Within Kilimanjaro region, Mwanga and Same districts are historically Pare territory. Residents of this northern Pare territory recognise two sub-areas based on ethnolinguistic differences: Pare North and Pare South. The area known as South Pare is now modern day Same District. Pare were the main producers of iron for which there was considerable demand by the Chagga and other adjacent populations. Notable Pare blacksmiths include the Shana clan (Shana, meaning blacksmith), who have maintained the tradition to this present day. The area's chief produce is tea, coffee, sisal, and cinchona, an evergreen whose bark is used as a source of quinine and other medicinal alkaloids. Rice (paddy) is grown in the swampy plains along rivers. The Pare are highly organized in terms of compulsory community work (msaragambo). In fact, the Parelands are quite prosperous by Tanzanian standards as its infrastructure of roads, electricity, telephones, and piped water supply attests. An older infrastructure of irrigation furrows, stone-lined terraces exists alongside these newer technologies and shows that the Pare landscape has been carefully managed for centuries. Currently, the Pare people are thought to number between ~735,000 (Pare People FB, May 2018) or ~950,000; approximately 56% practice Islam and 40% are Christian (Joshua Project 2020). The Maasai are a nomadic warrior Nilotic ethnic group inhabiting northern, central and southern Kenya and northern Tanzania. According to their oral history, the Maasai originated in northwest Kenya and began migrating into Tanzania in the 15th century, either forcibly displacing other ethnic groups or assimilating them. By the mid-19th century, their territory covered almost all of the Great Rift Valley as far south as Dodoma and as far east as the Tanga coast (including the current Kilimanjaro region). In the late 19th century, the Maasai were plagued by epidemics of animal disease, including smallpox, and by severe drought and starvation, leading to the death of ~2/3rds of their population. Several British journalists and writers writing around the turn of the century helped influence ecologists and policy makers of that era, claiming that the remaining Maasai pastoralists were causing harm to savannah rangelands, a theory used to justify future governmental policies against the Maasai. In the early 1900’s, Maasai lands in Kenya were reduced by >60% as the British evicted them to make room for settler ranches. The Maasai in Tanganyika (modern day mainland Tanzania) were displaced from their fertile lands between Mount Meru and Mount Kilimanjaro and most of the fertile highlands near Ngorongoro. Although anthropologists later disproved the concept of Maasai cattle-raising practices as damaging to the land, this notion has remained deeply ingrained in the minds of
government officials since that time, even after independence. British colonial policy makers in 1951 used the false claim to remove all Maasai from the Serengeti National Park and relegate them to areas in and around the Ngorongoro Conservation Area. Supposedly, the government plan for the Ngorongoro Conservation Area was to put Maasai interests above all else, but this promise was never met. Over time, more and more of the Maasai lands have been taken to create the wildlife reserves and national parks or given to farmers and settlers and the Maasai have been pushed into more rural and less fertile lands, including into rural parts of Kilimanjaro region. At the same time, the Tanzanian and Kenyan governments have instituted programs to encourage the Maasai to abandon their traditional semi-nomadic lifestyle (Maasai People, Wikipedia, Dec 2020). Displaced WaArusha and WaMeru women who were married to Maasai men first introduced cultivation to the Maasai. By the second half of the 20th century, many Maasai began to cultivate maize and other crops to get by, but it remained a practice that was culturally viewed negatively. Then, in 1975, the Ngorongoro Conservation Area banned cultivation. In order to survive, the Maasai are forced to participate in Tanzania's monetary economy by selling their animals and traditional medicines to buy food. Traditional Maasai life centers on their cattle, which constitute their primary source of food (Maasai People, Wikipedia, Dec 2020). They eat the meat, drink the milk daily, and occasionally even drink the blood. Bulls, goats, and lambs are slaughtered only for meat on special occasions and ceremonies. “The measure of a man's wealth is in terms of cattle and children: a herd of 50 cattle is respectable, and the more children the better. A man who has plenty of one but not the other is considered to be poor” (Maasai People, Wikipedia, Dec 2020). Though the Maasai's entire way of life historically depended on their cattle, the Maasai became dependent on foods such as sorghum, rice, potatoes and cabbage (known to the Maasai as goat leaves). Although the ban on cultivation was lifted in 1992 and cultivation again became an important part of Maasai livelihood, the Maasai remain pastoralist and have strongly resisted governmental pressure to change (Wikipedia, Maasai people, Nov 2020). The Maasai’s traditional pastoral lifestyle has become increasingly difficult to maintain due to outside influences of the modern world, including the rampant spread of HIV in their villages during the latter part of the 20th century and early 21st century as roads have been built in more rural areas of the country. Government policies, new park boundaries, land privatization, and the incursion of settlements and farms by other tribes have continued to limit of lack of available rangelands for their cattle. Compounding the problem has been the increase in Maasai population and a loss of cattle populations due to disease and drought. To survive, the Maasai have been forced to develop new ways of sustaining themselves (Maasai People, Wikipedia, Dec 2020). Many NGO and governmental projects have begun to help Maasai tribal leaders find ways to preserve their traditions while also balancing the education needs of their children for the modern world. Emerging forms of employment among the Maasai people include: farming, business (selling traditional medicines, running restaurants and shops, buying and selling of minerals, selling milk and milk products, making and selling embroideries and bead jewelry), and wage employment (working as security guards/ watchmen, waiters, tourist guides) (Wikipedia, Maasai, Dec 2020). Many Maasai have moved away from the nomadic life to positions in commerce and government. “Today, many Maasai (and Pare) have adopted Christianity and Islam and have a political role in government leadership positions. Yet despite the sophisticated urban lifestyle they may lead, many happily head homewards dressed in designer clothes, only to emerge from the traditional family homestead wearing a shuka (colorful piece of cloth), cow hide sandals and carrying a
wooden club (o-rinka)” (Wikipedia, Maasai, Dec 2020). The current Maasai population is reported as numbering ~2 million: 1,189,522 in Kenya (Kenya 2019 census) with an additional ~800,000 in northern Tanzania (2011 Tanzania data).
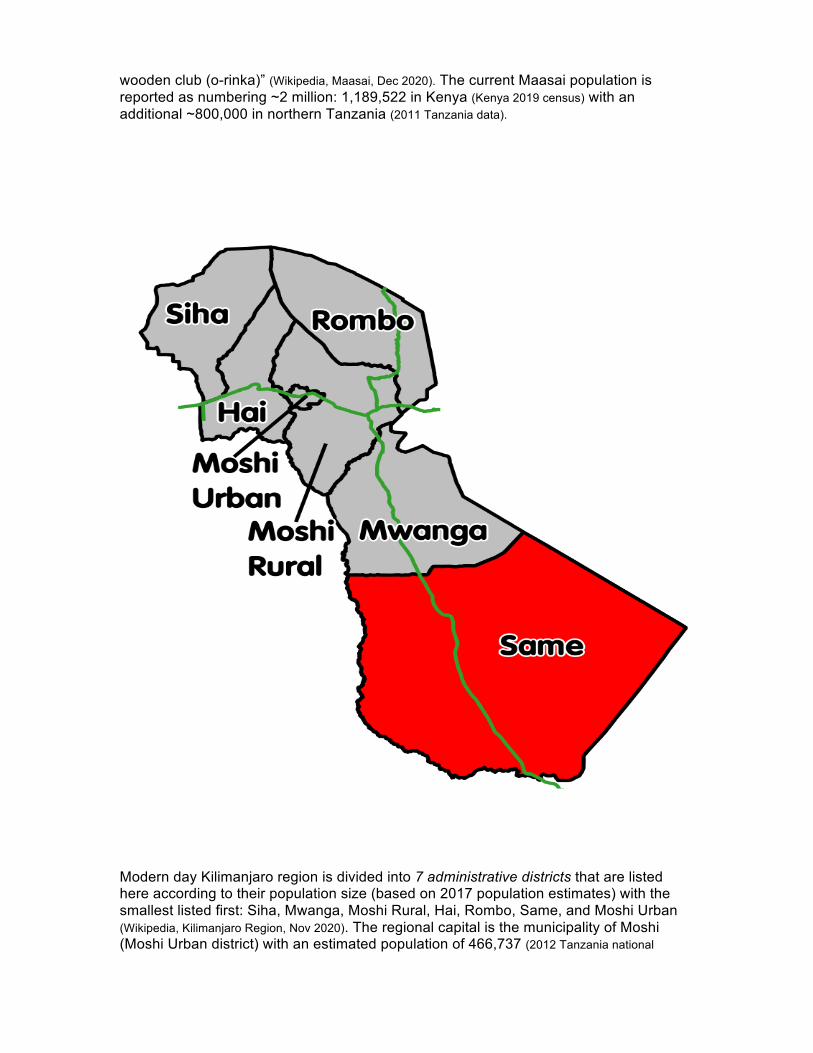
Modern day Kilimanjaro region is divided into 7 administrative districts that are listed here according to their population size (based on 2017 population estimates) with the smallest listed first: Siha, Mwanga, Moshi Rural, Hai, Rombo, Same, and Moshi Urban (Wikipedia, Kilimanjaro Region, Nov 2020). The regional capital is the municipality of Moshi (Moshi Urban district) with an estimated population of 466,737 (2012 Tanzania national
census) to 509,432 (Wikipedia, Kilimanjaro Region, Nov 2020). Based upon the 2012 national census, Moshi is the 10th most populated district in mainland Tanzania (Wikipedia, Districts of Tanzania, Dec 2020). Businesses and services in the region are concentrated in the municipality of Moshi and to a lesser degree along the single tarmac main route (shown in green on the map below) that runs from Moshi through Moshi Rural, Mwanga and Same districts towards the port of Tanga on the Indian Ocean and then to Dar es Salaam further south; or west through Hai district to Arusha, and north through Moshi Rural and Rombo districts into Kenya. The proximity to Mt. Kilimanjaro has lead to one of only two mainland Tanzania international airports being located in the Kilimanjaro region to accommodate international climbers and tourists. Moshi is reportedly one of the cleanest towns in Tanzania. Moreover, it is a relatively safe city with major crimes against persons within the region accounting for only 4% of all mainland Tanzania’s major crimes against persons in 2019 (Tanzania National Bureau of Statistics, 2019). Tourism has contributed greatly to employment in the district and to the overall local economy. Having Mt. Kilimanjaro as a major tourist attraction brings both local and foreign dollars from a demand for porters and guides along with business for hotels, restaurants, bars, and other leisure centers (Zoom Tanzania 2017). The regional GDP (2013-19 data; NBS) represents 4.5% of the entire country, comparable to that of Arusha (4.69%), although it remains only ~1/4 of that of Dar es Salaam, which accounts for 17.08% of the entire mainland’s GDP. According to the 2005 Tanzania Poverty and Human Development Report, the Moshi Urban district had the highest literacy rate for people over 15 years old compared to the other (then) 128 districts in Tanzania. In 2010 (the only other year these data are available), 95.3% of men in the region were literate and 90.6% of women, although only 0.9% of men and 0.8% of women had completed secondary education (World Data Atlas, United Republic of Tanzania, Kilimanjaro Region). Each division within the Moshi Urban district has a community-established secondary school and many higher learning institutions are found in Moshi as well, including: the Kilimanjaro Christian Medical College, Stefano Moshi Memorial University College, and Mwenge Catholic University. Within the municipality, there are two major hospitals, the Kilimanjaro Christian Medical Centre (KCMC) and the Mawenzi Regional Hospital that both serve as major referral hospitals for other regions of Tanzania. The Kilimanjaro Clinical Research Institute, out of the KCMC, also plays a leading role in health in the region (Zoom Tanzania, Feb 2017). Despite the more modern universities and medical facilities, a 2005 study showed that tribal beliefs still were pervasive in the area. “Unlike professional health care workers functioning within the scientific paradigm, urban Pare health beliefs arise from magico-religious, holistic and scientific paradigms…nurses caring for urban Pare are looking to enhance culturally congruent care”. (https://pubmed.ncbi.nlm.nih.gov/16509094/). Despite its largely rural population and still strong tribal beliefs and traditions among its people, overall health in the Kilimanjaro region appears to be better than in many other regions within Tanzania (based on reported government data). Life expectancy in the region is 66-67 years for both men and women and, in 2013; life expectancy at birth was up to 68 years (World Data Atlas, United Republic of Tanzania, Kilimanjaro Region). The region’s under five mortality rate is a surprisingly low 17.3 deaths/1000 live births (World Data Atlas, United Republic of Tanzania, Kilimanjaro Region), especially when compared to Tanzania’s 53 and Kenya’s 41.1 deaths/1000 live births (Index mundi from data provided UNICEF, WHO, World Bank, and the UN Group for Child Mortality Estimation) and compared to the USA’s 2018 under-five mortality of 6.5 deaths/1000 live births. In 2010 (the only year these data are
available), reportedly 94.2% of all children aged 12-23 months had received all basic vaccinations (BCG, measles, 3 doses DPT/DPT-HB/DPT-HB-Hib, and 4 doses polio vaccine) (World Data Atlas, United Republic of Tanzania, Kilimanjaro Region). In that same year, 11% of women delivered by cesarean section and, overall, a skilled provider delivered 86% of women in the region (World Data Atlas). Even more surprising, only 1.2% of births were reported to be for babies weighing <2.5 kg (a marker used to identify underweight births and possible underlying maternal malnutrition). Underweight babies (born weighing less than expected for their gestational age) are at high risk for increased mortality and serious lifelong health issues in survivors. Worldwide, it is estimated that ~15% of babies are born underweight and ~10-20% of all births in most of sub-Sahara Africa are underweight (2015 data, UNICEF). With regard to malnutrition in children under 5 years of age, Kilimanjaro region, also reports better than national averages (national averages are presented in parentheses) with 29% (34%) stunted, 3.1% (5%) wasted, and 9.2% (14%) underweight. Anemia has serious health consequences, including impaired cognitive function, growth, and psychomotor development. Reportedly 48.9% of the region’s children under-5 years of age are anemic, although this again is better than the national average of 57%. With regard to anemia in women of childbearing age (15-49 years of age), 29.1% are anemic compared to 45% nationally (23.8-59.4% range among 25 mainland regions reporting) (Tanzania Demographic and Health Survey (TDHS) 2015−2016). Women who are anemic are not able to provide adequate iron to their growing fetus, leading to low iron stores in babies and intrauterine growth restriction from low oxygen carrying capacity amongst other problems.
Despite the reported statistics, undernutrition remains one of Tanzania’s greatest human development challenges. Due to the rate of population growth outstripping the rate of reduction, the absolute numbers of stunted and wasted children are high, and in some instances increasing (Action Against Hunger, Iris East Africa Report March 2017). So despite reporting a seemingly ‘low’ and ‘acceptable’ rate of acute malnutrition of <5% of the population, the actual number (burden) of acutely malnourished children is high and one of the highest in East Africa. An estimated 450,000 children in Tanzania are acutely malnourished or wasted, with over 100,000 suffering from the most severe form of acute malnutrition (Action Against Hunger, Iris East Africa Report March 2017). This threatens not only individual lives, but also the next generation’s economic advancement due to lost educational achievement, lost income, and lost opportunities.
Health in the Kilimanjaro region appears to be better than in many other regions with regards to malaria and HIV according to governmental reports. In 2017, the percentage of children age 6-59 months diagnosed with malaria (based on a positive RDT Rapid Diagnostic Test) was low compared to all of Tanzania, including Zanzibar and yet, both Same district council and Mwanga district report malaria as the leading cause of death in their districts. In 2012, total HIV positivity in the Kilimanjaro region was reported as ~3.8% of the region’s population, up 100% from 2008 figures (World Data Atlas, United Republic of Tanzania, Kilimanjaro Region). The Tanzania HIV Impact Survey (THIS) 2016 -2017 was the fourth in a series of household-based human immunodeficiency virus (HIV) surveys and the first national HIV survey that covered populations of all ages in the country and used indicators, such as HIV incidence and viral load suppression (VLS). A nationally representative survey of 36,087 adults aged 15 years and older and 10,452 children aged 0 -14 years (including 7,477 children aged 0 -9 years and 2,975 early adolescents aged 10 -14 years) were eligible to participate in the survey. Based on this survey, the annual incidence of new HIV infection among adults aged 15 years and older is 0.24% (0.16% among males and 0.32% among females). This corresponds to approximately 72,000 new infections per year (~24,000 males and ~48,000 females). Overall, prevalence of HIV infection among adults aged 15 years and older in 2016-2017
in Tanzania is 4.9% (3.4% among males and 6.3% among females, corresponding to ~1.4 million people living with HIV aged 15 years and older in the country. The highest HIV prevalence in Tanzania is in the southern part of the country with 9.3-11.4% of the population in the 3 worst affected regions living with HIV. The prevalence of HIV infection in the Kilimanjaro Region, however, is reported as only 2.6%. Viral load (VL) suppression (VLS) is a key indicator of treatment success in HIV-positive individuals. For the purposes of the THIS study, VLS was defined as VL less than 1,000 HIV RNA copies/mL of plasma among the population of HIV-positive persons age 15 years and above. Overall in Tanzania, 51.9% of HIV- positive adults age 15 years and older had VLS (41.5% among males and 57.2% among females); Kilimanjaro Region’s VLS was 66.8%, which was even better than Dar es Salaam’s VLS of 44.7% (Tanzania NBS, 2019).
Empower Tanzania, Inc (ETI) works in the Same and Mwanga districts within the Kilimanjaro region. In 2007, before Empower Tanzania, Inc officially existed, the US volunteers who would later form ETI started a federally funded project under PEPFAR (President’s Emergency Plan for AIDS Relief). These volunteers educated over 300 lay people from villages in Same and Mwanga Districts to provide comfort care to terminally ill AIDS patients. Empower Tanzania Inc. then emerged from Tanzanian colleagues talking with interested US volunteers about other problems in their communities and wishing for effective lasting solutions. Believing in the collective power of ordinary people to create change, ETI was incorporated, received 501(c)(3) status, and registered as an NGO in Tanzania in 2008. ETI continues to work with local people in these two rural districts where the earlier Palliative Care Project was started. Over the past decade, ETI has developed a track record as a non-religious based organization that successfully has created opportunities for women’s empowerment, economic strengthening and gender equality, as well as, strengthening community health directly and indirectly by elevating community knowledge in many areas of public health, personal health, and gender relationships. ETI’s program development philosophy has remained unchanged: to work with local Tanzanian stakeholders to clarify a need they identify and to assist in developing and implementing self-sustaining solutions. ETI recognizes the need for and the effectiveness of collaboration in this process. Everyone in ETI strives to work cooperatively on program development and operation to ensure that everyone has a voice in shaping policies that will affect them and their communities. Through these practices, ETI staff and volunteers have developed close working relationships with governmental administrative health, education, water, and agriculture department officials, members of Lutheran, Catholic and Islamic leadership and other international NGOs working in the region, all who continue to support ETI’s ongoing projects.
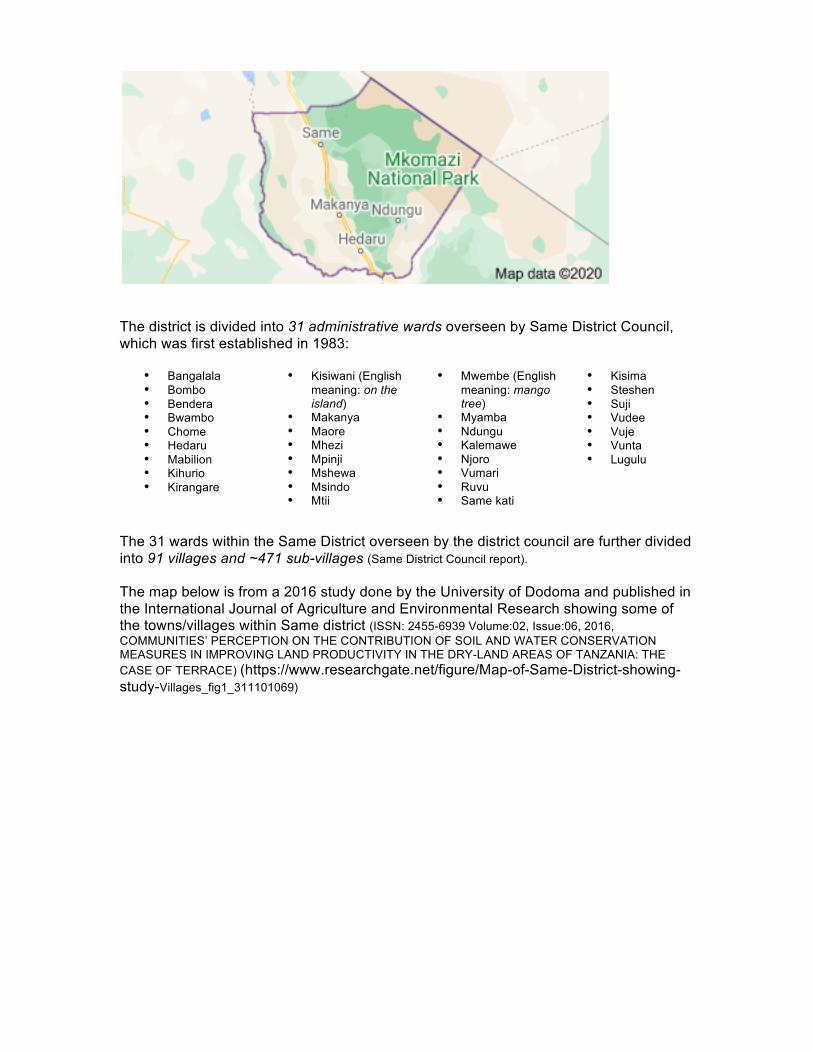
SAME DISTRICT Same is one of the seven districts of the Kilimanjaro Regionandis located ~65 miles (105 km) from Kilimanjaro regional headquarters in Moshi (Same District Council report). It is bordered on the north by the Mwanga District, to the northeast by Kenya, to the south and southeast by the Tanga Region, and to the west by the Manyara Region. The South Pare Mountains and Mkomazi National Park are located within the district’s boundaries. It is the largest of the Kilimanjaro regional districts, covering 5186 sq km (2002.3 sq miles) and containing 39% of the total area of the Kilimanjaro region. The district has 2 national election constituencies in The National Assembly: Same East and Same West.
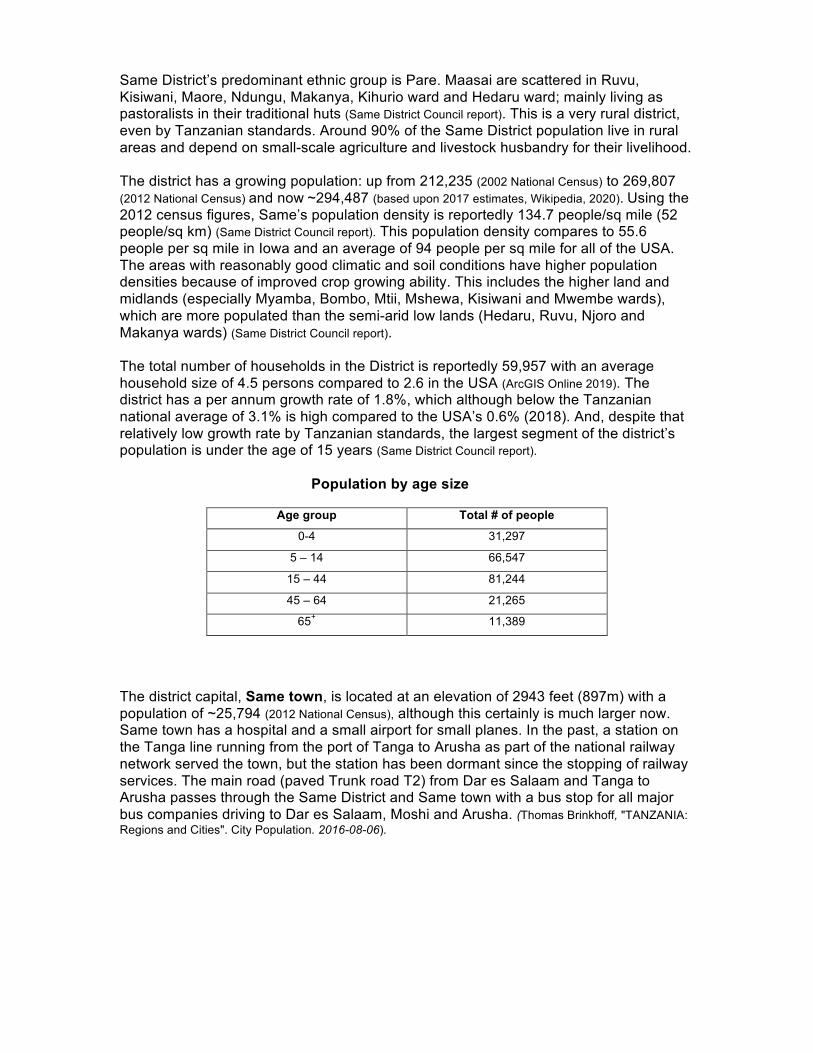
Same District’s predominant ethnic group is Pare. Maasai are scattered in Ruvu, Kisiwani, Maore, Ndungu, Makanya, Kihurio ward and Hedaru ward; mainly living as pastoralists in their traditional huts (Same District Council report). This is a very rural district, even by Tanzanian standards. Around 90% of the Same District population live in rural areas and depend on small-scale agriculture and livestock husbandry for their livelihood. The district has a growing population: up from 212,235 (2002 National Census) to 269,807 (2012 National Census) and now ~294,487 (based upon 2017 estimates, Wikipedia, 2020). Using the 2012 census figures, Same’s population density is reportedly 134.7 people/sq mile (52 people/sq km) (Same District Council report). This population density compares to 55.6 people per sq mile in Iowa and an average of 94 people per sq mile for all of the USA. The areas with reasonably good climatic and soil conditions have higher population densities because of improved crop growing ability. This includes the higher land and midlands (especially Myamba, Bombo, Mtii, Mshewa, Kisiwani and Mwembe wards), which are more populated than the semi-arid low lands (Hedaru, Ruvu, Njoro and Makanya wards) (Same District Council report). The total number of households in the District is reportedly 59,957 with an average household size of 4.5 persons compared to 2.6 in the USA (ArcGIS Online 2019). The district has a per annum growth rate of 1.8%, which although below the Tanzanian national average of 3.1% is high compared to the USA’s 0.6% (2018). And, despite that relatively low growth rate by Tanzanian standards, the largest segment of the district’s population is under the age of 15 years (Same District Council report).
Population by age size
Age group Total # of people
0-4 31,297
5 – 14 66,547
15 – 44 81,244
45 – 64 21,265
65+ 11,389
The district capital, Same town, is located at an elevation of 2943 feet (897m) with a population of ~25,794 (2012 National Census), although this certainly is much larger now. Same town has a hospital and a small airport for small planes. In the past, a station on the Tanga line running from the port of Tanga to Arusha as part of the national railway network served the town, but the station has been dormant since the stopping of railway services. The main road (paved Trunk road T2) from Dar es Salaam and Tanga to Arusha passes through the Same District and Same town with a bus stop for all major bus companies driving to Dar es Salaam, Moshi and Arusha. (Thomas Brinkhoff, "TANZANIA: Regions and Cities". City Population. 2016-08-06).
The district is divided into 31 administrative wards overseen by Same District Council, which was first established in 1983:
• Bangalala • Bombo • Bendera • Bwambo • Chome • Hedaru • Mabilion • Kihurio • Kirangare
• Kisiwani (English meaning: on the island)
• Makanya • Maore • Mhezi • Mpinji • Mshewa • Msindo • Mtii
• Mwembe (English meaning: mango tree)
• Myamba • Ndungu • Kalemawe • Njoro • Vumari • Ruvu • Same kati
• Kisima • Steshen • Suji • Vudee • Vuje • Vunta • Lugulu
The 31 wards within the Same District overseen by the district council are further divided into 91 villages and ~471 sub-villages (Same District Council report). The map below is from a 2016 study done by the University of Dodoma and published in the International Journal of Agriculture and Environmental Research showing some of the towns/villages within Same district (ISSN: 2455-6939 Volume:02, Issue:06, 2016, COMMUNITIES’ PERCEPTION ON THE CONTRIBUTION OF SOIL AND WATER CONSERVATION MEASURES IN IMPROVING LAND PRODUCTIVITY IN THE DRY-LAND AREAS OF TANZANIA: THE CASE OF TERRACE) (https://www.researchgate.net/figure/Map-of-Same-District-showing-study-Villages_fig1_311101069)
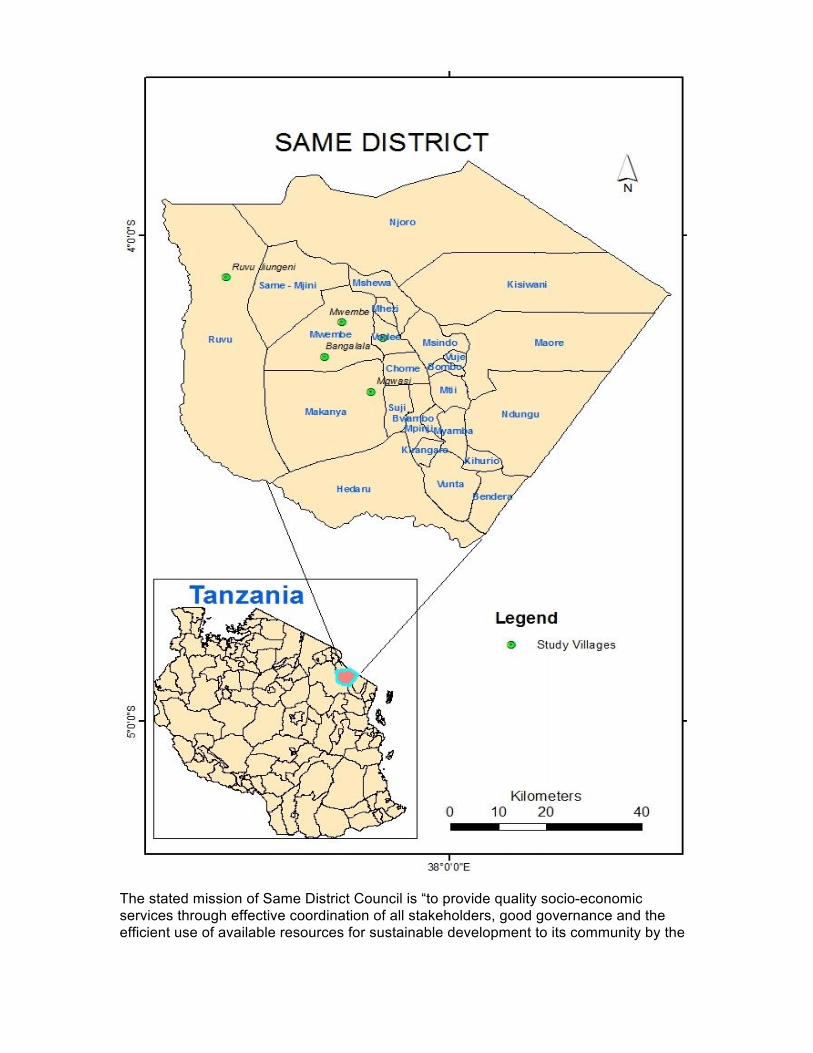
The stated mission of Same District Council is “to provide quality socio-economic services through effective coordination of all stakeholders, good governance and the efficient use of available resources for sustainable development to its community by the
year 2015” (Same District Council report). To insure that they would achieve their mission, their intent was to achieve the following institutional objectives by 2011:
• Reduce HIV/AIDS infections and improve services • Enhance and sustain effective implementation of the National Anti-
corruption Strategy • Improve access to and the provision of quality social services • Improve financial management, revenue collection, and entrepreneurship
services • Enhance good governance, coordination of planning process, and
resource mobilization • Improve management of natural resources, physical planning and
environmental conservation • Improve socio-economic infrastructure, agro-economics and rural
financial services • Improve social welfare, gender and community empowerment • Improve emergence preparedness, disasters management and impact
mitigation It is not clear if they have been able to fulfill their mission or objectives, as little current data are available for the district. The Trade Department of the Same District Council deals with revenue collections from various sources in urban and rural areas. Sources of revenue come from hotel levies, service levies, market dues, intoxicating liquor fees, billboards, and mineral (gypsum) dues (Same District Council report). At present, the department estimates collections are only about 83%. “In order to succeed, the council must have enough staffs for revenue collections.” The district’s Trade Department also is involved in the training of the businessmen on how to “improve their business activities for generating profit by trying to identify informal businesses that could be involved in income-generation”. The strategies used by department, include:
! Increase community skills/knowledge in doing business and operating small industries
! Provide technical skills through cooperation with SIDO (Small Industries Development Organization)
! Provide information on different business and taxation policy Also within the District is a trade association, Same Chamber of Commerce, which issues guidelines for providing information to businesses on how to negotiate the price of crops in order to get the reasonable price or transforming some crops through processing and packaging in order to add value and increase price. The District is rich in wildlife as it lies adjacent to Mkomazi National Park on its northeast side and the Ruvu Game controlled area in the southwest. Previously, there has not been much “wildlife potential” in Ruvu controlled area “due to excessive illegal hunting and pastoralist immigration to the area” (Same District Council report). The district wants to build on this future revenue source since there is an improved regular and joint patrol with Mkomazi National Park and anti-poaching unit-Arusha (KDU).

Generally the land use patterns in Same district can be seen in the following scenario (Same District Council report): (NOTE: 1 hectare (ha) = 2.47 acres)
" Grazing area 346,000 ha " Arable land utilized 45,000 ha " Land suitable for irrigation 20,000 ha " Land currently under irrigation 11,980 ha " Forest reserves (6 Natural Forest Reserves) 23,285 ha
Food crops in the Same district are mainly maize that may be intercropped with pigeon peas (a bean with deep tap roots that can tolerate drought and poor soil conditions; the seeds, seedpods, leaves, and young shoots are all edible. It is also planted as “green” manure and valued for it’s medicinal uses), paddy (rice), beans, sorghum, beans/legumes, sweet potatoes, wand potatoes, banana, and cassava or yucca (the root is the most commonly consumed part, which can be eaten whole, grated or ground into flour to make bread and crackers; it is the raw material that's used to produce tapioca and garri, a product similar to tapioca). The main cash crop is ginger, but coffee, cotton, lablab (a very drought resistant legume exported to the US for deer food plots), and cardamom spice also are sold. Same District is self-sufficient in food production except in years when weather conditions are unfavorable for crop production. The District typically produces more than its requirement of paddy (rice), banana and vegetable crops, so that in normal years the District is a net exporter of food and cash crops, mostly due to production at the higher plateaus. The district is divided into 3 ecological zones based on topography, altitude and rainfall (Same District Council report). The Upland Plateau Zone sits between ~3609-8077 feet (1100-2462 meters) above sea level. The settlement pattern is highly influenced by the topography of the land. People build multiple houses in their farms, but space for urbanization is quite limited due to the slope of the land. The zone is densely populated, however, because of the amount of rainfall and reportedly has 1683.9 people per sq mi (650 people/sq km). Annual rainfall ranges from 49.2-78.7 inches (1250-2000 mm) with temperatures between 59-68’F (15-250C) (Same District Council report). Given the climate, farming is the main economic activity of the people with all the arable land in this zone being fully utilized and the greatest variety of crops grown. The crops grown include coffee, timber trees, bananas, maize, beans, cardamom and various fruits such as pears, pawpaw, and avocados. Many vegetables, such as tomatoes, onion, spinach, lettuce, okra, and peppers can be grown as well. Usually there is enough production for exportation to other regions. The Middle Plateau Zone lies between 2953-3609 feet (900-1100 m) above sea level and although less densely populated than the upland plateau, still has ~648 people/sq mile (~250 people/sq km). Temperatures are higher and less variable than in the upland zone, ranging from 77-86’ F (25-300C) and this zone receives less rain at ~31.5-49.2 inches (800-1250 mm) per year. Most of the crops produced in this zone are maize, coffee, and timber trees such as grevillea and certain types of pine. The Lowland Plateau Zone lies between 1640-2953 feet (500-900 m) above sea level. Because of the mountains, much of Same district is leeward and, therefore, is in the most arid part of the region with a reported annual rainfall of only 667.7 mm (26.29”) (Tanzania, NBS, 2019) or 19.7”-31.5” (500-800 mm) (Same District Council report). Given that this zone is semi-arid, it is the least populated zone and pastoralists have always dominated (see picture below). Although there are few pure pastoralists in the District as many
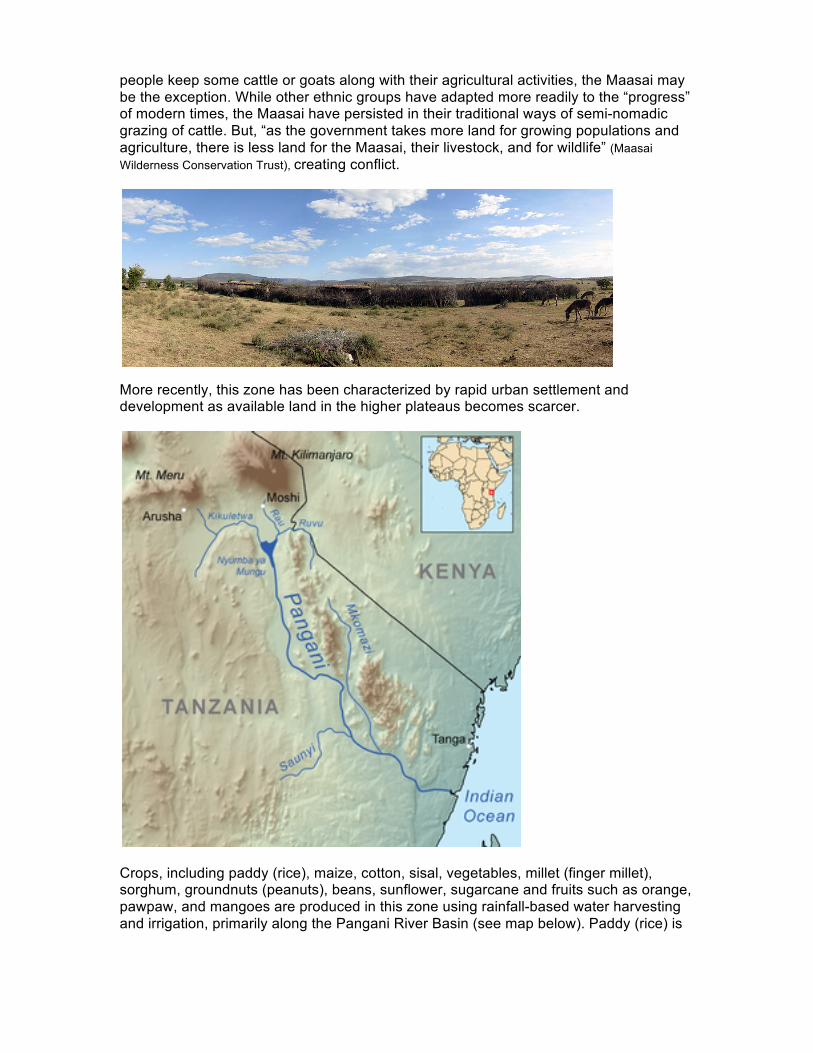
people keep some cattle or goats along with their agricultural activities, the Maasai may be the exception. While other ethnic groups have adapted more readily to the “progress” of modern times, the Maasai have persisted in their traditional ways of semi-nomadic grazing of cattle. But, “as the government takes more land for growing populations and agriculture, there is less land for the Maasai, their livestock, and for wildlife” (Maasai Wilderness Conservation Trust), creating conflict.
More recently, this zone has been characterized by rapid urban settlement and development as available land in the higher plateaus becomes scarcer.
Crops, including paddy (rice), maize, cotton, sisal, vegetables, millet (finger millet), sorghum, groundnuts (peanuts), beans, sunflower, sugarcane and fruits such as orange, pawpaw, and mangoes are produced in this zone using rainfall-based water harvesting and irrigation, primarily along the Pangani River Basin (see map below). Paddy (rice) is
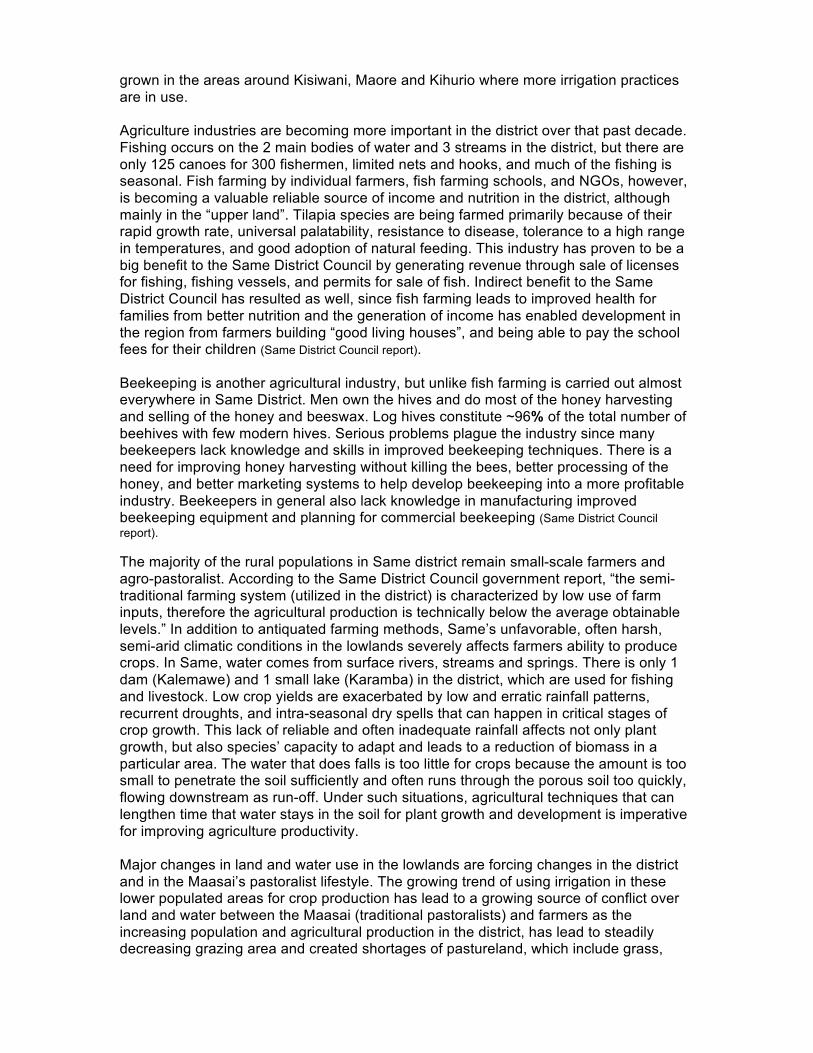
grown in the areas around Kisiwani, Maore and Kihurio where more irrigation practices are in use. Agriculture industries are becoming more important in the district over that past decade. Fishing occurs on the 2 main bodies of water and 3 streams in the district, but there are only 125 canoes for 300 fishermen, limited nets and hooks, and much of the fishing is seasonal. Fish farming by individual farmers, fish farming schools, and NGOs, however, is becoming a valuable reliable source of income and nutrition in the district, although mainly in the “upper land”. Tilapia species are being farmed primarily because of their rapid growth rate, universal palatability, resistance to disease, tolerance to a high range in temperatures, and good adoption of natural feeding. This industry has proven to be a big benefit to the Same District Council by generating revenue through sale of licenses for fishing, fishing vessels, and permits for sale of fish. Indirect benefit to the Same District Council has resulted as well, since fish farming leads to improved health for families from better nutrition and the generation of income has enabled development in the region from farmers building “good living houses”, and being able to pay the school fees for their children (Same District Council report). Beekeeping is another agricultural industry, but unlike fish farming is carried out almost everywhere in Same District. Men own the hives and do most of the honey harvesting and selling of the honey and beeswax. Log hives constitute ~96% of the total number of beehives with few modern hives. Serious problems plague the industry since many beekeepers lack knowledge and skills in improved beekeeping techniques. There is a need for improving honey harvesting without killing the bees, better processing of the honey, and better marketing systems to help develop beekeeping into a more profitable industry. Beekeepers in general also lack knowledge in manufacturing improved beekeeping equipment and planning for commercial beekeeping (Same District Council report). The majority of the rural populations in Same district remain small-scale farmers and agro-pastoralist. According to the Same District Council government report, “the semi-traditional farming system (utilized in the district) is characterized by low use of farm inputs, therefore the agricultural production is technically below the average obtainable levels.” In addition to antiquated farming methods, Same’s unfavorable, often harsh, semi-arid climatic conditions in the lowlands severely affects farmers ability to produce crops. In Same, water comes from surface rivers, streams and springs. There is only 1 dam (Kalemawe) and 1 small lake (Karamba) in the district, which are used for fishing and livestock. Low crop yields are exacerbated by low and erratic rainfall patterns, recurrent droughts, and intra-seasonal dry spells that can happen in critical stages of crop growth. This lack of reliable and often inadequate rainfall affects not only plant growth, but also species’ capacity to adapt and leads to a reduction of biomass in a particular area. The water that does falls is too little for crops because the amount is too small to penetrate the soil sufficiently and often runs through the porous soil too quickly, flowing downstream as run-off. Under such situations, agricultural techniques that can lengthen time that water stays in the soil for plant growth and development is imperative for improving agriculture productivity. Major changes in land and water use in the lowlands are forcing changes in the district and in the Maasai’s pastoralist lifestyle. The growing trend of using irrigation in these lower populated areas for crop production has lead to a growing source of conflict over land and water between the Maasai (traditional pastoralists) and farmers as the increasing population and agricultural production in the district, has lead to steadily decreasing grazing area and created shortages of pastureland, which include grass,
shrubs and fodder trees (Same District Council report). The District has started to address some of these problem by providing “cut and carry” training to its farmers for feeding animals and educating farmers about the importance of keeping a balance between grazing land and number of livestock (Same District Council report). Farmers are encouraged to plant fodder trees around homesteads to demarcate farm plots and to improve soil fertility. Farmers are also educated about proper disposal of farm residues instead of the present practice of collecting and burning when clearing the land for the next season. Deforestation is a major concern throughout Tanzania, especially with its growing population and escalating issues related to a climate change, such as, forest fires and worsening droughts. Tanzania is the number one offender of deforestation in Africa. Charcoal production is a major cause of deforestation, just behind shifting land use. A 2009 World Bank paper on the charcoal sector in Tanzania estimated that between 100,000 and 125,000 hectares of Tanzanian forest is lost annually as a result of charcoal production. Due to its agriculture policies (or lack thereof) with regard to deforestation and the (underground) charcoal industry, as of 2011, Tanzania ranked 7th in the world for overall charcoal production, accounting for roughly 3% of global charcoal production at over 1.6 million tons. The loss of trees affects climate, water supply, public health, and sustainable agriculture. (STUDY: Burnishing charcoal’s image in Tanzania, Published by UONGOZI Institute, Issue Brief No.2, June 2013). According to the Same district council’s report, local authority forest reserves have added an additional 16,411 hectares, so the total area of the District covered with forest reserve may be somewhere between 27,880 and 39,580 hectare. No specific mention is made in the district council report regarding charcoal production or deforestation, but they do note that additional area of forest is being added annually to the totals within the district. Measures to deal with these major climate, agricultural, and growing population challenges, such as, planting trees, practicing conservation agriculture, using micro-dam rainwater harvesting for irrigation, and using terraces to reduce run-off, soil erosion and alter water infiltration rate are needed and could greatly improve production. Same District in particular presents a compelling case for use of water-harvesting technology like micro dams, since the area is characterized by long drought spells and low rainfall with high variability (Water-harvesting Technology Using Micro Dams: A Case Study of Same District, Tanzania; Water-Smart Agriculture in East Africa, Juma Omary Mdeke, Ministry of Agriculture Food Security and Cooperatives and Majid A. Kabyemela, District Agriculture, Irrigation and Cooperative Officer, Same District Council). Techniques like these have been introduced in Same district by different organizations: the Sokoine University of Agriculture, the Same Agricultural Improvement Trust Fund (SAIPRO), CARE International, and the government. As a result, some smallholder farmers in Same district now are using agricultural techniques that promote soil and water conservation. By 2014, there were ~157 micro dams in the district and ~7500 ha of land under irrigation. The result was an increase in maize production, increased water availability and, therefore, reduced conflict between farmers and pastoralists, and a reduction in time spent by women looking for water for domestic use. According to a 2016 University of Domoda study, soil and water conservation measures/techniques are “widely acknowledged as effective and relevant measures for improving land productivity despite being laborious”. (COMMUNITIES’ PERCEPTION ON THE CONTRIBUTION OF SOIL AND WATER CONSERVATION MEASURES IN IMPROVING LAND PRODUCTIVITY IN THE DRY-LAND AREAS OF TANZANIA: THE CASE OF TERRACE, “FANYAJUU” and DOUBLE DIGGING IN SAME DISTRICT, Iddi R. Mwanyoka & Dosteus Lopa, University of Dodoma, Tanzania International Journal of Agriculture and Environmental Research Volume:02, Issue 06), The living standard of most people in the district continues to be low. There are only six identified water sources in the entire district (including surface water); only ~51% of the
Same District Council population has access to clean and safe water –through pipes (gravitational), hand pumps (27 short wells), power driven (6 deep wells), 7 windmill and 3 solar driven mills (all deep wells) (Same District Council report). Secondary health problems result from poor nutritional status, poor integrated disease surveillance and response, poor health seeking behavior, poor access to clean water, “bad” cultural, taboos, beliefs and practices, and poor latrine usage; leading to high infectious disease rates, morbidity and mortality. According to the district council, the district’s primary health problems are: high malaria mortality in all ages, high TB mortality, high maternal mortality rates, high incidence of diarrhea diseases and frequent cholera outbreaks, high prevalence of HIV/AIDS and all STIs, and high number of rabies cases from animal bites (Same District Council report). The most common cause of death in the district is malaria with respiratory diseases, diarrhea, pneumonia and malnutrition being the other major causes of death. Additional chronic health problems include intestinal worms, skin diseases, ear and eye infections and sexually transmitted diseases. Despite the typically adequate food production, the overall nutritional status and health of most of the district’s population is reported to be poor, mainly due to low economic status and frequent illness (Same District Council report). Income levels of most households in the district have grown modestly from 436,900 TzSh/per person/year in 2008 ($187.96 USD based on exchange rate Dec 11, 2020) to 500,000 TzSh/per person/year in 2012 (215.56 UDS), but remain well below Tanzania’s national average of $910 USD/year/person. Due to the increasing costs of living, most communities cannot manage to pay for many of the socio-services that were previously offered free by the government. Families with food scarcity are forced to seek assistance from relatives who also may be suffering. Some farmers use a major portion of their agricultural produce for brewing local beer instead of using it for family consumption (Same District Council report). This together with excessive beer drinking contributes to the level of malnutrition. “It has been established that more than 40% of the children in the District are undernourished and over 5% malnourished” (Same District Council report), statistics that appears to be significantly worse than the Kilimanjaro region as a whole. The levels of malnutrition are relatively equal between predominantly agriculture and pastoral villages. Prevalence of malnutrition is mainly related to periodic droughts, but also occurs in normal years due to poor diet (in some families), which is closely associated with poverty, illiteracy and ignorance (Same District Council report). The district council has developed strategies for improving food security, including banning use of grains for brewing local beer, educating farmers in soil and water conservation techniques (such as use of terracing, mulching, planting cover crops, contouring fields), use of rain water harvesting techniques, encouraging planting of short maturing food crop varieties and planting root tuber crops like sweet potatoes that have moderate drought tolerance, use of improved animal husbandry methods, and improved storing and processing of crops and meats. Since independence, the country has placed an emphasis on adult literacy. As mentioned earlier in this paper, in 2010 (the only year these data are available), 95.3% of men in the entire Kilimanjaro region were literate and 90.6% of the women, although only 0.9% of men and 0.8% of women had completed secondary education (World Data Atlas, United Republic of Tanzania, Kilimanjaro Region). Defining adult literacy as the ability to read and write Kiswahili (Swahili) and do some basic math, the Same district reportedly had only 817 illiterate adults (males 406 and females 411) in 2012, making it one of the most literate districts in the country (Same District Council report).

The education system in Tanzania is outlined in this chart (Tanzania Education System; 2020 Scholaro (https://www.scholaro.com/pro/Countries/Tanzania/Education-System). Education system is a 2-7-4-2-3+, meaning 2 years pre-primary, 7 years primary (Standard 1-7), 4 years lower (junior) secondary (Form 1-4 or I-IV), 2 years upper secondary (Form 5-6 or V-VI), and 3+ for tertiary education
Education School/Level Grades Age Years Primary Pre-Primary 2 2 years of pre-primary followed by 7 years of primary.
Primary Primary Education 1–7 7–
13 7 All children must pass a standardized exam for primary school certificate.
Secondary Lower Secondary 8–12 15–
17 4
Junior Secondary school is 4 years with exams at the end of Forms 2 and 4. Classes are primarily taught in English. Tuition and other fees (e.g. watchman fees, furniture levy) are levied. Certificate/diploma awarded: Certificate of Secondary Education (CSE)
Secondary Upper Secondary 18–
20 2
Follows the Cambridge Model. Secondary education is split into ordinary and advanced level secondary education; both require a minimum of 2 years study followed by an exam. Advanced level is only available at certain boarding schools. Certificate/diploma awarded: Advanced Certificate of Secondary Education (ACSE)
Vocational Certificate 2 Requires Certificate of Secondary Education (CSE)
Vocational Full Technician Certificate
1–3 Requires Certificate of Secondary Education (CSE) or 2-year post-secondary vocational Certificate for admission
Tertiary Bachelor's 3–5
Under control of Ministry of Higher Education. The oldest institution in the country is University of Dar es Salaam, established in 1970 after the dissolution of the Univ of East Africa.
Tertiary Master's 1–3 Tertiary Doctorate 3 PhD
Pre-primary schools are recognized as playing an increasingly important role in education of children 5-6 years of age, although access remains low and schools generally are of poor quality (Education/UNICEF United Republic of Tanzania 2018 report). Most children, especially those in rural areas enter primary school poorly prepared due to lack of early infancy/childhood stimulation, poor nutrition with serious nutritional deficiencies that affect mental functioning, and low-quality pre-primary education. The pupil-to-qualified teacher ratio at pre-primary level in Tanzania is 131:1 and even worse (169:1) in public pre-primary schools compared to 24:1 in private schools (Education/UNICEF United Republic of Tanzania 2018 report). Despite the challenges, Same district’s long-term target is to include all children in pre-primary school education before they join the formal primary to secondary school education system (Same District Council report). Primary school education is touted as being a basic right of every Tanzanian child 7-13 years of age, although human rights watch groups claim that government has failed to fully protect education as a basic human right in Tanzania (Right to Education Project –January 2015). In 1974, the Government of Tanzania embarked on a Universal Primary Education scheme making primary education compulsory and then set out to make it available to every child. To achieve this goal, communities “have been mobilized to provide practical and relevant education to their students in partnership with central and local
governments” (Same District Council report). Unfortunately, equity, inclusivity, and quality continue to pose major challenges towards achieving this goal. In 2007, Tanzania reportedly achieved nearly universal access to primary education (Education/UNICEF United Republic of Tanzania 2018 report). However, since then, enrolment of primary school-aged children has been dropping and an estimated 2 million children between the ages of 7 and 13 years are out-of-school (UNICEF DATA; Primary Education Oct 2019). Education is free in theory up to age 15 in Tanzania, although unfortunately poorer parents are unable to afford uniforms, school materials and examination fees, and so their children continue to be deprived.Completion of primary school education increases with the relative wealth of the student's household. Primary school-aged children from the poorest families are three times less likely to attend school than those from the wealthiest households (Education/UNICEF United Republic of Tanzania 2018 report). The probability of completing primary school also is higher in urban than rural areas. According to another study (CoreUSAid), in 2004, only 81% of children aged 7-13 years attended primary school in Tanzania; a percentage that remained unchanged in 2010. In rural areas, however, this percentage was even lower; 79% compared to 88% in urban areas. Inclusivity is another challenge to overcome before universal primary education is achievable. It is estimated that 7.9% of Tanzanians are living with a disability, yet less than 1 per cent of children in pre-primary, primary and secondary school have a disability, (Education/UNICEF United Republic of Tanzania 2018 report) indicating that significant barriers to inclusive education exist. Sadly, only 22% of primary school students in Tanzania in 2010 were in the appropriate grade for their age (CoreUSAid) with most being over-age for their grade. Seventy-one percent of males and 61% of females were over-age on average with males ranging 50-86% and females ranging 40-74% (CoreUSAid). Both late-entry into primary school and grade repetition can cause children to be over-age for their grade. More students were over-age for their grade as the grade level increased. The implications of over-age students for the school system are enormous. High repetition rates indicate inefficiency in the education system. In the classroom, large numbers of over-age students present a challenge for teachers who must teach a more diverse group with differing levels of maturity and school preparedness. Even more troubling is that school-going children often do not achieve foundational learning outcomes, such as literacy, numeracy, and life skills, which determine future performance. Results from the 2014 “primary school leaving examinations” in mainland Tanzania revealed that only 8% of Grade 2 pupils could read properly, only 8% could add or subtract, and less than 0.1% showed high levels of life skills (academic grit, self-confidence, problem-solving) (Education/UNICEF United Republic of Tanzania 2018 report). Despite the worrisome figures in the rest of Tanzania for primary school attendance, in the Kilimanjaro region, reportedly 90-92% of all eligible children were attending primary school in 2010 (www.epdc.org. Tanzania_coreusaid). Same district reports to be doing an even better job at enrolling students into primary school, however, the numbers available for review are conflicting. Within the district in 2013, “actual enrolment of pupils in primary education reportedly showed a rising trend with 8447 students enrolled (4133 girls and 4314 boys), which is 99% of children eligible for enrolment according to government sources” (Same District Council report). This conflicts with another statistic provided in the same Same district report that 56,531 students aged 5-14 years were enrolled in primary school that same year. Given that the population of Same district is 269,807 as reported in the 2012 National Census, then there should be more children
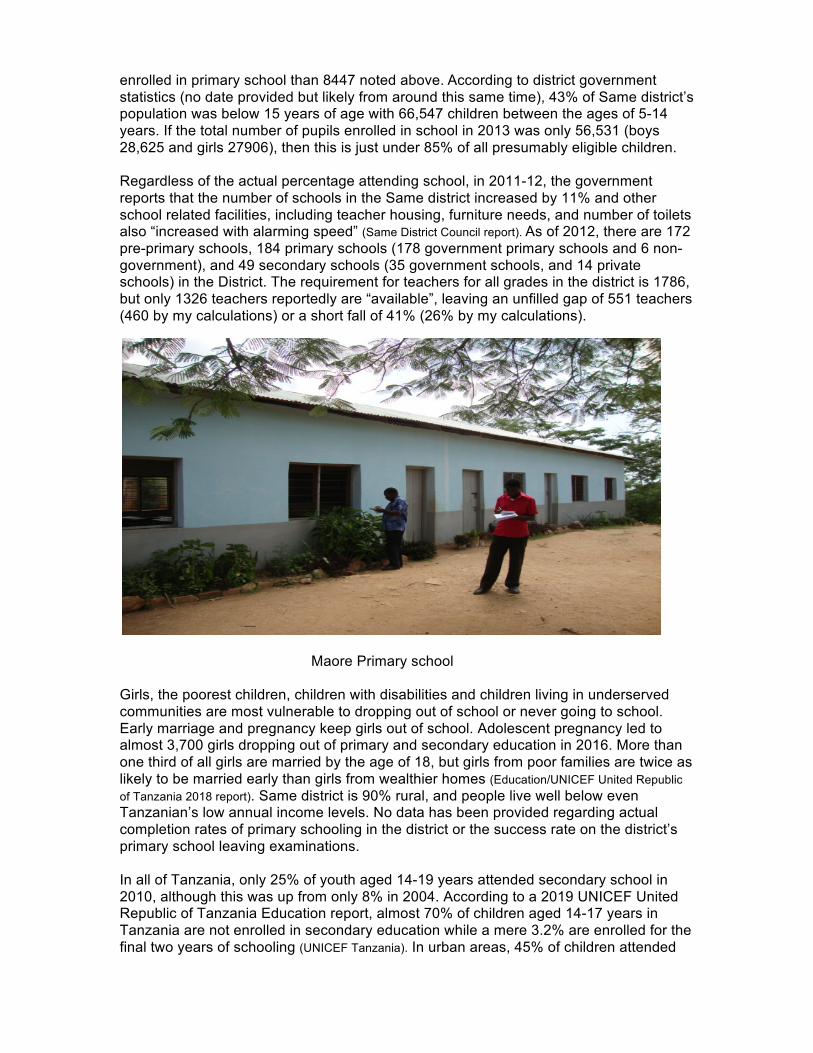
enrolled in primary school than 8447 noted above. According to district government statistics (no date provided but likely from around this same time), 43% of Same district’s population was below 15 years of age with 66,547 children between the ages of 5-14 years. If the total number of pupils enrolled in school in 2013 was only 56,531 (boys 28,625 and girls 27906), then this is just under 85% of all presumably eligible children. Regardless of the actual percentage attending school, in 2011-12, the government reports that the number of schools in the Same district increased by 11% and other school related facilities, including teacher housing, furniture needs, and number of toilets also “increased with alarming speed” (Same District Council report). As of 2012, there are 172 pre-primary schools, 184 primary schools (178 government primary schools and 6 non-government), and 49 secondary schools (35 government schools, and 14 private schools) in the District. The requirement for teachers for all grades in the district is 1786, but only 1326 teachers reportedly are “available”, leaving an unfilled gap of 551 teachers (460 by my calculations) or a short fall of 41% (26% by my calculations).
Maore Primary school Girls, the poorest children, children with disabilities and children living in underserved communities are most vulnerable to dropping out of school or never going to school. Early marriage and pregnancy keep girls out of school. Adolescent pregnancy led to almost 3,700 girls dropping out of primary and secondary education in 2016. More than one third of all girls are married by the age of 18, but girls from poor families are twice as likely to be married early than girls from wealthier homes (Education/UNICEF United Republic of Tanzania 2018 report). Same district is 90% rural, and people live well below even Tanzanian’s low annual income levels. No data has been provided regarding actual completion rates of primary schooling in the district or the success rate on the district’s primary school leaving examinations. In all of Tanzania, only 25% of youth aged 14-19 years attended secondary school in 2010, although this was up from only 8% in 2004. According to a 2019 UNICEF United Republic of Tanzania Education report, almost 70% of children aged 14-17 years in Tanzania are not enrolled in secondary education while a mere 3.2% are enrolled for the final two years of schooling (UNICEF Tanzania). In urban areas, 45% of children attended
secondary school compared to 19% in rural areas. Interestingly, gender disparity, however, was greater in urban areas with fewer females enrolled compared to rural areas were more females are enrolled (www.epdc.org. Tanzania_coreusaid). In Kilimanjaro region in 2010, reportedly ~45% of males and 57% of females were attending secondary school, which is extraordinarily good, especially given the rural nature of the district. Within Same district, the privatization of the secondary school sector has “shown good progress” and the number of students in the district entering form one has progressively increased as well. Various organizations, individuals, and communities have come forward to invest in the establishment, equipping, and running of secondary schools (Same District Council report). In 1974, the District had 3 secondary schools with 315 students entering form one. By 2012, there were 49 secondary schools in the district (35 owned by government and 14 by private sector) with 5344 students entering Form One (Same District Council report). Given the undeniable barriers to enrolling and staying in school in rural Tanzania, there likely remains a great deal of work to do to insure universal higher education in the district (“Barriers to Secondary Education in Tanzania”, 2017 Human Rights Watch report).
Mwanga District
Mwanga District is a rural farming district ~3 degrees south of the equator that sits at the foot of the north Pare Mountains. It is bordered to the northeast by Kenya, to the northwest by Moshi Rural District, to the southwest by Manyara Region, and by Same District to the south (Mwanga District, Wikipedia, Aug 2020). Its total area is 1,019.7 sq mi (2641 sq km), which is roughly the size of Rhode Island (the smallest of the 50 states of America). The paved trunk road T2 from Dar es Salaam to Arusha passes through the district (as seen on the district map below) and this may be the only stretch of paved road within the district. The Usambara Railway from Tanga to Arusha passes though the district, although it is not operational at this time. And, there is no air transportation in the district due to lack of airstrips. Africa Development Bank reportedly is supporting construction of rural roads within the district, but transportation of people and goods within and outside the district remains primarily by gravel and dirt roads except for the 30 miles (50 km) of paved truck road (Government Rural Health Centers 5: Mwanga District Socio-Economic Profile, Dec 2011) and a newer paved road from Mwanga town heading into the mountains towards Usangi. According to the 2012 Tanzania National Census, the population of Mwanga District is 131,442 (although 142,990 is reported by the Mwanga district council); up from 115,145 ten years earlier (Mwanga District, Wikipedia, Aug 2020). Average annual population growth rate for this district is 1.2 %, which is well below the national average of 3.1%. Even so, ~37% of the population is under the age of 15 years and 51% is under the age of 20 years (Government Rural Health Centers 5: Mwanga District Socio-Economic Profile, Dec 2011). By the year 2011, the District population density was estimated to be 143 persons per sq mile (55.2 people per sq km). NOTE: 1 square mile is equal to 2.59 square km; to change from density as per sq km, divide by 0.386 to get population density in square miles. The Mwanga District is administratively divided into 20 wards: Chomvu, Jipe, Kifula, Kighare, Kileo, Kilomeni, Kirongwe, Kirya, Kwakoa, Lang'ata, Lembeni, Msangeni, Mwanga, Mwaniko, Ngujini, Shigatini, Toloha, Kivisini, Mgagao, and Kigonigoni. Its administrative seat is Mwanga town (Mwanga Ward) with a population of 15,783 (2012 National Census).
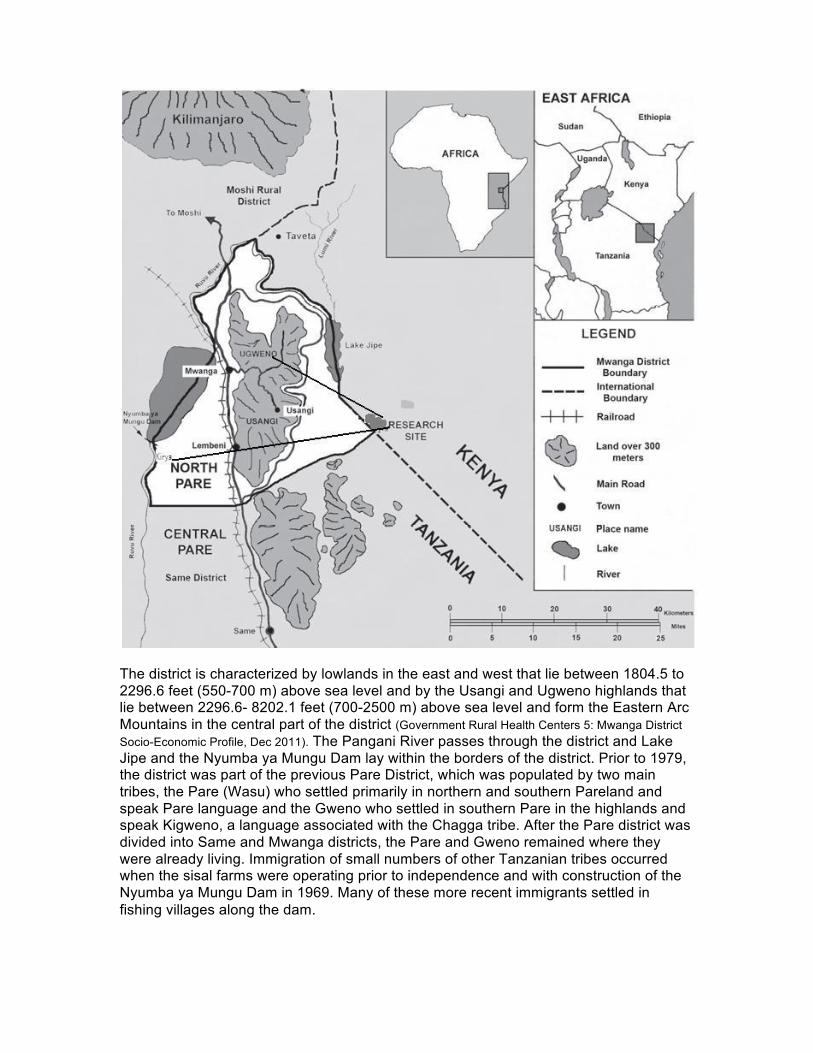
The district is characterized by lowlands in the east and west that lie between 1804.5 to 2296.6 feet (550-700 m) above sea level and by the Usangi and Ugweno highlands that lie between 2296.6- 8202.1 feet (700-2500 m) above sea level and form the Eastern Arc Mountains in the central part of the district (Government Rural Health Centers 5: Mwanga District Socio-Economic Profile, Dec 2011). The Pangani River passes through the district and Lake Jipe and the Nyumba ya Mungu Dam lay within the borders of the district. Prior to 1979, the district was part of the previous Pare District, which was populated by two main tribes, the Pare (Wasu) who settled primarily in northern and southern Pareland and speak Pare language and the Gweno who settled in southern Pare in the highlands and speak Kigweno, a language associated with the Chagga tribe. After the Pare district was divided into Same and Mwanga districts, the Pare and Gweno remained where they were already living. Immigration of small numbers of other Tanzanian tribes occurred when the sisal farms were operating prior to independence and with construction of the Nyumba ya Mungu Dam in 1969. Many of these more recent immigrants settled in fishing villages along the dam.
As described for the Kilimanjaro region as a whole, there are 2 distinct rainy seasons with short rains (Vuli) from October to December brought by the northeast winds coming overland and long rains (Masika) from March to June brought by the southeast trade winds coming from the Indian Ocean. Strong dry “anti-trade winds” blow east to west and affect rainfall to some extent. Temperatures range from 57.2’F (14’C) during June to 89.6’F (32’C) in January. Rainfall varies with topography. The Western Lowlands (476.1 sq miles or 1233 sq km) experience only 15.7-23.6” (400-600 mm) of rainfall annually. The soil is moderately deep but very stony. There are acacia type shrubs growing over the land. Population density (2010 estimates) is relatively low with only 115.3 persons per sq mi (44.5 persons/sq km) (NANOPDF.com; Government Rural Health Centers 5: Mwanga District Socio-Economic Profile, Dec 2011). Livestock raising (cattle, sheep, goats and chickens) is common. Some crop production occurs –mainly maize, sisal, legumes, paddy, finger millet, and potatoes. The Eastern Lowlands (231.7 sq miles or 600 sq km) have the same annual rainfall but the soil is sandy, clay and loamy. The population density is even sparser with only 46.6 persons per sq mile (17.3-19 persons/sq km), probably because of the less desirable soil. Agriculture is similar to the Western Lowlands but with less variety; some cotton and legumes are produced. Nyumba ya Mungu zone lies at 2296.6- 2460.6 feet (700-750 m) above sea level and receives only 15.7-23.6” (400-600 mm) annual rainfall. Soil is sandy. Minimal agriculture occurs here. Some fishing occurs primarily around the dam lake and families keep some cattle, goats, sheep and poultry. The highland zone include the Usangi and Ugweno highlands and cover ~808 sq km. Altitudes range from 2952.7 to 4265.1 feet (900-1300 m) above sea level. Annual rainfall is the highest of anywhere in the district at 31.5-49.2 inches (800-1200 mm). Soil is well-drained, deep, yellowish or reddish clay with moderate organic matter and there are grassy areas and trees dotting the hills. The population density is understandably higher in this zone. In 2002, it was 176 persons per sq mile (68 persons/sq km); by 2010, it was estimated to be up to 194 persons per sq mile (74.8 persons/sq km). Crop production includes coffee, bananas, maize, legumes, paddy, finger millet, and peas. Livestock is the same as in other zones –cattle, sheep, goats and chickens. Cultivated Land in the district: ♣ Total arable land = 44,300 ha (NOTE: 1 hectare (ha) = 2.47 acres)
♣ Area under crops cultivation 18,953.6 ha ♣ Area under cash crops production 2,454.0 ha ♣ Area under food crop production 16,499.6 ha ♣ Area cultivated by hand hoes 14,215.2 ha ♣ Area cultivated by Animal Power/Ploughs 3,790.7 ha ♣ Area cultivated by tractors 947.7 ha ♣ Potential area for irrigation farming 5,490.0 ha ♣ Area under irrigation farming 1,950.0 ha
The main economic activities in the district are agriculture, livestock keeping and fishing. Major food crops grown in the district are: maize, legumes, paddy (rice), bananas, fruits and vegetables. Coffee and sisal are the main cash crops. Chicken raising is common within the district with ~98,700 chickens. Large herds of cattle (~50,000 head), goats (~6500), and sheep (~22,240) are kept in both the Western and Eastern Lowlands. Disease is common amongst the livestock. There are reportedly 15 cattle dips within the
district but “all of them are not working”. There are 10 livestock health centers staffed by Livestock Field Officers, but “all of them are not working due to lack of facilities and poor infrastructures”. There are 11 “livestock dams” in the district, presumably to provide water for livestock. The animals, as well as, livestock products such as eggs, milk, and skins are a source of revenue as well as serving as a source of food and leather. The government’s report (NANOPDF.com; Government Rural Health Centers 5: Mwanga District Socio-Economic Profile, Dec 2011) helps further describe the nature of the farming in the district. As of 2011, Mwanga district had 6 areas where some irrigation farming is practiced: Kirya, Kivulini, Kileo, Kituri, Butu, and Kigonigoni. Problems with irrigation included “poor existing irrigation infrastructure” and limited application of the technology to potential areas for expansion of irrigation”. At the time of this governmental report, the district had 27 big tractors and 10 power tillers used for cultivating the land for farming. Only 21 of the big tractors were working; the other 6 needed repair. All the tractors and a third of the power tillers were privately owned with the remaining power tillers being owned by a farmer coop and 1 by a village government. Unlike in Same district, beekeeping is “not largely practiced” due to limited modern beehives and lack of working equipment for extraction of the honey and wax, although some raw honey is sold directly to local buyers. Men own the hives and any revenue occurring from the sale of honey. Fishing is limited to the Nyumba ya Mungu Dam. In 2010, there were 694 fishermen with 600 canoes, again all male. Fishing at Lake Jipe was stopped due to invasion of water reeds and other plants along the shore that prevented access to the lake. The district has 445 sq km (~172 sq miles) of game reserve with hunting between June and March, although it is not clear how much revenue this activity generates for the district. Elephants, giraffe, lions, water buffalo, and birds are the predominant animals (NANOPDF.com; Government Rural Health Centers 5: Mwanga District Socio-Economic Profile, Dec 2011). There is some micro-level industry with some milling machines and ~20 various other projects employing ~3000 people in total. There is no major industry within the district, although an ethanol plant was being constructed and there is one sisal processing plant at Lembeni Village that employees ~50-100 workers. A Japanese government study in the late 1980’s showed that there were commercially exploitable deposits of gypsum, copper, and clay within the district. Copper has been found in the Eastern Pare Mountains near Mwanga Township, but only one small-scale copper mine was under construction jointly with the Chinese at the time this report was being prepared (NANOPDF.com; Government Rural Health Centers 5: Mwanga District Socio-Economic Profile, Dec 2011). Poverty is a tremendous problem in the district where 5% of households are without land, only 0.17% of households have a tractor, and only 0.9% of households have an ox-plough. While 85% of the homes have iron sheet roofs or better and 73% of households have a radio, only 23% have bicycles for transportation. Daily manual wages are only 3,000 TSh ($1.30 USD based on exchange rate December 26, 2020). In 2009, the average per capital income in the district was only 810,871 TSh ($350.42) or approximately one-third of Tanzania’s national average. In 2002, 23% of Mwanga district households had electricity, which was above the national average of ~12%. But, by 2010, the number of household with electricity had only increased to 27%, indicating a slowing down of modernization. Availability of clean safe water is another major problem within the entire district, with only 56% of the population in rural areas having access to “clean” water and only 40% in Mwanga
Township having clean water. Most of the water is from shallow wells (56) with 10 deep wells (only 6 have electrical pumps, the other 4 require hand pumping) and 19 “gravity schemes”. Currently, the district has no special measures for management of both solid and liquid waste “because of lack of knowledge and funds for construction of structures required”. As a result, 93% of households in the district have permanent traditional pit latrines as their main type of toilet facility; 2.6% have no toilet facility and only 4.4% have modern latrines (NANOPDF.com; Government Rural Health Centers 5: Mwanga District Socio-Economic Profile, Dec 2011). Supposedly the World Bank has supported development projects through the Central Government-Rural Water Supply and Sanitation and Secondary Schools Development Program to construct boreholes and improve water supply and sanitation facilities in the district, but it is unclear as to the actual progress being made. According the 2011 district report, Mwanga has 88 pre-primary schools (all but 3 are government owned) with 3162 students enrolled. And, there are 41 secondary schools (25 government and 16 private) with 11,090 students enrolled in Form I-IV, but only 1174 students were enrolled in Form V-VI within the entire district. Also within the district are 7 registered Technical Schools (3 government owned and 4 private); no information was provided about enrollment and completion (NANOPDF.com; Government Rural Health Centers 5: Mwanga District Socio-Economic Profile, Dec 2011). Obstacles to improving education are lack of adequate teachers, a shortage of learning and teaching materials (including a lack of computers), weak local economies and lack of funding for school maintenance. While at the same time they report a serious lack of resources needed to educate the children within the district, government officials worry about the “low fertility rate due to change of way of living” as adversely affecting the number of school aged children. Both sexes have equal opportunity for enrollment in formal education. In fact, the completion rate for STD VII education in the district in 2011 reportedly was 87% for girls compared to 83% for boys. Of the total of 28,446 students who were enrolled in primary schools, however, only 410 were disabled children or 1.4% of the total number of enrolled students, a number that is likely only a fraction of the total disabled population eligible for public education. In additional, only 61 “vulnerable” children (children who have no support from any source –“their living depend on their own efforts”) were enrolled. So, while equal opportunity may be true for both boys and girls under the law, the true inclusivity of the schools appears to be less than universal for children of disability or those living in extreme poverty. Within the district, the government health facilities include: 37 dispensaries, 5 rural health centers and 1 hospital in Usangi with 150 beds for a population of ~131,442-145,000 people (2011 estimated population). For comparison, in the US, there are 6146 hospitals for 328.2 million people (2019 estimated population) and 2.5 acute care hospital beds per 1000 population (Kaiser Family Foundation Analysis of OECD data, 2017). In addition, within the district there are 6 voluntary health service facilities (suspect that these are birthing centers) with 6 dispensaries and a total of 16 beds. There are 257 traditional birth attendants, 84 traditional healers, and 49 village health workers (NANOPDF.com; Government Rural Health Centers 5: Mwanga District Socio-Economic Profile, Dec 2011). Based on number of available beds, it would appear that most births in the district are occurring at home. The top ten diseases in the district include: malaria, diarrhea, pneumonia, eye diseases, worms (intestinal parasites), skin diseases, ARI (acute respiratory infection?), cardiovascular disease, ear diseases, HIV/AIDS, and TB. HIV/AIDS is a pandemic disease. In 2007, the reported HIV/AIDS prevalence rate in the district was 4%. The
district government has tried to reduce the rate by providing HIV education “through public sensitizations” in all 20 wards, providing HIV testing, training of Home Based Service Providers, providing education to women in childbearing age on ways to prevent mother to child transmission of HIV and “creating HIV/AIDS awareness in schools. The government tries to help people living with HIV/AIDS by providing some food, fare to attend clinics, capital to start small business, and home based care and counseling, but the majority of the limited budget is for anti-retro viral drugs. In 2010, the reported prevalence of HIV positivity within the district was 1.27% based on a voluntary testing program of 8472 people (4373 women and 4099 men) “mostly between the ages of 15-50 years” with 108 testing positive. During the same year (2010), pregnant women are encouraged to attend clinics. Ninety-six percent of women attending those clinics were counseled and tested (3124 out of 3267 total women seen) and 102 (3.3%) of the women tested positive –a number nearly 2x the reported HIV rate for the district. During that period, 83 children were live born by HIV positive women and 4 tested positive (4.8%) although there are no details regarding timing of this testing or about follow-up. Within the district, the rate is stated to be higher in urban areas compared to rural areas. Mwanga Township, the major urban area in the district, reportedly has a rate of 2.7% (NANOPDF.com; Government Rural Health Centers 5: Mwanga District Socio-Economic Profile, Dec 2011). All adult people are allowed to participate in social groups, “depending upon the nature and objectives of the group”; “there are Social Groups whose members are all women and others whose members are all men, and there other Groups who have members of mixed sexes”. Mwanga District has “been insisting on gender balance in economic, social, and political aspects” and has been “sensitizing the community” in all aspects of equality in political representation of both women and men in decision making bodies at all levels of representation. It has also insisted on equal provision and accessibility in all economic and social services and government administration systems for both men and women “regardless of their sex, age, and physical appearance”. Most of Tanzania, especially in rural areas, remains a patriarchal society however. Family property or wealth remains “under control of the head of the family, where the head is a man, family property is under his control (NANOPDF.com; Government Rural Health Centers 5: Mwanga District Socio-Economic Profile, Dec 2011). Africa is a continent gifted with an incredible diversity of ecosystems, natural resources and economic activities, but it is also characterized by widespread poverty and human insecurity. Climate change represents a threat and challenge to Africa because many households, social groups, villages and entire regions have a limited capacity to adapt to climate variability and change. Vulnerability to climate change is shaped by the complex interaction of social, political, economic, cultural and environmental factors, all of which are likely to be affected by the projected impacts of climate change (International Journal of Environmental Protection, Nov.2013, Vol. 3Iss. 11, PP. 29-38). For example, climate change will have a direct effect not only on rain-fed crops, but also on water storage, putting increased stress on water availability for irrigation. Since availability of water will be limited, agriculture will compete for water, further stressing farming systems and all sectors of communities dependent upon water for other uses, such as domestic and cattle raising. This will lead to direct or indirect impacts on the increasing population, socio-economic activity across the continent, local and national revenue, decreased availability of land and non-renewable resources, and increasing regional conflicts. The adaptive capacity of subsistence farmers and poor will decrease further, and worsening poverty, malnutrition and starvation will likely follow, further stressing social institutions.
Originally the district was said to have a “very good environment in terms of forests and ever green land with favorable rains for crop production and enough water for both human and livestock consumption” (NANOPDF.com; Government Rural Health Centers 5: Mwanga District Socio-Economic Profile, Dec 2011). Mwanga district, like many other districts in the region are facing a serious environmental threat due to deforestation, however, which is destroying natural forests and leading to loss of adequate rainfall and loss of natural underground water sources. Climate change is further compounding the problems with droughts, flooding, and fires. Agricultural practices currently in use like overgrazing, shifting cultivation (a form of agriculture, used especially in tropical Africa, in which an area of ground is cleared of vegetation and cultivated for a few years and then abandoned for a new area until its fertility has been naturally restored), deforestation, unsustainable farming (practices that do not maintain or restore the soil to a condition that can support plant life), overstocking, and poor land management in general are reducing adaptive capacity. Land-use options that increase the adaptive capacity of subsistence farmers and help them be less vulnerable to climate change impacts are urgently needed. Adapting to changes in long-term climate averages may be feasible through technology and what is called germ plasma transfer, although the challenges are greater in semi-arid tropics. Traditional resource management adaptations, such as agroforestry systems, may provide more options for farmers. For example, tree-based systems are more profitable and less risky than other agricultural options because of the variety of products produced. The deep root systems of trees are able to explore a larger soil volume for water and nutrients that help during droughts. Trees promote increased soil porosity, reduced runoff and increased soil cover leading to increased water infiltration and retention in the soil that can reduce moisture stress during low rainfall years (International Journal of Environmental Protection, Nov.2013, Vol. 3Iss. 11, PP. 29-38). There is urgent need for intensifying government efforts to generate products and services in agroforestry systems; by integrating trees in agriculture landscape, cultural landscape, protecting watersheds and adjacent natural forest, and restoring ecosystems. The district has enacted By-Laws to protect the environment. In 2011, it started a special project, “Keep Mwanga Green and Clean” and encouraged planning of trees in schools, village government tree farms, and around households with a goal of planting 500,000 new trees every year. “This measure is expected to change the weather, causing more rains, reduce soil erosion, and hence, restoring good environment and sustaining it” (NANOPDF.com; Government Rural Health Centers 5: Mwanga District Socio-Economic Profile, Dec 2011). There is no information available as to how well this program is working or from where the resources for paying for it are coming. The existing complex land tenure and land use conflicts, along with environmental factors and a region’s geography are key in determining how well interventions will work in local districts. The Mwanga district is shaped by the configuration of the Eastern Arc Mountains (North Pare Mountains), river valleys, plateaus and the plains dipping into the Pangani Valley. This topography is reflected in the natural vegetation, the manner in which land is used, types of crops cultivated and how agroforestry has been adapted locally. Agroforestry is a climate-smart production system that sustainably diversifies environmental and socio-economic benefits for subsistence farmers, and is therefore considered more resilient to increased intensity of extreme weather events than monocropping. In order to understand the role of agroforestry as a viable adaptation to increased climate variability, Sokoine University of Agriculture’s Department of Forest Biology conducted a survey in the early 2010’s to look at how populations in Mwanga
District are coping with current climate variability and extreme events and to assess the potential of agroforestry systems in buffering smallholders farmers against climate change and variability (International Journal of Environmental Protection, Nov.2013, Vol. 3Iss. 11, PP. 29-38). Research methodologies used included literature review, questionnaire, and ecological survey. A sample of 103 households engaged in agro forestry (AF) and non-AF households were selected randomly from three villages for ecological study involving an inventory of on-farm trees and a questionnaire survey for collecting socio-economic data. The diversity of benefits in AF practices such as food (59.2%), fodder (58.2%), selling livestock (71%), fruits (54.4%), timber (27.2%) and fuel-wood (45.7%) revealed an increase in farmers resilience during environmental extremes and climate variability. AF practitioners were richer than non-AF practitioners with an extra income of $618 USD annually. The researchers concluded that crop integration and diversity in agroforestry systems were among the resilient features that reduced farmers’ risk from total crops failure, since the risk of losses from environmental hazards was spread among different crop species. Further increased income as a result of the diversity of products from the agroforestry system (AFS) enhanced the resilience of AF practitioners. Over time, the improved nutrition and income for AF households would lead to further benefit for the entire district, as well. Compiled and written by Holley Bzdega, December 28, 2020; revised Dec 30, 2020