Embed Size (px)
Citation preview

Schlumberger-Private
Paal KibsgaardChairman and CEO
2018 Barclays CEO Energy-Power Conference
New York, September 4, 2018
Schlumberger-Private
2
This presentation contains “forward-looking statements” within the meaning of the federal securities laws — that is, statements about the future, not about
past events. Such statements often contain words such as “expect,” “may,” “believe,” “plan,” “estimate,” “intend,” “anticipate,” “should,” “could,” “will,” “see,”
“likely,” and other similar words. Forward-looking statements address matters that are, to varying degrees, uncertain, such as statements about our financial
and performance targets and other forecasts or expectations regarding, or dependent on, our business outlook; growth for Schlumberger as a whole and for
each of our product lines (and for specified products or geographic areas within each product line); oil and natural gas demand and production growth; oil and
natural gas prices; rig activity, pricing; access to sand; improvements in operating procedures and technology, including our transformation program; our stock
repurchase program and dividend strategy; capital expenditures by Schlumberger and the oil and gas industry; the business strategies of Schlumberger’s
customers; the success of Schlumberger’s SPM projects; the success of Schlumberger’s acquisitions, joint ventures and alliances; future global economic
conditions; and future results of operations. These statements are subject to risks and uncertainties, including, but not limited to, global economic conditions;
changes in exploration and production spending by Schlumberger’s customers and changes in the level of oil and natural gas exploration and development;
general economic, political and business conditions in key regions of the world; foreign currency risk; pricing pressure; weather and seasonal factors; the
inability to procure or produce sand; our inability to meet our financial and performance targets and other forecasts or expectations, such as revenue and free
cash flow conversion; operational modifications, delays or cancellations; production declines; the inability close pending transactions; changes in government
regulations and regulatory requirements, including those related to offshore oil and gas exploration, radioactive sources, explosives, chemicals, hydraulic
fracturing services and climate-related initiatives; the inability of technology to meet new challenges in exploration; and other risks and uncertainties detailed
in our most recent Forms 10-K, 10-Q, and 8-K filed with or furnished to the U.S. Securities and Exchange Commission. If one or more of these or other risks
or uncertainties materialize (or the consequences of such a development changes), or should underlying assumptions prove incorrect, actual outcomes may
vary materially from those reflected in our forward-looking statements. The forward-looking statements speak only as of the date of this presentation, and
Schlumberger disclaims any intention or obligation to update publicly or revise such statements, whether as a result of new information, future events or
otherwise.
Safe Harbor
Schlumberger-Private
3
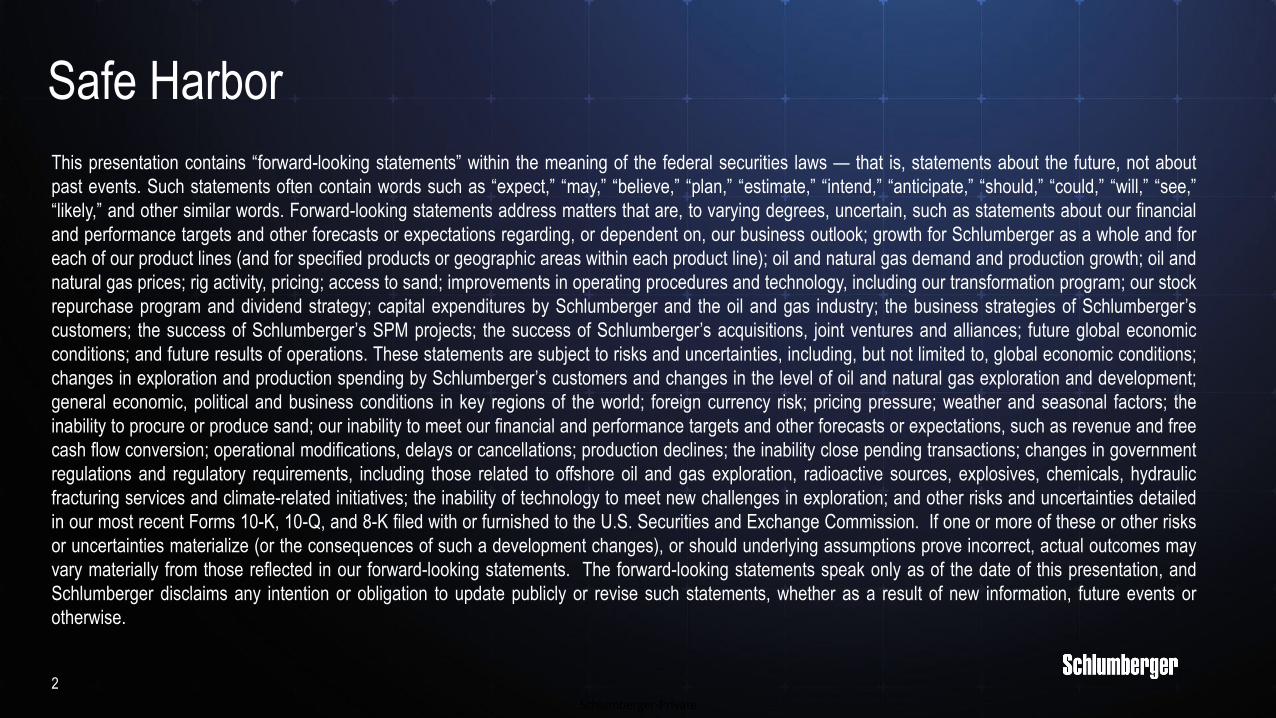
Key Questions
Why the need
for increased
E&P investment?
Why will Schlumberger
generate the best returns
in the coming upcycle?
Why is Schlumberger
best positioned to
capture the growth?
Schlumberger-Private
Why the need for increased E&P investment?
4
Schlumberger-Private
0
200
400
600
800
1,000
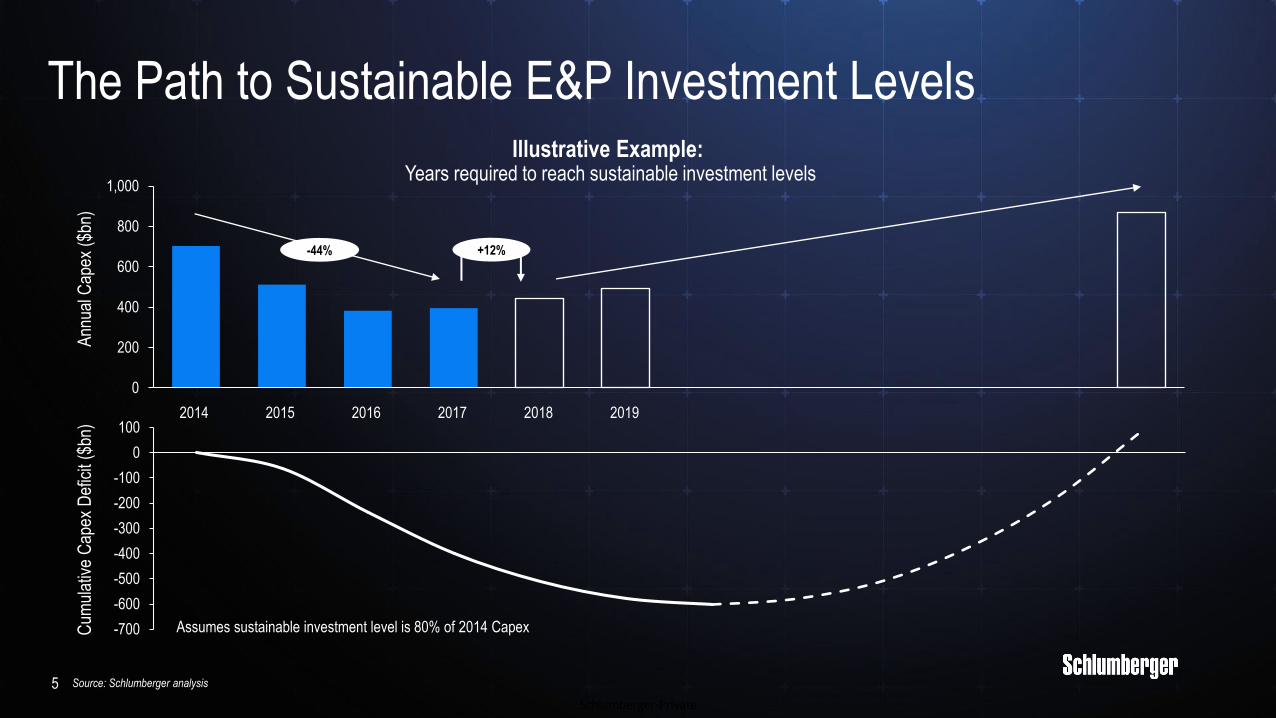
The Path to Sustainable E&P Investment Levels
5
-700
-600
-500
-400
-300
-200
-100
0
100
Illustrative Example: Years required to reach sustainable investment levels
-44%
20162014 2015 20192017 2018
+12%
Ann
ual C
apex
($b
n)C
umul
ativ
e C
apex
Def
icit
($bn
)
Assumes sustainable investment level is 80% of 2014 Capex
Source: Schlumberger analysis
Schlumberger-Private
0
10
20
30
40
50
6
24
20
28
kbbpd
2014 2016 2017
Base Production
Pre-2014FIDs
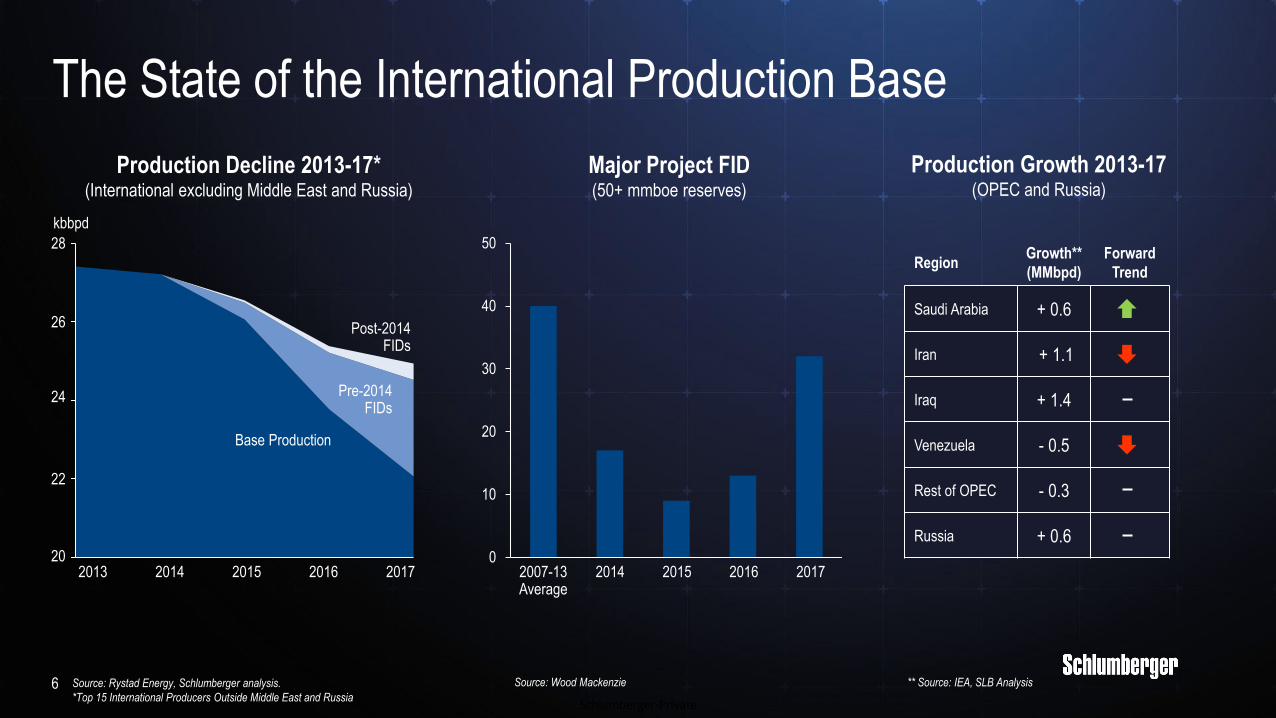
The State of the International Production Base
Production Decline 2013-17*(International excluding Middle East and Russia)
Major Project FID(50+ mmboe reserves)
Production Growth 2013-17(OPEC and Russia)
2007-13Average
20162014 2015 20172013 2015
Post-2014FIDs
RegionGrowth**
(MMbpd)
Forward
Trend
Saudi Arabia + 0.6
Iran + 1.1
Iraq + 1.4
Venezuela - 0.5
Rest of OPEC - 0.3
Russia + 0.6
26
22
Source: Rystad Energy, Schlumberger analysis.
*Top 15 International Producers Outside Middle East and Russia
Source: Wood Mackenzie ** Source: IEA, SLB Analysis
Schlumberger-Private
7
0
2
4
6
8
10
12
2010 2013 201620122011 2014 2015 2017
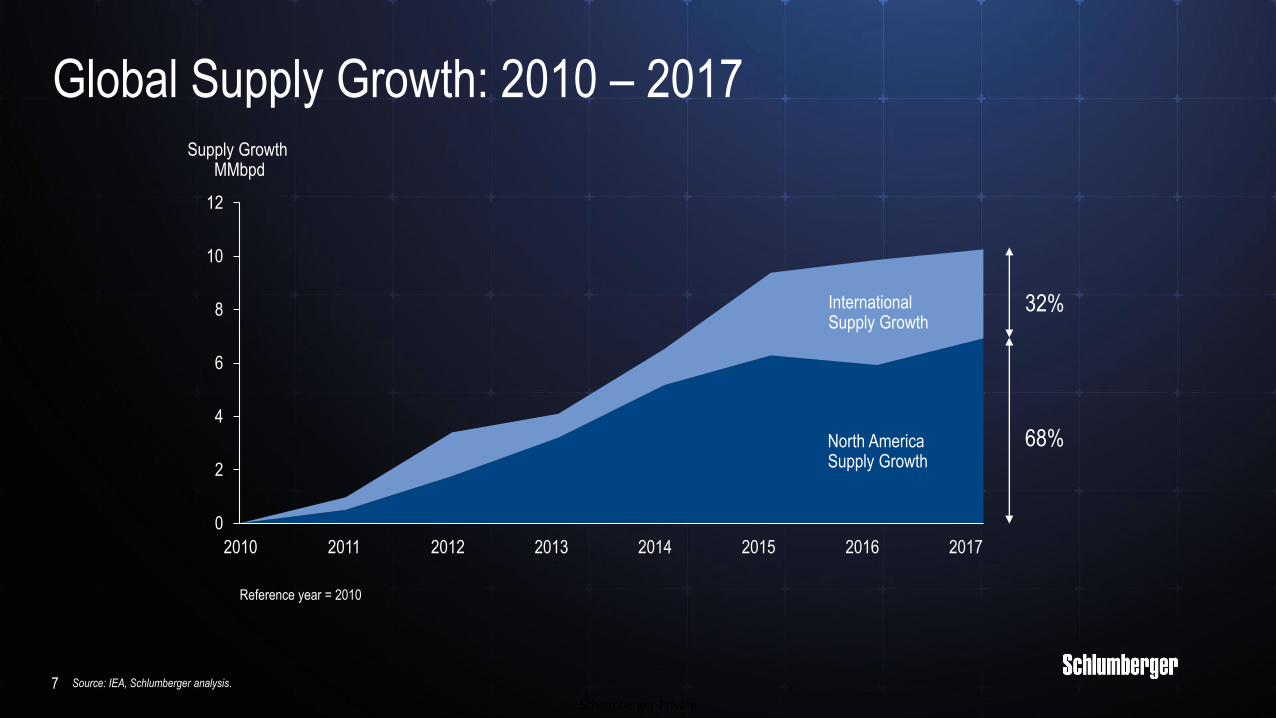
North AmericaSupply Growth
Global Supply Growth: 2010 – 2017
Reference year = 2010
InternationalSupply Growth
Source: IEA, Schlumberger analysis.
Supply Growth MMbpd
68%
32%
Schlumberger-Private
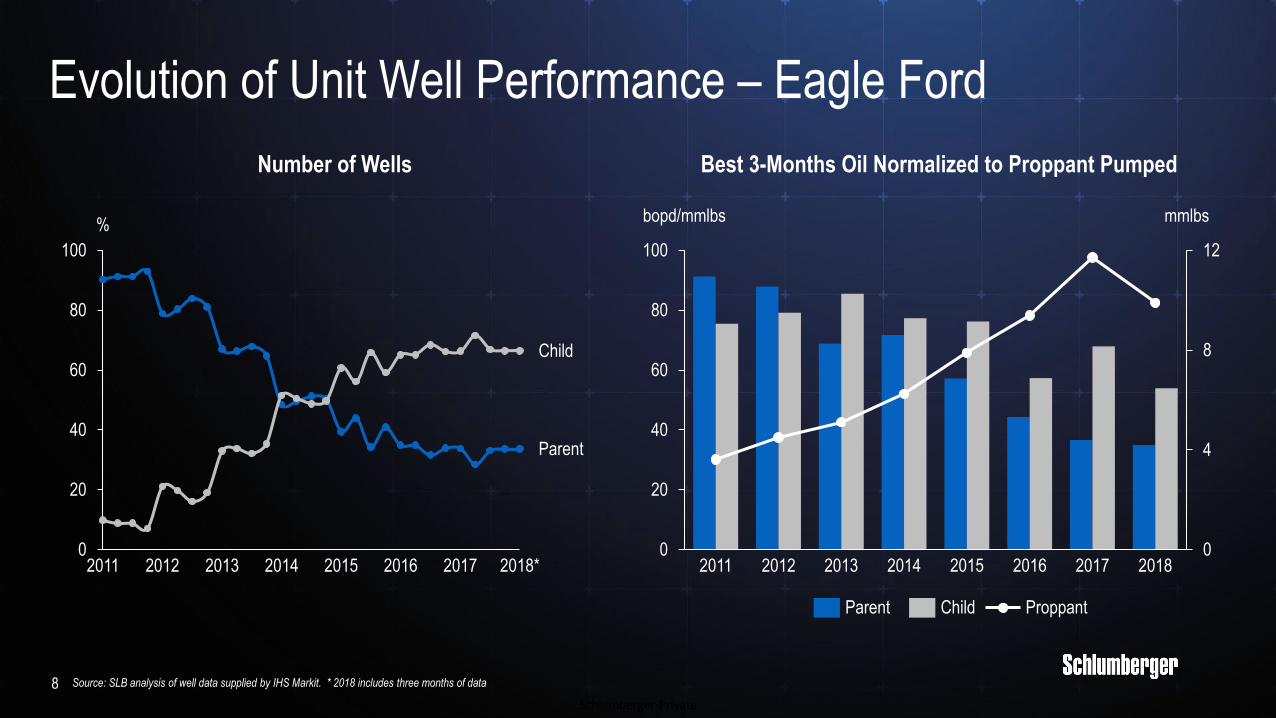
Evolution of Unit Well Performance – Eagle Ford
0
20
40
60
80
100
2014
%
20122011 20162013 2015 2017 2018*
Parent
Child
0
4
8
12
0
20
40
60
80
100
2014
mmlbs
20132011 2012 2015 2016 2017 2018
bopd/mmlbs
ChildParent Proppant
Best 3-Months Oil Normalized to Proppant PumpedNumber of Wells
Source: SLB analysis of well data supplied by IHS Markit. * 2018 includes three months of data8
Schlumberger-Private
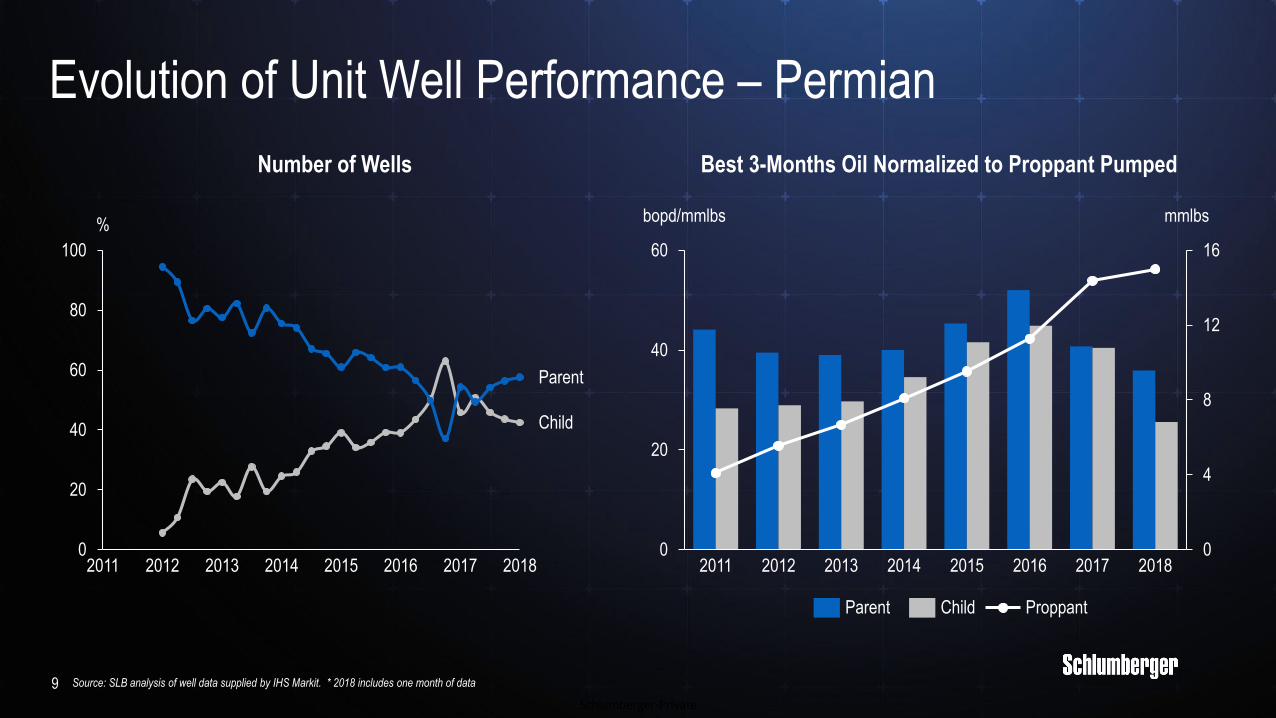
0
20
40
60
80
100
%
20152011 20172012 201620142013 2018
Child
Parent
0
4
8
12
16
0
20
40
60
mmlbs
20182015
bopd/mmlbs
20162011 2012 2013 2014 2017
ProppantParent Child
Best 3-Months Oil Normalized to Proppant PumpedNumber of Wells
Source: SLB analysis of well data supplied by IHS Markit. * 2018 includes one month of data9
Evolution of Unit Well Performance – Permian
Schlumberger-Private
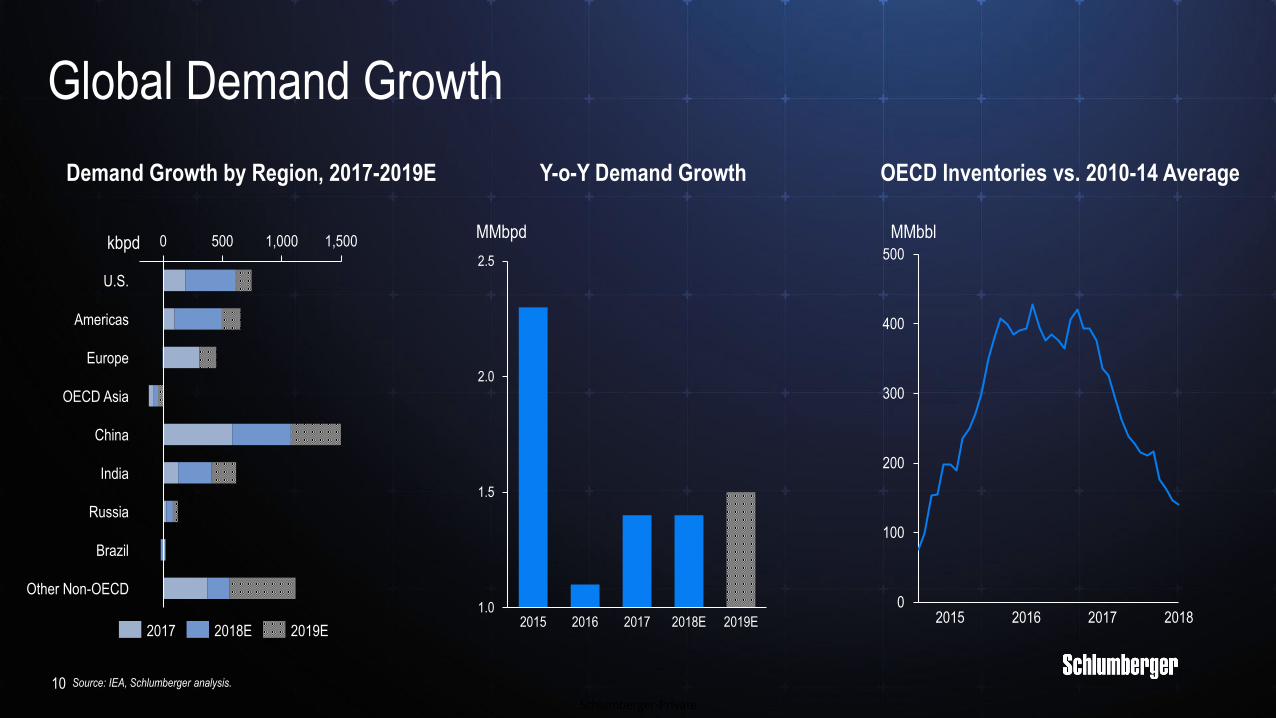
Global Demand Growth
10
1,5005000 1,000
U.S.
Americas
Europe
OECD Asia
China
India
Russia
Brazil
Other Non-OECD
2017 2019E2018E
Demand Growth by Region, 2017-2019E
0
100
200
300
400
500
20172015 2016 2018
OECD Inventories vs. 2010-14 Average
1.0
1.5
2.0
2.5
2018E20172015 2016 2019E
Y-o-Y Demand Growth
kbpdMMbpd MMbbl
Source: IEA, Schlumberger analysis.
Schlumberger-Private
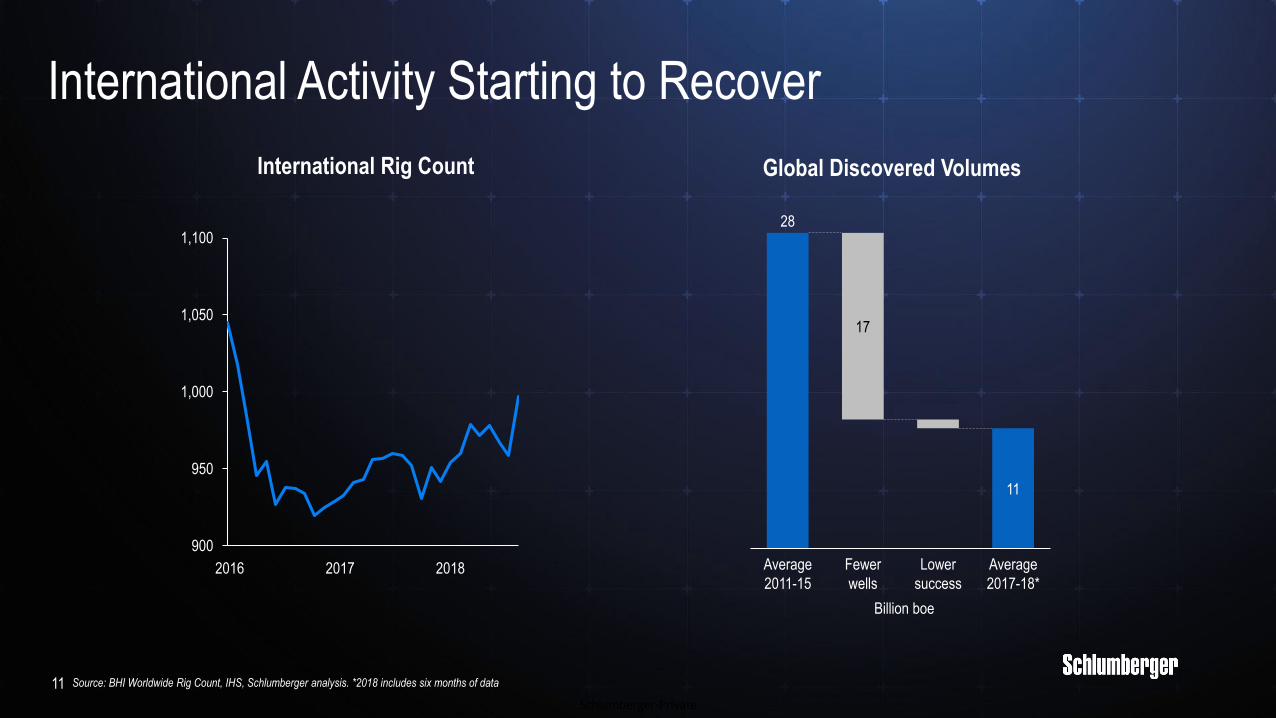
International Activity Starting to Recover
11
Global Discovered Volumes
900
950
1,000
1,050
1,100
2016 2017 2018
International Rig Count
Billion boe
Source: BHI Worldwide Rig Count, IHS, Schlumberger analysis. *2018 includes six months of data
Average
2011-15
17
Fewer
wells
Lower
success
Average
2017-18*
11
28
Schlumberger-Private
12
Why is Schlumberger best positioned to capture the growth?
Schlumberger-Private
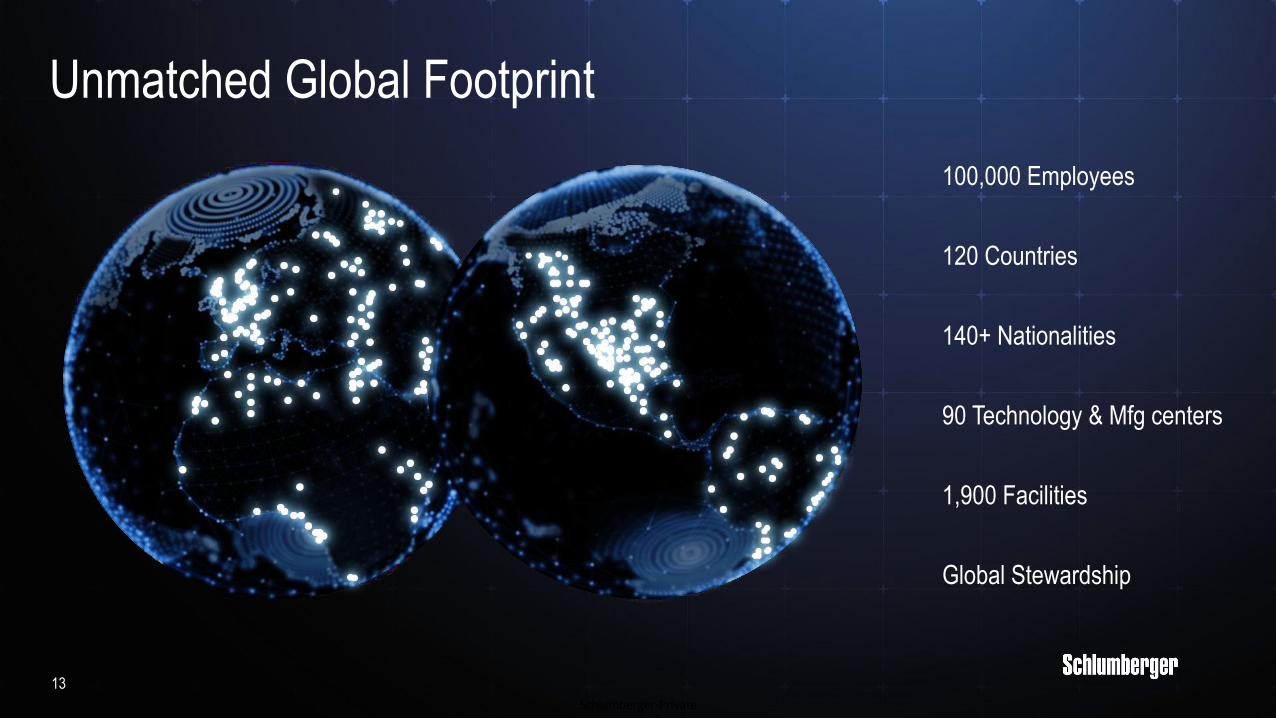
Unmatched Global Footprint
13
100,000 Employees
120 Countries
140+ Nationalities
90 Technology & Mfg centers
1,900 Facilities
Global Stewardship
Schlumberger-Private
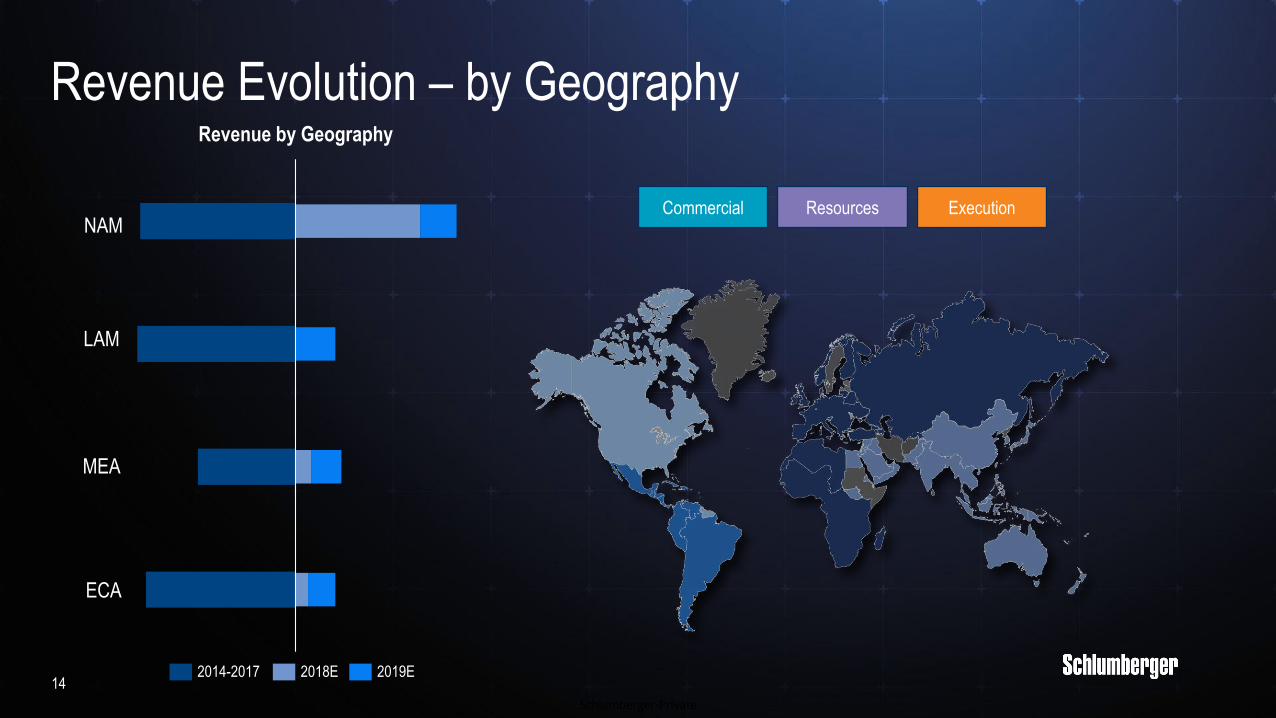
Revenue Evolution – by Geography
14
Revenue by Geography
NAM
LAM
MEA
ECA
2018E 2019E2014-2017
Commercial Resources Execution
Schlumberger-Private
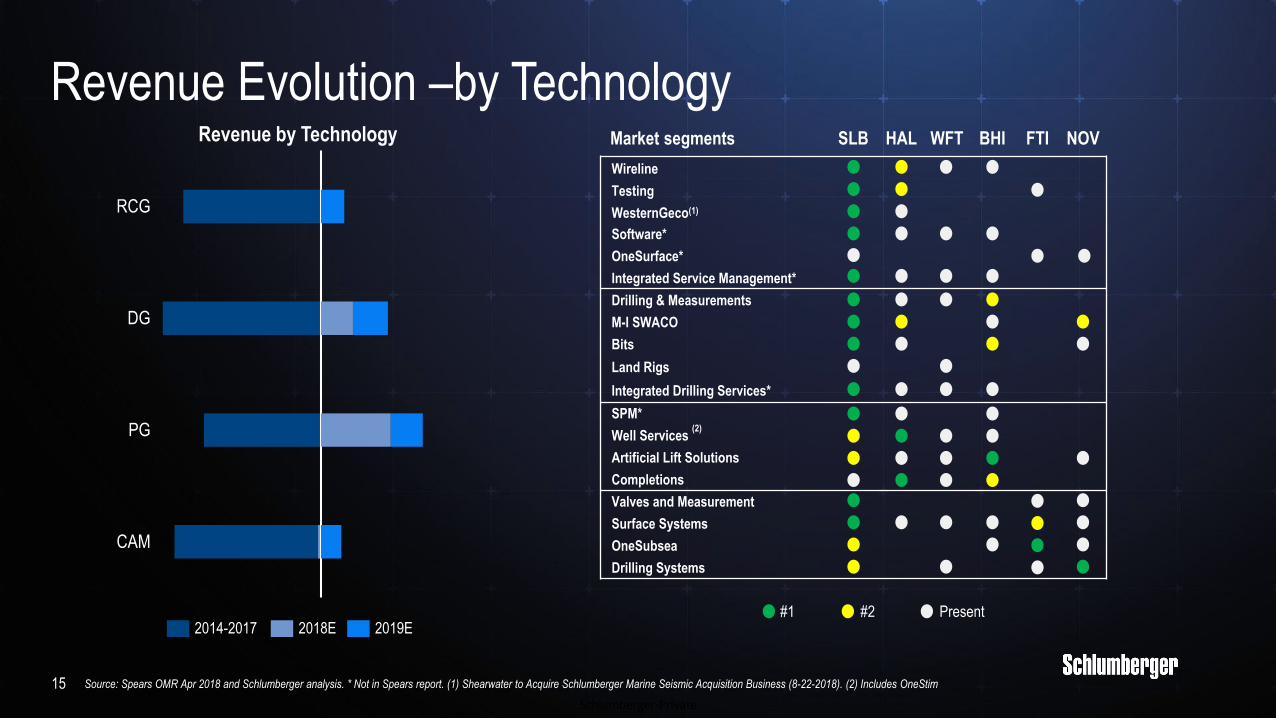
Revenue Evolution –by Technology
Source: Spears OMR Apr 2018 and Schlumberger analysis. * Not in Spears report. (1) Shearwater to Acquire Schlumberger Marine Seismic Acquisition Business (8-22-2018). (2) Includes OneStim15
#1 #2 Present
Market segments SLB HAL WFT BHI FTI NOV
Wireline
Testing
WesternGeco(1)
Software*
OneSurface*
Integrated Service Management*
Drilling & Measurements
M-I SWACO
Bits
Land Rigs
Integrated Drilling Services*
SPM*
Well Services (2)
Artificial Lift Solutions
Completions
Valves and Measurement
Surface Systems
OneSubsea
Drilling Systems
PG
RCG
DG
CAM
2014-2017 2019E2018E
Revenue by Technology
Schlumberger-Private
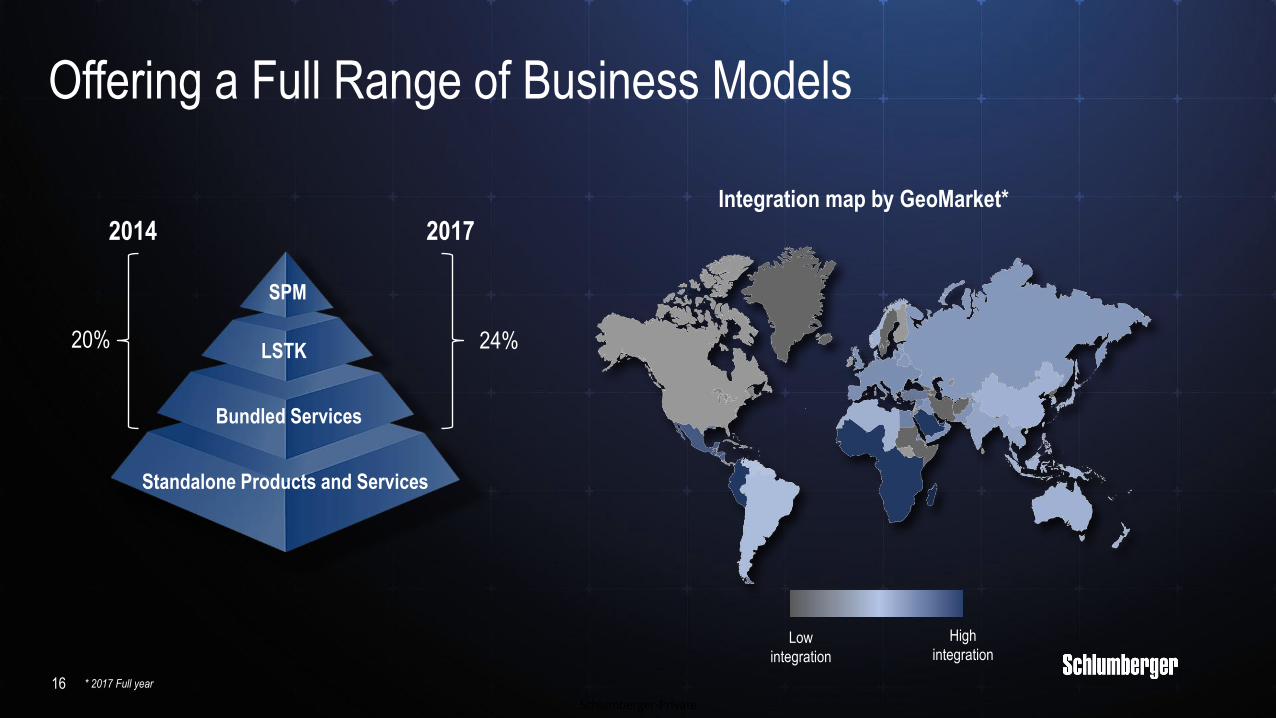
Offering a Full Range of Business Models
2014 2017
20% 24%
SPM
LSTK
Bundled Services
16
High
integrationLow
integration
Standalone Products and Services
Integration map by GeoMarket*
* 2017 Full year
Schlumberger-Private
17
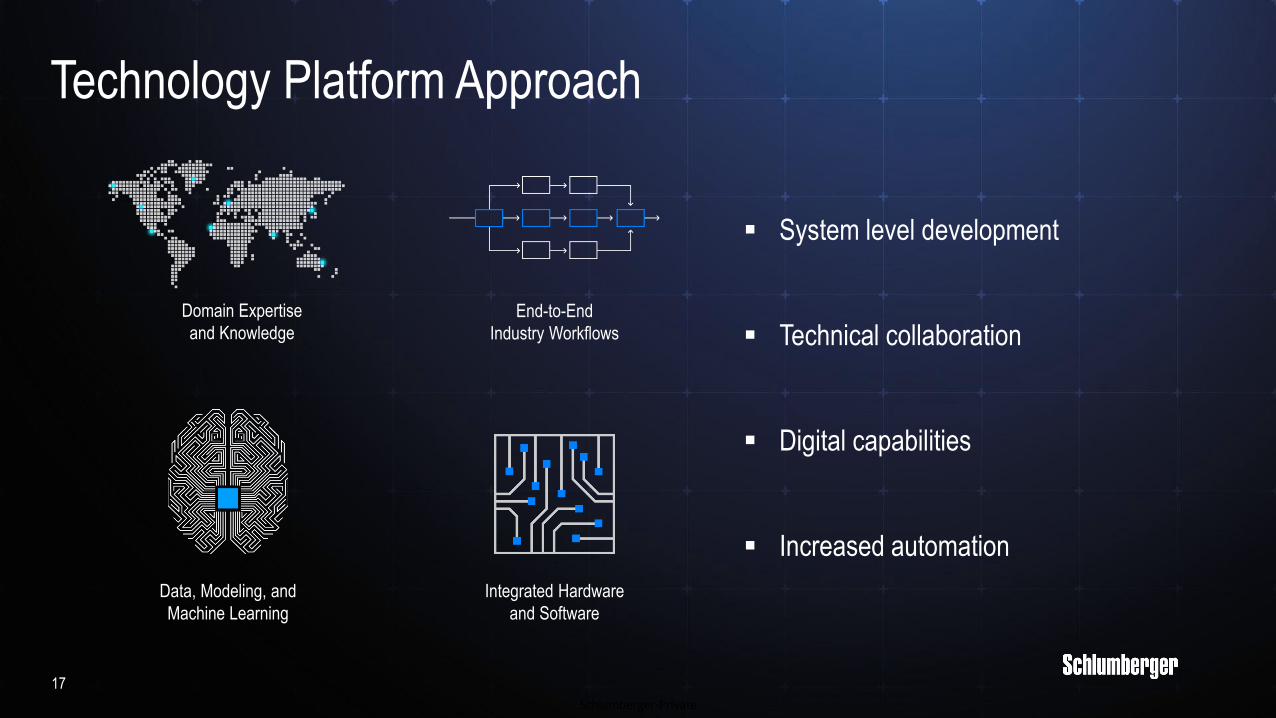
Technology Platform Approach
End-to-End
Industry Workflows
Domain Expertise
and Knowledge
Integrated Hardware
and Software
Data, Modeling, and
Machine Learning
▪ System level development
▪ Technical collaboration
▪ Digital capabilities
▪ Increased automation
Schlumberger-Private
18
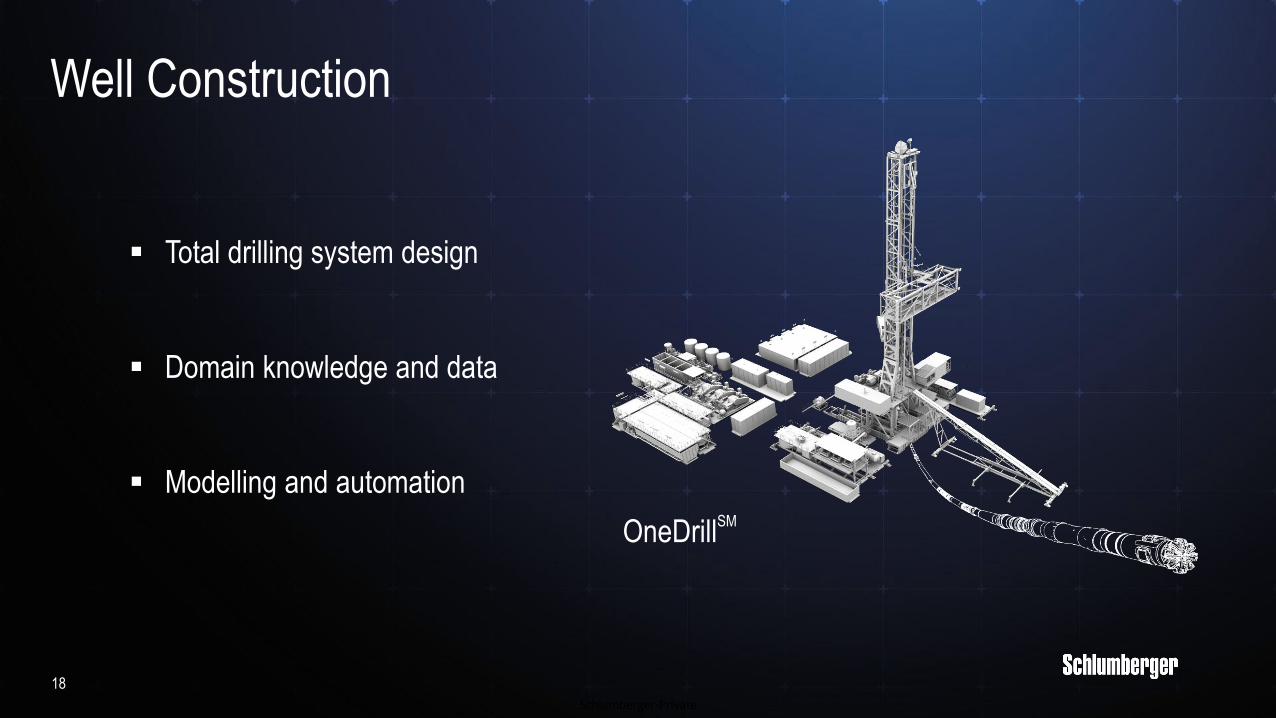
Well Construction
▪ Total drilling system design
▪ Domain knowledge and data
▪ Modelling and automation
OneDrillSM
Schlumberger-Private
19
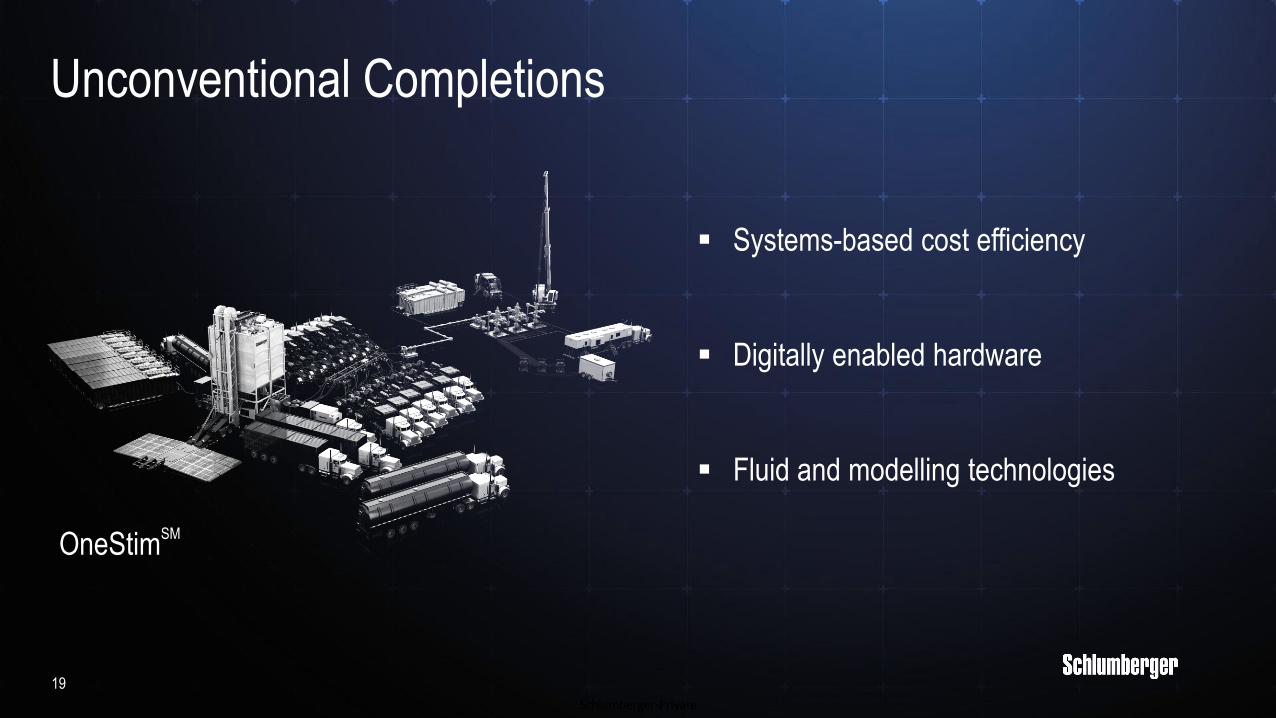
Unconventional Completions
▪ Systems-based cost efficiency
▪ Digitally enabled hardware
▪ Fluid and modelling technologies
OneStimSM
Schlumberger-Private
20
Why will Schlumberger generate the best
returns in the coming upcycle?
Schlumberger-Private
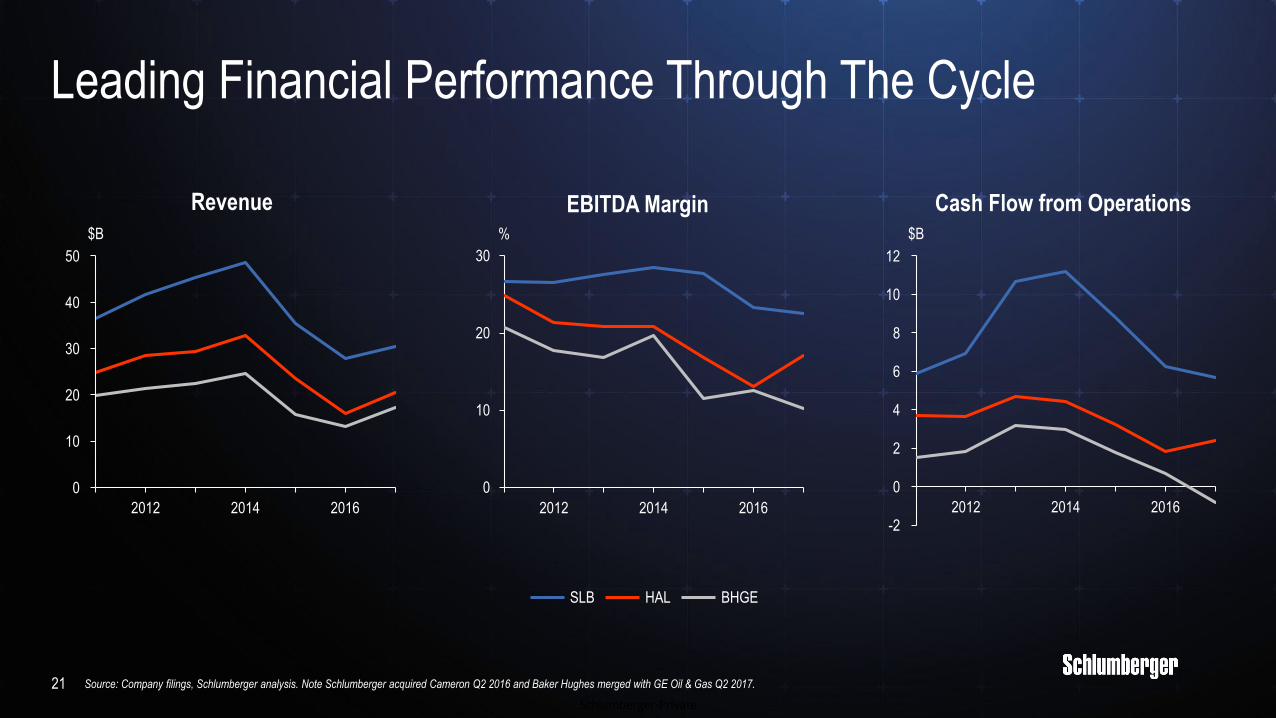
Leading Financial Performance Through The Cycle
21 Source: Company filings, Schlumberger analysis. Note Schlumberger acquired Cameron Q2 2016 and Baker Hughes merged with GE Oil & Gas Q2 2017.
Revenue EBITDA Margin Cash Flow from Operations
0
20142012 2016
20
10
30
40
50
$B
0
10
20
30
20142012 2016
%
2012 20162014
2
-2
0
4
6
12
8
10
$B
SLB HAL BHGE
Schlumberger-Private
22
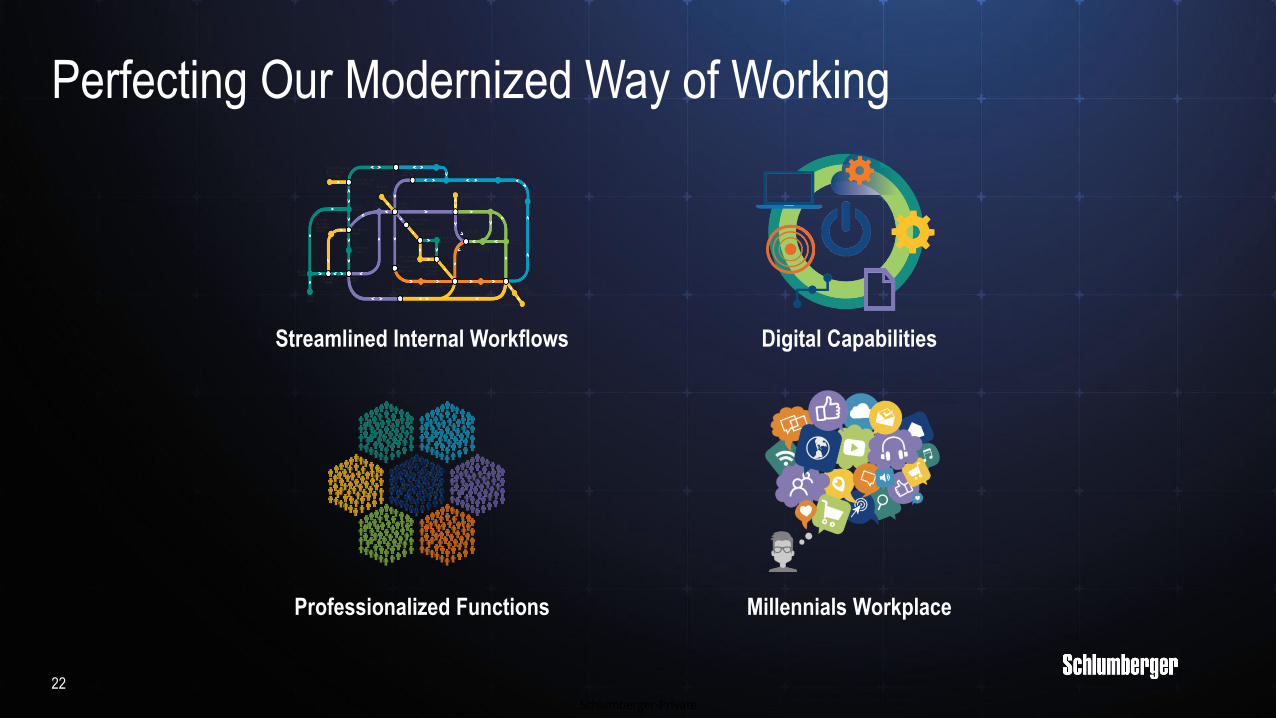
Perfecting Our Modernized Way of Working
Streamlined Internal Workflows Digital Capabilities
Professionalized Functions Millennials Workplace
Schlumberger-Private
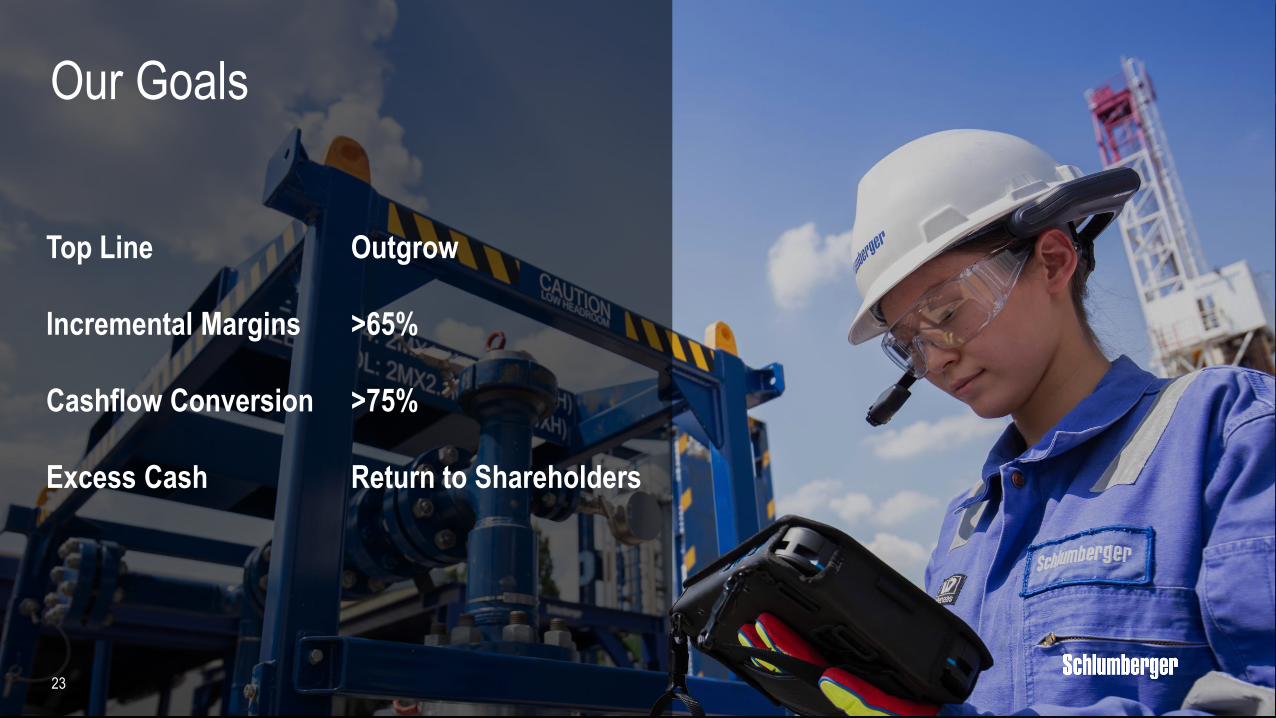
Top Line Outgrow
Incremental Margins >65%
Cashflow Conversion >75%
Excess Cash Return to Shareholders
23
Our Goals