Embed Size (px)
Citation preview


Volume 15 Issue 2 83 ©2014 IJAMS
VIII. CLASSIFICATION OF ITEMS AND PURCHASING STRATEGY USING MODIFIED KRALJIC MATRIX – A CASE STUDY OF LOCOMOTIVE MANUFACTURER IN
INDIA
S.K.Sharma Professor, Department of Mechanical Engineering, IIT, BHU, Varanasi, India
Rajnish Kumar PhD Scholar, Department of Mechanical Engineering, IIT, BHU, Varanasi, India &
Professor (IT), National Academy of Indian Railways, Vadodara, India Corresponding author email: [email protected]
Abstract: A case of Locomotive Manufacturer in India has been taken for tackling the issues of material/item categorization, types of contracts and structural changes in system. A quantitative model has been developed for identifying the item as strategic, development, bottleneck or normal. There are four decision variables; disruptions in supply, failure rate, technological intensiveness of item and price. Presently all items are dealt with same kind of tender and procedure but it has been found by research that such a strategy is unscientific and unproductive. The classic Kraljic model has been modified to suit the case, and to bring in objectivity a quantitative model has been built to classify the items. For each category of items a different strategy has been proposed. It is proposed to have a long term relationship with identified key suppliers for strategic items, for development items a Request for Proposal (RFP) must be floated, for bottleneck items supplier effort has to be ensured, the suppliers need to be educated. The institutional arrangement at the OEM for Supplier development is not adequate for attracting suppliers towards building long term relationships. There are more than 2 suppliers only for about 185 items out of 2258 items required for manufacturing the locomotive. It has been proposed that as a onetime measure special tender/bid can be obtained for Supplier development giving a chance to other suppliers excluding the existing ones. An attempt has been made to reduce the subjectivity in the decisions, by quantifying the four parameters/dimensions in the matrix. Reverse auctions have also been discussed as a strategy for procurement. Keywords: Kraljic’s Portfolio Matrix, classification of items, supplier development, reverse auctions, strategic procurement, failure rate, portfolio approach.
1. Introduction The supply chain issues mainly emanate from the fact the optimal number of suppliers are decided mainly on experience and then procurement strategy for all items is generally the same. It has been elaborated by Kraljic (1983) in his portfolio approach that for each class of items a different strategy ought to be adopted. There is case of a locomotive manufacturer where it is seen that the system is not designed for multiple strategies. On the other hand, the same set of norms and rules are applied in the purchase of an item irrespective
of their cost. In addition, the rules of public procurement apply to the Original Equipment Manufacturer (OEM). It is also subject to statutory audit; hence it is more necessary that the process be objective and transparent. The present study aims at providing a scientific basis to classify the items so that a strategy is defined for their procurement from item to item. The classification of items has to be done taking into account the factors affecting the supply chain. Some of them are disruptions in supply, failure Rate, price, complexity/technological intensiveness and supplier base. In the previous
IJAMS

S.K.Sharma, Rajnish Kumar
Volume 15 Issue 2 84 ©2014 IJAMS
models available, the decision to classify the items is either empirical or based upon the experience of the concerned persons in the purchase department. It was therefore felt that a model is needed to take care of some aspects so that the process becomes more objective and transparent. The model proposed here is unique as it has some objectivity in the decision making process by giving score on scales to items and then finding the median to determine the class of items. The techniques available have been applied to bring in a fair amount of objectivity in the decision making process. 2. Literature review The first comprehensive portfolio approach for the determination of a set of differentiated purchasing strategies was introduced by Kraljic (1983), the central idea of which being to minimize supply risk and make the most of buying power. As far as purchasing strategies are concerned there is no serious deviation in the approaches of the models by Kraljic (1983), Van Stekelenborg and Kornelius (1994), and Olsen and Ellram (1997). Bensaou (1999) and Gelderman and Van Weele (2000) have adopted a different approach by introducing the concept of power dependence in buyer-supplier relationship. Ellram (1998) have explored the concept of Total Cost of Ownership (TCO) to be used for acquisition decisions. Sislian et al (2000) have reviewed four frameworks for strategic sourcing and then proposed a new strategic sourcing framework. Lambert and Cooper (2000) suggest that the purchasers can focus their efforts on managing suppliers as opposed to placing orders and expediting the supplies. Padhi et al (2012) have provided a very objective methodology to classify and position the commodities in Kraljic’s Portfolio Model. Zolkiewski and Turnbull (2002) identified three sets of relationships—customer (existing and potential), supplier (existing and potential) and indirect (e.g., government, competitors, suppliers’ and regulatory bodies)—within a network. Cachon (2003) in the chapter reviews and extends the supply chain literature on the management of incentive conflicts with contracts. Beall et al
(2003) have concluded in their study that for a growing number of buying firms, e-Reverse Auctions (e-RA) have found an appropriate place in their strategic sourcing methods. Shang et al (2004) have discussed collaboration in multiple dimensions, such as cooperation, information sharing, and capacity planning. Talluri and Narsimhan (2004) have emphasized that Strategic sourcing is critical for firms practicing the principles of supply chain management. Marqueza and Blanchar (2004) have presented a simulation study to extend current methods for real options strategies in the management of strategic commodity-type parts. Martinez-de-Albeniz and Simchi-Levi (2005) have developed a general framework for supply contracts in which portfolios of contracts can be analyzed and optimized. Mathur and Shah (2008) have proposed a price compliance regime for contract where the penalties, in the form of price for non-compliance on quantity, are enforceable on both parties. 3. Existing system at the Locomotive
Manufacturer The Locomotive Manufacturer is the only company in India which manufactures diesel electric locomotives for Indian Railways. The locomotive manufacture is now heavily dependent on supply from other sources; this has become a pressing point as they have been several supply chain disruptions which have led to loss of manpower, and the associated opportunity cost. For purchasing, tenders can be obtained by either of the methods 1. By advertisement- Open Tender 2. By direct invitation to a limited number of
firms- Limited Tender 3. By invitation to one firm only- Single Tender Price is the main criteria in tendering system and aim of tendering is to obtain the best value possible for the money spent. Limited tendering system is to be adopted in case of procurement of

Classification of items and purchasing strategy using modified Kraljic matrix – a case study of locomotive manufacturer in India
Volume 15 Issue 2 85 ©2014 IJAMS
emergency items or when it is considered to be advantageous. The purchase process involves planning, ‘make or buy’ decision making, indent generation, tendering, supplier selection, purchase order placement and dispatch of material by supplier. Purchase cycle normally starts about one and a half year before the financial year in which material will be consumed. It starts with the approval of OEM’s internal production programme for a financial year. The programme is based on the production programme received from Railway Board. Production programme is given by Railway Board to OEM for two to three years. However, material list generated at the beginning of procurement cycle, i.e., one and a half year earlier, has to be same and only emergency indents are placed. The items have been classified in the Vendor/Supplier Directory on the basis of location and use. As far as the design of loco and production is concerned it is a scientific system, but from procurement point of view no distinction is made between items. Every case is dealt with the same set of rules and style. An ABC analysis is done every year for classifying the items on the basis of usage. But this classification has no bearing on the style of procurement/tender. The only function of this classification is to verify the accuracy of demand by the Finance Department. After that the normal tendering procedure is undertaken. A study of this procedure has revealed that it does not serve any useful purpose especially with regard to supplier development, supply chain disruption or special efforts for quality improvement. The study has confined to only the issues related to Supply Disruptions and possible ways to improve the present status. The analysis reveals that as any other typical organization, disruptions have been caused by very high value items like AC AC Traction System worth Rs 2.25 crore (Rs 22.5 million) to as low as Union or Nut worth Rs 100. These events may be sporadic but are a definite reason for concern as tremendous resources are wasted in follow up of routine small value items and an undesirable situation of being “hand to mouth” is
created as a result of which sometimes material has to be accepted, which has slight deviations from quality standards. 4. Development of Model for Sourcing In the field of Strategic Sourcing, seminal work has been done by Kraljic. He has defined four types of material, Strategic items (high profit impact, high supply risk), Leverage items (high profit impact, low supply risk), Bottleneck items (low profit impact, high supply risk),Non-critical items (low profit impact, low supply risk). The four stages of Purchase Sophistication as explained by Kraljic (1983) are shown in Figure 1.
Figure 1: Stages of Purchase Sophistication
Table 1 is the comparison of the various portfolio approaches (Dubois et al 2002).There does not seem to be any serious deviation in the approaches of the models by Kraljic (1983), Van Stekelenborg and Kornelius (1994), and Olsen and Ellram (1997). But in the models, Bensaou (1999) and Gelderman and Van Weele (2000) there is a difference in approach as they have introduced the power-dependence argument in the buyer-supplier relationship. Kraljic’s purchasing portfolio has been chosen as the basis as it seems to be the most effective tool for classification of items and subsequent formation of strategies for various purchase situations.
II
Materials Management
IV
Supply Management
I
Purchasing Management
III
Sourcing Management
Purchase Sophistication

S.K.Sharma, Rajnish Kumar
Volume 15 Issue 2 86 ©2014 IJAMS
Table 1: Comparison of purchase portfolio models
Portfolio Model Classification dimensions
Categories Action Plans Phases in developing a supply strategy
Kraljic (1983) Importance of purchasing Complexity of supply market
Materials/components Non-critical items Leverage items Bottleneck items Strategic items
Exploit Balance Diversify
1. Classification 2. Market analysis 3. Strategic positioning 4. Action plans
Van Stekelenborg and Kornelius (1994)
Control need of the internal market demand Control need of the external supply market
Supply situations Plain supply situation Internally problematic supply situation Externally problematic supply situation Complicated supply situation
Purchasing as effort manager Purchasing as demand manager Purchasing as supply manager Purchasing as integrative manager
1. Classify supply situation 2. Determine purchasing activities
Olsen and Ellram (1997)
Difficulty of managing the purchase situation Strategic importance of the purchase
Purchases Non-critical Bottleneck Leverage Strategic
Strengthen the relationship Improve the supplier attractiveness/the performance of the relationship Reduce the resources allocated to the relationship
1. Analysis of the company’s purchases 2. Analyse the supplier relationships 3. Develop action plans
Bensaou (1999) Buyer’s specific investments Supplier’s specific investments
Relationships Market exchange Captive buyer Captive supplier Strategic partnership
1. Classify relationships 2. Identify contextual profiles 3. Design management profiles
Gelderman and Van Weele (2000)
Supplier’s dependence Buyer’s dependence
Supply strategies Efficient processing Exploit power Volume insurance Balanced relationship
Although the Kraljic Model has inspired professionals and academicians alike but it has its own critics. The main criticisms are 1. How are the dimensions such as supply risk
and profit impact selected?
2. What are the factors that determine the dimensions of the model?
3. How will weight be assigned to these dimensions?
4. How can it be ensured that there is no subjectivity by the purchase manager in positioning the items in the matrix?

Classification of items and purchasing strategy using modified Kraljic matrix – a case study of locomotive manufacturer in India
Volume 15 Issue 2 87 ©2014 IJAMS
5. What is methodology for assessing the interdependency of suppliers within the organization?
6. How can just two dimensions lead to strategies for procurement?
7. How to differentiate between high and low risk?
The Kraljic model gives the conceptual framework for purchase management; the decision of categorization is on the basis of experience and does not give objectivity to the decision. Thus the most important question is whether the two dimensions are sufficient for the present case of a Locomotive manufacturer. The quantification of the dimensions is another important aspect as the subjectivity in decisions is questionable as it is a public organization, subject to various statutory checks and audits. For this a quantitative model has been attempted which can serve as a guide to the manager for categorizing the material to define the purchase strategy. The purchase and related managers in the OEM were asked to give their judgment on decision variables in categorization of items for defining their purchase strategy. The four variables that emerged on discussion are: 1. Disruptions in supply of the item 2. Failure Rate of the item 3. Price of the item 4. Complexity/Technological intensiveness of
the item The supplier base is not considered as a decision variable since in the case of OEM, this is still in a nascent stage and there are not enough suppliers for all items. In fact this categorization will be one of the tools used for determination of the optimal number of suppliers. All the mentioned four variables are to be compared in a matrix so that the item can be categorized for defining the purchase strategy. Kraljic’s model has classified the items into: 1. Non-critical items 2. Leverage items
3. Bottleneck items 4. Strategic items In the typical case of the Locomotive manufacturer, leverage is considered as Development item. There are many items for which enough supplier development efforts have not been made, some are very complex and many of them are just imported or bought from OEMs, who sometimes do not have the spare capacity for the items. The non-critical items has been redefined as Normal items, and it has a different connotation as it is felt that no item can be termed as non-critical but it may just be a normal item subject to routine disruptions and price/rate issues. The study of OEM’s system and with opinion of the officials, the items are to be classified into four categories with the two important variables associated with each class in order to build a workable quantitative model which can be plotted on two axes (Table 2). This has been done for simplification of the framework for quantitative modeling of the variables. The guiding factor behind the model is to make it practicable and simple, thus parameters which can easily be measured or for which database is available only have been used. Public procurement is subject to Statutory Audit and unless these are measurable it will be difficult to justify the decision.
Table 2: Variables associated with Category
I Strategic Complex Cost
II Development Complex Subject to supply disruptions
III Bottleneck Failure Rate Subject to supply disruptions
IV Normal Cost Failure Rate
5. Quantitative Model to identify category The four VARIABLES have been quantified as defined in the Table 3.

S.K.Sharma, Rajnish Kumar
Volume 15 Issue 2 88 ©2014 IJAMS
Table 3: Variables used for Classification of items
Disruptions in supply S Number of loco days lost compared to total days lost in the Decision Period by all suppliers for the subject item, expressed as %
Failure Rate F % of total supply of items by all suppliers
Price P Average price of item expressed as % of highest priced item
Complexity/ Technological intensiveness
C Scale 0 – 100, in steps of 10, where 10 is simplest to 100 which is most complex
Here all variables/dimensions have been compared on a scale of 100. The disruptions in supply for a particular item are compared to total loss in days by all items in the decision period. Similarly, the failure rate of an item is compared to the total supply of the item all suppliers. This will indicate the comprehensive failure rate of item without specifying the supplier, to establish its criticality with respect to its failure. The highest priced item in the organization is taken as the base for comparing all other items. The average price of the item is expressed as % of the highest priced item, thus placing it on a scale of 100. The fourth variable is still subject to some subjectivity and judgment of design engineer is paramount. But this parameter is one time exercise for all items, which can depend on type of material whether it is raw material, semi finished, fully finished, mechanical, electrical or electronic type, level of expertise available for dissipation of knowledge. Since the categorization of item in this category does not ensure any specific benefit to any supplier, this bit of subjectivity based on domain knowledge is acceptable, as the aim is to only reduce the subjectivity but it can never be eliminated. Since there are four variables the centroid can be plotted on the chart. The area in which the centroid falls, will determine the category of the item.
The simple geometry of polygon and calculation of centroid formula can be used to derive the equation for “centroid” of the item. A polygon is made up of line segments between N vertices (xi,yi), i=0 to N-1. The last vertex (xN,yN) is assumed to be the same as the first, i.e.: the polygon is closed.
Figure 2: Polygon with 6 vertices, N=6
The standard geometry formulae for calculating the centroid of the polygon are:
16
…1
16
…2
12
…3
Here,
Cx and Cy are coordinates of the centroid of the polygon and A is the area of the polygon
1
5
0
4
3
2
N=6

Classification of items and purchasing strategy using modified Kraljic matrix – a case study of locomotive manufacturer in India
Volume 15 Issue 2 89 ©2014 IJAMS
Figure 3: Graphical Representation of
Classification of Items
Figure 3, represents the polygon that is formed by the four variables, the points are:
, 0 , 0, , , 0 , 0,
Using these values in the equation for calculation of centroid of polygon, we get
12
…4
16
…5
16
…6
Here the values of all variables are the absolute values Now referring to Fig 3,
x0 P value y1 C value x2 S value
y3 F value The centroid can be calculated and region in which it falls will define the item’s category. By derivation from this formula above, using a simple worksheet in Excel, the position can be calculated and items classified accordingly, a few examples of historically critical have been explained. This is merely a guideline; the discretion of the Purchase Official is still must in the case. 6. Application of Model to Locomotive
Manufacturer There are about 2300 items required for producing the locomotive, and the classic ABC technique is used for classifying the items. But this has one flaw that it does not distinguish between critical and perennially troublesome items. The problem only surfaces once there is a crisis and then it is found that case was unmonitored and if timely action had been taken crisis could have been averted. There is no check in the system to alert on potential failures or some kind of predictive “maintenance” for the supply chain system. The model has been applied specifically to the items which caused disruptions in last three years 2009 to 2011 and items which figure in the traditional “A” category of the ABC analysis. As examples few of the cases are discussed below, and Table 4 depicts these sample items and their classification according to this model. It can be seen that several very small value items have entered the strategic domain due to this model. This may be considered as a flaw in the model, but from the organization’s point of view any item which halts the production becomes strategic. Such an anomaly should be taken as an alert, a few steps the item will turn into normal category. Thus the model results may defy logic, but when the items are analyzed many deficiencies can be found. Often in such a huge procurement system the small but critical components get left out. Also the main problem is all items are procured with the same set of rules, and the procedure for negotiation of rates is subject to public scrutiny.

S.K.Sharma, Rajnish Kumar
Volume 15 Issue 2 90 ©2014 IJAMS
Thus the main issue is devising an extremely transparent system of negotiation of rates.
Table 4: Classification of Items according to model
ITEM RATE in Rs Total loss in Loco
days(3 years)
Price P
Complexity C
Supply Disruption
S
Failure Rate
F
Category
xo y1 x2 y3
AC-AC Traction System
25836115 2211 100 90 7.49 3 I
TCC 19061099 1035 74 90 3.51 6 I
Alternator 7500000 247 29 100 0.84 10 I
Traction Motor 2671481 4390 10 90 14.87 15 II
Draft Gear 153618 222 1 80 0.75 8 II Union Elbow 153618 33 1 10 0.11 5 I
Master Controller 126575 885 0 90 3.00 5 II
Elbow 20847 168 0 10 0.57 15 III
TM Air Duct Boot 20847 48 0 10 0.16 20 III
L O Manifold 15447 200 10 10 0.68 14 IV
Table 5: Classification of items % wise
Type Number %
Strategic Items 16 8%
Development Items 54 27%
Bottleneck Items 70 35%
Normal Items 60 30%
Total 200
The first 200 items whose cost is significant have been analyzed using this method, in the Table 5 the percentage items in each category is shown 7. Contract types for procurement as per
the classification The various types of Contracts described by a few researchers Cachon (2005), Corbett (2004), Mathur et al (2008), Sislian et al (2000), Talluri et
al (2004), Tsay (1999), are summarized in Table 6 with their main features: Table 6: Types of Contract for Procurement Strategy
Type of Contract
Contracts for Product Availability and Supply Chain Profits
Buyback Contracts Revenue-Sharing Contracts Quantity Flexibility Contracts
Applicable in demand uncertainty conditions, thus not of relevance in current study as demand is fairly stable
Contracts to Coordinate Supply Chain Costs Applicable for regular items
Contracts to Increase Agent Effort Applicable for new products
Classification of items and purchasing strategy using modified Kraljic matrix – a case study of locomotive manufacturer in India
Volume 15 Issue 2 91 ©2014 IJAMS
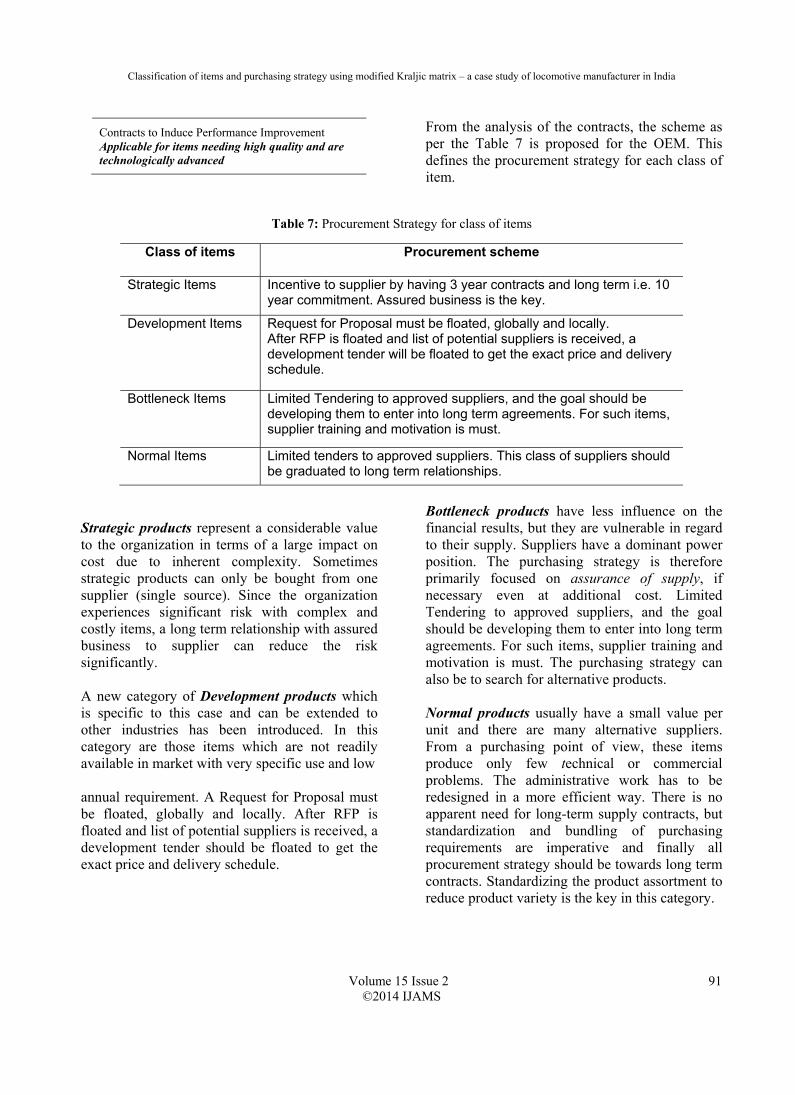
Contracts to Induce Performance Improvement Applicable for items needing high quality and are technologically advanced
From the analysis of the contracts, the scheme as per the Table 7 is proposed for the OEM. This defines the procurement strategy for each class of item.
Table 7: Procurement Strategy for class of items
Class of items Procurement scheme
Strategic Items Incentive to supplier by having 3 year contracts and long term i.e. 10 year commitment. Assured business is the key.
Development Items Request for Proposal must be floated, globally and locally. After RFP is floated and list of potential suppliers is received, a development tender will be floated to get the exact price and delivery schedule.
Bottleneck Items Limited Tendering to approved suppliers, and the goal should be developing them to enter into long term agreements. For such items, supplier training and motivation is must.
Normal Items Limited tenders to approved suppliers. This class of suppliers should be graduated to long term relationships.
Strategic products represent a considerable value to the organization in terms of a large impact on cost due to inherent complexity. Sometimes strategic products can only be bought from one supplier (single source). Since the organization experiences significant risk with complex and costly items, a long term relationship with assured business to supplier can reduce the risk significantly. A new category of Development products which is specific to this case and can be extended to other industries has been introduced. In this category are those items which are not readily available in market with very specific use and low annual requirement. A Request for Proposal must be floated, globally and locally. After RFP is floated and list of potential suppliers is received, a development tender should be floated to get the exact price and delivery schedule.
Bottleneck products have less influence on the financial results, but they are vulnerable in regard to their supply. Suppliers have a dominant power position. The purchasing strategy is therefore primarily focused on assurance of supply, if necessary even at additional cost. Limited Tendering to approved suppliers, and the goal should be developing them to enter into long term agreements. For such items, supplier training and motivation is must. The purchasing strategy can also be to search for alternative products. Normal products usually have a small value per unit and there are many alternative suppliers. From a purchasing point of view, these items produce only few technical or commercial problems. The administrative work has to be redesigned in a more efficient way. There is no apparent need for long-term supply contracts, but standardization and bundling of purchasing requirements are imperative and finally all procurement strategy should be towards long term contracts. Standardizing the product assortment to reduce product variety is the key in this category.

S.K.Sharma, Rajnish Kumar
Volume 15 Issue 2 92 ©2014 IJAMS
Reverse auctions as a tool have been around since the late 1990's. There are two common criticisms that are directed against reverse auctions. One is that they are not strategic and do not facilitate long term relationships with suppliers. The second criticism is that suppliers do not like them. Reverse auctions work well as a means of price discovery. The cost of switching suppliers is also a very important consideration. Reverse auctions are more appropriate where the relationship with the supplier is more transactional rather than collaborative. A reverse auction also may not be effective if the organization that is purchasing the products is the largest purchaser of the item on the market or if there is only one or two major suppliers. Thus in the present case, it can be tried for raw material and standard products like hardware. For technologically intensive products this will not be the right strategy. 8. Conclusion The deficiencies of Kraljic Model are not easy to overcome, and the work has attempted to adapt the Kraljic model to the case of the Locomotive Manufacturer in India. It has been attempted with a fair amount of objectivity to assign value to a parameter. By adopting this methodology, the items have been categorized for defining a purchase strategy which suits the requirement. The class of items is modified to Strategic, Development, Bottleneck and Normal. This is because the scenario in which the Locomotive Manufacturer is working is different. It is not working in a cut throat competitive environment yet, and the focus is more on quality and reduction in costs. Nevertheless it has to plan for future where competition could possibly be in as various other modes of procurement by the Railways Ministry is being explored. If the work for professional supply chain management does not begin now it may lead to a crisis at a later stage. By this method, one more important issue has surfaced that standardization of product assortment is also important and for bulk of hardware which is being procured separately as single items, kits have to be formed and supplier development has to be initiated accordingly. For
example in same class of items like Gaskets for 99 types there are 8 suppliers. This must be overcome by the OEM for efficient purchase and getting benefit of quality and cost in long run. The model proposed too is not complete, further work can be done to assess not just actual disruption but difficulty in procurement, how much of effort was done for chasing the supplier, foregoing certain quality parameters to keep production going. This would require extensive study and cannot be done for the past but in future procurement process it can be part of analysis for items. 9. References 1. Anupindi, Ravi and Akella, Ram.
“Diversification Under Supply Uncertainty”, Management Science, 39, (1993), 944-963.
2. Beall S. et al. “The Role of Reverse Auctions
in Strategic sourcing”, CAPS Research, www.capsresearch.com, 2003.
3. Bensaou, M. “Portfolios of Buyer-Supplier
Relationships”, Sloan Management Review, Vol. 40, No. 4, Summer, (1999), 35-44.
4. Cachon G.P.and Lariviere, M.A. “Supply
chain coordination with revenue sharing contracts: Strengths and Limitations”, Management Science, 51(1), (2005), 30-44.
5. Cachon G.P. “Supply Chain Coordination
with Contracts", Chapter 6, Part II, Handbooks in Operations Research and Management Science, 11: Supply Chain Management: Design, Coordination and Operation, North Holland, 2003
6. Corbett J.C. et al. “Designing Supply
Contracts: Contract Type and Information Asymmetry”, Management Science, 50(4), (2004), 550-559.
7. Dubois, A. and Pedersen, A.C. “Why
Relationships do Not Fit into Purchasing Portfolio Models – A Comparison Between the Portfolio and Industrial Network

Classification of items and purchasing strategy using modified Kraljic matrix – a case study of locomotive manufacturer in India
Volume 15 Issue 2 93 ©2014 IJAMS
Approaches”, European Journal of Purchasing & Supply Management, Vol. 8, No. 1, (2002), 35-42.
8. Ellram, L. M. and Siferd Sue P. “Total cost of
ownership: A key concept in strategic cost management decisions”, Journal of Business Logistics, 19 (1), (1998), 55-84.
9. Gelderman, C.J. and Weele, A.J. van. “New
Perspectives on Kraljic’s Purchasing Portfolio Approach”, Proceedings of the 9th International IPSERA Conference, London, Canada, (2000), 291-298.
10. Gelderman, C.J. “Rethinking Kraljic:
Towards a Purchasing Portfolio Model, Based on Mutual Buyer-Supplier Dependence”, Danish Purchasing & Logistics Forum (Dansk Indkøbs- og Logistikforum), Vol. 37, No. 10, October, (2000), 9-15.
11. Kraljic, P. “Purchasing must become supply
management”, Harvard Business Review, 16(5), (1983), 109-117.
12. Lambert, D.M. and Cooper, M.C. ‘Issues in
Supply Chain Management’, Industrial Marketing Management, Vol. 29, (2000), 65-83.
13. Marqueza, A.C. and Blanchar, C. “The
procurement of strategic parts. Analysis of a portfolio of contracts with suppliers using a system dynamics simulation model”, Int. J. Production Economics, Vol 88, (2004), 29–49.
14. Martinez-de-Alb´eniz, Victor and Simchi-
Levi, David. “A Portfolio Approach to Procurement Contracts”, Production and Operations Management, Volume 14, Issue 1, (2005), pages 90–114.
15. Mathur, P.P., Shah, J. “Supply chain contracts
with capacity investment decision: Two-way penalties for coordination”, Int. J. Production Economics 114, (2008), 56–70.
16. Olsen, R.F. and Ellram, L.M. “A Portfolio Approach to Supplier Relationships”, Industrial Marketing Management, Vol. 26, No. 2, (1997), 101-113.
17. Peral, Toktaş-Palut and Ülengin, Füsun.
“Coordination in a two-stage capacitated supply chain with multiple suppliers”, European Journal of Operational Research, Volume 212, Issue 1, July, (2011), Pages 43-53, 2011.
18. Raman, Lakshmi. “Strategizing Sourcing
Decisions: A Case Study of Diesel Locomotive Works (OEM)”, PhD Thesis, Faculty of Management Studies, BHU, Varanasi, India, 2012.
19. Padhi, Sidhartha S., Wagner, Stephan M. and
Aggarwal, Vijay. “Positioning of commodities using the Kraljic Portfolio Matrix”, Journal of Purchasing and Supply Management, Volume 18, Issue 1, (2012), Pages 1-8.
20. Sislian, Eric and Satir, Ahmet. “Strategic
sourcing: A framework and a case study”, Journal of Supply Chain Management, 36, 3, (2000), 4-11.
21. Stekelenborg R.H.A.V. and Kornelius L.A.
“Diversified Approach Towards Purchasing and Supply”, In Proceedings of Production Management Methods, (1994), 45-55.
22. Talluri S. and Narasimhan R. “A
methodology for strategic sourcing”, European Journal of Operational Research, Volume 154, Issue 1, (2004), Pages 236-250.
23. Tomlin, B. and Schmitt, A.J. “Sourcing
Strategies to Manage Supply Disruptions”, Supply Chain Disruptions: Theory and Practice of Managing Risk, Ed. Gurnani, H. et al, Springer, Chapter 3, (2011), 51-72.
24. Tsay A.A. “The quantity flexibility contract
and supplier-customer incentives”,

S.K.Sharma, Rajnish Kumar
Volume 15 Issue 2 94 ©2014 IJAMS
Management Science, 45(10), (1999), 1339-1358.
25. Zolkiewski, J. and Turnbull, P.W.
“Relationships Portfolios – Past, Present and Future”, http://web.bi.no/imp2001, The 17th Annual IMP Conference, Oslo, Norway, 2000.
Biography Rajnish Kumar is a Mechanical Engineer with
the Indian Railways. He completed his B.E. from MNIT, Jaipur in 1994 and is currently pursuing PhD at IIT BHU Varanasi. He has about 15 years of experience in Government service.
Sushil Kumar Sharma is working at present as Professor in Mechanical Engineering at
IIT(BHU), Varanasi. He is,Phd in Engineering from IIT Kharagpur, B.Tech, MTech., & MBA from Banaras Hindu University, Varanasi, India.

Volume 15 Issue 1 95 ©2014 IJAMS
IX. REVERSE ENGINEERING APPROACH FOR MEASUREMENT AND INSPECTION OF MACHINE
ELEMENT
Atul Kumar, P. K. Jain, P. M. Pathak Indian Institute of Technology Roorkee, Roorkee, 247667, Uttarakhand, INDIA
[email protected], [email protected], [email protected] Abstract: This paper proposes a technique for comparative measurement and inspection of the damaged portion of machine element by reverse engineering approach. In present work, a spur gear has been selected for study as it is a very imperative element in mechanical industries to transmit motion and power between two parallel shafts. During power transfer it worn out due to rubbing action of meshed gears teeth or damage caused by foreign element like dust particle, metal debris, etc. After certain number of hours, meshed gears teeth geometry is not completely the same due to wear out on outer surface of the spur gear teeth. An actual CAD spur gear model is different from its corresponding tattered one and as a result it can be used to determine whether the service life of gear was over or not. Precision measurement of gear plays a vital role to gear replace or repair. Eventually, this technique can be used during repair and maintenance planning of repairable complex profile parts. Moreover, it can also find potential application in replacement planning of the critical machine elements. The adopted methodology carried in different phases. The gear has been scanned before and after wear using a 3D laser scanner. The scanned data obtained in the form of point cloud data or Stereo Lithography File (stl file) has been used to compare the surface geometry of spur gear before and after the wear to recognize the wear out portion accurately. Finally, it helps to indentifying and decision making of remaining life of the machine elements. Keywords: Spur Gear, Reverse Engineering, 3D Laser Scanner, Point Cloud Data 1. Introduction The applications of CAD/CAM technologies have been assisted by computational manufacturing to innovate in advance technology. In a normal automated manufacturing environment, the operation sequence usually starts with a design concept via the geometric models created in CAD systems, while in reverse engineering a product is designed by acquiring the shape of the object. Acquiring the shape data of a physical part is an essential process in reverse engineering. The part developed through reverse engineering process is usually freeform surfaces [1]. The quality of reconstructed surface model is depending on type and accuracy of measured point data as well as type of measuring device. Now days, a CMM (coordinate measuring machine) and a three-dimensional (3D) laser scanner are frequently used for scanning to access quality inspection and
redesign purpose. The trigger-type CMM acquires point data by touching the probe to part, such that it is appropriate for measuring primitive features that need small number of point data. The scanning-type CMMs can capture more sampling points than touch trigger-type and have better accuracy than vision sensors. They can be used for measuring freeform features however, they cannot measure a part made of soft materials and have relatively lower scanning speed compared to laser scanners [2, 3]. On the other hand, laser scanners, can obtain large amount of point data by non-contact method in a short time. Since the accuracy of the laser scanner is getting improved. They are widely adopted for many applications in industry [4]. 3D digitization is being in targeted in the applications of reverse engineering such as; quality control, differential inspection, direct replication, detection of inaccuracies, redesign of parts and make to manufacturing tools faster [5].
IJAMS

Atul Kumar, P. K. Jain, P. M. Pathak
Volume 15 Issue 1 96 ©2014 IJAMS
Gears are one of the most common mechanical elements for transmitting power. In, most of the modern industrial and transport applications, gears are important and are frequently used as fundamental mechanical components. Spur gears have the majority among all types of gears in use; therefore 3D measurement process of spur gears becomes a persisting target [6]. The current methods of gear measurement are either time consuming or expensive. In addition, no single measurement method is available and capable of accurately measuring the wear out portion on gear tooth. Wear on gears teeth profile because of dirty operation environment, in proper lubrication, higher gear operating speeds etc. For closer control over the accuracy of gearing, precision measurement of gears plays a vital role. The deviation of an actual tooth from the design profile, the profile error, can be measured in a number of ways. The simplest way is to use the 3D laser scanner and scanned the gear teeth profile before wear and after wear out. After that generate the teeth surface profile using scanned data with suitable file formats likes; point cloud, STL, etc. and compared. CMMs have been used more under reverse engineering in industry often for inspection purpose. However, due to slow scanning speed of CMMs, a 3D laser scanner is considered for present study. Therefore, the tasks that involve inspection and reverse engineering processes can be completed very effectively. In this research, an application of reverse engineering is to measure the wear out portion on gear tooth surface. The methodology involves scanning of gear before wear and after wear using a PICZA 3D laser scanner (Roland LPX60). The scanned profile has been saved either point cloud or STL data are used for surface modeling on Pro/E modeling software. And finally, compare both gear teeth surface profiles to identify the wear out portion. 2. Reverse Engineering Methodology Reverse engineering refers to the process of creating a CAD model from a physical object. In
product development cycle the designer, based on specified functional and aesthetic requirements, first conceptualizes the reverse engineering methodology for exiting product. Necessary CAD models can be generated using reverse engineering process, during this process; changes made to the physical are usually so typical that corresponding design changes to the original drawing are complicated and time consuming. This necessitates the application of reverse engineering methods is to generate point cloud, data analysis, preprocessing and accurate surface model. Figure 1 shows the block diagram of reverse engineering process.
3D Laser ScannerPhysical Object
Data Acquisit ion
Preprocessing
3D Data
Surface Model
Figure 1: Reverse engineering flow process
3. Proposed Methodology Reverse engineering is the process of scanning an object and then generating a surface CAD model. The methodology used in the current work is described by flow chart shown in Figure 2. The following steps are used for the proposed methodology: Step 1: Physical object (spur gear) scanning. Step2: 3D data collection in point cloud format and STL format. Step 3: Generate the surface model using scanned data. Step 4: Obtain a wear out portion by compared wear out and original spur gear teeth profile.

Reverse Engineering Approach for Measurement and Inspection of Machine Element
Volume 15 Issue 1 97 ©2014 IJAMS
4. Design Detail of Spur Gear The spur gear has been designed according to AGMA standard for present study and using gear
PhysicalModel
2D SurfaceData
3D CADData
STL or PointCloud Data
DefectivePortion
CAD SurfaceModel
SurfaceComparison
DataCapturing
Figure 2: Proposed reverse engineering methodology design handbook [7]. The specifications used to design the spur gear are presented in Table 1.
Table 1. Description of gear specimen
Parameters Relation with module
(= 6.35) mm
Calculated value (mm)
Addendum (a) m 6.35 Dedendum (d) 1.25m 7.94 Tooth thickness 1.5708m 10 Tooth space 1.5708m 10 Working depth 2m 12.7 Whole depth 2.25m 14.3 Pitch diameter Zm 76.2 Outside circle diameter
(z+2)m 89
Root circle diameter
(z-2.5)m 60.325
Fillet radius 0.4m 2.54
The photographic view of the spur gear both before and after wear has been shown in Figure 3 (a and b) respectively.
(a) Before wear
(b) After wear Figure 3: Photographic view of spur gear
Atul Kumar, P. K. Jain, P. M. Pathak
Volume 15 Issue 1 98 ©2014 IJAMS
5. Proposed System and Data Acquisition Figure 4 shows a photograph of the proposed scanning system. It consists of two main parts, hardware and software. The hardware consists of 3D laser scanner and personal computer.
Figure 4: Photographic view proposed system In 3D laser scanner, fixed rotating table can be used for hold the scanning object and a laser beam device for scanning the object surface and a CCD camera for capture the scanned surface. The system can have the optimal scan parameter, which includes the number of required scans, the scan directions and the scan paths considering. The scanning software (3D studio) is fully supported for 32-bit Windows application. It features many image processing and computer vision device to measure object surface from captured images of the object. To perform the measurement or inspection process, the gear to be measured is set on the rotating table then an image is captured and saved to point cloud and STL file using the capturing software. The captured image is then opened by 3D editor software and analyzed to perform the preprocessing processing. Data acquisition and processing system includes both hardware and software components. A hardware system acquires point clouds or volumetric data by using available experimental setup. A software system processes raw point clouds or volumetric data and transfers them into a recreation of gear teeth surfaces. Upon measuring, the axes of the rotary table are known, and the table is automatically rotated to orient the part
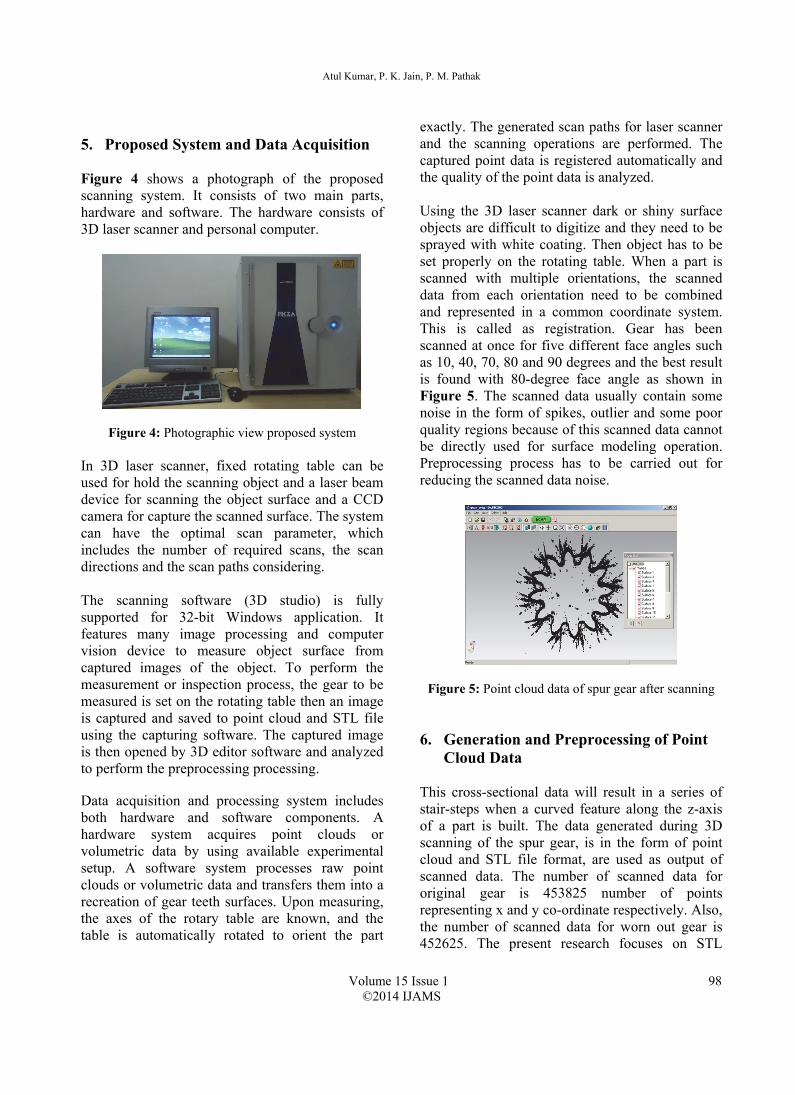
exactly. The generated scan paths for laser scanner and the scanning operations are performed. The captured point data is registered automatically and the quality of the point data is analyzed. Using the 3D laser scanner dark or shiny surface objects are difficult to digitize and they need to be sprayed with white coating. Then object has to be set properly on the rotating table. When a part is scanned with multiple orientations, the scanned data from each orientation need to be combined and represented in a common coordinate system. This is called as registration. Gear has been scanned at once for five different face angles such as 10, 40, 70, 80 and 90 degrees and the best result is found with 80-degree face angle as shown in Figure 5. The scanned data usually contain some noise in the form of spikes, outlier and some poor quality regions because of this scanned data cannot be directly used for surface modeling operation. Preprocessing process has to be carried out for reducing the scanned data noise.
Figure 5: Point cloud data of spur gear after scanning 6. Generation and Preprocessing of Point
Cloud Data This cross-sectional data will result in a series of stair-steps when a curved feature along the z-axis of a part is built. The data generated during 3D scanning of the spur gear, is in the form of point cloud and STL file format, are used as output of scanned data. The number of scanned data for original gear is 453825 number of points representing x and y co-ordinate respectively. Also, the number of scanned data for worn out gear is 452625. The present research focuses on STL

Reverse Engineering Approach for Measurement and Inspection of Machine Element
Volume 15 Issue 1 99 ©2014 IJAMS
format of scanned gear teeth. The point cloud data for the scanned gear is shown in Figure 5. 3D laser scanners generate large amount of point cloud as shown in Figure 5. Noise is everywhere in measured data. Surface models of spur gear built using measurement data obtained using 3D range scanners necessarily contains some type of noise. Therefore, before the surface reconstruction process it is necessary to prepare the noise free point cloud data. For noise free data, the scanned data must pass through preprocessing process. In the pre-processing, steps involved are, count, noise filtering, data smoothing and data reduction. In this work, the 3D editor (version 2.0) tool of Dr. PICZA3 has been used for editing the data and for removing the noise in surface models. The preprocessed image of spur gear is shown in Figure 6.
Figure 6: Spur gear profile after preprocessing 7. Recreation and Inspection of Spur Gear The recreated teeth profile has been made such that it best fits with the original teeth profile. Recreation of model by scanned data can be done in two ways namely using point cloud data and using STL data. In present work, STL data has been considered for recreation of spur gear teeth profile; 7.1 Using point cloud data Scanned point cloud data of gear can be used for recreate the gear teeth profile after and before gear wear. It can be done with the help of any plotting
software such as: Matlab, Microcal (TM) Origion and Microsoft Office Excel. 7.2 Using STL data The surface models of the spur gear before and after wear have been created on the Pro/E modeling software. The generated STL file is imported in Pro/E modeling software using suitable available tool. The collected data is converted into surface model. In this way the surface profile of the scanned gear before wear and after wear out are recreated as shown in Figure 7 (a and b) respectively. The generated surface model is used for downstream operation on any modeling software such as inspection, compression, analysis, mass properties etc. The inspection process has been performed by comparing the measurements of the spur gear to be inspected and the measurements of a standard spur gear to identify the wear out portion on the gear tooth. In the main interface of the inspection section deals with this reference point on the scanner rotating table. The inspection process is performed with entering of standard scanned data.
(a) Before wear

Atul Kumar, P. K. Jain, P. M. Pathak
Volume 15 Issue 1 100 ©2014 IJAMS
(b) After wear Figure 7: Recreation of the scanned gear tooth profile
The standard gear teeth scanned data can be entered in Pro/E modeling software and generate the surface model and can be selected as a reference surface model, could be used to check any gear tooth wear. The generated wear out gear teeth profile is to be inspected with compared the standard gear teeth profile as shown in Figure 8. 8. Conclusion Based on previous research the reverse engineering technology application in engineering to obtain adequate CAD model, science surface reconstruct on the base of scanned 3D data.
Figure 8: Superimpose teeth profiles To satisfy the CAD surface model pre-processing of data point before surface reconstruction is needed. In this paper reverse engineering technique
has been introduce as a non contact technique for measurement and inspection of spur gear before wear and after wear. The introduced entire process has been focus on measuring and comparison of before wear and after wear spur gear teeth surface profiles and identify the wear out portion based on gap between surface profiles. In order to verify validity of the primal hypothesis as well as the functionality of the development producer experimental implementation has been carried out. On the basis the obtain result it is possible to conclude that; Based on surface profile, physical model can be obtained which needs to be redesign or to be used as a base model for new product. Generated surface model can be sent in CAD/CAM packages for FEA analysis. The indicate gap can be calculated in terms of area and volume. Predict the gear reaming life based on gap in tooth profile. 9. References 1. Bardell, R., Balendran, V. and Sivayoganathan,
K., “Accuracy analysis of 3D data collection and free-form modelling methods,” Journal of Materials Processing Technology, 133 (1-2), 2003, 26-33.
2. Budaka, I., Hodolic, J. and Sokovi, M. “Development of a programmer system for data point preprocessing in Reverse Engineering,” Journal of Materials Processing Technology, 162 (163), 2005, 730-735.
3. Abella, Robert J., Daschbach , James M. and Mcnichols, Roger J., “Reverse Engineering Industrial Applications,” International Journal of Computers and Industrial Engineering, 26 (2), 1994, 381-385.
4. Bi, Z M, Wang, Lihui, “Advances in 3D data acquisition and processing for industrial applications,” Robotics and Computer-Integrated Manufacturing, 26 (5), 2010, 403-413.
5. Ferreira, J.C. and Alves, N.F, “Integration of reverse engineering and rapid tooling in
Worn out portion

Reverse Engineering Approach for Measurement and Inspection of Machine Element
Volume 15 Issue 1 101 ©2014 IJAMS
foundry technology,” Journal of Materials Processing Technology, 142, 2003, 374-382.
6. Gadelmawla, E. S., “Computer vision
algorithms for measurement and inspection of spur gears,” International journal of Measurement, 44 (9), 2011, 1669-1678.
7. Dudely, D. W., “Gear Hand Book”, New
York: McGraw Hill, 1962. Biography Atul Kumar is pursuing PhD from Indian
Institute of Technology Roorkee in the Department of Mechanical and Industrial Engineering. His research interest includes Design, reverse engineering (RE), CAD/CAE/CAI and FE simulation of statics elements.
His research areas include reverse engineering, CAD, design, finite element analysis, fatigue and bending fracture analysis. He has few papers published in national and International journals and conferences proceedings. P. K. Jain is working as a Professor in the
Department of Mechanical and Industrial Engineering at Indian Institute of Technology Roorkee. Currently, he is also the Head of the department.He obtained his PhD in the area of Computer Aided Process Planning (CAPP) from
Indian Institute of Technology Roorkee. His research interests include design and analysis of manufacturing systems, CAPP, reconfigurable manufacturing systems and manufacturing processes. He has published several research papers and articles in various reputed national and international journals and conferences. He has also delivered several talks, keynote addresses at various national and international conferences. He has guided several M.Tech and PhD theses and also working as an Editor and
Reviewer for many international and national journals. He is also the recipient of several prestigious awards from various national and international bodies for recognition of his research and administrative work. P. M. Pathak is working as Associate Professor
in the Mechanical and Industrial Engineering Department, Indian Institute of Technology Roorkee since 2006. He obtained his B.Tech. from NIT Calicut, M.Tech with
specialization in Solid Mechanics and Design from IIT Kanpur and doctorate in the area of Space Robotics from IIT Kharagpur. His areas of interest includes space robotics, walking robots, In-Vivorobot dynamics control Bond graph modelling, design and CAD/CAE. He has published several research papers and articles in various reputed national and international journals and conferences. He has also delivered several talks, keynote addresses at various national and international events. He has guided several M.Tech and PhD theses and also working as an Editor and Reviewer for many international journals.


![ISPE-KC [October 2011]](https://img.pdfslide.us/doc/110x75/55854765d8b42ae15d8b4bf8/ispe-kc-october-2011.jpg)