Embed Size (px)
Citation preview
To Our Shareholders,
For the quarter ended June 30, 2014, the net asset value (“NAV”) total return of The Gabelli Utility Trust(the “Fund”) was 7.0%. The total return for the Standard & Poor’s (“S&P”) 500 Utilities Index was 7.8%. Thetotal return for the Fund’s publicly traded shares was 10.7%. The Fund’s NAV per share was $6.38, while theprice of the publicly traded shares closed at $7.34 on the New York Stock Exchange (“NYSE”).
Comparative Results
Average Annual Returns through June 30, 2014 (a) SinceInception
Quarter 1 Year 5 Year 10 Year (07/09/99)———— ——— ——— —–—— ———–——Gabelli Utility Trust
NAV Total Return (b) . . . . . . . . . . . . . . . . . . . . . . . . . . . . 7.04% 23.45% 20.14% 11.09% 9.83%Investment Total Return (c) . . . . . . . . . . . . . . . . . . . . . . 10.69 24.15 11.42 7.23 9.13
S&P 500 Utilities Index . . . . . . . . . . . . . . . . . . . . . . . . . . . . . . 7.77 22.19 14.40 10.70 6.22(d)Lipper Utility Fund Average . . . . . . . . . . . . . . . . . . . . . . . . . . . 8.30 25.60 16.81 11.64 6.77 S&P 500 Index . . . . . . . . . . . . . . . . . . . . . . . . . . . . . . . . . . . . 5.23 24.61 18.83 7.78 4.35 (a) Returns represent past performance and do not guarantee future results. Investment returns and the principal value
of an investment will fluctuate. When shares are sold, they may be worth more or less than their original cost. Currentperformance may be lower or higher than the performance data presented. Visit www.gabelli.com for performanceinformation as of the most recent month end. Performance returns for periods of less than one year are notannualized. Investors should carefully consider the investment objectives, risks, charges, and expenses of the Fundbefore investing. The S&P 500 Utilities Index is an unmanaged market capitalization weighted Index of largecapitalization stocks that may include facilities generation and transmission or distribution of electricity, gas, or water.The Lipper Utility Fund Average reflects the average performance of mutual funds classified in this particularcategory. The S&P 500 Index is an unmanaged indicator of stock market performance. Dividends are consideredreinvested. You cannot invest directly in an index.
(b) Total returns and average annual returns reflect changes in the NAV per share, reinvestment of distributions at NAVon the ex-dividend date, and adjustments for rights offerings and are net of expenses. Since inception return isbased on an initial NAV of $7.50.
(c) Total returns and average annual returns reflect changes in closing market values on the NYSE, reinvestment ofdistributions, and adjustments for rights offerings. Since inception return is based on an initial offering price of $7.50.
(d) From June 30, 1999, the date closest to the Fund’s inception for which data is available.
Mario J. Gabelli, CFA
The Gabelli Utility TrustShareholder Commentary – June 30, 2014
Portfolio Manager
2
Premium / Discount Discussion
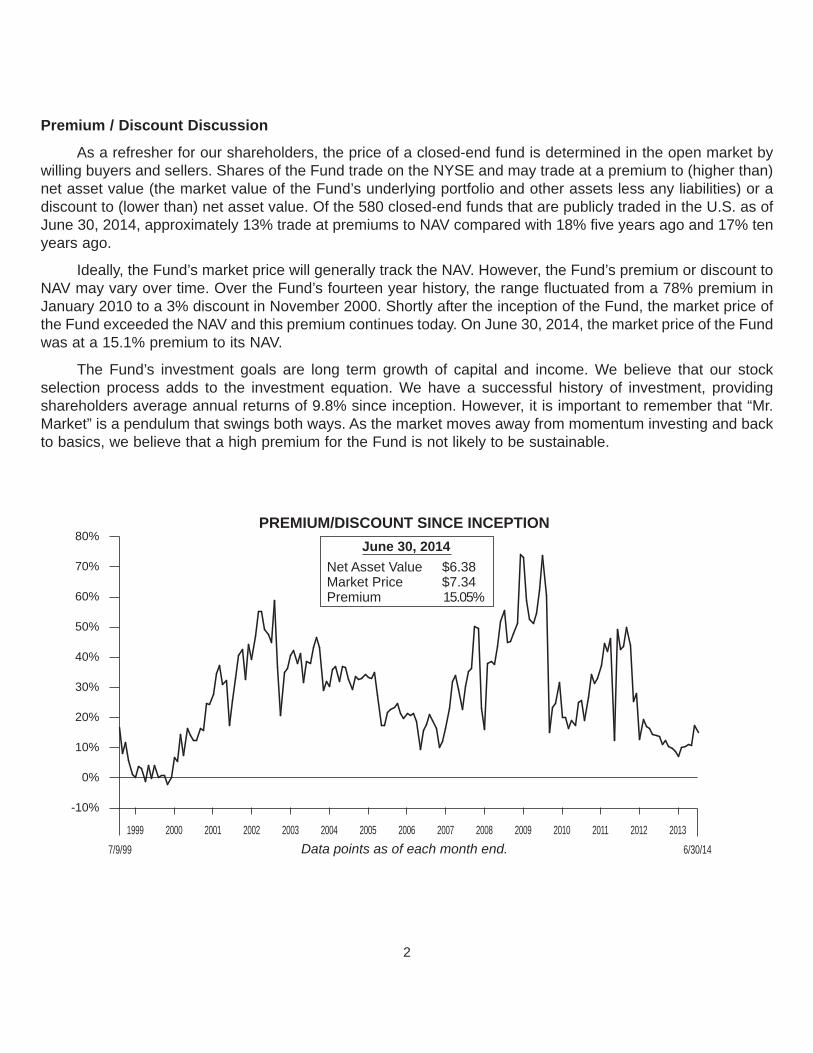
As a refresher for our shareholders, the price of a closed-end fund is determined in the open market bywilling buyers and sellers. Shares of the Fund trade on the NYSE and may trade at a premium to (higher than)net asset value (the market value of the Fund’s underlying portfolio and other assets less any liabilities) or adiscount to (lower than) net asset value. Of the 580 closed-end funds that are publicly traded in the U.S. as ofJune 30, 2014, approximately 13% trade at premiums to NAV compared with 18% five years ago and 17% tenyears ago.
Ideally, the Fund’s market price will generally track the NAV. However, the Fund’s premium or discount toNAV may vary over time. Over the Fund’s fourteen year history, the range fluctuated from a 78% premium inJanuary 2010 to a 3% discount in November 2000. Shortly after the inception of the Fund, the market price ofthe Fund exceeded the NAV and this premium continues today. On June 30, 2014, the market price of the Fundwas at a 15.1% premium to its NAV.
The Fund’s investment goals are long term growth of capital and income. We believe that our stockselection process adds to the investment equation. We have a successful history of investment, providingshareholders average annual returns of 9.8% since inception. However, it is important to remember that “Mr.Market” is a pendulum that swings both ways. As the market moves away from momentum investing and backto basics, we believe that a high premium for the Fund is not likely to be sustainable.
-10%
1999 2000
0%
10%
20%
30%
80%
60%
70%
50%
40%
2002 2003 2007 2008 20092006200520042001
PREMIUM/DISCOUNT SINCE INCEPTION
Data points as of each month end.
June 30, 2014
Net Asset Value $6.38Market Price $7.34Premium 15.05%
20106/30/14
20117/9/99
2012 2013
Introduction
Utility stocks were among the best performers through the first half of 2014, with the S&P Utilities Indexreturning nearly 19% compared to the 7% return of the S&P 500. In 2013, utility stocks were largely neglecteddue to macro factors, including a bull market that favored growth and cyclical stocks, as well as the ongoingspecter of rising interest rates. However, the ten and thirty year U.S. Treasury yields surprised many by decliningto 2.5% and 3.4% from year end 2013 levels of 3.0% and 4.0%, respectively. In addition, political unrest in theUkraine and slower first quarter 2014 U.S. GDP growth highlighted the defensive appeal of utility stocks.
Utility stocks continue to benefit from low rates and strong fundamentals, but performance in the first halfof 2014 was further enhanced by an extremely cold Northeast and Midwest winter. The cold weather led tostrong first quarter earnings, and, more importantly, resulted in power and gas price volatility as well asreliability concerns, highlighting the need for infrastructure investment. Investment in expanded gas and electrictransmission/pipelines, more power generation, and oil-to-gas heating conversions would help alleviateconcerns. In addition, the Environmental Protection Agency’s (EPA) June 2, 2014 proposal to establishemission standards on carbon and other greenhouse gases (GHG’s) from power plants increases utilityinvestment opportunities. Public support for rate base growth normally translates into rate recognition ofinvestment, or earnings growth.
During the first half of 2014, consolidation continued at a deliberate pace and utility financial engineeringactivity dramatically increased. Given significant investment opportunities, utilities and private equity havebecome more creative in lowering the cost of capital through mergers, the formation of master limitedpartnerships (MLPs), business unit IPO’s, asset sales, and the creation of a new asset structure called “yield cos.” The activity has generated new found enthusiasm in the sector, particularly for the high-flying yield cos. Utility valuation multiples have reached historically high absolute levels, including price-to-earningsestimates of 18x and 17x for 2014 and 2015, respectively, though remaining somewhat undervalued relativeto the S&P 500 and U.S. Treasury yields.
Investment Outlook
Strong utility fundamentals include solid balance sheets, positive credit outlooks, and generallyconstructive state public utility commission (PUC) regulation, which drive mid-single digit earnings and dividendgrowth potential. The median current dividend return of 3.6% is attractive, and the healthy 63% dividend payoutof 2014 earnings provides ample cushion for security as well as room for accelerated growth. Over the pastfive years, utility stocks have delivered 4.8% annual earnings and 3.6% annual dividend growth. We expectutility stocks to provide a low risk 8% - 10% total return potential based on the 3.6% current return and 4% - 6% earnings and dividend growth potential. Interest rates, natural gas prices, and economic growth willcontinue to be major macro drivers of utility stock performance, while individual rate case decisions, servicearea growth, and consolidation are the more important micro drivers.
The first half of 2014 was one of the more active periods for utility stocks, highlighted by the followingimportant events:
Deal Activity
• On June 23, 2014, Wisconsin Energy (WEC) announced an agreement to acquire Integrys EnergyGroup (TEG) for $71.47 per share, which represented a 17.3% premium to the previous closing price.The agreement valued TEG at $9.1 billion enterprise value and consists of stock, cash, and theassumption of $3.3 billion of debt. Each TEG share will receive 1.128 shares of WEC and $18.58 pershare in cash.
3
• On April 30, 2014, Exelon Corporation agreed to acquire Pepco Holdings Inc. for $11.9 billion, or $27.25per share in cash, a 25% premium over the previous day’s closing price. The agreement will bringtogether Exelon and Pepco’s gas and electric utilities, creating the leading Mid Atlantic electric and gasutility, serving ten million customers.
• On April 7, 2014, Laclede Group agreed to acquire Alabama Gas Corporation (Alagasco) from EnergenCorporation for $1.6 billion. Alagasco is the largest gas local distribution company in the state, servingover 420,000 customers in central and north Alabama, including Birmingham.
• On March 3, 2014, UIL Holdings Corp announced that it was the winning bidder for Philadelphia GasWorks, a municipal gas utility that serves 500,000 customers, which it agreed to acquire for $1.9 billion.
• On December 11, 2013, Canadian utility Fortis Inc. announced an agreement to buy the Tucson,Arizona electric utility, UNS Energy, for $60.25 per share, a 31% premium to the previous day’s close.
• On December 19, 2013, NV Energy was acquired by MidAmerican Energy Holdings Company for$23.75 in cash. The deal was announced on May 30, 2013, and the offer price represented a 23%premium to the previous day’s closing price.
In addition to the announced mergers above, others appear to be in the early stages of negotiation.
• On June 23, 2014, Cleco Corp. released a statement confirming that it recently received indications ofinterest from third parties to consider a strategic transaction and hired advisors to review and evaluateany proposals. On June 20, 2014, The Wall Street Journal had reported that both CenterPoint Energyand Borealis Infrastructure, a unit of the Ontario Municipal Employees Retirement System, wereweighing bids for the company.
Over the past several years, integrated gas utilities have created significant value by forming MLP’s formidstream and pipeline assets, but electric utilities and other power companies have been challenged toreplicate the success, primarily because of regulatory hurdles and assets qualifying for MLP or even REITstatus. However, over the past twelve months, electric utilities have engineered the corporate structure knownas yield cos, which serve a similar purpose by achieving a lower cost of capital (higher valuation) by separatingmore stable and tax advantaged cash flows into an income paying publicly traded vehicle.
• On June 26, 2014, NextEra Energy Inc. (NEE) issued 16.3 million shares, approximately 20% of itsnewly created yield co, NextEra Energy Partners, LP (NEP), at $25 per share. The IPO raised $405million and was priced at the high end of the $23 - $25 per share range (raised from the initial $19 - $21per share range). NEE also has incentive distribution rights and 100% of the special voting units.
• On March 31, 2014, Dominion Resources (D) filed an S-1 to form an MLP, to be known as DominionMidstream, with an initial asset of a preferred interest in the Cove Point LNG facility. D estimates thatCove Point and its Blue Racer JV would have “up to $1 billion of EBITDA” by 2018. In addition, D hadroughly $1 billion of EBITDA potential to “drop down” from other assets at Dominion East Ohio,Dominion Transmission, and the Iroquois Pipeline.
• On July 16, 2013, NRG spun off a portion of its contracted generation capacity into a separate companycalled NRG Yield (NYLD) via a $430 million IPO. NYLD is a dividend oriented company that owns,operates, and acquires contracted renewable and conventional generation and thermal infrastructureassets. NYLD shares were priced at $22 per share and currently trade at $51.20 per share.
4
Finally, other diversified utilities recognized that investors value non-regulated businesses separatelyfrom regulated business. Over the past few years, investors have rewarded regulated utilities with highervaluations.
• On June 10, 2014, PPL Corp. announced an agreement with Riverstone Holdings, a private equityenergy firm, to combine the companies’ unregulated generation assets to form Talen EnergyCorporation and spin it to shareholders. Talen would own approximately 15,000 MW (PPL-10,000 MW,Riverstone-5,300 MW) of unregulated generation in PJM (Pennsylvania, New Jersey, Maryland, etc.)and ERCOT (Texas). PPL shareholders would receive shares on a tax-free basis and own 65% of thecompany, which will be listed on the NYSE. We view the announcement favorably, as it wouldcompletely transition PPL from the non-regulated competitive power business, which is a higher riskbusiness, and allow management to focus on the core regulated utility businesses.
• On February 2, 2014, ONE Gas, with two million customers in Oklahoma, Kansas, and Texas begantrading as a separate independent gas utility after being distributed to shareholders by ONEOK.
In addition, non-regulated power plants continue to be bought and sold as the electric utility industryevolves. Several large integrated electric utilities are taking advantage of recent “upticks” in merchantgeneration to divest power plants at the potentially early stages of a power market “up-cycle”. On February 17,2014, Duke Energy initiated a strategic process to exit its Midwest merchant generation business, whichconsists of 6,100 MW (PJM-dispatched) primarily in Ohio. Additionally, among other transactions, EdisonInternational sold its Edison Mission Energy subsidiary (8,000 MW, including 4,300 MW coal, 1,700 MW wind,and 1,600 MW gas) to NRG Energy for $2.8 billion, and Ameren sold five coal-fired power plants to Dynegy foran estimated net value of $900 million.
COMMENTARY
The utility sector is in the midst of an investment cycle driven primarily by the need to address climatechange and move shale gas to population centers. The opportunity to invest in utility infrastructure in whichregulators allow a reasonable opportunity to earn fair returns (10% - 11% ROE’s) remains the key to utilityearnings and dividend growth and valuation multiples. The utility business model consists of providing reliableelectric, gas, or water service to customers in exchange for rates set to allow investors to earn a reasonablereturn on investment. Capital investment grew from $41.1 billion in 2004 to $82.8 billion in 2008, with majorspending on environmental control equipment, renewable generation, and transmission. In 2012 and 2013,utility capital expenditures were $90.5 billion compared with $79 billion in 2011. The Edison Electric Institute(EEI) currently projects industry spending at $93 billion in 2014 and $85 billion in 2015.
We believe that heavy investment could continue, given the EPA’s ongoing aggressive policy to reduceemissions and the fact that the June 2, 2014 GHG/carbon standard proposal requires further investment. TheFederal Energy Regulatory Commission’s (FERC) Order 1000 likely increases transmission opportunities and,separately, distributed generation, efficiency, alternative fueling stations, smart meters, and storm proofdistribution systems represent potential opportunities. The gas utility industry is investing heavily in gasgathering, processing, and transportation, given the recent abundance of shale gas. In addition, gasdistribution safety has become a priority. Following the East Harlem, San Bruno, and Allentown gas explosions,regulators are very much focused on incentivizing natural gas utilities to replace older cast iron and steel pipewith safer advanced plastic pipe.
5
6
The FERC’s favorable incentive oriented regulation continues to make transmission investment one ofthe more compelling uses of capital for electric utilities. As a result, transmission growth opportunitiescommand premium multiples and are among the more desirable projects sought by utility management teams.Not surprisingly, transmission investment continued to grow in 2013, nearly doubling from $8.6 billion in 2006to $15.2 billion in 2013, and we expect transmission to be a focus for most management teams going forward.The Brattle Group, a consulting company, anticipates that the United States will need $240 - $320 billion oftransmission investment through 2030 to ensure reliability and meet all current and proposed renewablestandards.
On June 19, 2014, the FERC lowered the New England “transmission base ROE” from 11.14% to 10.57%and capped the return at 11.14%. While the lower ROE is modestly disappointing, it had been generallyexpected, and a 10.57% - 11.14% ROE on a forward looking test year remains one of the more compellinginvestment opportunities available. Over the next couple of years, we expect the number of regionaltransmission development opportunities to increase materially, driven by FERC Order 1000, increaseddemands for reliability, and ongoing need to integrate renewable generation. In July of 2011, FERC Order 1000opened up development opportunities to non-incumbent utilities, which allows transmission developers toparticipate in projects throughout the country.
While rate base growth, consolidation, and financial engineering offer upside potential, investors harbora number of concerns, including the potential for higher interest rates, overly onerous EPA rules, and evensome discussion of distributed generation technologies replacing the electric utilities. Below, we briefly discusseach of these issues and how constructive regulatory principles recognize them.
• Higher interest rates: Like most equity investments, utility stocks are negatively impacted wheninterest rates rise. The current 3.6% utility dividend return is 144% of the 2.5% rate on the 10 Year U.S.Treasury. Should U.S. Treasury rates continue to rise, the utility dividend return would become lesscompelling. In addition, the present value (or stock price) is often determined by the present value offuture cash flows. As such, the higher the interest rate (discount rate), the lower the present value,assuming all other variables hold constant.
Utility stocks often appear to be more sensitive to interest rates than other stocks, because thevariables impacting changes in utility revenues, expenses, etc., are less sensitive to other factors.However, utility stocks pay higher dividends than stocks in other sectors, so utility cash flows are lessimpacted by changes in interest rates. In addition, utility cost of capital, including ROEs, is set by statePUCs and should increase as interest rates rise.
• EPA Standards: The EPA’s aggressive activity to reduce coal fired generation, or more specifically,emissions of SO2, NOX, and other pollutants began in earnest in the 1970s and has accomplishedsignificant NOX and SOX emission reductions. Most environmental retrofits and capacity reductionshave been to coal fired generation. Further investment is required to meet numerous EPA rules,particularly the March 2015 compliance with Mercury and Air Toxins Standards (MATS) and pendingGHG standards. MATS were finalized in December 2011 and require significant reductions in mercuryemissions, particulates, and acid gases by March 2015, though extensions are possible through 2016and 2017.
On June 2, 2014, the EPA issued its draft proposal to establish regulations on carbon emissions fromexisting coal plants. The proposal targets a 30% reduction in carbon dioxide emissions by 2030 fromexisting power plants, based on emission levels from 2005. The rule, scheduled to be finalized in Juneof 2015, provides flexibility to the states, which must implement the rules and submit compliance plans
7
to the EPA by June 2016. States can decide how to meet the reductions, including joining or creatingnew cap-and-trade programs, deploying more renewable energy, or ramping up energy efficiencytechnologies. Each state has different percent reduction standards, but the national average is 25% by2020 and 30% by 2030. On September 20, 2013, the EPA announced carbon emission rules for newsources of generation, effectively barring the construction of new coal facilities until technology thatallows carbon sequestration becomes economically feasible.
We expect electric utilities operating in regulated states to be largely protected, or even to benefit, fromcost recovery and rate base returns related to environmental investment in upcoming rate cases. Somestate PUCs allow for annual rate adjustments, riders, or trackers to recognize investment. As such, therules could represent earnings growth opportunities. However, we expect non-regulated coal generationand merchant coal owners to be negatively impacted.
• Distributed Generation: The penetration rates of residential rooftop solar panels in most states isextremely low, but strong enough in California, Hawaii, and Arizona to warrant investment consideration.The rapid growth in these states is at least partially driven by subsidies, lease/financing models, andfavorable net metering rules, but also by improving technology and lower costs. The addition of rooftopsolar panels negatively impacts electric demand, but customers remain dependent on the grid forreliability during absences of sunlight. Given that these states have decoupled revenues from sales, thelower demand does not negatively impact revenues, but instead become a cost sharing challenge.Utilities overall revenue requirements must be made up through higher rates, or subsidies, from othernon-solar users. We believe regulators will continue to take action in order to limit the impacts of costsharing when it becomes necessary. Further, we believe that major technological advances in batterystorage would be required to disrupt significantly the long standing utility business model.
Our Approach
For several decades, utility companies have acquired other utilities and utility assets for the sake ofgaining economies of scale and efficiency. The same forces that resulted in more than one hundred utilitytakeover announcements over the past two decades remain in place, and new forces have come into play thatcontinue to drive this long term trend. Climate change and environmental policy have pressured marginalplayers. The electric and gas utility sector remains fragmented, with roughly sixty electric utilities and thirty gasutilities. This is fifty more than we need from the standpoint of economic efficiency.
Our investments in regulated companies have primarily, though not exclusively, focused on fundamentallysound, reasonably priced, mid cap and small cap utilities that are likely acquisition targets for large utilitiesseeking increased bulk. We prefer utilities that operate in more constructive regulatory environments, possesslower carbon footprints, and/or access to strategic geographies. We favor utilities with pending transmissionline developments, and we focus on natural gas pipelines and storage operators as a way to take advantageof the growing demand for natural gas in the U.S.
Let’s Talk Stocks
The following are stock specifics on selected holdings of our Fund. Favorable earnings prospects do notnecessarily translate into higher stock prices, but they do express a positive trend that we believe will developover time. Individual securities mentioned are not necessarily representative of the entire portfolio. For thefollowing holdings, the share prices are presented as of June 30, 2014.
8
Duke Energy Corp. (DUK - $74.19 - NYSE), based in Charlotte, North Carolina, became the largest utility inthe nation after completing its merger with Progress Energy on July 2, 2012. DUK serves 7.2 million electriccustomers in six states – North Carolina, South Carolina, Indiana, Ohio, Kentucky, and Florida – with 58 GWof generation and 500,000 natural gas customers in Ohio and Kentucky. Its commercial and internationalbusinesses own and operate diverse power generation assets in North America and Latin America, includinga portfolio of renewable energy assets. DUK will continue to benefit from synergies, increased flexibility,favorable long term demographics, and rate base investment opportunities, and operate in constructiveregulatory environments. DUK expects to grow its earnings 4% - 6% annually through 2016, continue growingthe dividend within a 65% - 70% payout ratio, and maintain strong, investment grade credit ratings.
El Paso Electric Co. (EE - $40.21 - NYSE) is a vertically integrated electric utility serving 395,000 customersin and around El Paso, Texas and Las Cruces, New Mexico. We consider El Paso Electric to be a wellmanaged, low risk traditional utility investment with solid earnings growth potential. We expect above averageannual customer and sales growth due to military base expansion, increased cross border trade, and customerimmigration, as well as an increased use of refrigerated air conditioning. Fort Bliss has grown from 9,500soldiers in 2005 to roughly 34,000 today, and the service area continues to benefit from significant expansion.Additionally, only 35% of El Paso residences have refrigerated air conditioning, but 99% of new residencesinstall central air conditioning. As a result, EE is one of the few electric utilities experiencing meaningful usage-per-customer growth. Over the past ten years, EE grew its customer base by 2.0% per annum and customerusage by 1.3% per annum, compared with the national averages of 0.61% and –0.41%, respectively, and willbe constructing four eighty-eight MW gas fired units over the next five years.
National Fuel Gas Co. (NFG - $78.30 - NYSE) is a diversified natural gas company. NFG owns a regulated gasutility serving the region around Buffalo, New York, gas pipelines that move gas between the Midwest andCanada and from the Marcellus to the Northeast, and an oil and gas exploration and production business.NFG’s regulated utility and pipeline businesses, as well as its California oil production business, provide stableearnings and cash flows to support the dividend, while the natural gas production business offers significantupside potential. NFG’s 800,000 acres in the Marcellus shale, including 745,000 acres in the shale fairway ofPennsylvania, hold enormous natural gas reserve potential, and we believe the position could be worth $3.4billion based on recent comparable transactions. We continue to expect above average long term earnings andcash flow growth from rapidly growing gas production and expansion of the strategically located pipelinenetwork. The company has increased its dividend for over forty consecutive years.
NextEra Energy Inc. (NEE - $102.48 - NYSE) is the holding company for Florida Power & Light (FP&L), thelargest electric utility in Florida, and NextEra Energy Resources (NER), a leading wholesale power generator.We regard NEE as one of the better positioned electric companies to grow earnings and dividends over thenext several years. FP&L operates one of the premier utility franchises in the nation, with favorable long termdemographics and above average rate-based growth potential, due to power plant rate adjustments, flexibleamortization, and other regulatory mechanisms. Additionally, NER owns and operates the nation’s largestrenewable power portfolio, with a significant pipeline of future growth opportunities. Given a 54% payout of our2014 earnings estimate and 5% - 7% annual earnings growth forecast, we expect 8% annual dividend growththrough 2016 to achieve the targeted 55% payout ratio. In January 2013, as part of a four year plan, FP&Limplemented a $350 million annual base rate increase premised on an allowed ROE of 10.5% (+/-100 basispoints). Importantly, FP&L can raise rates to recognize $3.5 billion of power plant modernization projects. Inaddition, NEE entered into a joint venture with Spectra Energy on a 465 mile, $3 billion (NEE to fund $1 billion)interstate pipeline from Alabama through Georgia to southern Florida. The project includes an associated $550million, 126 mile expansion to FPL’s Martin Energy Center. Upon FERC approval, NEE expects constructionto begin in early 2016, with a mid 2017 in-service date.
9
Northeast Utilities (NU - $47.27 - NYSE) is New England’s largest electric and gas distribution utility anddelivery system. On April 10, 2012, NU, headquartered in Hartford, Connecticut, closed its merger with NSTAR,headquartered in Boston, Massachusetts. NST shareholders received 1.312 shares of NU, creating an evenstronger New England distribution utility. Northeast Utilities serves 2.1 million customers in Connecticut, NewHampshire, and Massachusetts, and NSTAR serves 1.5 million electric and gas customers in Eastern andCentral Massachusetts. We believe that NU will be able to take advantage of its larger scale and scope toexecute on a number of regulated investment projects, including expanding infrastructure to serve more naturalgas customers. NST’s strong balance sheet allows for the funding of the combined transmission investmentopportunities, including the Northern Pass (designed to bring enormous hydro capacity from Quebec into NewEngland), New England reliability (the NEEWS Projects), and smaller projects within their service territory. Weconsider NU to be one of the better transmission plays and, given merger synergies and larger scale, expectan enhanced earnings growth profile (the higher end of approximately 6% - 8% regulated earnings per shareCAGR).
OGE Energy Corp. (OGE - $39.08 - NYSE) is the parent company of Oklahoma Gas and Electric Company(OG&E), a regulated electric utility serving 800,000 customers in Oklahoma and western Arkansas, and EnableMidstream Partners, in which OGE owns a 27% limited partner stake and a 50% general partner stake. Enable wasformed on May 1, 2013, when OGE combined its Enogex assets with CenterPoint Energy’s interstate pipelines.Enable owns $11 billion in assets, including 8,400 miles of interstate pipe, 11,000 miles of gathering lines, 86.5 Bcfof natural gas storage, and eleven processing plants. In April 2014, OGE and CenterPoint IPO’d twenty-five millioncommon units of Enable at $20 per share. Further earnings growth for OGE will be driven by investment in theutility’s base infrastructure and approximately $1.6 billion in electric transmission over the next five years.
ONE Gas Inc. (OGS - $37.75 - NYSE) is a natural gas utility serving 2.1 million customers in Oklahoma,Kansas, and Texas through Oklahoma Natural Gas, Kansas Gas Service, and Texas Gas Service, respectively.Larger cities served include Oklahoma City and Tulsa, Oklahoma; Kansas City, Wichita, and Topeka, Kansas;and Austin and El Paso, Texas. ONE Gas began trading on January 31, 2014, following a spin-off distributionof ONE Gas common stock to ONEOK common shareholders (one OGS share for four ONEOK shares). Weconsider OGS to be a low risk, high quality, pure play regulated utility with healthy earnings and dividend growthpotential. Shares offer a $1.12 annual dividend, which we consider secure and growing. OGS has a strongbalance sheet, low risk strategy, and high investment grade credit ratings. As the nation’s third largest publiclytraded natural gas local distribution company, the size of the company and the contiguous nature of the serviceterritories allow for favorable economies of scale. In addition, the company’s three jurisdictions result in someregulatory diversification as well as diversification to regional economics and weather.
UNS Energy Corp. (UNS - $60.41 - NYSE) is the holding company that owns Tucson Electric Power Company(TEP), UniSource Energy Services (UES), UniSource Energy Development Company (UED), and MillenniumEnergy Holdings (Millennium). TEP is a vertically integrated utility that provides regulated electric service toapproximately 406,000 retail customers in southeastern Arizona. UES, through its two operating subsidiaries,UNS Gas and UNS Electric, provides gas and electric service to 249,000 customers in northern and southernArizona. On December 11, 2013, Canadian utility Fortis Inc. announced an agreement to buy the Tucson,Arizona electric utility, UNS Energy, for $60.25 per share, a 31% premium to the previous day’s close. UNSserves approximately 500,000 electric customers and 148,000 gas customers in Arizona through TucsonElectric Power, UNS Gas, and UniSource Energy Services. Fortis is Canada’s largest investor owned utility andserves 2.4 million customers in Canada, New York, and the Caribbean. Fortis closed a $1.3 billion acquisitionof CH Energy Group in June of 2013. The UNS offer price represents a 20.0x and 18.6x P/E multiples of 2013and 2014 earnings of $3.05 and $3.30 per share, respectively. The EV/EBITDA multiple is roughly 10.0x 2012,but 8.0x 2015 EBITDA.
Westar Energy Inc. (WR - $38.19 - NYSE) is an electric utility serving 700,000 customers in central andnortheastern Kansas. WR is well positioned to grow its earnings, given a constructive regulatory environmentthat allows for annual rate adjustments outside of a general rate case to recognize environmental andtransmission investment. WR’s planned annual rate base growth of approximately 8% over the next five yearsis driven by significant investment in rider-eligible environmental control equipment and FERC regulatedtransmission investment. We expect WR to file a general rate case in the spring of 2015 to recognize theremaining investment in the La Cygne environmental retrofit, with rates to go into effect on January 1, 2016.Additionally, WR will invest approximately $200 million per year in electric transmission investment with thegoal of growing transmission rate base to $1.8 billion by 2018 from $1.0 billion at the end of 2013. As a result,we expect higher 2016 earnings power and a significantly improved cash flow outlook, which further supportsdividend growth.
Wisconsin Energy Corp. (WEC - $46.92 - NYSE) is the holding company for Wisconsin Electric, the state’slargest electric utility. WEC is a well managed, high quality regulated electric and gas utility operating in one ofthe more constructive regulatory environments. It serves over 1.1 million electric customers and 1.1 million gascustomers in southeastern, east central, and northern Wisconsin. WEC shares offer a competitive currentreturn and a 7% - 8% annual dividend growth by 2015, to bring the payout ratio up to 65% - 70% in 2017, and4% - 6% long term annual earnings growth. Near term rate base investment is allocated toward infrastructurereplacement, pollution control equipment, and renewable generation. Management expects more than $500million of free cash flow (after dividends) over the five year period, which allows for both dividend growth andshare buybacks. WEC has a $300 million share buyback program authorized for the 2014 to 2017 period. OnJune 23, 2014, WEC announced that it agreed to purchase Integrys Energy for cash and stock, for a total valueof approximately $9.1 billion. The transaction will give the combined company a controlling stake in theAmerican Transmission Corporation and is expected to be accretive in the near term.
July 18, 2014
Note: The views expressed in this Shareholder Commentary reflect those of the Portfolio Manager onlythrough the end of the period stated in this Shareholder Commentary. The Portfolio Manager’s views aresubject to change at any time based on market and other conditions. The information in this ShareholderCommentary represents the opinions of the individual Portfolio Manager and is not intended to be a forecastof future events, a guarantee of future results, or investment advice. Views expressed are those of the PortfolioManager and may differ from those of other portfolio managers or of the Firm as a whole. This ShareholderCommentary does not constitute an offer of any transaction in any securities. Any recommendation containedherein may not be suitable for all investors. Information contained in this Shareholder Commentary has beenobtained from sources we believe to be reliable, but cannot be guaranteed. Beneficial ownership of shares heldin the Fund by Mr. Gabelli and various entities he is deemed to control are disclosed in the Fund’s annual proxystatement.
10
Top Ten HoldingsJune 30, 2014
Northeast UtilitiesONEOK Inc.National Fuel Gas Co.NextEra Energy Inc.Westar Energy Inc.
UNS Energy Corp.Wisconsin Energy Corp.Integrys Energy Group Inc.OGE Energy Corp.El Paso Electric Co.

11
Monthly Distribution Policy for Common Shareholders
The Board of Trustees of the Fund (the “Board”) has reaffirmed the continuation of the Fund’s monthlydistribution policy for the second quarter of 2014. Pursuant to its distribution policy, the Fund paid $0.05 pershare cash distributions on April 23, 2014, May 22, 2014, and June 23, 2014 to common shareholders of recordon April 15, 2014, May 15, 2014, and June 16, 2014, respectively, for a total distribution of $0.15 per shareduring the second quarter of 2014.
Under the Fund’s current distribution policy in 2014, the Fund pays a distribution of $0.05 per share eachmonth ($0.60 per share on an annual basis) and, if necessary, an adjusting distribution in December whichincludes any additional income and realized net capital gains in excess of the monthly distributions for that yearto satisfy the minimum distribution requirements of the Internal Revenue Code.
Each quarter, the Board reviews the amount of any potential distribution and the income, capital gain, orcapital available. The Board will continue to monitor the Fund’s distribution level, taking into consideration theFund’s net asset value and the financial market environment. The Fund’s distribution policy is subject tomodification by the Board at any time. The distribution rate should not be considered the dividend yield or totalreturn on an investment in the Fund.
If the Fund does not generate sufficient earnings (dividends and interest income and realized net capitalgain) equal to or in excess of the aggregate distributions paid by the Fund in a given year, then the amountdistributed in excess of the Fund’s earnings would be deemed a return of capital. Since this would beconsidered a return of a portion of a shareholder’s original investment, it is generally not taxable and is treatedas a reduction in the shareholder’s cost basis. Under federal tax regulations, some or all of the return of capitaldistributed by the Fund may be taxable as ordinary income in certain circumstances. This may occur when theFund has a capital loss carryforward, net capital gains are realized in a fiscal year, and distributions are madein excess of investment company taxable income. Despite the challenges of the extra record keeping, adistribution that incorporates a return of capital serves as a smoothing mechanism resulting in a more stableand consistent cash flow available to shareholders. Long term capital gains, qualified dividend income, ordinaryincome, and paid-in capital, if any, will be allocated on a pro-rata basis to all distributions to commonshareholders for the year. Based on the accounting records of the Fund as of June 16, 2014, each of thedistributions paid to common shareholders in 2014 would include approximately 14% from net investmentincome, 2% from net capital gains and 84% from paid-in capital on a book basis. The estimated componentsof each distribution are updated and provided to shareholders of record in a notice accompanying thedistribution and are available on our website (www.gabelli.com). The final determination of the sources of alldistributions in 2014 will be made after year end and can vary from the quarterly estimates. All shareholderswith taxable accounts will receive written notification regarding the components and tax treatment for all 2014distributions in early 2015 via Form 1099-DIV.
5.625% Series A Cumulative Preferred Shares
The Fund’s 5.625% Series A Cumulative Preferred Shares paid a $0.3515625 per share cash distributionon June 26, 2014 to preferred shareholders of record on June 19, 2014. The Series A Preferred Shares, whichtrade on the NYSE under the symbol “GUT Pr A,” are rated “Aa3” by Moody’s Investors Service and have anannual dividend rate of $1.40625 per share. The Series A Preferred Shares were issued on July 31, 2003 at$25.00 per share and pay distributions quarterly. After five years of call protection, the Series A PreferredShares became callable at any time at the liquidation value of $25.00 per share plus accrued dividends. The
12
next distribution is scheduled for September 2014. The Fund is authorized to purchase its Series A PreferredShares in the open market from time to time when such shares are trading at a discount to the liquidation valueof $25.00 per share. In total through June 30, 2014, the Fund has repurchased and retired 46,712 Series APreferred Shares in the open market under this share repurchase authorization. The Fund did not repurchaseany Series A Preferred Shares during the second quarter of 2014.
Series B Auction Market Cumulative Preferred Shares
During the second quarter of 2014, the dividend rates for the Series B Auction Market CumulativePreferred Shares ranged from 1.616% to 1.624%. Dividend rates for the Series B Preferred Shares may bereset every seven days based on the results of an auction. Since February 2008, the number of Series BPreferred Shares subject to bid orders by potential holders has been less than the number of sell orders.Therefore the weekly auctions have failed, and the holders have not been able to sell any or all of the SeriesB Preferred Shares for which they submitted sell orders. The dividend rate since then has been the maximumrate. At June 30, 2014, the maximum rate was 150 basis points greater than the seven day Telerate/BritishBankers Association LIBOR. The Series B Preferred Shares were rated “Aa3” by Moody’s Investors Servicesand “AA” by Fitch Ratings. The Series B Preferred Shares do not trade on an exchange. The Fund issued 1,000Series B Preferred Shares on July 31, 2003 at $25,000 per share. As of June 30, 2014, 900 Series B PreferredShares were outstanding.
The Board shares the Investment Adviser’s view that the issuance of the Preferred Shares is designed tobenefit the common shareholders. To the extent that the Fund earns in excess of the dividend rate on thePreferred Shares, additional value will thereby be created for its common shareholders.
Long term capital gains, qualified dividend income, and ordinary income, if any, will be allocated on a pro-rata basis to all distributions to preferred shareholders for the year. Based on the accounting records of theFund as of June 16, 2014, the current distribution to preferred shareholders would be deemed 86% from netinvestment income and 14% from net capital gains on a book basis. The estimated components of eachdistribution are updated and provided to shareholders of record in a notice accompanying the distribution andare available on our website (www.gabelli.com). The final determination of the sources of all distributions in2014 will be made after year end and can vary from the quarterly estimates. All shareholders with taxableaccounts will receive written notification regarding the components and tax treatment for all 2014 distributionsin early 2015 via Form 1099-DIV.
Tax Treatment of Distributions to Common and Preferred Shareholders
All or part of the distribution may be treated as long term capital gain or qualified dividend income (or acombination of both) for individuals, each subject to the maximum federal income tax rate, which is currently20% in taxable accounts for individuals. In addition, certain U.S. shareholders who are individuals, estates, ortrusts and whose income exceeds certain thresholds will be required to pay a 3.8% Medicare tax on their “netinvestment income,” which includes dividends received from the Fund and capital gains from the sale or otherdisposition of shares of the Fund.
13
www.gabelli.com
Please visit us on the Internet. Our homepage at www.gabelli.com contains information about GAMCOInvestors, Inc., the Gabelli/GAMCO Closed-End Funds and Mutual Funds, IRAs, 401(k)s, current and historicalquarterly reports, closing prices, and other current news. We welcome your comments and questions via e-mail at [email protected].
You may sign up for our e-mail alerts at www.gabelli.com and receive notice of quarterly report availability,news events, media sightings, and mutual fund prices and performance.
e-delivery
We are pleased to offer electronic delivery of Gabelli fund documents. Shareholders of our closed-endfunds can now elect to receive e-mail announcements regarding available materials, including shareholdercommentaries and Fund reports. For more information or to register for e-delivery, please visit our website atwww.gabelli.com.

THE GABELLI UTILITY TRUSTAND YOUR PERSONAL PRIVACY
Who are we?
The Gabelli Utility Trust (the “Fund”) is a closed-end management investment companyregistered with the Securities and Exchange Commission under the Investment Company Actof 1940. We are managed by Gabelli Funds, LLC and GAMCO Asset Management Inc., whichare affiliated with GAMCO Investors, Inc. GAMCO Investors, Inc. is a publicly held companythat has subsidiaries that provide investment advisory or brokerage services for a variety ofclients.
What kind of non-public information do we collect about you if you become a fundshareholder?
When you purchase shares of the Fund on the New York Stock Exchange, you have theoption of registering directly with our transfer agent in order, for example, to participate in ourdividend reinvestment plan.• Information you give us on your application form. This could include your name, address,
telephone number, social security number, bank account number, and other information.• Information about your transactions with us. This would include information about the
shares that you buy or sell; it may also include information about whether you sell orexercise rights that we have issued from time to time. If we hire someone else to provideservices—like a transfer agent—we will also have information about the transactions thatyou conduct through them.
What information do we disclose and to whom do we disclose it?
We do not disclose any non-public personal information about our customers or formercustomers to anyone other than our affiliates, our service providers who need to know suchinformation, and as otherwise permitted by law. If you want to find out what the law permits,you can read the privacy rules adopted by the Securities and Exchange Commission. Theyare in volume 17 of the Code of Federal Regulations, Part 248. The Commission often postsinformation about its regulations on its website, www.sec.gov.
What do we do to protect your personal information?
We restrict access to non-public personal information about you to the people who need to knowthat information in order to provide services to you or the fund and to ensure that we arecomplying with the laws governing the securities business. We maintain physical, electronic,and procedural safeguards to keep your personal information confidential.
THE GABELLI UTILITY TRUSTOne Corporate CenterRye, NY 10580-1422
Notice is hereby given in accordance with Section 23(c) of the Investment Company Act of 1940, as amended, that theFund may from time to time purchase its common shares in the open market when the Fund’s shares are trading at adiscount of 10% or more from the net asset value of the shares. The Fund may also from time to time purchase itspreferred shares in the open market when the preferred shares are trading at a discount to the liquidation value.
The Net Asset Value per share appears in the Publicly Traded Funds column, under the heading “SpecializedEquity Funds,” in Monday’s The Wall Street Journal. It is also listed in Barron’s Mutual Funds/Closed EndFunds section under the heading “Specialized Equity Funds.”The Net Asset Value per share may be obtained each day by calling (914) 921-5070 or visiting www.gabelli.com. The NASDAQ symbol for the Net Asset Value per share is “XGUTX.”
This report is printed on recycled paper.
Portfolio Manager Biography
Mario J. Gabelli, CFA, is Chairman and Chief Executive Officer of GAMCO Investors, Inc. that he founded in1977 and Chief Investment Officer – Value Portfolios of Gabelli Funds, LLC and GAMCO Asset ManagementInc. Mr. Gabelli is a summa cum laude graduate of Fordham University and holds an MBA degree fromColumbia Business School and Honorary Doctorates from Fordham University and Roger Williams University.
We have separated the portfolio manager’s commentary from the financial statements and investment portfolio due tocorporate governance regulations stipulated by the Sarbanes-Oxley Act of 2002. We have done this to ensure that thecontent of the portfolio manager’s commentary is unrestricted. The financial statements and investment portfolio aremailed separately from the commentary. Both the commentary and the financial statements, including the portfolio ofinvestments, will be available on our website at www.gabelli.com.
THE GABELLI UTILITY TRUST One Corporate CenterRye, NY 10580-1422
t 800-GABELLI (800-422-3554)f 914-921-5118e [email protected]
GABELL I .COM
TRUSTEES
Mario J. Gabelli, CFAChairman & Chief Executive Officer, GAMCO Investors, Inc.
Anthony J. ColavitaPresident, Anthony J. Colavita, P.C.
James P. ConnFormer Managing Director &Chief Investment Officer,Financial Security AssuranceHoldings Ltd.
Vincent D. EnrightFormer Senior Vice President &Chief Financial Officer,KeySpan Corp.
Frank J. Fahrenkopf, Jr.Former President & Chief Executive Officer,American Gaming Association
John D. GabelliSenior Vice President,Gabelli & Company, Inc.
Robert J. MorrisseyPartner,Morrissey, Hawkins & Lynch
Kuni NakamuraPresident, Advanced Polymer, Inc.
Anthony R. PustorinoCertified Public Accountant,Professor Emeritus, Pace University
Salvatore J. ZizzaChairman, Zizza & Associates Corp.
OFFICERS
Bruce N. AlpertPresident
Andrea R. MangoSecretary & Vice President
Agnes MulladyTreasurer
Richard J. WalzChief Compliance Officer
David I. SchachterVice President & Ombudsman
INVESTMENT ADVISER
Gabelli Funds, LLCOne Corporate CenterRye, New York 10580-1422
CUSTODIAN
The Bank of New York Mellon
COUNSEL
Willkie Farr & Gallagher LLP
TRANSFER AGENT ANDREGISTRAR
Computershare Trust Company, N.A.
THEGABELL IUT IL ITYTRUST
Shareholder CommentaryJune 30, 2014
GUT Jun/2014
GUT
Mario J. Gabelli, CFAPortfolio Manager
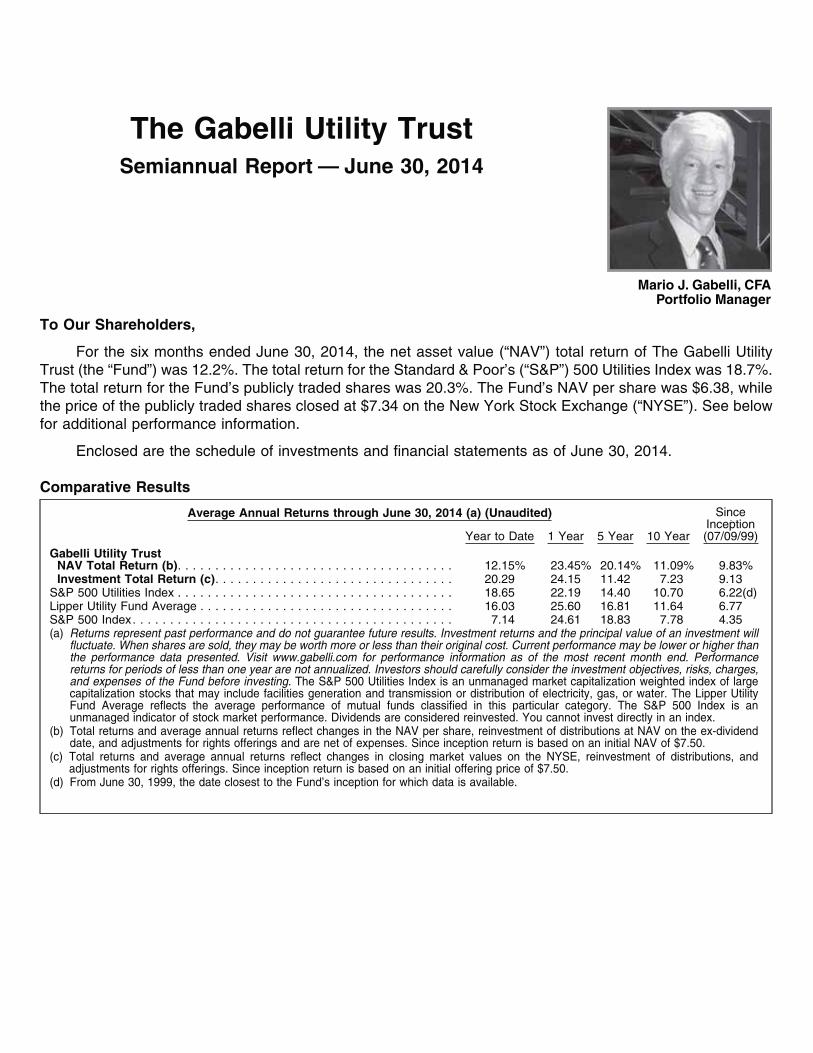
To Our Shareholders,
For the six months ended June 30, 2014, the net asset value (“NAV”) total return of The Gabelli UtilityTrust (the “Fund”) was 12.2%. The total return for the Standard & Poor’s (“S&P”) 500 Utilities Index was 18.7%.The total return for the Fund’s publicly traded shares was 20.3%. The Fund’s NAV per share was $6.38, whilethe price of the publicly traded shares closed at $7.34 on the New York Stock Exchange (“NYSE”). See belowfor additional performance information.
Enclosed are the schedule of investments and financial statements as of June 30, 2014.
Comparative Results
Average Annual Returns through June 30, 2014 (a) (Unaudited)
Year to Date 1 Year 5 Year 10 Year
SinceInception(07/09/99)
Gabelli Utility TrustNAV Total Return (b). . . . . . . . . . . . . . . . . . . . . . . . . . . . . . . . . . . . . 12.15% 23.45% 20.14% 11.09% 9.83%Investment Total Return (c). . . . . . . . . . . . . . . . . . . . . . . . . . . . . . . . 20.29 24.15 11.42 7.23 9.13
S&P 500 Utilities Index . . . . . . . . . . . . . . . . . . . . . . . . . . . . . . . . . . . . . 18.65 22.19 14.40 10.70 6.22(d)Lipper Utility Fund Average . . . . . . . . . . . . . . . . . . . . . . . . . . . . . . . . . . 16.03 25.60 16.81 11.64 6.77S&P 500 Index. . . . . . . . . . . . . . . . . . . . . . . . . . . . . . . . . . . . . . . . . . . 7.14 24.61 18.83 7.78 4.35(a) Returns represent past performance and do not guarantee future results. Investment returns and the principal value of an investment will
fluctuate. When shares are sold, they may be worth more or less than their original cost. Current performance may be lower or higher thanthe performance data presented. Visit www.gabelli.com for performance information as of the most recent month end. Performancereturns for periods of less than one year are not annualized. Investors should carefully consider the investment objectives, risks, charges,and expenses of the Fund before investing. The S&P 500 Utilities Index is an unmanaged market capitalization weighted index of largecapitalization stocks that may include facilities generation and transmission or distribution of electricity, gas, or water. The Lipper UtilityFund Average reflects the average performance of mutual funds classified in this particular category. The S&P 500 Index is anunmanaged indicator of stock market performance. Dividends are considered reinvested. You cannot invest directly in an index.
(b) Total returns and average annual returns reflect changes in the NAV per share, reinvestment of distributions at NAV on the ex-dividenddate, and adjustments for rights offerings and are net of expenses. Since inception return is based on an initial NAV of $7.50.
(c) Total returns and average annual returns reflect changes in closing market values on the NYSE, reinvestment of distributions, andadjustments for rights offerings. Since inception return is based on an initial offering price of $7.50.
(d) From June 30, 1999, the date closest to the Fund’s inception for which data is available.
The Gabelli Utility TrustSemiannual Report — June 30, 2014
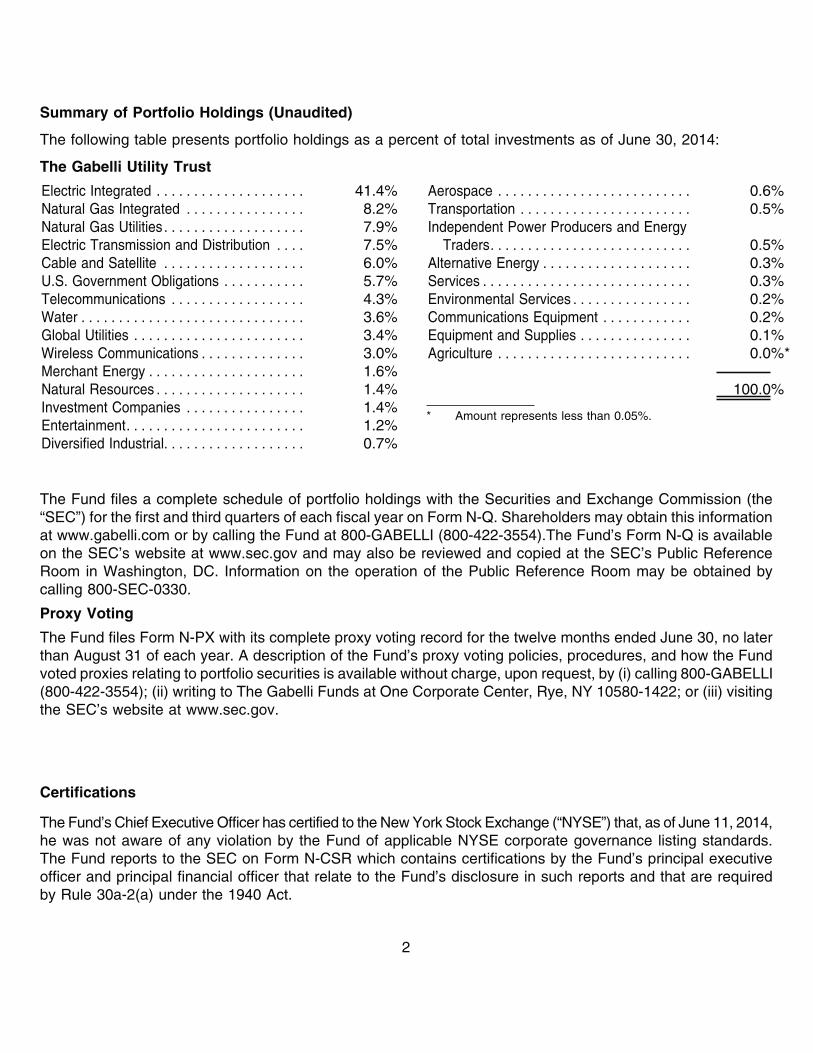
The following table presents portfolio holdings as a percent of total investments as of June 30, 2014:
The Gabelli Utility Trust
Electric Integrated . . . . . . . . . . . . . . . . . . . . 41.4%Natural Gas Integrated . . . . . . . . . . . . . . . . 8.2%Natural Gas Utilities . . . . . . . . . . . . . . . . . . . 7.9%Electric Transmission and Distribution . . . . 7.5%Cable and Satellite . . . . . . . . . . . . . . . . . . . 6.0%U.S. Government Obligations . . . . . . . . . . . 5.7%Telecommunications . . . . . . . . . . . . . . . . . . 4.3%Water . . . . . . . . . . . . . . . . . . . . . . . . . . . . . . 3.6%Global Utilities . . . . . . . . . . . . . . . . . . . . . . . 3.4%Wireless Communications . . . . . . . . . . . . . . 3.0%Merchant Energy . . . . . . . . . . . . . . . . . . . . . 1.6%Natural Resources . . . . . . . . . . . . . . . . . . . . 1.4%Investment Companies . . . . . . . . . . . . . . . . 1.4%Entertainment. . . . . . . . . . . . . . . . . . . . . . . . 1.2%Diversified Industrial. . . . . . . . . . . . . . . . . . . 0.7%
Aerospace . . . . . . . . . . . . . . . . . . . . . . . . . . 0.6%Transportation . . . . . . . . . . . . . . . . . . . . . . . 0.5%Independent Power Producers and Energy
Traders. . . . . . . . . . . . . . . . . . . . . . . . . . . 0.5%Alternative Energy . . . . . . . . . . . . . . . . . . . . 0.3%Services . . . . . . . . . . . . . . . . . . . . . . . . . . . . 0.3%Environmental Services . . . . . . . . . . . . . . . . 0.2%Communications Equipment . . . . . . . . . . . . 0.2%Equipment and Supplies . . . . . . . . . . . . . . . 0.1%Agriculture . . . . . . . . . . . . . . . . . . . . . . . . . . 0.0%*
100.0%
* Amount represents less than 0.05%.
The Fund files a complete schedule of portfolio holdings with the Securities and Exchange Commission (the“SEC”) for the first and third quarters of each fiscal year on Form N-Q. Shareholders may obtain this informationat www.gabelli.com or by calling the Fund at 800-GABELLI (800-422-3554).The Fund’s Form N-Q is availableon the SEC’s website at www.sec.gov and may also be reviewed and copied at the SEC’s Public ReferenceRoom in Washington, DC. Information on the operation of the Public Reference Room may be obtained bycalling 800-SEC-0330.
Proxy Voting
The Fund files Form N-PX with its complete proxy voting record for the twelve months ended June 30, no laterthan August 31 of each year. A description of the Fund’s proxy voting policies, procedures, and how the Fundvoted proxies relating to portfolio securities is available without charge, upon request, by (i) calling 800-GABELLI(800-422-3554); (ii) writing to The Gabelli Funds at One Corporate Center, Rye, NY 10580-1422; or (iii) visitingthe SEC’s website at www.sec.gov.
Certifications
The Fund’s Chief Executive Officer has certified to the New York Stock Exchange (“NYSE”) that, as of June 11, 2014,he was not aware of any violation by the Fund of applicable NYSE corporate governance listing standards.The Fund reports to the SEC on Form N-CSR which contains certifications by the Fund’s principal executiveofficer and principal financial officer that relate to the Fund’s disclosure in such reports and that are requiredby Rule 30a-2(a) under the 1940 Act.
Summary of Portfolio Holdings (Unaudited)
2
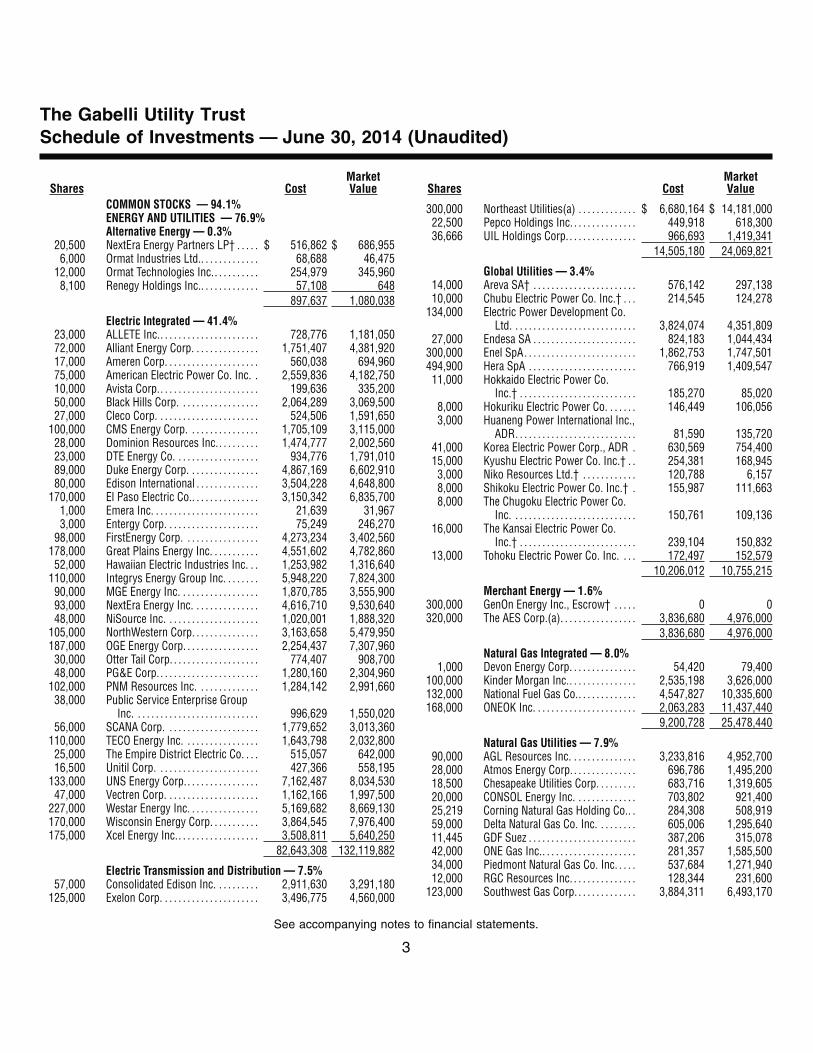
Shares CostMarketValue
COMMON STOCKS — 94.1%ENERGY AND UTILITIES — 76.9%Alternative Energy — 0.3%
20,500 NextEra Energy Partners LP† . . . . . $ 516,862 $ 686,9556,000 Ormat Industries Ltd.. . . . . . . . . . . . . 68,688 46,475
12,000 Ormat Technologies Inc.. . . . . . . . . . 254,979 345,9608,100 Renegy Holdings Inc.. . . . . . . . . . . . . 57,108 648
897,637 1,080,038
Electric Integrated — 41.4%23,000 ALLETE Inc.. . . . . . . . . . . . . . . . . . . . . . 728,776 1,181,05072,000 Alliant Energy Corp. . . . . . . . . . . . . . . 1,751,407 4,381,92017,000 Ameren Corp. . . . . . . . . . . . . . . . . . . . . 560,038 694,96075,000 American Electric Power Co. Inc. . 2,559,836 4,182,75010,000 Avista Corp.. . . . . . . . . . . . . . . . . . . . . . 199,636 335,20050,000 Black Hills Corp. . . . . . . . . . . . . . . . . . 2,064,289 3,069,50027,000 Cleco Corp. . . . . . . . . . . . . . . . . . . . . . . 524,506 1,591,650
100,000 CMS Energy Corp. . . . . . . . . . . . . . . . 1,705,109 3,115,00028,000 Dominion Resources Inc.. . . . . . . . . 1,474,777 2,002,56023,000 DTE Energy Co. . . . . . . . . . . . . . . . . . . 934,776 1,791,01089,000 Duke Energy Corp. . . . . . . . . . . . . . . . 4,867,169 6,602,91080,000 Edison International . . . . . . . . . . . . . . 3,504,228 4,648,800
170,000 El Paso Electric Co.. . . . . . . . . . . . . . . 3,150,342 6,835,7001,000 Emera Inc. . . . . . . . . . . . . . . . . . . . . . . . 21,639 31,9673,000 Entergy Corp. . . . . . . . . . . . . . . . . . . . . 75,249 246,270
98,000 FirstEnergy Corp. . . . . . . . . . . . . . . . . 4,273,234 3,402,560178,000 Great Plains Energy Inc. . . . . . . . . . . 4,551,602 4,782,860
52,000 Hawaiian Electric Industries Inc. . . 1,253,982 1,316,640110,000 Integrys Energy Group Inc. . . . . . . . 5,948,220 7,824,30090,000 MGE Energy Inc. . . . . . . . . . . . . . . . . . 1,870,785 3,555,90093,000 NextEra Energy Inc. . . . . . . . . . . . . . . 4,616,710 9,530,64048,000 NiSource Inc. . . . . . . . . . . . . . . . . . . . . 1,020,001 1,888,320
105,000 NorthWestern Corp. . . . . . . . . . . . . . . 3,163,658 5,479,950187,000 OGE Energy Corp. . . . . . . . . . . . . . . . . 2,254,437 7,307,96030,000 Otter Tail Corp. . . . . . . . . . . . . . . . . . . . 774,407 908,70048,000 PG&E Corp. . . . . . . . . . . . . . . . . . . . . . . 1,280,160 2,304,960
102,000 PNM Resources Inc. . . . . . . . . . . . . . 1,284,142 2,991,66038,000 Public Service Enterprise Group
Inc. . . . . . . . . . . . . . . . . . . . . . . . . . . . 996,629 1,550,02056,000 SCANA Corp. . . . . . . . . . . . . . . . . . . . . 1,779,652 3,013,360
110,000 TECO Energy Inc. . . . . . . . . . . . . . . . . 1,643,798 2,032,80025,000 The Empire District Electric Co. . . . 515,057 642,00016,500 Unitil Corp. . . . . . . . . . . . . . . . . . . . . . . 427,366 558,195
133,000 UNS Energy Corp.. . . . . . . . . . . . . . . . 7,162,487 8,034,53047,000 Vectren Corp. . . . . . . . . . . . . . . . . . . . . 1,162,166 1,997,500
227,000 Westar Energy Inc. . . . . . . . . . . . . . . . 5,169,682 8,669,130170,000 Wisconsin Energy Corp. . . . . . . . . . . 3,864,545 7,976,400175,000 Xcel Energy Inc.. . . . . . . . . . . . . . . . . . 3,508,811 5,640,250
82,643,308 132,119,882
Electric Transmission and Distribution — 7.5%57,000 Consolidated Edison Inc. . . . . . . . . . 2,911,630 3,291,180
125,000 Exelon Corp. . . . . . . . . . . . . . . . . . . . . . 3,496,775 4,560,000
Shares CostMarketValue
300,000 Northeast Utilities(a) . . . . . . . . . . . . . $ 6,680,164 $ 14,181,00022,500 Pepco Holdings Inc. . . . . . . . . . . . . . . 449,918 618,30036,666 UIL Holdings Corp. . . . . . . . . . . . . . . . 966,693 1,419,341
14,505,180 24,069,821
Global Utilities — 3.4%14,000 Areva SA† . . . . . . . . . . . . . . . . . . . . . . . 576,142 297,13810,000 Chubu Electric Power Co. Inc.† . . . 214,545 124,278
134,000 Electric Power Development Co.Ltd. . . . . . . . . . . . . . . . . . . . . . . . . . . . 3,824,074 4,351,809
27,000 Endesa SA . . . . . . . . . . . . . . . . . . . . . . . 824,183 1,044,434300,000 Enel SpA. . . . . . . . . . . . . . . . . . . . . . . . . 1,862,753 1,747,501494,900 Hera SpA . . . . . . . . . . . . . . . . . . . . . . . . 766,919 1,409,54711,000 Hokkaido Electric Power Co.
Inc.† . . . . . . . . . . . . . . . . . . . . . . . . . . 185,270 85,0208,000 Hokuriku Electric Power Co. . . . . . . 146,449 106,0563,000 Huaneng Power International Inc.,
ADR. . . . . . . . . . . . . . . . . . . . . . . . . . . 81,590 135,72041,000 Korea Electric Power Corp., ADR . 630,569 754,40015,000 Kyushu Electric Power Co. Inc.† . . 254,381 168,9453,000 Niko Resources Ltd.† . . . . . . . . . . . . 120,788 6,1578,000 Shikoku Electric Power Co. Inc.† . 155,987 111,6638,000 The Chugoku Electric Power Co.
Inc. . . . . . . . . . . . . . . . . . . . . . . . . . . . 150,761 109,13616,000 The Kansai Electric Power Co.
Inc.† . . . . . . . . . . . . . . . . . . . . . . . . . . 239,104 150,83213,000 Tohoku Electric Power Co. Inc. . . . 172,497 152,579
10,206,012 10,755,215
Merchant Energy — 1.6%300,000 GenOn Energy Inc., Escrow† . . . . . 0 0320,000 The AES Corp.(a). . . . . . . . . . . . . . . . . 3,836,680 4,976,000
3,836,680 4,976,000
Natural Gas Integrated — 8.0%1,000 Devon Energy Corp. . . . . . . . . . . . . . . 54,420 79,400
100,000 Kinder Morgan Inc.. . . . . . . . . . . . . . . 2,535,198 3,626,000132,000 National Fuel Gas Co.. . . . . . . . . . . . . 4,547,827 10,335,600168,000 ONEOK Inc. . . . . . . . . . . . . . . . . . . . . . . 2,063,283 11,437,440
9,200,728 25,478,440
Natural Gas Utilities — 7.9%90,000 AGL Resources Inc. . . . . . . . . . . . . . . 3,233,816 4,952,70028,000 Atmos Energy Corp. . . . . . . . . . . . . . . 696,786 1,495,20018,500 Chesapeake Utilities Corp. . . . . . . . . 683,716 1,319,60520,000 CONSOL Energy Inc. . . . . . . . . . . . . . 703,802 921,40025,219 Corning Natural Gas Holding Co.. . 284,308 508,91959,000 Delta Natural Gas Co. Inc. . . . . . . . . 605,006 1,295,64011,445 GDF Suez . . . . . . . . . . . . . . . . . . . . . . . . 387,206 315,07842,000 ONE Gas Inc.. . . . . . . . . . . . . . . . . . . . . 281,357 1,585,50034,000 Piedmont Natural Gas Co. Inc. . . . . 537,684 1,271,94012,000 RGC Resources Inc. . . . . . . . . . . . . . . 128,344 231,600
123,000 Southwest Gas Corp. . . . . . . . . . . . . . 3,884,311 6,493,170
The Gabelli Utility TrustSchedule of Investments — June 30, 2014 (Unaudited)
See accompanying notes to financial statements.
3
Shares CostMarketValue
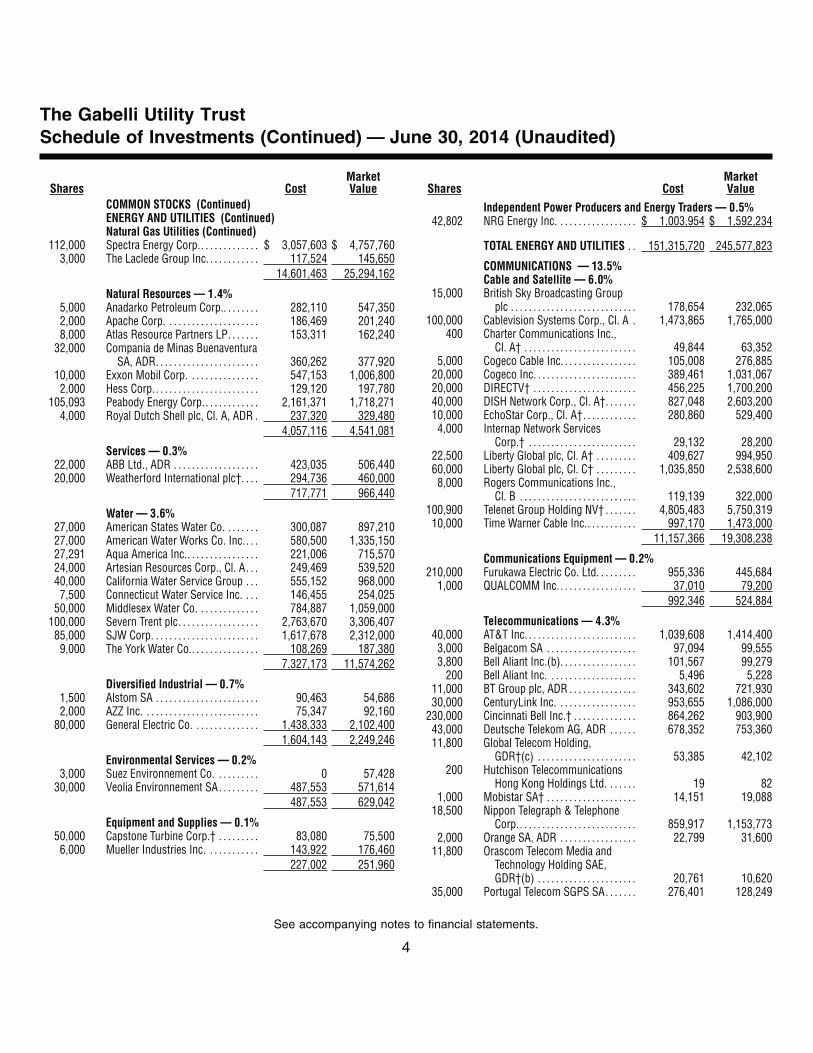
COMMON STOCKS (Continued)ENERGY AND UTILITIES (Continued)Natural Gas Utilities (Continued)
112,000 Spectra Energy Corp.. . . . . . . . . . . . . $ 3,057,603 $ 4,757,7603,000 The Laclede Group Inc. . . . . . . . . . . . 117,524 145,650
14,601,463 25,294,162
Natural Resources — 1.4%5,000 Anadarko Petroleum Corp.. . . . . . . . 282,110 547,3502,000 Apache Corp. . . . . . . . . . . . . . . . . . . . . 186,469 201,2408,000 Atlas Resource Partners LP. . . . . . . 153,311 162,240
32,000 Compania de Minas BuenaventuraSA, ADR. . . . . . . . . . . . . . . . . . . . . . . 360,262 377,920
10,000 Exxon Mobil Corp. . . . . . . . . . . . . . . . 547,153 1,006,8002,000 Hess Corp.. . . . . . . . . . . . . . . . . . . . . . . 129,120 197,780
105,093 Peabody Energy Corp.. . . . . . . . . . . . 2,161,371 1,718,2714,000 Royal Dutch Shell plc, Cl. A, ADR . 237,320 329,480
4,057,116 4,541,081
Services — 0.3%22,000 ABB Ltd., ADR . . . . . . . . . . . . . . . . . . . 423,035 506,44020,000 Weatherford International plc†. . . . 294,736 460,000
717,771 966,440
Water — 3.6%27,000 American States Water Co. . . . . . . . 300,087 897,21027,000 American Water Works Co. Inc.. . . 580,500 1,335,15027,291 Aqua America Inc.. . . . . . . . . . . . . . . . 221,006 715,57024,000 Artesian Resources Corp., Cl. A. . . 249,469 539,52040,000 California Water Service Group . . . 555,152 968,0007,500 Connecticut Water Service Inc. . . . 146,455 254,025
50,000 Middlesex Water Co. . . . . . . . . . . . . . 784,887 1,059,000100,000 Severn Trent plc. . . . . . . . . . . . . . . . . . 2,763,670 3,306,40785,000 SJW Corp. . . . . . . . . . . . . . . . . . . . . . . . 1,617,678 2,312,0009,000 The York Water Co.. . . . . . . . . . . . . . . 108,269 187,380
7,327,173 11,574,262
Diversified Industrial — 0.7%1,500 Alstom SA . . . . . . . . . . . . . . . . . . . . . . . 90,463 54,6862,000 AZZ Inc. . . . . . . . . . . . . . . . . . . . . . . . . . 75,347 92,160
80,000 General Electric Co. . . . . . . . . . . . . . . 1,438,333 2,102,4001,604,143 2,249,246
Environmental Services — 0.2%3,000 Suez Environnement Co. . . . . . . . . . 0 57,428
30,000 Veolia Environnement SA. . . . . . . . . 487,553 571,614487,553 629,042
Equipment and Supplies — 0.1%50,000 Capstone Turbine Corp.† . . . . . . . . . 83,080 75,5006,000 Mueller Industries Inc. . . . . . . . . . . . 143,922 176,460
227,002 251,960
Shares CostMarketValue
Independent Power Producers and Energy Traders — 0.5%42,802 NRG Energy Inc. . . . . . . . . . . . . . . . . . $ 1,003,954 $ 1,592,234
TOTAL ENERGY AND UTILITIES . . 151,315,720 245,577,823
COMMUNICATIONS — 13.5%Cable and Satellite — 6.0%
15,000 British Sky Broadcasting Groupplc . . . . . . . . . . . . . . . . . . . . . . . . . . . . 178,654 232,065
100,000 Cablevision Systems Corp., Cl. A . 1,473,865 1,765,000400 Charter Communications Inc.,
Cl. A† . . . . . . . . . . . . . . . . . . . . . . . . . 49,844 63,3525,000 Cogeco Cable Inc. . . . . . . . . . . . . . . . . 105,008 276,885
20,000 Cogeco Inc. . . . . . . . . . . . . . . . . . . . . . . 389,461 1,031,06720,000 DIRECTV† . . . . . . . . . . . . . . . . . . . . . . . 456,225 1,700,20040,000 DISH Network Corp., Cl. A†. . . . . . . 827,048 2,603,20010,000 EchoStar Corp., Cl. A†. . . . . . . . . . . . 280,860 529,4004,000 Internap Network Services
Corp.† . . . . . . . . . . . . . . . . . . . . . . . . 29,132 28,20022,500 Liberty Global plc, Cl. A† . . . . . . . . . 409,627 994,95060,000 Liberty Global plc, Cl. C† . . . . . . . . . 1,035,850 2,538,6008,000 Rogers Communications Inc.,
Cl. B . . . . . . . . . . . . . . . . . . . . . . . . . . 119,139 322,000100,900 Telenet Group Holding NV† . . . . . . . 4,805,483 5,750,31910,000 Time Warner Cable Inc.. . . . . . . . . . . 997,170 1,473,000
11,157,366 19,308,238
Communications Equipment — 0.2%210,000 Furukawa Electric Co. Ltd. . . . . . . . . 955,336 445,684
1,000 QUALCOMM Inc. . . . . . . . . . . . . . . . . . 37,010 79,200992,346 524,884
Telecommunications — 4.3%40,000 AT&T Inc. . . . . . . . . . . . . . . . . . . . . . . . . 1,039,608 1,414,400
3,000 Belgacom SA . . . . . . . . . . . . . . . . . . . . 97,094 99,5553,800 Bell Aliant Inc.(b). . . . . . . . . . . . . . . . . 101,567 99,279
200 Bell Aliant Inc. . . . . . . . . . . . . . . . . . . . 5,496 5,22811,000 BT Group plc, ADR . . . . . . . . . . . . . . . 343,602 721,93030,000 CenturyLink Inc. . . . . . . . . . . . . . . . . . 953,655 1,086,000
230,000 Cincinnati Bell Inc.† . . . . . . . . . . . . . . 864,262 903,90043,000 Deutsche Telekom AG, ADR . . . . . . 678,352 753,36011,800 Global Telecom Holding,
GDR†(c) . . . . . . . . . . . . . . . . . . . . . . 53,385 42,102200 Hutchison Telecommunications
Hong Kong Holdings Ltd. . . . . . . 19 821,000 Mobistar SA† . . . . . . . . . . . . . . . . . . . . 14,151 19,088
18,500 Nippon Telegraph & TelephoneCorp.. . . . . . . . . . . . . . . . . . . . . . . . . . 859,917 1,153,773
2,000 Orange SA, ADR . . . . . . . . . . . . . . . . . 22,799 31,60011,800 Orascom Telecom Media and
Technology Holding SAE,GDR†(b) . . . . . . . . . . . . . . . . . . . . . . 20,761 10,620
35,000 Portugal Telecom SGPS SA. . . . . . . 276,401 128,249
The Gabelli Utility TrustSchedule of Investments (Continued) — June 30, 2014 (Unaudited)
See accompanying notes to financial statements.
4
Shares CostMarketValue
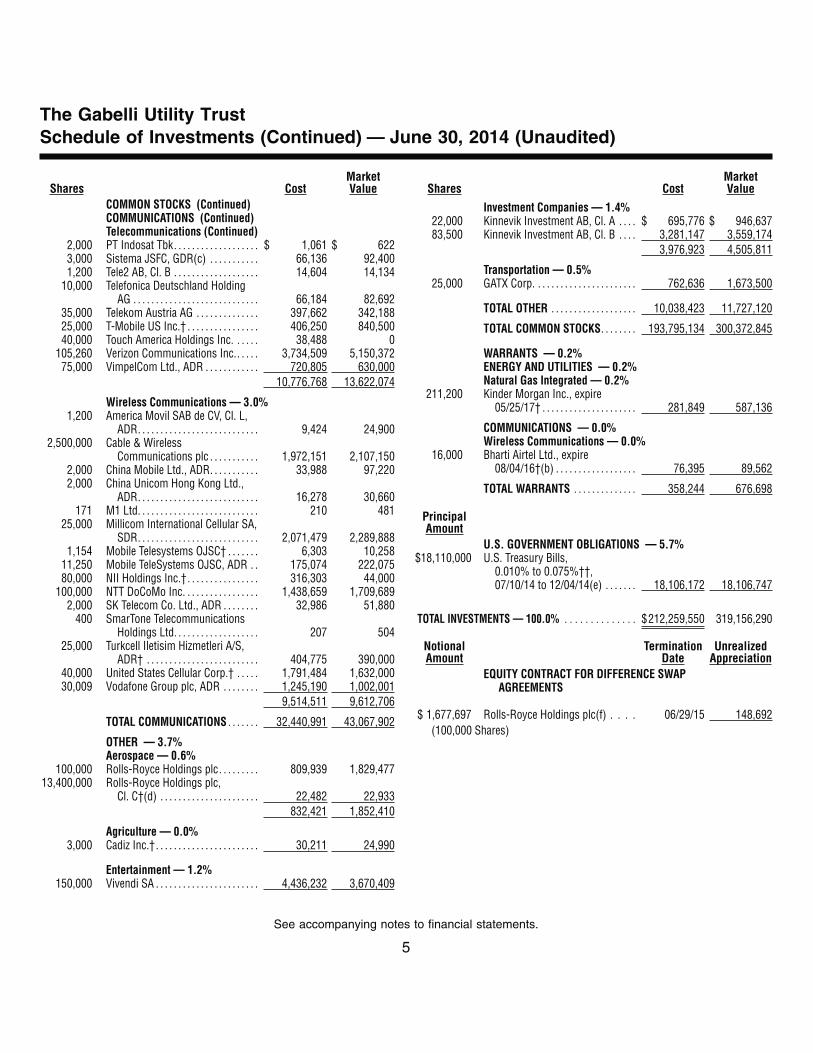
COMMON STOCKS (Continued)COMMUNICATIONS (Continued)Telecommunications (Continued)
2,000 PT Indosat Tbk. . . . . . . . . . . . . . . . . . . $ 1,061 $ 6223,000 Sistema JSFC, GDR(c) . . . . . . . . . . . 66,136 92,4001,200 Tele2 AB, Cl. B . . . . . . . . . . . . . . . . . . . 14,604 14,134
10,000 Telefonica Deutschland HoldingAG . . . . . . . . . . . . . . . . . . . . . . . . . . . . 66,184 82,692
35,000 Telekom Austria AG . . . . . . . . . . . . . . 397,662 342,18825,000 T-Mobile US Inc.† . . . . . . . . . . . . . . . . 406,250 840,50040,000 Touch America Holdings Inc. . . . . . 38,488 0
105,260 Verizon Communications Inc.. . . . . 3,734,509 5,150,37275,000 VimpelCom Ltd., ADR . . . . . . . . . . . . 720,805 630,000
10,776,768 13,622,074
Wireless Communications — 3.0%1,200 America Movil SAB de CV, Cl. L,
ADR. . . . . . . . . . . . . . . . . . . . . . . . . . . 9,424 24,9002,500,000 Cable & Wireless
Communications plc . . . . . . . . . . . 1,972,151 2,107,1502,000 China Mobile Ltd., ADR. . . . . . . . . . . 33,988 97,2202,000 China Unicom Hong Kong Ltd.,
ADR. . . . . . . . . . . . . . . . . . . . . . . . . . . 16,278 30,660171 M1 Ltd. . . . . . . . . . . . . . . . . . . . . . . . . . . 210 481
25,000 Millicom International Cellular SA,SDR. . . . . . . . . . . . . . . . . . . . . . . . . . . 2,071,479 2,289,888
1,154 Mobile Telesystems OJSC† . . . . . . . 6,303 10,25811,250 Mobile TeleSystems OJSC, ADR . . 175,074 222,07580,000 NII Holdings Inc.†. . . . . . . . . . . . . . . . 316,303 44,000
100,000 NTT DoCoMo Inc. . . . . . . . . . . . . . . . . 1,438,659 1,709,6892,000 SK Telecom Co. Ltd., ADR . . . . . . . . 32,986 51,880
400 SmarTone TelecommunicationsHoldings Ltd. . . . . . . . . . . . . . . . . . . 207 504
25,000 Turkcell Iletisim Hizmetleri A/S,ADR† . . . . . . . . . . . . . . . . . . . . . . . . . 404,775 390,000
40,000 United States Cellular Corp.† . . . . . 1,791,484 1,632,00030,009 Vodafone Group plc, ADR . . . . . . . . 1,245,190 1,002,001
9,514,511 9,612,706
TOTAL COMMUNICATIONS . . . . . . . 32,440,991 43,067,902
OTHER — 3.7%Aerospace — 0.6%
100,000 Rolls-Royce Holdings plc. . . . . . . . . 809,939 1,829,47713,400,000 Rolls-Royce Holdings plc,
Cl. C†(d) . . . . . . . . . . . . . . . . . . . . . . 22,482 22,933832,421 1,852,410
Agriculture — 0.0%3,000 Cadiz Inc.†. . . . . . . . . . . . . . . . . . . . . . . 30,211 24,990
Entertainment — 1.2%150,000 Vivendi SA . . . . . . . . . . . . . . . . . . . . . . . 4,436,232 3,670,409
Shares CostMarketValue
Investment Companies — 1.4%22,000 Kinnevik Investment AB, Cl. A . . . . $ 695,776 $ 946,63783,500 Kinnevik Investment AB, Cl. B . . . . 3,281,147 3,559,174
3,976,923 4,505,811
Transportation — 0.5%25,000 GATX Corp. . . . . . . . . . . . . . . . . . . . . . . 762,636 1,673,500
TOTAL OTHER . . . . . . . . . . . . . . . . . . . 10,038,423 11,727,120
TOTAL COMMON STOCKS. . . . . . . . 193,795,134 300,372,845
WARRANTS — 0.2%ENERGY AND UTILITIES — 0.2%Natural Gas Integrated — 0.2%
211,200 Kinder Morgan Inc., expire05/25/17† . . . . . . . . . . . . . . . . . . . . . 281,849 587,136
COMMUNICATIONS — 0.0%Wireless Communications — 0.0%
16,000 Bharti Airtel Ltd., expire08/04/16†(b) . . . . . . . . . . . . . . . . . . 76,395 89,562
TOTAL WARRANTS . . . . . . . . . . . . . . 358,244 676,698
PrincipalAmount
U.S. GOVERNMENT OBLIGATIONS — 5.7%$18,110,000 U.S. Treasury Bills,
0.010% to 0.075%††,07/10/14 to 12/04/14(e) . . . . . . . 18,106,172 18,106,747
TOTAL INVESTMENTS — 100.0% . . . . . . . . . . . . . . $212,259,550 319,156,290
NotionalAmount
TerminationDate
UnrealizedAppreciation
EQUITY CONTRACT FOR DIFFERENCE SWAPAGREEMENTS
$ 1,677,697 Rolls-Royce Holdings plc(f) . . . . 06/29/15 148,692(100,000 Shares)
The Gabelli Utility TrustSchedule of Investments (Continued) — June 30, 2014 (Unaudited)
See accompanying notes to financial statements.
5
MarketValue
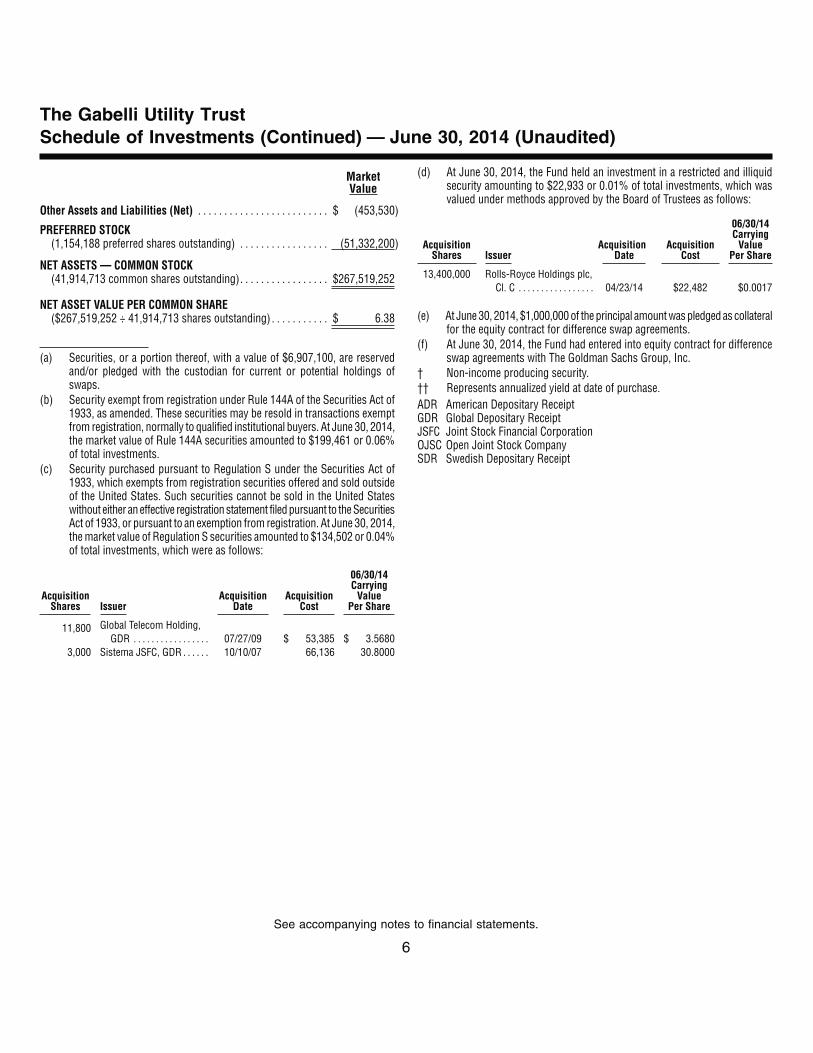
Other Assets and Liabilities (Net) . . . . . . . . . . . . . . . . . . . . . . . . . $ (453,530)
PREFERRED STOCK(1,154,188 preferred shares outstanding) . . . . . . . . . . . . . . . . . (51,332,200)
NET ASSETS — COMMON STOCK(41,914,713 common shares outstanding). . . . . . . . . . . . . . . . . $267,519,252
NET ASSET VALUE PER COMMON SHARE($267,519,252 ÷ 41,914,713 shares outstanding) . . . . . . . . . . . $ 6.38
(a) Securities, or a portion thereof, with a value of $6,907,100, are reservedand/or pledged with the custodian for current or potential holdings ofswaps.
(b) Security exempt from registration under Rule 144A of the Securities Act of1933, as amended. These securities may be resold in transactions exemptfrom registration, normally to qualified institutional buyers. At June 30, 2014,the market value of Rule 144A securities amounted to $199,461 or 0.06%of total investments.
(c) Security purchased pursuant to Regulation S under the Securities Act of1933, which exempts from registration securities offered and sold outsideof the United States. Such securities cannot be sold in the United Stateswithout either an effective registration statement filed pursuant to the SecuritiesAct of 1933, or pursuant to an exemption from registration. At June 30, 2014,the market value of Regulation S securities amounted to $134,502 or 0.04%of total investments, which were as follows:
AcquisitionShares Issuer
AcquisitionDate
AcquisitionCost
06/30/14Carrying
ValuePer Share
11,800 Global Telecom Holding,GDR . . . . . . . . . . . . . . . . . 07/27/09 $ 53,385 $ 3.5680
3,000 Sistema JSFC, GDR . . . . . . 10/10/07 66,136 30.8000
(d) At June 30, 2014, the Fund held an investment in a restricted and illiquidsecurity amounting to $22,933 or 0.01% of total investments, which wasvalued under methods approved by the Board of Trustees as follows:
AcquisitionShares Issuer
AcquisitionDate
AcquisitionCost
06/30/14Carrying
ValuePer Share
13,400,000 Rolls-Royce Holdings plc,Cl. C . . . . . . . . . . . . . . . . . 04/23/14 $22,482 $0.0017
(e) At June 30, 2014, $1,000,000 of the principal amount was pledged as collateralfor the equity contract for difference swap agreements.
(f) At June 30, 2014, the Fund had entered into equity contract for differenceswap agreements with The Goldman Sachs Group, Inc.
† Non-income producing security.†† Represents annualized yield at date of purchase.ADR American Depositary ReceiptGDR Global Depositary ReceiptJSFC Joint Stock Financial CorporationOJSC Open Joint Stock CompanySDR Swedish Depositary Receipt
The Gabelli Utility TrustSchedule of Investments (Continued) — June 30, 2014 (Unaudited)
See accompanying notes to financial statements.
6
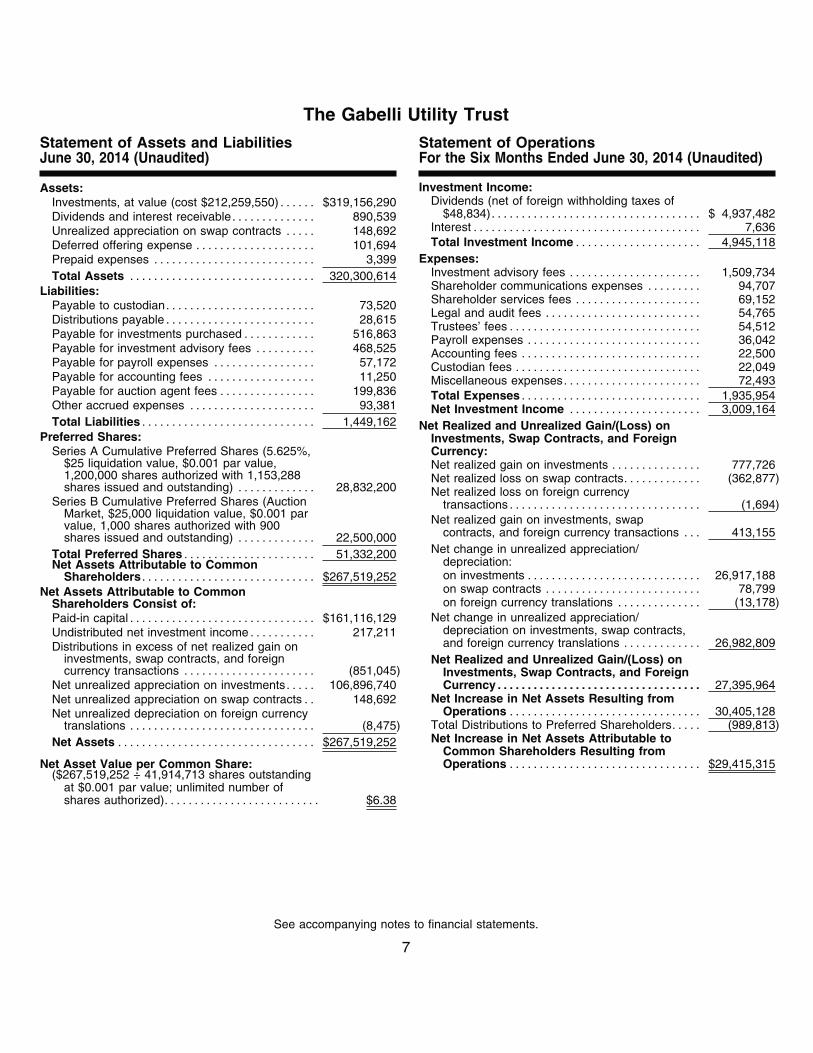
Assets:Investments, at value (cost $212,259,550) . . . . . . $319,156,290Dividends and interest receivable. . . . . . . . . . . . . . 890,539Unrealized appreciation on swap contracts . . . . . 148,692Deferred offering expense . . . . . . . . . . . . . . . . . . . . 101,694Prepaid expenses . . . . . . . . . . . . . . . . . . . . . . . . . . . 3,399Total Assets . . . . . . . . . . . . . . . . . . . . . . . . . . . . . . . 320,300,614
Liabilities:Payable to custodian. . . . . . . . . . . . . . . . . . . . . . . . . 73,520Distributions payable . . . . . . . . . . . . . . . . . . . . . . . . . 28,615Payable for investments purchased . . . . . . . . . . . . 516,863Payable for investment advisory fees . . . . . . . . . . 468,525Payable for payroll expenses . . . . . . . . . . . . . . . . . 57,172Payable for accounting fees . . . . . . . . . . . . . . . . . . 11,250Payable for auction agent fees . . . . . . . . . . . . . . . . 199,836Other accrued expenses . . . . . . . . . . . . . . . . . . . . . 93,381Total Liabilities . . . . . . . . . . . . . . . . . . . . . . . . . . . . . 1,449,162
Preferred Shares:Series A Cumulative Preferred Shares (5.625%,
$25 liquidation value, $0.001 par value,1,200,000 shares authorized with 1,153,288shares issued and outstanding) . . . . . . . . . . . . . 28,832,200
Series B Cumulative Preferred Shares (AuctionMarket, $25,000 liquidation value, $0.001 parvalue, 1,000 shares authorized with 900shares issued and outstanding) . . . . . . . . . . . . . 22,500,000
Total Preferred Shares . . . . . . . . . . . . . . . . . . . . . . 51,332,200Net Assets Attributable to Common
Shareholders . . . . . . . . . . . . . . . . . . . . . . . . . . . . . $267,519,252Net Assets Attributable to Common
Shareholders Consist of:Paid-in capital . . . . . . . . . . . . . . . . . . . . . . . . . . . . . . . $161,116,129Undistributed net investment income . . . . . . . . . . . 217,211Distributions in excess of net realized gain on
investments, swap contracts, and foreigncurrency transactions . . . . . . . . . . . . . . . . . . . . . . (851,045)
Net unrealized appreciation on investments. . . . . 106,896,740Net unrealized appreciation on swap contracts . . 148,692Net unrealized depreciation on foreign currency
translations . . . . . . . . . . . . . . . . . . . . . . . . . . . . . . . (8,475)Net Assets . . . . . . . . . . . . . . . . . . . . . . . . . . . . . . . . . $267,519,252
Net Asset Value per Common Share:($267,519,252 ÷ 41,914,713 shares outstanding
at $0.001 par value; unlimited number ofshares authorized). . . . . . . . . . . . . . . . . . . . . . . . . . $6.38
Investment Income:Dividends (net of foreign withholding taxes of
$48,834). . . . . . . . . . . . . . . . . . . . . . . . . . . . . . . . . . . $ 4,937,482Interest . . . . . . . . . . . . . . . . . . . . . . . . . . . . . . . . . . . . . . 7,636Total Investment Income . . . . . . . . . . . . . . . . . . . . . 4,945,118
Expenses:Investment advisory fees . . . . . . . . . . . . . . . . . . . . . . 1,509,734Shareholder communications expenses . . . . . . . . . 94,707Shareholder services fees . . . . . . . . . . . . . . . . . . . . . 69,152Legal and audit fees . . . . . . . . . . . . . . . . . . . . . . . . . . 54,765Trustees’ fees . . . . . . . . . . . . . . . . . . . . . . . . . . . . . . . . 54,512Payroll expenses . . . . . . . . . . . . . . . . . . . . . . . . . . . . . 36,042Accounting fees . . . . . . . . . . . . . . . . . . . . . . . . . . . . . . 22,500Custodian fees . . . . . . . . . . . . . . . . . . . . . . . . . . . . . . . 22,049Miscellaneous expenses. . . . . . . . . . . . . . . . . . . . . . . 72,493Total Expenses . . . . . . . . . . . . . . . . . . . . . . . . . . . . . . 1,935,954Net Investment Income . . . . . . . . . . . . . . . . . . . . . . 3,009,164
Net Realized and Unrealized Gain/(Loss) onInvestments, Swap Contracts, and ForeignCurrency:Net realized gain on investments . . . . . . . . . . . . . . . 777,726Net realized loss on swap contracts. . . . . . . . . . . . . (362,877)Net realized loss on foreign currency
transactions . . . . . . . . . . . . . . . . . . . . . . . . . . . . . . . . (1,694)Net realized gain on investments, swap
contracts, and foreign currency transactions . . . 413,155Net change in unrealized appreciation/
depreciation:on investments . . . . . . . . . . . . . . . . . . . . . . . . . . . . . 26,917,188on swap contracts . . . . . . . . . . . . . . . . . . . . . . . . . . 78,799on foreign currency translations . . . . . . . . . . . . . . (13,178)
Net change in unrealized appreciation/depreciation on investments, swap contracts,and foreign currency translations . . . . . . . . . . . . . 26,982,809
Net Realized and Unrealized Gain/(Loss) onInvestments, Swap Contracts, and ForeignCurrency . . . . . . . . . . . . . . . . . . . . . . . . . . . . . . . . . . 27,395,964
Net Increase in Net Assets Resulting fromOperations . . . . . . . . . . . . . . . . . . . . . . . . . . . . . . . . 30,405,128
Total Distributions to Preferred Shareholders. . . . . (989,813)Net Increase in Net Assets Attributable to
Common Shareholders Resulting fromOperations . . . . . . . . . . . . . . . . . . . . . . . . . . . . . . . . $29,415,315
The Gabelli Utility Trust
Statement of Assets and LiabilitiesJune 30, 2014 (Unaudited)
Statement of OperationsFor the Six Months Ended June 30, 2014 (Unaudited)
See accompanying notes to financial statements.
7
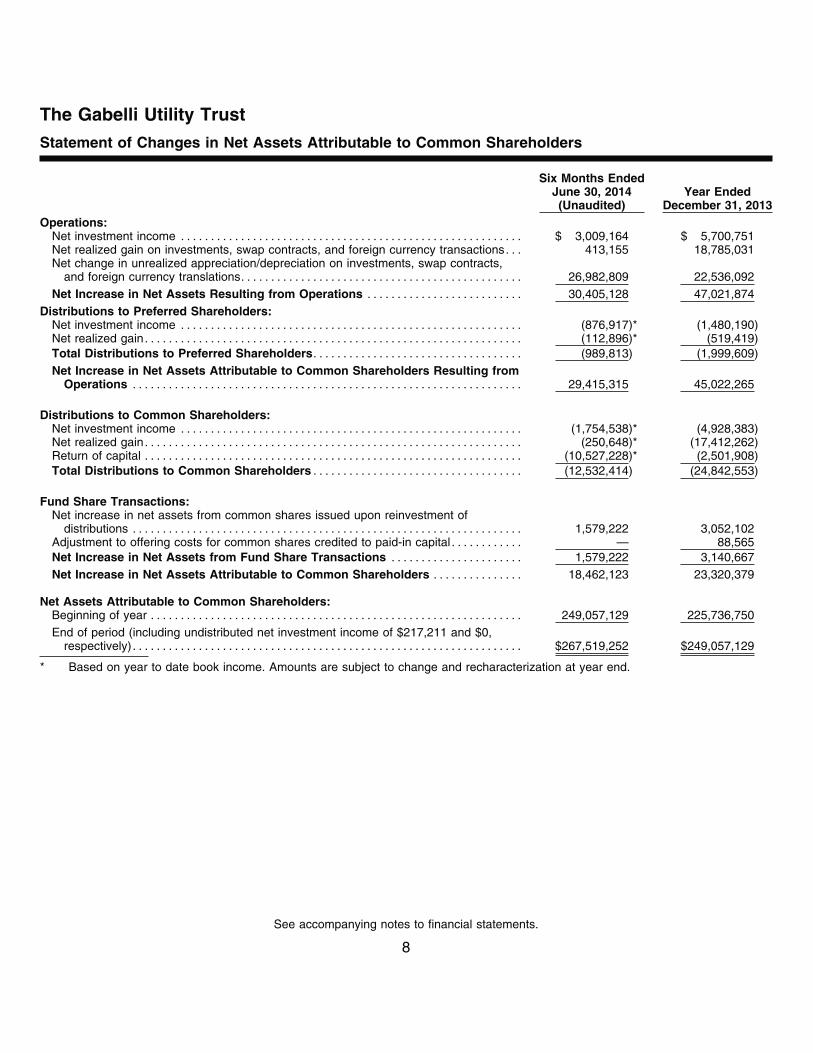
Six Months EndedJune 30, 2014(Unaudited)
Year EndedDecember 31, 2013
Operations:Net investment income . . . . . . . . . . . . . . . . . . . . . . . . . . . . . . . . . . . . . . . . . . . . . . . . . . . . . . . . . $ 3,009,164 $ 5,700,751Net realized gain on investments, swap contracts, and foreign currency transactions. . . 413,155 18,785,031Net change in unrealized appreciation/depreciation on investments, swap contracts,
and foreign currency translations. . . . . . . . . . . . . . . . . . . . . . . . . . . . . . . . . . . . . . . . . . . . . . . 26,982,809 22,536,092Net Increase in Net Assets Resulting from Operations . . . . . . . . . . . . . . . . . . . . . . . . . . 30,405,128 47,021,874
Distributions to Preferred Shareholders:Net investment income . . . . . . . . . . . . . . . . . . . . . . . . . . . . . . . . . . . . . . . . . . . . . . . . . . . . . . . . . (876,917)* (1,480,190)Net realized gain. . . . . . . . . . . . . . . . . . . . . . . . . . . . . . . . . . . . . . . . . . . . . . . . . . . . . . . . . . . . . . . (112,896)* (519,419)Total Distributions to Preferred Shareholders. . . . . . . . . . . . . . . . . . . . . . . . . . . . . . . . . . . (989,813) (1,999,609)Net Increase in Net Assets Attributable to Common Shareholders Resulting from
Operations . . . . . . . . . . . . . . . . . . . . . . . . . . . . . . . . . . . . . . . . . . . . . . . . . . . . . . . . . . . . . . . . . 29,415,315 45,022,265
Distributions to Common Shareholders:Net investment income . . . . . . . . . . . . . . . . . . . . . . . . . . . . . . . . . . . . . . . . . . . . . . . . . . . . . . . . . (1,754,538)* (4,928,383)Net realized gain. . . . . . . . . . . . . . . . . . . . . . . . . . . . . . . . . . . . . . . . . . . . . . . . . . . . . . . . . . . . . . . (250,648)* (17,412,262)Return of capital . . . . . . . . . . . . . . . . . . . . . . . . . . . . . . . . . . . . . . . . . . . . . . . . . . . . . . . . . . . . . . . (10,527,228)* (2,501,908)Total Distributions to Common Shareholders . . . . . . . . . . . . . . . . . . . . . . . . . . . . . . . . . . . (12,532,414) (24,842,553)
Fund Share Transactions:Net increase in net assets from common shares issued upon reinvestment of
distributions . . . . . . . . . . . . . . . . . . . . . . . . . . . . . . . . . . . . . . . . . . . . . . . . . . . . . . . . . . . . . . . . . 1,579,222 3,052,102Adjustment to offering costs for common shares credited to paid-in capital . . . . . . . . . . . . — 88,565Net Increase in Net Assets from Fund Share Transactions . . . . . . . . . . . . . . . . . . . . . . 1,579,222 3,140,667Net Increase in Net Assets Attributable to Common Shareholders . . . . . . . . . . . . . . . 18,462,123 23,320,379
Net Assets Attributable to Common Shareholders:Beginning of year . . . . . . . . . . . . . . . . . . . . . . . . . . . . . . . . . . . . . . . . . . . . . . . . . . . . . . . . . . . . . . 249,057,129 225,736,750End of period (including undistributed net investment income of $217,211 and $0,
respectively) . . . . . . . . . . . . . . . . . . . . . . . . . . . . . . . . . . . . . . . . . . . . . . . . . . . . . . . . . . . . . . . . . $267,519,252 $249,057,129
* Based on year to date book income. Amounts are subject to change and recharacterization at year end.
The Gabelli Utility Trust
Statement of Changes in Net Assets Attributable to Common Shareholders
See accompanying notes to financial statements.
8
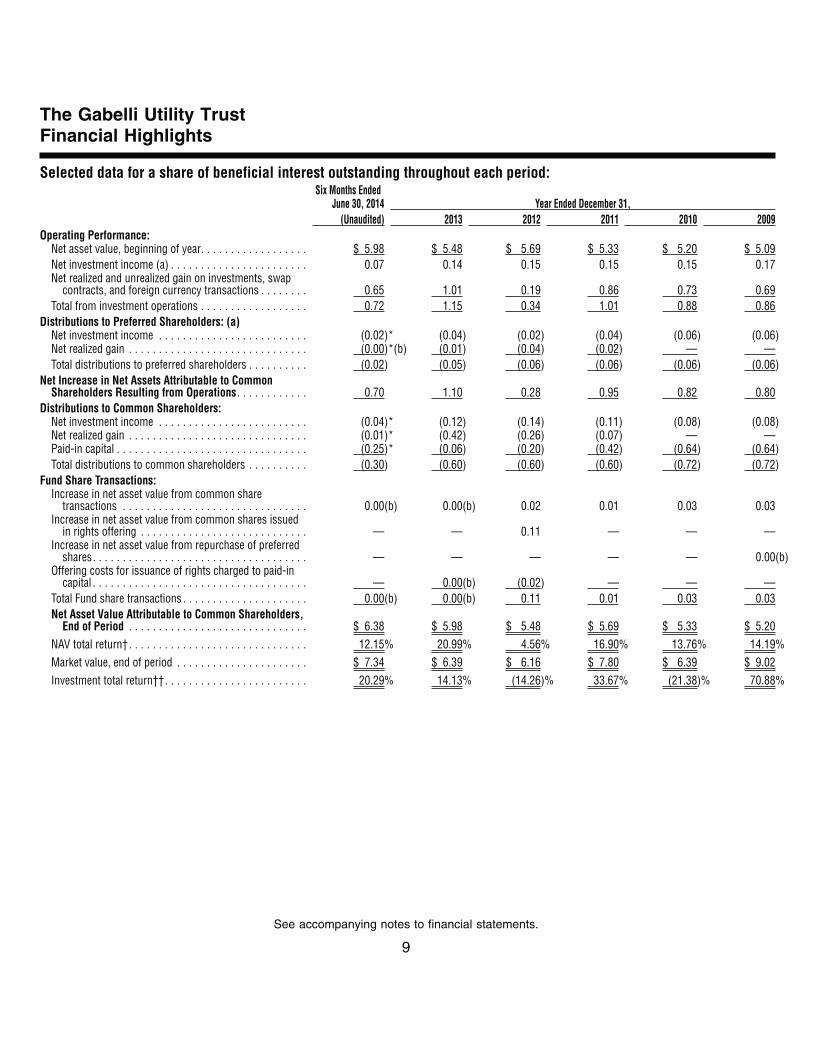
Six Months EndedJune 30, 2014 Year Ended December 31,
(Unaudited) 2013 2012 2011 2010 2009Operating Performance:
Net asset value, beginning of year. . . . . . . . . . . . . . . . . . $ 5.98 $ 5.48 $ 5.69 $ 5.33 $ 5.20 $ 5.09Net investment income (a) . . . . . . . . . . . . . . . . . . . . . . . 0.07 0.14 0.15 0.15 0.15 0.17Net realized and unrealized gain on investments, swap
contracts, and foreign currency transactions . . . . . . . . 0.65 1.01 0.19 0.86 0.73 0.69Total from investment operations . . . . . . . . . . . . . . . . . . 0.72 1.15 0.34 1.01 0.88 0.86
Distributions to Preferred Shareholders: (a)Net investment income . . . . . . . . . . . . . . . . . . . . . . . . . (0.02)* (0.04) (0.02) (0.04) (0.06) (0.06)Net realized gain . . . . . . . . . . . . . . . . . . . . . . . . . . . . . . (0.00)*(b) (0.01) (0.04) (0.02) — —Total distributions to preferred shareholders . . . . . . . . . . (0.02) (0.05) (0.06) (0.06) (0.06) (0.06)
Net Increase in Net Assets Attributable to CommonShareholders Resulting from Operations. . . . . . . . . . . . 0.70 1.10 0.28 0.95 0.82 0.80
Distributions to Common Shareholders:Net investment income . . . . . . . . . . . . . . . . . . . . . . . . . (0.04)* (0.12) (0.14) (0.11) (0.08) (0.08)Net realized gain . . . . . . . . . . . . . . . . . . . . . . . . . . . . . . (0.01)* (0.42) (0.26) (0.07) — —Paid-in capital . . . . . . . . . . . . . . . . . . . . . . . . . . . . . . . . (0.25)* (0.06) (0.20) (0.42) (0.64) (0.64)Total distributions to common shareholders . . . . . . . . . . (0.30) (0.60) (0.60) (0.60) (0.72) (0.72)
Fund Share Transactions:Increase in net asset value from common share
transactions . . . . . . . . . . . . . . . . . . . . . . . . . . . . . . . 0.00(b) 0.00(b) 0.02 0.01 0.03 0.03Increase in net asset value from common shares issued
in rights offering . . . . . . . . . . . . . . . . . . . . . . . . . . . . — — 0.11 — — —Increase in net asset value from repurchase of preferred
shares. . . . . . . . . . . . . . . . . . . . . . . . . . . . . . . . . . . . — — — — — 0.00(b)Offering costs for issuance of rights charged to paid-in
capital . . . . . . . . . . . . . . . . . . . . . . . . . . . . . . . . . . . . — 0.00(b) (0.02) — — —Total Fund share transactions . . . . . . . . . . . . . . . . . . . . . 0.00(b) 0.00(b) 0.11 0.01 0.03 0.03Net Asset Value Attributable to Common Shareholders,
End of Period . . . . . . . . . . . . . . . . . . . . . . . . . . . . . . $ 6.38 $ 5.98 $ 5.48 $ 5.69 $ 5.33 $ 5.20NAV total return†. . . . . . . . . . . . . . . . . . . . . . . . . . . . . . 12.15% 20.99% 4.56% 16.90% 13.76% 14.19%Market value, end of period . . . . . . . . . . . . . . . . . . . . . . $ 7.34 $ 6.39 $ 6.16 $ 7.80 $ 6.39 $ 9.02Investment total return††. . . . . . . . . . . . . . . . . . . . . . . . 20.29% 14.13% (14.26)% 33.67% (21.38)% 70.88%
The Gabelli Utility TrustFinancial Highlights
Selected data for a share of beneficial interest outstanding throughout each period:
See accompanying notes to financial statements.
9
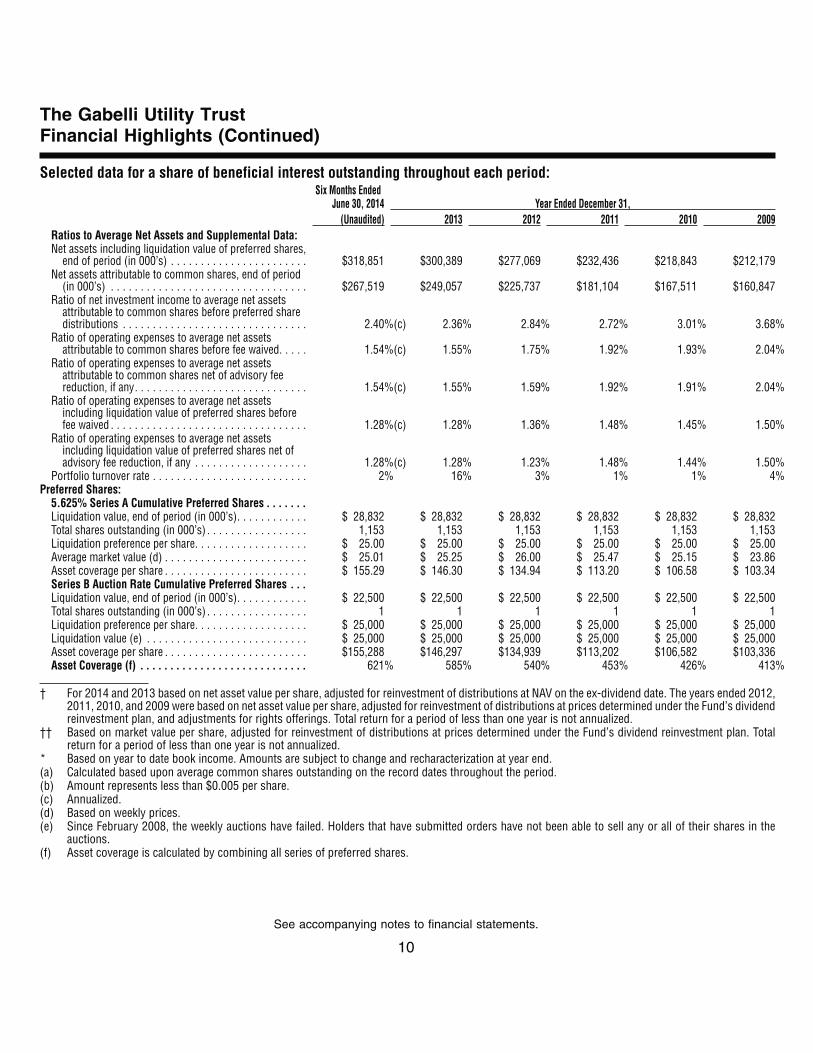
Six Months EndedJune 30, 2014 Year Ended December 31,
(Unaudited) 2013 2012 2011 2010 2009Ratios to Average Net Assets and Supplemental Data:Net assets including liquidation value of preferred shares,
end of period (in 000’s) . . . . . . . . . . . . . . . . . . . . . . . $318,851 $300,389 $277,069 $232,436 $218,843 $212,179Net assets attributable to common shares, end of period
(in 000’s) . . . . . . . . . . . . . . . . . . . . . . . . . . . . . . . . . $267,519 $249,057 $225,737 $181,104 $167,511 $160,847Ratio of net investment income to average net assets
attributable to common shares before preferred sharedistributions . . . . . . . . . . . . . . . . . . . . . . . . . . . . . . . 2.40%(c) 2.36% 2.84% 2.72% 3.01% 3.68%
Ratio of operating expenses to average net assetsattributable to common shares before fee waived. . . . . 1.54%(c) 1.55% 1.75% 1.92% 1.93% 2.04%
Ratio of operating expenses to average net assetsattributable to common shares net of advisory feereduction, if any. . . . . . . . . . . . . . . . . . . . . . . . . . . . . 1.54%(c) 1.55% 1.59% 1.92% 1.91% 2.04%
Ratio of operating expenses to average net assetsincluding liquidation value of preferred shares beforefee waived . . . . . . . . . . . . . . . . . . . . . . . . . . . . . . . . . 1.28%(c) 1.28% 1.36% 1.48% 1.45% 1.50%
Ratio of operating expenses to average net assetsincluding liquidation value of preferred shares net ofadvisory fee reduction, if any . . . . . . . . . . . . . . . . . . . 1.28%(c) 1.28% 1.23% 1.48% 1.44% 1.50%
Portfolio turnover rate . . . . . . . . . . . . . . . . . . . . . . . . . . 2% 16% 3% 1% 1% 4%Preferred Shares:
5.625% Series A Cumulative Preferred Shares . . . . . . .Liquidation value, end of period (in 000’s). . . . . . . . . . . . $ 28,832 $ 28,832 $ 28,832 $ 28,832 $ 28,832 $ 28,832Total shares outstanding (in 000’s) . . . . . . . . . . . . . . . . . 1,153 1,153 1,153 1,153 1,153 1,153Liquidation preference per share. . . . . . . . . . . . . . . . . . . $ 25.00 $ 25.00 $ 25.00 $ 25.00 $ 25.00 $ 25.00Average market value (d) . . . . . . . . . . . . . . . . . . . . . . . . $ 25.01 $ 25.25 $ 26.00 $ 25.47 $ 25.15 $ 23.86Asset coverage per share . . . . . . . . . . . . . . . . . . . . . . . . $ 155.29 $ 146.30 $ 134.94 $ 113.20 $ 106.58 $ 103.34Series B Auction Rate Cumulative Preferred Shares . . .Liquidation value, end of period (in 000’s). . . . . . . . . . . . $ 22,500 $ 22,500 $ 22,500 $ 22,500 $ 22,500 $ 22,500Total shares outstanding (in 000’s) . . . . . . . . . . . . . . . . . 1 1 1 1 1 1Liquidation preference per share. . . . . . . . . . . . . . . . . . . $ 25,000 $ 25,000 $ 25,000 $ 25,000 $ 25,000 $ 25,000Liquidation value (e) . . . . . . . . . . . . . . . . . . . . . . . . . . . $ 25,000 $ 25,000 $ 25,000 $ 25,000 $ 25,000 $ 25,000Asset coverage per share . . . . . . . . . . . . . . . . . . . . . . . . $155,288 $146,297 $134,939 $113,202 $106,582 $103,336Asset Coverage (f) . . . . . . . . . . . . . . . . . . . . . . . . . . . . 621% 585% 540% 453% 426% 413%
† For 2014 and 2013 based on net asset value per share, adjusted for reinvestment of distributions at NAV on the ex-dividend date. The years ended 2012,2011, 2010, and 2009 were based on net asset value per share, adjusted for reinvestment of distributions at prices determined under the Fund’s dividendreinvestment plan, and adjustments for rights offerings. Total return for a period of less than one year is not annualized.
†† Based on market value per share, adjusted for reinvestment of distributions at prices determined under the Fund’s dividend reinvestment plan. Totalreturn for a period of less than one year is not annualized.
* Based on year to date book income. Amounts are subject to change and recharacterization at year end.(a) Calculated based upon average common shares outstanding on the record dates throughout the period.(b) Amount represents less than $0.005 per share.(c) Annualized.(d) Based on weekly prices.(e) Since February 2008, the weekly auctions have failed. Holders that have submitted orders have not been able to sell any or all of their shares in the
auctions.(f) Asset coverage is calculated by combining all series of preferred shares.
The Gabelli Utility TrustFinancial Highlights (Continued)
Selected data for a share of beneficial interest outstanding throughout each period:
See accompanying notes to financial statements.
10
1. Organization. The Gabelli Utility Trust (the “Fund”) operates as a diversified closed-end management investmentcompany organized as a Delaware statutory trust on February 25, 1999 and registered under the InvestmentCompany Act of 1940, as amended (the “1940 Act”). Investment operations commenced on July 9, 1999.
The Fund’s primary objective is long term growth of capital and income. The Fund will invest 80% of its assets,under normal market conditions, in common stocks and other securities of foreign and domestic companiesinvolved in providing products, services, or equipment for (i) the generation or distribution of electricity, gas,and water and (ii) telecommunications services or infrastructure operations (the “80% Policy”). The 80% Policymay be changed without shareholder approval. However, the Fund has adopted a policy to provide shareholderswith notice at least sixty days prior to the implementation of any change in the 80% Policy.
2. Significant Accounting Policies. The Fund’s financial statements are prepared in accordance with U.S.Generally Accepted Accounting Principles (“GAAP”), which may require the use of management estimates andassumptions. Actual results could differ from those estimates. The following is a summary of significant accountingpolicies followed by the Fund in the preparation of its financial statements.
Security Valuation. Portfolio securities listed or traded on a nationally recognized securities exchange or tradedin the U.S. over-the-counter market for which market quotations are readily available are valued at the lastquoted sale price or a market’s official closing price as of the close of business on the day the securities arebeing valued. If there were no sales that day, the security is valued at the average of the closing bid and askedprices or, if there were no asked prices quoted on that day, then the security is valued at the closing bid priceon that day. If no bid or asked prices are quoted on such day, the security is valued at the most recentlyavailable price or, if the Board of Trustees (the “Board”) so determines, by such other method as the Boardshall determine in good faith to reflect its fair market value. Portfolio securities traded on more than one nationalsecurities exchange or market are valued according to the broadest and most representative market, as determinedby Gabelli Funds, LLC (the “Adviser”).
Portfolio securities primarily traded on a foreign market are generally valued at the preceding closing valuesof such securities on the relevant market, but may be fair valued pursuant to procedures established by theBoard if market conditions change significantly after the close of the foreign market, but prior to the close ofbusiness on the day the securities are being valued. Debt instruments with remaining maturities of sixty daysor less that are not credit impaired are valued at amortized cost, unless the Board determines such amountdoes not reflect the securities’ fair value, in which case these securities will be fair valued as determined bythe Board. Debt instruments having a maturity greater than sixty days for which market quotations are readilyavailable are valued at the average of the latest bid and asked prices. If there were no asked prices quotedon such day, the security is valued using the closing bid price. U.S. government obligations with maturitiesgreater than sixty days are normally valued using a model that incorporates market observable data such asreported sales of similar securities, broker quotes, yields, bids, offers, and reference data. Certain securitiesare valued principally using dealer quotations.
Securities and assets for which market quotations are not readily available are fair valued as determined bythe Board. Fair valuation methodologies and procedures may include, but are not limited to: analysis and reviewof available financial and non-financial information about the company; comparisons with the valuation andchanges in valuation of similar securities, including a comparison of foreign securities with the equivalent U.S.
The Gabelli Utility TrustNotes to Financial Statements (Unaudited)
11
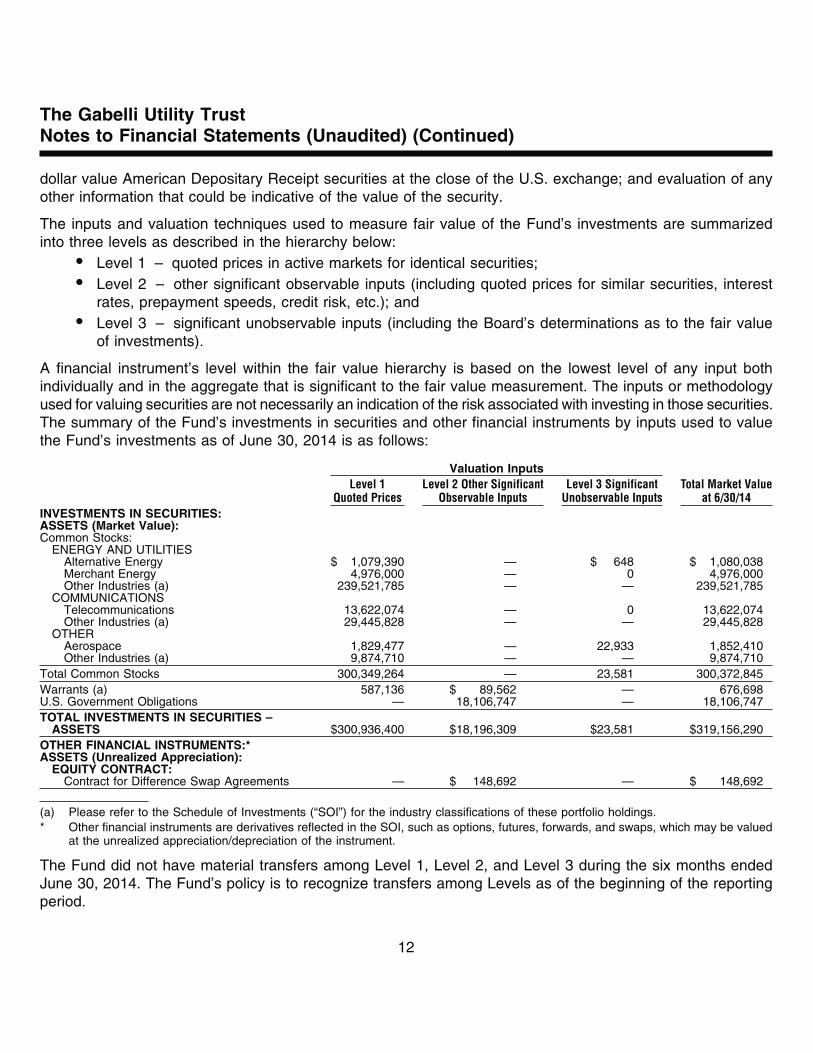
dollar value American Depositary Receipt securities at the close of the U.S. exchange; and evaluation of anyother information that could be indicative of the value of the security.
The inputs and valuation techniques used to measure fair value of the Fund’s investments are summarizedinto three levels as described in the hierarchy below:
• Level 1 – quoted prices in active markets for identical securities;• Level 2 – other significant observable inputs (including quoted prices for similar securities, interest
rates, prepayment speeds, credit risk, etc.); and• Level 3 – significant unobservable inputs (including the Board’s determinations as to the fair value
of investments).
A financial instrument’s level within the fair value hierarchy is based on the lowest level of any input bothindividually and in the aggregate that is significant to the fair value measurement. The inputs or methodologyused for valuing securities are not necessarily an indication of the risk associated with investing in those securities.The summary of the Fund’s investments in securities and other financial instruments by inputs used to valuethe Fund’s investments as of June 30, 2014 is as follows:
Valuation InputsLevel 1
Quoted PricesLevel 2 Other Significant
Observable InputsLevel 3 Significant
Unobservable InputsTotal Market Value
at 6/30/14INVESTMENTS IN SECURITIES:ASSETS (Market Value):Common Stocks:
ENERGY AND UTILITIESAlternative Energy $ 1,079,390 — $ 648 $ 1,080,038Merchant Energy 4,976,000 — 0 4,976,000Other Industries (a) 239,521,785 — — 239,521,785
COMMUNICATIONSTelecommunications 13,622,074 — 0 13,622,074Other Industries (a) 29,445,828 — — 29,445,828
OTHERAerospace 1,829,477 — 22,933 1,852,410Other Industries (a) 9,874,710 — — 9,874,710
Total Common Stocks 300,349,264 — 23,581 300,372,845Warrants (a) 587,136 $ 89,562 — 676,698U.S. Government Obligations — 18,106,747 — 18,106,747TOTAL INVESTMENTS IN SECURITIES –
ASSETS $300,936,400 $18,196,309 $23,581 $319,156,290OTHER FINANCIAL INSTRUMENTS:*ASSETS (Unrealized Appreciation):
EQUITY CONTRACT:Contract for Difference Swap Agreements — $ 148,692 — $ 148,692
(a) Please refer to the Schedule of Investments (“SOI”) for the industry classifications of these portfolio holdings.* Other financial instruments are derivatives reflected in the SOI, such as options, futures, forwards, and swaps, which may be valued
at the unrealized appreciation/depreciation of the instrument.
The Fund did not have material transfers among Level 1, Level 2, and Level 3 during the six months endedJune 30, 2014. The Fund’s policy is to recognize transfers among Levels as of the beginning of the reportingperiod.
The Gabelli Utility TrustNotes to Financial Statements (Unaudited) (Continued)
12
Additional Information to Evaluate Qualitative Information.
General. The Fund uses recognized industry pricing services – approved by the Board and unaffiliated withthe Adviser – to value most of its securities, and uses broker quotes provided by market makers of securitiesnot valued by these and other recognized pricing sources. Several different pricing feeds are received to valuedomestic equity securities, international equity securities, preferred equity securities, and fixed income securities.The data within these feeds is ultimately sourced from major stock exchanges and trading systems where thesesecurities trade. The prices supplied by external sources are checked by obtaining quotations or actual transactionprices from market participants. If a price obtained from the pricing source is deemed unreliable, prices will besought from another pricing service or from a broker/dealer that trades that security or similar securities.
Fair Valuation. Fair valued securities may be common and preferred equities, warrants, options, rights,and fixed income obligations. Where appropriate, Level 3 securities are those for which market quotations arenot available, such as securities not traded for several days, or for which current bids are not available, orwhich are restricted as to transfer. Among the factors to be considered to fair value a security are recent pricesof comparable securities that are publicly traded, reliable prices of securities not publicly traded, the use ofvaluation models, current analyst reports, valuing the income or cash flow of the issuer, or cost if the precedingfactors do not apply. A significant change in the unobservable inputs could result in a lower or higher value inLevel 3 securities. The circumstances of Level 3 securities are frequently monitored to determine if fair valuationmeasures continue to apply.
The Adviser reports quarterly to the Board the results of the application of fair valuation policies and procedures.These include back testing the prices realized in subsequent trades of these fair valued securities to fair valuespreviously recognized.
Derivative Financial Instruments. The Fund may engage in various portfolio investment strategies by investingin a number of derivative financial instruments for the purposes of hedging or protecting its exposure to interestrate movements and movements in the securities markets, hedging against changes in the value of its portfoliosecurities and in the value of securities it intends to purchase, or hedging against a specific transaction withrespect to either the currency in which the transaction is denominated or another currency. Investing in certainderivative financial instruments, including participation in the options, futures, or swap markets, entails certainexecution, liquidity, hedging, tax, and securities, interest, credit, or currency market risks. Losses may arise ifthe Adviser’s prediction of movements in the direction of the securities, foreign currency, and interest ratemarkets is inaccurate. Losses may also arise if the counterparty does not perform its duties under a contract,or that, in the event of default, the Fund may be delayed in or prevented from obtaining payments or othercontractual remedies owed to it under derivative contracts. The creditworthiness of the counterparties is closelymonitored in order to minimize these risks. Participation in derivative transactions involves investment risks,transaction costs, and potential losses to which the Fund would not be subject absent the use of these strategies.The consequences of these risks, transaction costs, and losses may have a negative impact on the Fund’sability to pay distributions.
Collateral requirements differ by type of derivative. Collateral requirements are set by the broker or exchangeclearing house for exchange traded derivatives, while collateral terms are contract specific for derivatives tradedover-the-counter. Securities pledged to cover obligations of the Fund under derivative contracts are noted in
The Gabelli Utility TrustNotes to Financial Statements (Unaudited) (Continued)
13
the Schedule of Investments. Cash collateral, if any, pledged for the same purpose will be reported separatelyin the Statement of Assets and Liabilities.
The Fund’s policy with respect to offsetting is that, absent an event of default by the counterparty or a terminationof the agreement, the master agreement does not result in an offset of reported amounts of financial assetsand financial liabilities in the Statement of Assets and Liabilities across transactions between the Fund andthe applicable counterparty. The enforceability of the right to offset may vary by jurisdiction.
The Fund’s derivative contracts held at June 30, 2014, are not accounted for as hedging instruments underGAAP and are disclosed in the Schedule of Investments together with the related counterparty.
Swap Agreements. The Fund may enter into equity contract for difference swap transactions for the purposeof increasing the income of the Fund. The use of swaps is a highly specialized activity that involves investmenttechniques and risks different from those associated with ordinary portfolio security transactions. In an equitycontract for difference swap, a set of future cash flows is exchanged between two counterparties. One of thesecash flow streams will typically be based on a reference interest rate combined with the performance of anotional value of shares of a stock. The other will be based on the performance of the shares of a stock.Depending on the general state of short term interest rates and the returns on the Fund’s portfolio securitiesat the time an equity contract for difference swap transaction reaches its scheduled termination date, there isa risk that the Fund will not be able to obtain a replacement transaction or that the terms of the replacementwill not be as favorable as on the expiring transaction.
Unrealized gains related to swaps are reported as an asset and unrealized losses are reported as a liabilityin the Statement of Assets and Liabilities. The change in the value of swaps, including the accrual of periodicamounts of interest to be received or paid on swaps, is reported as unrealized gain or loss in the Statementof Operations. A realized gain or loss is recorded upon receipt or payment of a periodic payment or terminationof swap agreements.
The Fund has entered into equity contract for difference swap agreements with The Goldman Sachs Group,Inc. Details of the swaps at June 30, 2014 are reflected within the Schedule of Investments and further detailsare as follows:
NotionalAmount
Equity SecurityReceived
Interest Rate/Equity Security Paid
TerminationDate
Net UnrealizedAppreciation
Market ValueAppreciation on:
One month LIBOR plus 90 bps plusMarket Value Depreciation on:
$1,677,697 (100,000 Shares) Rolls-Royce Holdings plc Rolls-Royce Holdings plc 06/29/15 $148,692
The Fund’s volume of activity in equity contract for difference swap agreements during the six months endedJune 30, 2014 had an average monthly notional amount of approximately $1,835,521.
The Gabelli Utility TrustNotes to Financial Statements (Unaudited) (Continued)
14
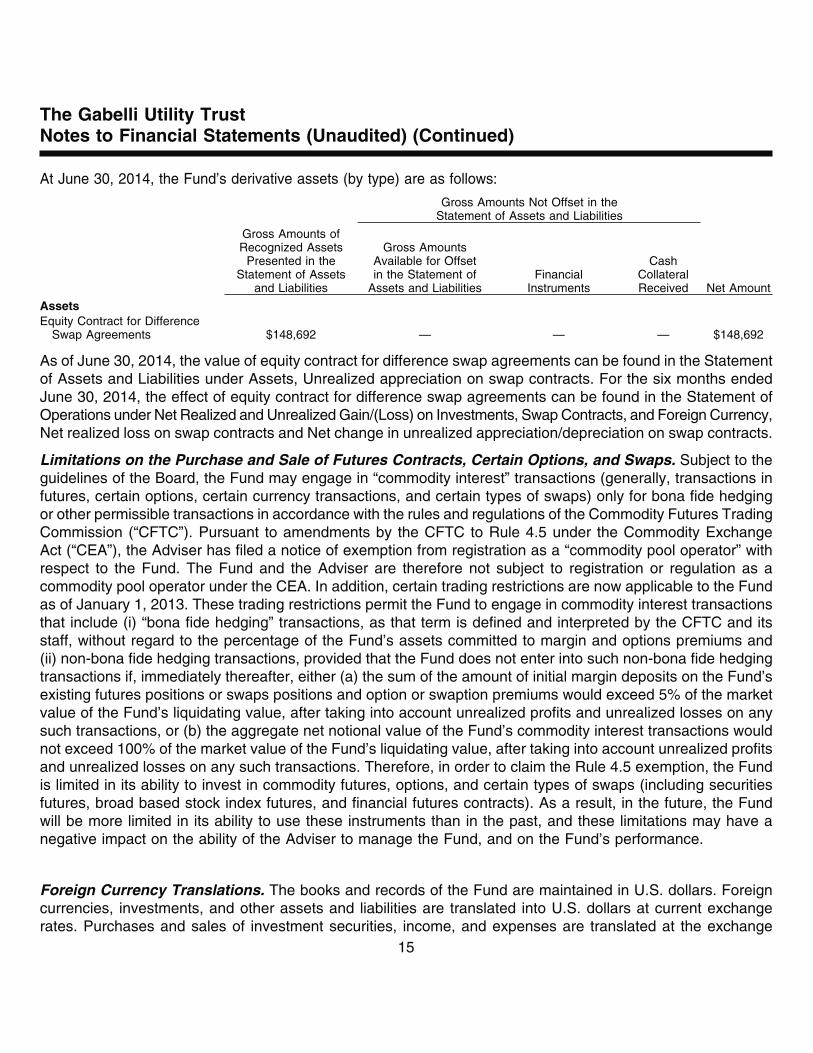
At June 30, 2014, the Fund’s derivative assets (by type) are as follows:
Gross Amounts Not Offset in theStatement of Assets and Liabilities
Gross Amounts ofRecognized Assets
Presented in theStatement of Assets
and Liabilities
Gross AmountsAvailable for Offsetin the Statement of
Assets and LiabilitiesFinancial
Instruments
CashCollateralReceived Net Amount
AssetsEquity Contract for Difference
Swap Agreements $148,692 — — — $148,692
As of June 30, 2014, the value of equity contract for difference swap agreements can be found in the Statementof Assets and Liabilities under Assets, Unrealized appreciation on swap contracts. For the six months endedJune 30, 2014, the effect of equity contract for difference swap agreements can be found in the Statement ofOperations under Net Realized and Unrealized Gain/(Loss) on Investments, Swap Contracts, and Foreign Currency,Net realized loss on swap contracts and Net change in unrealized appreciation/depreciation on swap contracts.
Limitations on the Purchase and Sale of Futures Contracts, Certain Options, and Swaps. Subject to theguidelines of the Board, the Fund may engage in “commodity interest” transactions (generally, transactions infutures, certain options, certain currency transactions, and certain types of swaps) only for bona fide hedgingor other permissible transactions in accordance with the rules and regulations of the Commodity Futures TradingCommission (“CFTC”). Pursuant to amendments by the CFTC to Rule 4.5 under the Commodity ExchangeAct (“CEA”), the Adviser has filed a notice of exemption from registration as a “commodity pool operator” withrespect to the Fund. The Fund and the Adviser are therefore not subject to registration or regulation as acommodity pool operator under the CEA. In addition, certain trading restrictions are now applicable to the Fundas of January 1, 2013. These trading restrictions permit the Fund to engage in commodity interest transactionsthat include (i) “bona fide hedging” transactions, as that term is defined and interpreted by the CFTC and itsstaff, without regard to the percentage of the Fund’s assets committed to margin and options premiums and(ii) non-bona fide hedging transactions, provided that the Fund does not enter into such non-bona fide hedgingtransactions if, immediately thereafter, either (a) the sum of the amount of initial margin deposits on the Fund’sexisting futures positions or swaps positions and option or swaption premiums would exceed 5% of the marketvalue of the Fund’s liquidating value, after taking into account unrealized profits and unrealized losses on anysuch transactions, or (b) the aggregate net notional value of the Fund’s commodity interest transactions wouldnot exceed 100% of the market value of the Fund’s liquidating value, after taking into account unrealized profitsand unrealized losses on any such transactions. Therefore, in order to claim the Rule 4.5 exemption, the Fundis limited in its ability to invest in commodity futures, options, and certain types of swaps (including securitiesfutures, broad based stock index futures, and financial futures contracts). As a result, in the future, the Fundwill be more limited in its ability to use these instruments than in the past, and these limitations may have anegative impact on the ability of the Adviser to manage the Fund, and on the Fund’s performance.
Foreign Currency Translations. The books and records of the Fund are maintained in U.S. dollars. Foreigncurrencies, investments, and other assets and liabilities are translated into U.S. dollars at current exchangerates. Purchases and sales of investment securities, income, and expenses are translated at the exchange
The Gabelli Utility TrustNotes to Financial Statements (Unaudited) (Continued)
15
rate prevailing on the respective dates of such transactions. Unrealized gains and losses that result from changesin foreign exchange rates and/or changes in market prices of securities have been included in unrealizedappreciation/depreciation on investments and foreign currency translations. Net realized foreign currency gainsand losses resulting from changes in exchange rates include foreign currency gains and losses between tradedate and settlement date on investment securities transactions, foreign currency transactions, and the differencebetween the amounts of interest and dividends recorded on the books of the Fund and the amounts actuallyreceived. The portion of foreign currency gains and losses related to fluctuation in exchange rates betweenthe initial purchase trade date and subsequent sale trade date is included in realized gain/(loss) on investments.
Foreign Securities. The Fund may directly purchase securities of foreign issuers. Investing in securities offoreign issuers involves special risks not typically associated with investing in securities of U.S. issuers. Therisks include possible revaluation of currencies, the inability to repatriate funds, less complete financial informationabout companies, and possible future adverse political and economic developments. Moreover, securities ofmany foreign issuers and their markets may be less liquid and their prices more volatile than securities ofcomparable U.S. issuers.
Foreign Taxes. The Fund may be subject to foreign taxes on income, gains on investments, or currency repatriation,a portion of which may be recoverable. The Fund will accrue such taxes and recoveries as applicable, basedupon its current interpretation of tax rules and regulations that exist in the markets in which it invests.
Securities Transactions and Investment Income. Securities transactions are accounted for on the trade datewith realized gain/(loss) on investments determined by using the identified cost method. Interest income (includingamortization of premium and accretion of discount) is recorded on the accrual basis. Premiums and discountson debt securities are amortized using the effective yield to maturity method. Dividend income is recorded onthe ex-dividend date, except for certain dividends from foreign securities that are recorded as soon after theex-dividend date as the Fund becomes aware of such dividends.
Custodian Fee Credits and Interest Expense. When cash balances are maintained in the custody account,the Fund receives credits which are used to offset custodian fees. The gross expenses paid under the custodyarrangement are included in custodian fees in the Statement of Operations with the corresponding expenseoffset, if any, shown as “Custodian fee credits.” When cash balances are overdrawn, the Fund is charged anoverdraft fee equal to 110% of the 90 day Treasury Bill rate on outstanding balances. This amount, if any,would be included in the Statement of Operations.
Distributions to Shareholders. Distributions to common shareholders are recorded on the ex-dividend date.Distributions to shareholders are based on income and capital gains as determined in accordance with federalincome tax regulations, which may differ from income and capital gains as determined under GAAP. Thesedifferences are primarily due to differing treatments of income and gains on various investment securities andforeign currency transactions held by the Fund, timing differences, and differing characterizations of distributionsmade by the Fund. Distributions from net investment income for federal income tax purposes include net realizedgains on foreign currency transactions. These book/tax differences are either temporary or permanent in nature.To the extent these differences are permanent, adjustments are made to the appropriate capital accounts inthe period when the differences arise. These reclassifications have no impact on the NAV of the Fund.
The Gabelli Utility TrustNotes to Financial Statements (Unaudited) (Continued)
16
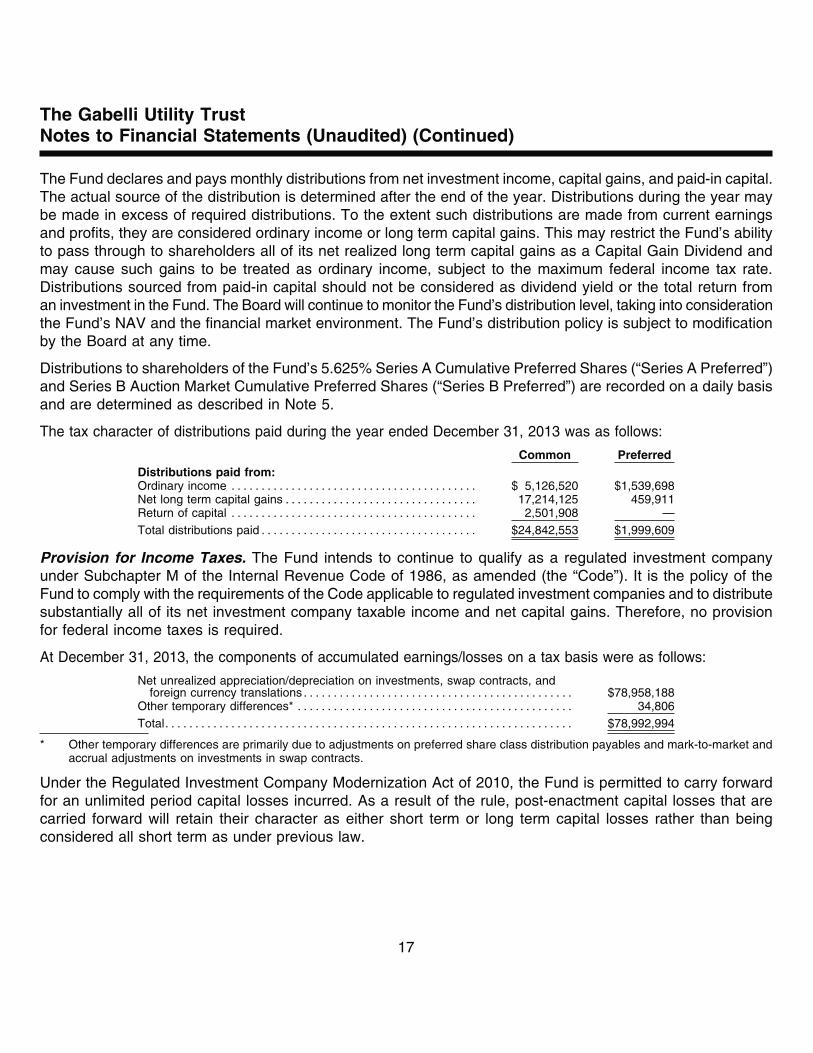
The Fund declares and pays monthly distributions from net investment income, capital gains, and paid-in capital.The actual source of the distribution is determined after the end of the year. Distributions during the year maybe made in excess of required distributions. To the extent such distributions are made from current earningsand profits, they are considered ordinary income or long term capital gains. This may restrict the Fund’s abilityto pass through to shareholders all of its net realized long term capital gains as a Capital Gain Dividend andmay cause such gains to be treated as ordinary income, subject to the maximum federal income tax rate.Distributions sourced from paid-in capital should not be considered as dividend yield or the total return froman investment in the Fund. The Board will continue to monitor the Fund’s distribution level, taking into considerationthe Fund’s NAV and the financial market environment. The Fund’s distribution policy is subject to modificationby the Board at any time.
Distributions to shareholders of the Fund’s 5.625% Series A Cumulative Preferred Shares (“Series A Preferred”)and Series B Auction Market Cumulative Preferred Shares (“Series B Preferred”) are recorded on a daily basisand are determined as described in Note 5.
The tax character of distributions paid during the year ended December 31, 2013 was as follows:
Common PreferredDistributions paid from:Ordinary income . . . . . . . . . . . . . . . . . . . . . . . . . . . . . . . . . . . . . . . . . $ 5,126,520 $1,539,698Net long term capital gains . . . . . . . . . . . . . . . . . . . . . . . . . . . . . . . . 17,214,125 459,911Return of capital . . . . . . . . . . . . . . . . . . . . . . . . . . . . . . . . . . . . . . . . . 2,501,908 —Total distributions paid . . . . . . . . . . . . . . . . . . . . . . . . . . . . . . . . . . . . $24,842,553 $1,999,609
Provision for Income Taxes. The Fund intends to continue to qualify as a regulated investment companyunder Subchapter M of the Internal Revenue Code of 1986, as amended (the “Code”). It is the policy of theFund to comply with the requirements of the Code applicable to regulated investment companies and to distributesubstantially all of its net investment company taxable income and net capital gains. Therefore, no provisionfor federal income taxes is required.
At December 31, 2013, the components of accumulated earnings/losses on a tax basis were as follows:
Net unrealized appreciation/depreciation on investments, swap contracts, andforeign currency translations . . . . . . . . . . . . . . . . . . . . . . . . . . . . . . . . . . . . . . . . . . . . . $78,958,188
Other temporary differences* . . . . . . . . . . . . . . . . . . . . . . . . . . . . . . . . . . . . . . . . . . . . . . 34,806Total. . . . . . . . . . . . . . . . . . . . . . . . . . . . . . . . . . . . . . . . . . . . . . . . . . . . . . . . . . . . . . . . . . . . $78,992,994
* Other temporary differences are primarily due to adjustments on preferred share class distribution payables and mark-to-market andaccrual adjustments on investments in swap contracts.
Under the Regulated Investment Company Modernization Act of 2010, the Fund is permitted to carry forwardfor an unlimited period capital losses incurred. As a result of the rule, post-enactment capital losses that arecarried forward will retain their character as either short term or long term capital losses rather than beingconsidered all short term as under previous law.
The Gabelli Utility TrustNotes to Financial Statements (Unaudited) (Continued)
17
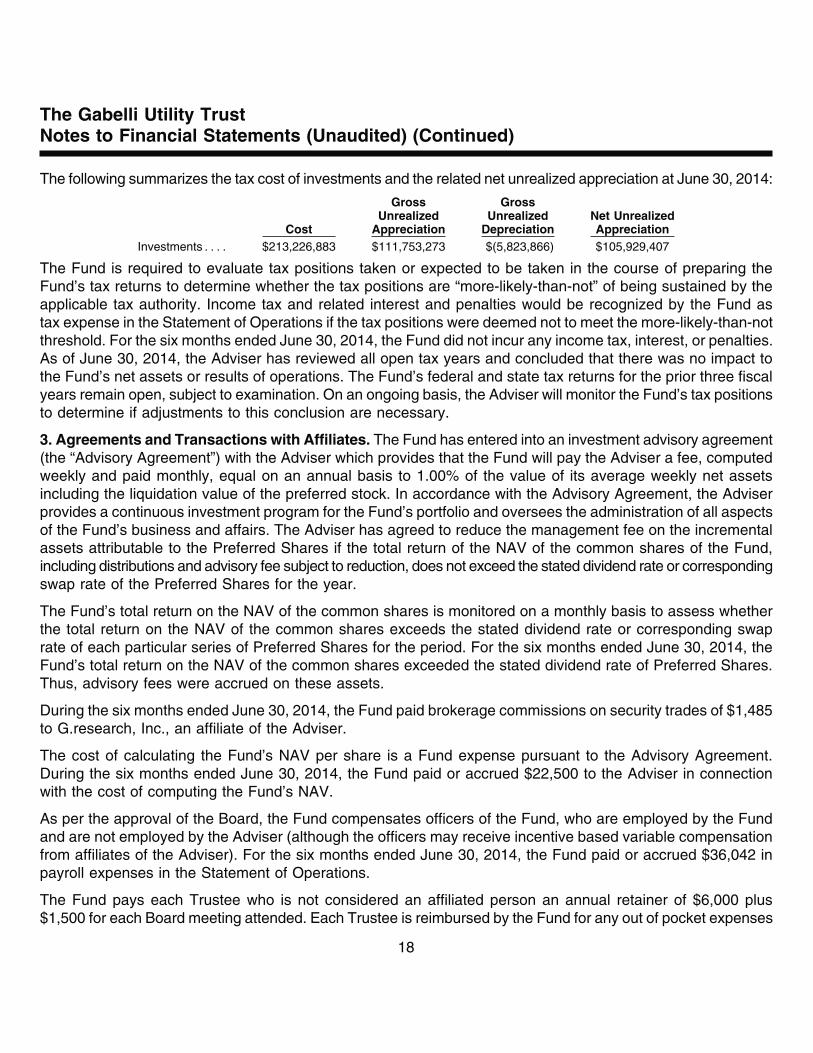
The following summarizes the tax cost of investments and the related net unrealized appreciation at June 30, 2014:
Cost
GrossUnrealized
Appreciation
GrossUnrealized
DepreciationNet UnrealizedAppreciation
Investments . . . . $213,226,883 $111,753,273 $(5,823,866) $105,929,407
The Fund is required to evaluate tax positions taken or expected to be taken in the course of preparing theFund’s tax returns to determine whether the tax positions are “more-likely-than-not” of being sustained by theapplicable tax authority. Income tax and related interest and penalties would be recognized by the Fund astax expense in the Statement of Operations if the tax positions were deemed not to meet the more-likely-than-notthreshold. For the six months ended June 30, 2014, the Fund did not incur any income tax, interest, or penalties.As of June 30, 2014, the Adviser has reviewed all open tax years and concluded that there was no impact tothe Fund’s net assets or results of operations. The Fund’s federal and state tax returns for the prior three fiscalyears remain open, subject to examination. On an ongoing basis, the Adviser will monitor the Fund’s tax positionsto determine if adjustments to this conclusion are necessary.
3. Agreements and Transactions with Affiliates. The Fund has entered into an investment advisory agreement(the “Advisory Agreement”) with the Adviser which provides that the Fund will pay the Adviser a fee, computedweekly and paid monthly, equal on an annual basis to 1.00% of the value of its average weekly net assetsincluding the liquidation value of the preferred stock. In accordance with the Advisory Agreement, the Adviserprovides a continuous investment program for the Fund’s portfolio and oversees the administration of all aspectsof the Fund’s business and affairs. The Adviser has agreed to reduce the management fee on the incrementalassets attributable to the Preferred Shares if the total return of the NAV of the common shares of the Fund,including distributions and advisory fee subject to reduction, does not exceed the stated dividend rate or correspondingswap rate of the Preferred Shares for the year.
The Fund’s total return on the NAV of the common shares is monitored on a monthly basis to assess whetherthe total return on the NAV of the common shares exceeds the stated dividend rate or corresponding swaprate of each particular series of Preferred Shares for the period. For the six months ended June 30, 2014, theFund’s total return on the NAV of the common shares exceeded the stated dividend rate of Preferred Shares.Thus, advisory fees were accrued on these assets.
During the six months ended June 30, 2014, the Fund paid brokerage commissions on security trades of $1,485to G.research, Inc., an affiliate of the Adviser.
The cost of calculating the Fund’s NAV per share is a Fund expense pursuant to the Advisory Agreement.During the six months ended June 30, 2014, the Fund paid or accrued $22,500 to the Adviser in connectionwith the cost of computing the Fund’s NAV.
As per the approval of the Board, the Fund compensates officers of the Fund, who are employed by the Fundand are not employed by the Adviser (although the officers may receive incentive based variable compensationfrom affiliates of the Adviser). For the six months ended June 30, 2014, the Fund paid or accrued $36,042 inpayroll expenses in the Statement of Operations.
The Fund pays each Trustee who is not considered an affiliated person an annual retainer of $6,000 plus$1,500 for each Board meeting attended. Each Trustee is reimbursed by the Fund for any out of pocket expenses
The Gabelli Utility TrustNotes to Financial Statements (Unaudited) (Continued)
18
incurred in attending meetings. All Board committee members receive $1,000 per meeting attended, the AuditCommittee Chairman receives an annual fee of $3,000, the Nominating Committee Chairman and the LeadTrustee each receive an annual fee of $2,000. A Trustee may receive a single meeting fee, allocated amongthe participating funds, for participation in certain meetings held on behalf of multiple funds. Trustees who aredirectors or employees of the Adviser or an affiliated company receive no compensation or expense reimbursementfrom the Fund.
4. Portfolio Securities. Purchases and sales of securities during the six months ended June 30, 2014, otherthan short term securities and U.S. Government obligations, aggregated $11,601,712 and $5,530,652,respectively.
5. Capital. The Fund is authorized to issue an unlimited number of shares of beneficial interest (par value$0.001). The Board has authorized the repurchase of its common shares on the open market when the sharesare trading at a discount of 10% or more (or such other percentage as the Board may determine from time totime) from the NAV of the shares. During the six months ended June 30, 2014 and the year ended December 31, 2013,the Fund did not repurchase any common shares of beneficial interest in the open market.
Transactions in shares of beneficial interest were as follows:Six Months Ended
June 30, 2014(Unaudited)
Year EndedDecember 31, 2013
Shares Amount Shares AmountNet increase from common shares issued upon reinvestment ofdistributions. . . . . . . . . . . . . . . . . . . . . . . . . . . . . . . . . . . . . . . . . . . . . . . . . . . . . . . . 243,385 $1,579,222 487,519 $3,052,102Net increase . . . . . . . . . . . . . . . . . . . . . . . . . . . . . . . . . . . . . . . . . . . . . . . . . . . . . . . 243,385 $1,579,222 487,519 $3,052,102
A shelf registration authorizing the offering of an additional $100 million of common or preferred shares wasdeclared effective by the SEC on October 18, 2012.
The Fund’s Declaration of Trust, as amended, authorizes the issuance of an unlimited number of shares of$0.001 par value Preferred Shares. The Preferred Shares are senior to the common shares and result in thefinancial leveraging of the common shares. Such leveraging tends to magnify both the risks and opportunitiesto common shareholders. Dividends on shares of the Preferred Shares are cumulative. The Fund is requiredby the 1940 Act and by the Statement of Additional Information to meet certain asset coverage tests withrespect to the Preferred Shares. If the Fund fails to meet these requirements and does not correct such failure,the Fund may be required to redeem, in part or in full, the Series A and Series B Preferred at a redemptionprice of $25 and $25,000, respectively, per share plus an amount equal to the accumulated and unpaid dividendswhether or not declared on such shares in order to meet these requirements. Additionally, failure to meet theforegoing asset coverage requirements could restrict the Fund’s ability to pay dividends to common shareholdersand could lead to sales of portfolio securities at inopportune times. The income received on the Fund’s assetsmay vary in a manner unrelated to the fixed and variable rates, which could have either a beneficial or detrimentalimpact on net investment income and gains available to common shareholders.
The Fund may redeem at anytime, in whole or in part, the Series A and Series B Preferred at the redemptionprice. During the six months ended June 30, 2014 and the year ended December 31, 2013, the Fund did notrepurchase any shares of Series A and Series B Preferred.
The Gabelli Utility TrustNotes to Financial Statements (Unaudited) (Continued)
19
The Series B Preferred dividend rates, as set by the auction process that is generally held every seven days,are expected to vary with short term interest rates. Since February 2008, the number of Series B Preferredsubject to bid orders by potential holders has been less than the number of Series B Preferred subject to sellorders. Therefore, the weekly auctions have failed, and the dividend rate since then has been the maximumrate. Holders that have submitted sell orders have not been able to sell any or all of the Series B Preferredfor which they have submitted sell orders. The current maximum rate is 150% of the seven day Telerate/BritishBankers Association LIBOR rate on the day of such auction. Existing shareholders may submit an order tohold, bid, or sell such shares on each auction date. Shareholders of the Series B Preferred may also tradetheir shares in the secondary market.
The following table summarizes Cumulative Preferred Stock information:
Series Issue DateIssued/
Authorized
Number of SharesOutstanding at
06/30/2014 Net Proceeds2014 Dividend
Rate Range
DividendRate at
06/30/2014
AccruedDividend at06/30/2014
A 5.625% . . . . . . . . . . . . . . . . . . . . July 31, 2003 1,200,000 1,153,288 $28,895,026 Fixed Rate 5.625% $22,525B Auction Market . . . . . . . . . . . . . . . . July 31, 2003 1,000 900 24,590,026 1.618% to 1.626% 1.624% 6,090
The holders of Preferred Shares generally are entitled to one vote per share held on each matter submittedto a vote of shareholders of the Fund and will vote together with holders of common stock as a single class.The holders of Preferred Shares voting together as a single class also have the right currently to elect twoTrustees and under certain circumstances are entitled to elect a majority of the Board of Trustees. In addition,the affirmative vote of a majority of the votes entitled to be cast by holders of all outstanding shares of thepreferred shares, voting as a single class, will be required to approve any plan of reorganization adverselyaffecting the preferred shares, and the approval of two-thirds of each class, voting separately, of the Fund’soutstanding voting stock must approve the conversion of the Fund from a closed-end to an open-end investmentcompany. The approval of a majority (as defined in the 1940 Act) of the outstanding preferred shares and amajority (as defined in the 1940 Act) of the Fund’s outstanding voting securities are required to approve certainother actions, including changes in the Fund’s investment objectives or fundamental investment policies.
6. Industry Concentration. Because the Fund primarily invests in common stocks and other securities offoreign and domestic companies in the utility industry, its portfolio may be subject to greater risk and marketfluctuations than a portfolio of securities representing a broad range of investments.
7. Indemnifications. The Fund enters into contracts that contain a variety of indemnifications. The Fund’smaximum exposure under these arrangements is unknown. However, the Fund has not had prior claims orlosses pursuant to these contracts. Management has reviewed the Fund’s existing contracts and expects therisk of loss to be remote.
8. Other Matters. On April 24, 2008, the Adviser entered into a settlement with the SEC to resolve an inquiryregarding prior frequent trading in shares of the GAMCO Global Growth Fund (the “Global Growth Fund”) byone investor who was banned from the Global Growth Fund in August 2002. Under the terms of the settlement,the Adviser, without admitting or denying the SEC’s findings and allegations, paid $16 million (which includeda $5 million civil monetary penalty). On the same day, the SEC filed a civil action in the U.S. District Court forthe Southern District of New York (the “Court”) against the Executive Vice President and Chief Operating Officer(the “Officer”) of the Adviser, alleging violations of certain federal securities laws arising from the same matter.On May 2, 2014, the SEC filed with the Court a stipulation of voluntary dismissal of the civil action against the
The Gabelli Utility TrustNotes to Financial Statements (Unaudited) (Continued)
20
Officer, and on June 19, 2014, the Court approved the stipulation and entered an order of dismissal of theaction against the Officer. The settlement by the Adviser and the disposition of the action against the Officerdid not have a material adverse impact on the Adviser or its ability to fulfill its obligations under the AdvisoryAgreement.
9. Subsequent Events. Management has evaluated the impact on all subsequent events of the Fund and hasdetermined that there were no subsequent events requiring recognition or disclosure in the financialstatements.
Shareholder Meeting – May 12, 2014 – Final Results
The Fund’s Annual Meeting of Shareholders was held on May 12, 2014 at the Greenwich Library in Greenwich,Connecticut. At that meeting, common and preferred shareholders, voting together as a single class, electedFrank J. Fahrenkopf, Jr., Robert J. Morrissey, and Salvatore J. Zizza as Trustees of the Fund. A total of 34,020,292votes, 34,112,986 votes, and 34,027,239 votes were cast in favor of these Trustees and a total of 1,220,410votes, 1,127,717 votes, and 1,213,463 votes were withheld for these Trustees, respectively. In addition, preferredshareholders, voting as a separate class, elected Anthony J. Colavita, as a Trustee of the Fund. A total of1,027,604 votes were cast in favor of this Trustee and a total of 46,715 votes were withheld for this Trustee.
Mario J. Gabelli, CFA, James P. Conn, Vincent D. Enright, John D. Gabelli, Kuni Nakamura, andAnthony R. Pustorino continue to serve in their capacities as Trustees of the Fund.
We thank you for your participation and appreciate your continued support.
Portfolio Manager Biography
Mario J. Gabelli, CFA, is Chairman and Chief Executive Officer of GAMCO Investors, Inc. that he founded in1977 and Chief Investment Officer – Value Portfolios of Gabelli Funds, LLC and GAMCO Asset ManagementInc. Mr. Gabelli is a summa cum laude graduate of Fordham University and holds an MBA degree from ColumbiaBusiness School and Honorary Doctorates from Fordham University and Roger Williams University.
We have separated the portfolio manager’s commentary from the financial statements and investment portfolio due tocorporate governance regulations stipulated by the Sarbanes-Oxley Act of 2002. We have done this to ensure that thecontent of the portfolio manager’s commentary is unrestricted. Both the commentary and the financial statements, includingthe portfolio of investments, will be available on our website at www.gabelli.com.
The Net Asset Value per share appears in the Publicly Traded Funds column, under the heading “SpecializedEquity Funds,” in Monday’s The Wall Street Journal. It is also listed in Barron’s Mutual Funds/Closed EndFunds section under the heading “Specialized Equity Funds.”
The Net Asset Value per share may be obtained each day by calling (914) 921-5070 or visiting www.gabelli.com.
The NASDAQ symbol for the Net Asset Value is “XGUTX.”
Notice is hereby given in accordance with Section 23(c) of the Investment Company Act of 1940, as amended, that theFund may from time to time purchase its common shares in the open market when the Fund’s shares are trading at adiscount of 10% or more from the net asset value of the shares. The Fund may also, from time to time, purchase itspreferred shares in the open market when the preferred shares are trading at a discount to the liquidation value.
The Gabelli Utility TrustNotes to Financial Statements (Unaudited) (Continued)
21
At its meeting on February 25, 2014, the Board of Trustees (“Board”) of the Fund approved the continuationof the investment advisory agreement with the Adviser for the Fund on the basis of the recommendation bythe trustees who are not “interested persons” of the Fund (the “Independent Board Members”). The followingparagraphs summarize the material information and factors considered by the Independent Board Membersas well as their conclusions relative to such factors.
Nature, Extent, and Quality of Services. The Independent Board Members considered information regardingthe portfolio managers, the depth of the analyst pool available to the Adviser and the portfolio managers, thescope of administrative, shareholder, and other services supervised or provided by the Adviser and the absenceof significant service problems reported to the Board. The Independent Board Members noted the experience,length of service, and reputation of the portfolio managers.
Investment Performance. The Independent Board Members considered one year, three year, five year, andten year investment performance for the Fund as compared with relevant sector equity indices and the performanceof other sector equity closed-end and open-end funds prepared by Lipper, including other funds focused onthe utility industry. The Independent Board Members noted that the Fund’s performance was above the medianof funds in its Lipper peer group for the prior one, three, five, and ten year periods. The Independent BoardMembers recognized that many of the Lipper peers were not utility funds so that performance comparisonswere of limited use. The Independent Board Members also noted that the net asset value of the Fund had (i)outperformed the Standard & Poor’s Utility Index over the one year and five year periods and underperformedthe Standard & Poor’s Utility Index over the one year and five year periods, and (ii) outperformed the LipperUtility Fund Average over the ten year period and underperformed the Lipper Utility Fund Average over theone year and five year periods.
Profitability. The Independent Board Members reviewed summary data regarding the profitability of the Fundto the Adviser both with an administrative overhead charge and without such a charge. The Independent BoardMembers referred to the Meeting Materials for the pro forma income statements for the Adviser and the Fundfor the period ended December 31, 2013. They noted how the pro forma income statements for the Fund illustratedhow the Adviser’s profitability would be affected as the Fund’s asset levels change.
Economies of Scale. The Independent Board Members discussed the major elements of the Adviser’s coststructure and the relationship of those elements to potential economies of scale. The Independent Board Membersnoted that the Fund was a closed-end fund and its ability to realize any economies of scale through growth orappreciation was limited, recognizing that the Fund’s size has grown since inception due to offerings of commonshares and leverage.
Sharing of Economies of Scale. The Independent Board Members noted that the investment managementfee schedule for the Fund does not take into account any potential sharing of economies of scale throughbreakpoints.
Service and Cost Comparisons. The Independent Board Members compared the investment managementfee, other expenses, and total expenses of the Fund with similar expenses of the Lipper peer group of sectorequity closed-end funds and noted that the Adviser’s management fee includes substantially all administrativeservices for the Fund as well as investment advisory services. The Independent Board Members noted thatwithin this group, the Fund’s total expense ratio and “other non-management expenses” were above the averageand the median, its advisory fees (as a percentage of assets attributable to common shares) were above the
The Gabelli Utility TrustBoard Consideration and Re-Approval of Investment Advisory Agreements (Unaudited)
22
average and below the median, and its management fee (as a percentage of total managed assets) was belowthe average and median for peer funds, recognizing that, unlike the Fund, some of the peer funds were notleveraged and did not incur the expenses associated with leverage. The Independent Board Members alsonoted that the management fee structure was the same as that in effect for most of the Gabelli funds, exceptfor the presence of leverage and fees chargeable as assets attributable to leverage in certain circumstances.
Conclusions. The Independent Board Members concluded that the Fund enjoyed highly experienced portfoliomanagement services and good ancillary services, and that the performance record had been above averagethe one, three, five, and ten year reporting periods ended December 31, 2013 in comparison with peers andthe Fund had performed satisfactorily in relation to a utility index, but had underperformed the Lipper UtilityFund Average over the ten year period. The Independent Board Members concluded that the profitability tothe Adviser of managing the Fund was reasonable and that, in part due to the Fund’s structure as a closed-endfund, the ability of the Fund to realize economies of scale was limited. The Independent Board Members concludedthat potential “fall-out” benefits that the Adviser and its affiliates may receive, such as brokerage commissionspaid to an affiliated broker, greater name recognition, or increased ability to obtain research services, appearto be reasonable and may in some cases benefit the Fund. On the basis of the foregoing and without assigningparticular weight to any single conclusion, the Independent Board Members determined to recommend continuationof the Advisory Agreement to the full Board. As a part of its decision making process, the Independent BoardMembers noted that the Adviser has managed the Fund since its inception, and the Independent Board Membersbelieve that a long term relationship with a capable, conscientious adviser is in the best interests of the Fund.The Independent Board Members considered, generally, that shareholders invested in the Fund knowing thatthe Adviser managed the Fund and knowing its investment management fee schedule. As such, the IndependentBoard Members considered, in particular, whether the Adviser managed the Fund in accordance with its investmentobjectives and policies as disclosed to shareholders. The Independent Board Members concluded that the Fundwas managed by the Adviser consistent with its investment objectives and policies.
The Gabelli Utility TrustBoard Consideration and Re-Approval of Investment Advisory Agreements (Unaudited) (Continued)
23
THE GABELLI UTILITY TRUSTOne Corporate CenterRye, NY 10580-1422
t 800-GABELLI (800-422-3554)f 914-921-5118e [email protected] GUT Q2/2014
TRUSTEES
Mario J. Gabelli, CFAChairman &Chief Executive Officer,GAMCO Investors, Inc.
Anthony J. ColavitaPresident,Anthony J. Colavita, P.C.
James P. ConnFormer Managing Director &Chief Investment Officer,Financial Security AssuranceHoldings Ltd.
Vincent D. EnrightFormer Senior Vice President &Chief Financial Officer,KeySpan Corp.
Frank J. Fahrenkopf, Jr.Former President &Chief Executive Officer,American Gaming Association
John D. GabelliSenior Vice President,G.research, Inc.
Robert J. MorrisseyPartner,Morrissey, Hawkins & Lynch
Kuni NakamuraPresident,Advanced Polymer, Inc.
Anthony R. PustorinoCertified Public Accountant,Professor Emeritus,Pace University
Salvatore J. ZizzaChairman,Zizza & Associates Corp.
OFFICERS
Bruce N. AlpertPresident
Andrea R. MangoSecretary & Vice President
Agnes MulladyTreasurer
Richard J. WalzChief Compliance Officer
David I. SchachterVice President & Ombudsman
INVESTMENT ADVISER
Gabelli Funds, LLCOne Corporate CenterRye, New York 10580-1422
CUSTODIAN
The Bank of New York Mellon
COUNSEL
Willkie Farr & Gallagher LLP
TRANSFER AGENT ANDREGISTRAR
Computershare Trust Company, N.A.
THEGABELLIUTILITYTRUST
GUT
Semiannual ReportJune 30, 2014
GUT Q2/2014