Embed Size (px)
Citation preview

KGI TOP IDEAS – 16 NOVEMBER WEEKRegional Comprehensive Economic Partnership (RCEP)
•Stock recommendations that would benefit from the trade deal
•Trade sector: China Merchant Port (144 HK), COSCO Shipping Holdings (1919 HK), COSCO Shipping Ports (1199 HK)
•Logistics sector: SITC International Holdings (1308 HK), Kerry Logistics Network (636 HK)
•E-Commerce: SEA Ltd (SE US), Alibaba (BABA US)
Tactical Picks – Nov/Dec 2020
•Transportation (ComfortDelGro)
•Industrials (Keppel Corp, Sunpower Group)
•Consumer Discretionary (ThaiBev)
•Industrial Commodities (Jiangxi Copper 358 HK)
•Lithium (Ganfeng Lithium 1772 HK)
REITS
•Continue to accumulate
•Retail – 2021 dividend recovery
•Industrial
•Office – Tactical play (Suntec)
REITS Yield Enhancement (pls see Products Team for details)
•2.25% financing cost
•Minimum loan S$100,000
•Valid for 1 year upon loan drawdown
Recommendations may only be suitable for accredited investors and funds. See the last page for important disclosures.

KGI NOVEMBER/DECEMBER 2020 CALENDARSunday Monday Tuesday Wednesday Thursday Friday Saturday
15 16 17 182PM KGI CORP ACCESS –PROPNEX (ZOOM)CEO, CFO
19 2010:30am-12pm KGI ELN Training (Room 13A + Zoom)
ThaiBev Results
21
22 23 24 25 26 27 28
29 30 1 2 3 4 5
6 7 8 9 10 11 12
Source: KGI Research*PM – After market close, AM – Before market opens
No
vem
ber
De
cem
ber

PRODUCTS/RESEARCHGUANGZHI, CFA
Macro

WEEK AHEAD• US
• Retail sales in October
• Industrial production in October
• Housing starts in October
• Building permits in October
• Existing home sales in October
• Europe• Inflation rate in October
• China• Fixed asset investment YTD
• Industrial production in October
• Retail sales in October
• Unemployment in October

BIGGEST BREAKING NEWS OVER THE WEEKEND• Regional Comprehensive Economic Partnership (RCEP)
• 15 Asia-Pacific nations sign (ASEAN + China, Japan, South Korea, Australia, and New Zealand)
• Lower trade tariff across the region (47% of the world population, 32% of the world GDP, 29% of the world trade, and32% of the world investment)
• Target: Zero tariff in 10 years
• Zero tariff for 30% of goods from Laos, Cambodia, and Myanmar; and zero tariff for 65% goods from the rest member nations
• More than 100 fields of investments are open within member nations
• Other areas: standard and technology, flora and fauna inspection, economic and technological cooperation, intellectual property, E-commerce, and other disputable issues
• Stocks recommendation:
• Trade: China Merchant Port (144 HK), COSCO Shipping Holdings (1919 HK), COSCO Shipping Ports(1199 HK)
• Logistics: SITC International Holdings (1308 HK), Kerry Logistics Network (636 HK)
• E-commerce: Sea Ltd (SE US), Alibaba (BABA US)
• Warren buffet has told you since September; Berkshire Hathaway has built 5% stakes in Japan's five biggest general trading companies: Itochu, Marubeni, Mitsubishi, Mitsui, and Sumitomo

PRODUCTS/RESEARCHJOEL
STRATEGY

ROTATION COMING… 5 LARGEST STOCKS OVER OWNED
Source: Goldman Sachs Global Investment Research and GSAM
• 5 Mega cap tech companies dominate the S&P 500, accounting for 23% of the index by market cap
• GS recommends moving down in cap and broadening exposure to international equities

COVID-19 VACCINES• Vaccines normally takes years to develop but are now being developed at unprecedented pace
• 200 Covid vaccines listed by WHO; 11 Covid Vaccines in Phase 3
• Pfizer/BioNTech’s vaccine provided 90% protection in trials – 50mn does in 2020 and 1.3bn in 2021
Source: World Health Organization, Statista

PRODUCTS/RESEARCHJOEL
TACTICAL PLAYS
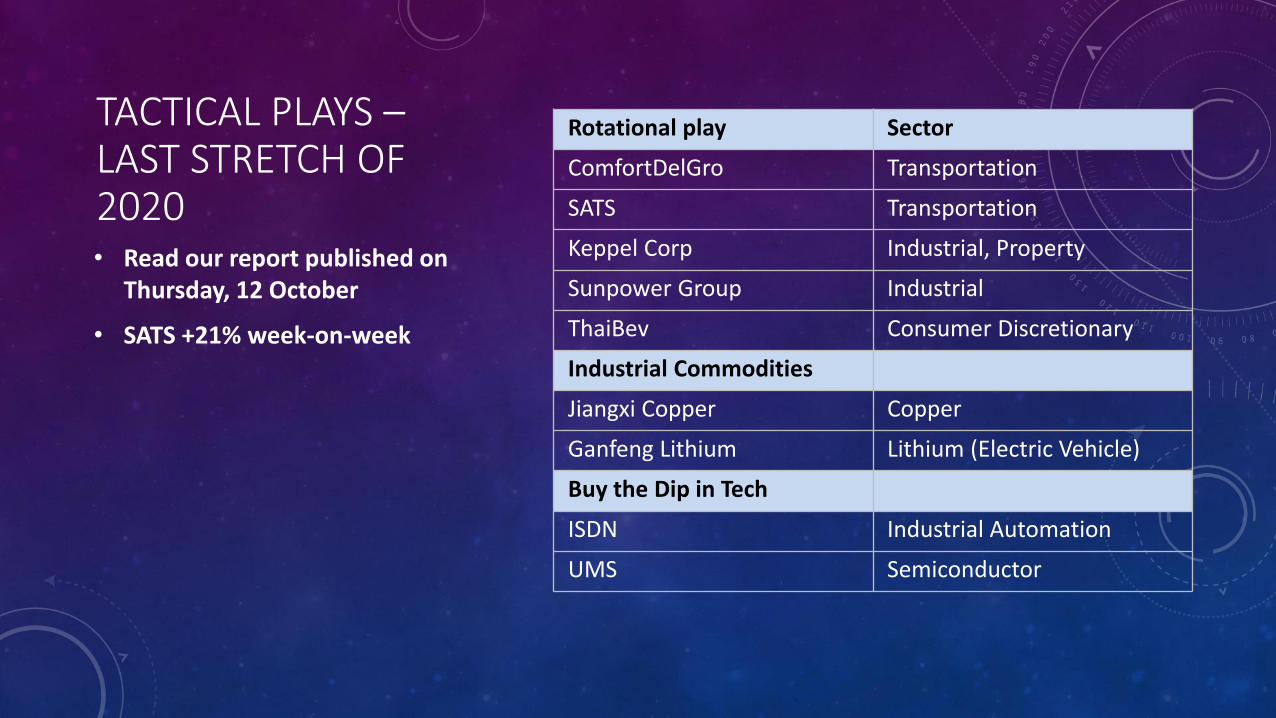
TACTICAL PLAYS –LAST STRETCH OF 2020• Read our report published on
Thursday, 12 October
• SATS +21% week-on-week
Rotational play Sector
ComfortDelGro Transportation
SATS Transportation
Keppel Corp Industrial, Property
Sunpower Group Industrial
ThaiBev Consumer Discretionary
Industrial Commodities
Jiangxi Copper Copper
Ganfeng Lithium Lithium (Electric Vehicle)
Buy the Dip in Tech
ISDN Industrial Automation
UMS Semiconductor

TRANSPORTATION• More people taking private transportation (Private Hire, Taxies)
Source: Google, KGI Research

TRANSPORTATION• S$9.4mn impairment for UK Taxi Business
Source: Company Update, KGI Research
Operating profit by segment (S$mn)

INDUSTRIALS• PMI Manufacturing better-than-expected recovery
Source: TradingEconomics, KGI Research
China Caixin Manufacturing PMI

PRODUCT/RESEARCHAMIRAH
REITS – EC World

EC WORLD REIT (OUTPERFORM TP S$0.74)• Signed major leases in 3Q20 --> imrpoved income
visibility & stability
• Hengde Logistics lease with China state-owned enterprise China Tobacco Zhejiang Industrial Co., Ltd renewed with slight positive reversion, lease term of 38 months
• 22,545sqm of warehouse and dormitory space at Wuhan Meiluote (c. 46% of asset occupancy) leased to an existing e-commerce tenant
• This space was previously let go in 2Q20 by DangDang who did not wish to renew their lease
• Overall portfolio occupancy in 4Q20 will increase to 99.0% from 96.7% as at 30 September 2020, including the lease at Wuhan Meiluote
• 3Q20 distributable income up 3.5% YoY to S$12.3mn
• Actual DPU dipped 6.8% YoY to 1.388 Sing cents due to amounts retained for prudence (approx. $S2.8mn as at 30 Sept 2020)
• All retained amounts will be redistributed to unitholders if not used, by end of 2021
• 8.1% and 8.5% dividend yield for FY20F and FY21F
• Ex-date 11 December 2020

PRODUCT/RESEARCHJOEL
REITS – Sasseur REIT

SASSEUR REIT (OUTPERFORM TP S$0.89)• Distributable income +9% YoY and DPU +8% at
1.764 Scts
• Ex-date 11 December 2020
• 9M20 DPU of 4.61 Scts made up 78% of our full-year forecast
• 7.5% and 7.8% dividend yield in FY20F and FY21F
• Conservative gearing of 28% provides S$828mn of debt headroom
PRODUCT/RESEARCHJOEL
Frencken

FRENCKEN (OUTPERFORM S$1.21) • 3Q20 PATMI rose 17% YoY and 45% QoQ to S$13mn
• Gross margin improved 1.4 ppt to 8.1%, from 6.7%
• Maintain OUTPERFORM with TP S$1.21
Business Sales (S$mn) YoY (%) Outlook (2H20 vs 1H20)
Medical S$20.9 +1.9% Lower
Analytical S$29.6 -4.8% Improve
Industrial Automation S$34.4 -32% Stable
Semiconductor S$50.2 +49.5% Improve
Automative S$21.2 -4.4% Improve
Consumer and industrial electronics
S$4.4 -8.9% NA
Source: Company Data, KGI Research
6,096 6,630 4,740 5,512
6,757 7,000
9,304 10,876
8,598
11,109 11,429
15,396
9,501 9,235
13,343
–
5,000
10,000
15,000
20,000
S$'0
00
PATMI (exc. Exceptional items)

FRENCKEN (OUTPERFORM S$1.21) • Maintain OUTPERFORM with TP S$1.21
• Strength from Semiconductor (ASML) and recovery in Industrial Automation (Seagate)
• Other business segments stable
Source: Company Data, KGI Research
35
,92
3
19
,75
9
32
,36
6
14
,25
3
31
,39
6
21
,18
7
33
,86
2
20
,16
2
30
,46
9
20
,99
0
33
,94
6 41
,06
8
27
,68
6
22
,05
5
36
,51
9
53
,49
9
26
,38
0
19
,46
0
36
,02
3
41
,96
1
24
,26
2
22
,75
4
35
,54
1
46
,11
1
33
,57
8
21
,25
6
31
,10
9
50
,62
1
31
,76
6
23
,41
4 30
,34
1
47
,68
1
41
,70
0
22
,00
0 3
0,1
00
29
,30
0
46
,23
1
21
,97
3
24
,38
2
28
,76
6
50
,20
0
20
,90
0 2
9,6
00
34
,40
0
S E M I C O N D U C T O R M E D I C A L A N A L Y T I C A L I N D U S T R I A L A U T O M A T I O N
R E V E N U E S ( S $ ' 0 0 0 )
1Q18 2Q18 3Q18 4Q18 1Q19 2Q19 3Q19 4Q19 1Q20 2Q20 3Q20

PRODUCT/RESEARCHJOEL
YIELD ENHANCEMENT (REITS)

REITS – VALUE TRADED (SGD)
KGI TRADED VALUE (OCTOBER 2020)
REIT Sum of Amount (SGD) Remarks
ASCENDAS REAL ESTATE INV TRUST 8,742,578$
CAPITALAND INTEGRATED COMMERCIAL TRUST 4,019,323$ CMT + CCT
FRASERS CENTREPOINT TRUST 2,916,444$
FRASERS LOGISTICS & COMMERCIAL TRUST 6,424,560$
KEPPEL DC REIT 2,142,973$
KEPPEL PACIFIC OAK US REIT 4,377,864$
Keppel REIT 1,695,899$
MANULIFE US REIT 2,664,808$
MAPLETREE COMMERCIAL TRUST 1,579,801$
MAPLETREE INDUSTRIAL TRUST 1,930,720$
MAPLETREE LOGISTICS TRUST 5,307,896$
PRIME US REIT 877,174$
Suntec Real Estate Investment Trust 1,992,924$ Tactical play, STI inclusion
Grand Total 44,672,963$ Source: KGI Research

REITS RECOMMENDATION - RETAIL• CapitaLand Integrated Commercial Trust (CICT SP)
• Mapletree Commercial Trust (MCT SP)
• Frasers Centrepoint Trust (FCT SP)
• Lendlease Global Commercial (LREIT SP)
Source: Bloomberg, KGI Research
BB ticker Company NameLast Price
(local $)
Currency Adj.
Market Cap
(S$ m)
Trailing 12M
Dividend Yield
(%)
FY20F
Dividend Yield
(%)
FY21F
Dividend Yield
(%)
Gearing (%)Current P/B
Ratio (x)
6M Average daily
trading volume
(S$ '000)
YTD Price
Performance
(%)
RETAIL 33,965 6.0 6.3 7.5 36.5 0.8 7,386.2 (19.6)
CICT SP CAPITALAND INTEGRATED COMMER SGD 2.00 12,941 5.9 4.6 5.9 31.5 1.0 35,433 -18.7
MCT SP MAPLETREE COMMERCIAL TRUST SGD 2.00 6,630 4.6 4.3 4.7 34.2 1.1 18,862 -16.3
MAGIC SP MAPLETREE NORTH ASIA COMMERC SGD 0.91 2,951 8.2 6.9 7.8 41.6 0.6 6,596 -21.6
SPHREIT SP SPH REIT SGD 0.79 2,179 3.5 6.8 6.8 31.6 0.7 1,725 -26.6
FCT SP FRASERS CENTREPOINT TRUST SGD 2.31 3,903 2.6 5.5 5.7 33.0 1.0 9,631 -17.6
SGREIT SP STARHILL GLOBAL REIT SGD 0.45 979 3.1 9.2 9.7 40.8 0.6 1,284 -38.6
CRCT SP CAPITALAND RETAIL CHINA TRUS SGD 1.26 1,552 5.3 6.1 7.5 43.0 0.8 5,249 -21.7
LREIT SP LENDLEASE GLOBAL COMMERCIAL SGD 0.65 756 4.7 7.4 7.8 34.8 0.7 -30.6
SASSR SP SASSEUR REAL ESTATE INVESTME SGD 0.80 957 7.7 7.7 8.2 30.9 0.9 870 -10.2
LMRT SP LIPPO MALLS INDONESIA RETAIL SGD 0.08 246 16.4 4.8 11.9 39.8 0.5 639 -61.7
DASIN SP DASIN RETAIL TRUST SGD 0.78 605 5.2 6.4 7.2 44.3 0.6 305 -6.6
BHGREIT SP BHG RETAIL REIT SGD 0.52 266 5.1 32.1 0.6 654 -24.1

REITS RECOMMENDATION - INDUSTRIAL• Ascendas REIT (AREIT SP)
• ARA Logos Logistics REIT (ALLT SP)
Source: Bloomberg, KGI Research
BB ticker Company NameLast Price
(local $)
Currency Adj.
Market Cap
(S$ m)
Trailing 12M
Dividend Yield
(%)
FY20F
Dividend Yield
(%)
FY21F
Dividend Yield
(%)
Gearing (%)Current P/B
Ratio (x)
6M Average daily
trading volume
(S$ '000)
YTD Price
Performance
(%)
INDUSTRIAL 40,874 6.0 6.2 6.5 39.7 1.2 11,983.2 7.8
AREIT SP ASCENDAS REAL ESTATE INV TRT SGD 3.04 11,006 4.9 5.0 5.3 39.2 1.4 40,695 2.4
MINT SP MAPLETREE INDUSTRIAL TRUST SGD 3.01 7,076 4.0 4.0 4.4 29.1 1.8 24,516 15.8
MLT SP MAPLETREE LOGISTICS TRUST SGD 1.97 7,994 4.0 4.2 4.3 42.1 1.6 35,862 13.2
FLT SP FRASERS LOGISTICS & COMMERCI SGD 1.25 4,280 5.6 6.1 6.2 40.8 1.2 13,731 5.0
KDCREIT SP KEPPEL DC REIT SGD 2.79 4,556 2.7 3.3 3.6 32.6 2.4 17,165 34.1
AIT SP ASCENDAS INDIA TRUST SGD 1.38 1,584 4.9 6.4 6.7 35.8 1.2 3,343 -11.0
EREIT SP ESR-REIT SGD 0.37 1,311 7.6 7.8 8.1 46.1 0.9 3,293 -30.2
AAREIT SP AIMS APAC REIT SGD 1.18 834 7.2 7.4 7.8 39.7 0.9 1,483 -17.5
SBREIT SP SOILBUILD BUSINESS SPACE REI SGD 0.49 618 7.5 6.2 6.6 40.7 0.8 859 -6.7
ALLT SP ARA LOGOS LOGISTICS TRUST SGD 0.58 679 10.1 8.5 8.7 44.2 1.0 1,560 -19.6
ECWREIT SP EC WORLD REIT SGD 0.70 563 7.9 7.9 8.6 48.9 0.8 882 -6.0
SSREIT SP SABANA SHARIAH COMP IND REIT SGD 0.36 374 5.7 7.3 7.9 37.4 0.7 411 -22.8

REITS RECOMMENDATION - OFFICE• Suntec REIT (SUN SP) – Potential inclusion into FTSE STI in next review
• Keppel REIT (KREIT SP)
Source: Bloomberg, KGI Research
BB ticker Company NameLast Price
(local $)
Currency Adj.
Market Cap
(S$ m)
Trailing 12M
Dividend Yield
(%)
FY20F
Dividend Yield
(%)
FY21F
Dividend Yield
(%)
Gearing (%)Current P/B
Ratio (x)
6M Average daily
trading volume
(S$ '000)
YTD Price
Performance
(%)
OFFICE 15,593 7.6 7.4 7.8 37.2 0.8 1,061.2 (20.6)
SUN SP SUNTEC REIT SGD 1.48 4,181 6.5 4.9 5.8 37.3 0.7 17,900 -19.6
KREIT SP KEPPEL REIT SGD 1.03 3,510 5.4 5.5 5.6 29.1 0.8 7,260 -16.9
OUECT SP OUE COMMERCIAL REAL ESTATE I SGD 0.34 1,841 6.2 7.6 8.5 40.8 0.6 709 -39.8
MUST SP MANULIFE US REAL ESTATE INV USD 0.75 1,600 10.1 8.1 8.3 39.2 1.0 2,246 -25.0
PRIME SP PRIME US REIT USD 0.78 1,103 7.4 9.2 9.3 34.4 0.9 893 -19.7
CERT SP CROMWELL EUROPEAN REIT EUR 0.47 1,894 8.1 7.5 8.6 38.5 0.9 1,354 -13.9
KORE SP KEPPEL PACIFIC OAK US REIT USD 0.70 890 8.6 8.6 9.0 39.0 0.9 1,079 -10.3
IREIT SP IREIT GLOBAL SGD 0.62 574 8.2 8.0 7.3 39.5 0.8 424 -16.1
ELITE SP ELITE COMMERCIAL REIT GBP 0.64 379 3.0 7.8 9.2 68.4 - 153 -

FINANCING TO ENHANCE YIELDS
• Annual interest rate of USD financing: 2.25%*
*T&Cs apply:
• Min loan size USD100K
• Valid for 1 year upon loan drawndown
• Must activate loan before 31/12/2020

EXAMPLE: MANULIFE US REIT (COMMERCIAL)• ONLY FOR ILLUSTRATION PURPOSE
KGI Remarks
Dividend Yield (FY2020F) 8.3% KGI forecast; High vs REITs average of 6.6%
Dividend Yield (FY2021F) 8.3% KGI forecast
Gearing Ratio (debt/investment property)
39.1% Healthy, well below 50% limit; Interest coverage 3.8x
Currency USD No FX risk as rental and REIT unit are in same currency
Assets (Value) US$2.1 bn 96.2% occupancy; WALE (by NLA) 5.7 years
Assets (Description) Trophy/ Class A 9 prime, freehold office properties in California, Atlanta, New Jersey and Washington D.C. and Virginia. Top tenants: The William Carter (6.2%); TCW Group (4.0%); Kilpatrick Townsend (3.6%)
Sponsor Manulife Manulife Financial Corporation is a leading international financial services group with a market cap of US$28 billion. It operates as John Hancock in the US and Manulife elsewhere around the world.

EXAMPLE: MANULIFE US REIT (COMMERCIAL) - CASH• ONLY FOR ILLUSTRATION PURPOSE
Without financing With financing
Cash deposit USD 500k USD 500k
Purchase of Manulife US REIT units
USD 500k USD 1mn
Total loan NIL USD 500k
Financing costs NIL 2.25% p.a. x USD 500k = USD 11.25k
Dividend yield USD 500k x 8.3%
= USD 41.5k
USD 1mn x 8.3%= USD 83k
Profit (less financing costs) USD 41.5k(equiv. to 8.3% return)
USD 83k – USD 11.25k = USD 71.75k (equiv. to 14.4% return)
Margin ratio NIL USD 1mn ÷ USD 500k = 200%
MAS requirement: Margin ratio must be maintained at 140% or more throughout

EXAMPLE: MANULIFE US REIT (COMMERCIAL) - BONDS• ONLY FOR ILLUSTRATION PURPOSE
MAS requirement: Margin ratio must be maintained at 140% or more throughout
With financing
Bonds as collateral USD 500k
Haircut e.g., 15%
Bond collateral value USD 500k x 85% = USD 425k
Purchase of Manulife US REIT units USD 500k
Total loan USD 500k
Financing costs 2.25% p.a. x USD 500k = USD 11.25k
Dividend yield (from Manulife US REIT) USD 500k x 8.3%= USD 41.5k
Additional yield (less financing costs) USD 41.5k – USD 11.25k = USD 30.25k (equiv. to 6.05% return)
Margin ratio USD (500k + 425k) ÷ USD 500k = 185%

DISCLAIMERThis report is provided for information only and is not an offer or a solicitation to deal in securities or to enter into any legal relations, nor an advice or a recommendation with respect to such securities. This report is prepared for general circulation. It does not have regard to the specific investment objectives, financial situation and the particular needs of any recipient hereof. You should independently evaluate particular investments and consult an independent financial adviser before dealing in any securities mentioned in this report.
This report is confidential. This report may not be published, circulated, reproduced or distributed and/or redistributed in whole or in part by any recipient of this report to any other person without the prior written consent of KGI Securities. This report is not intended for distribution and/or redistribution, publication to or use by any person in any jurisdiction outside Singapore or any other jurisdiction as KGI Securities may determine in its absolute discretion, where the distribution, publication or use of this report would be contrary to applicable law or would subject KGI Securities and its connected persons (as defined in the Financial Advisers Act, Chapter 110 of Singapore) to any registration, licensing or other requirements within such jurisdiction.
The information or views in the report (“Information”) has been obtained or derived from sources believed by KGI Securities to be reliable. However, KGI Securities makes no representation as to the accuracy or completeness of such sources or the Information and KGI Securities accepts no liability whatsoever for any loss or damage arising from the use of or reliance on the Information. KGI Securities and its connected persons may have issued other reports expressing views different from the Information and all views expressed in all reports of KGI Securities and its connected persons are subject to change without notice. KGI Securities reserves the right to act upon or use the Information at any time, including before its publication herein.
Except as otherwise indicated below, (1) KGI Securities, its connected persons and its officers, employees and representatives may, to the extent permitted by law, transact with, perform or provide broking, underwriting, corporate finance-related or other services for or solicit business from, the subject corporation(s) referred to in this report; (2) KGI Securities, its connected persons and its officers, employees and representatives may also, to the extent permitted by law, transact with, perform or provide broking or other services for or solicit business from, other persons in respect of dealings in the securities referred to in this report or other investments related thereto; and (3) the officers, employees and representatives of KGI Securities may also serve on the board of directors or in trustee positions with the subject corporation(s) referred to in this report. (All of the foregoing is hereafter referred to as the “Subject Business”.)
However, as of the date of this report, neither KGI Securities nor its representative(s) who produced this report (each a “research analyst”), has any proprietary position or material interest in, and KGI Securities does not make any market in, the securities which are recommended in this report.
Each research analyst of KGI Securities who produced this report hereby certifies that (1) the views expressed in this report accurately reflect his/her personal views about all of the subject corporation(s) and securities in this report; (2) the report was produced independently by him/her; (3) he/she does not carry out, whether for himself/herself or on behalf of KGI Securities or any other person, any of the Subject Business involving any of the subject corporation(s) or securities referred to in this report; and (4) he/she has not received and will not receive any compensation that is directly or indirectly related or linked to the recommendations or views expressed in this report or to any sales, trading, dealing or corporate finance advisory services or transaction in respect of the securities in this report. However, the compensation received by each such research analyst is based upon various factors, including KGI Securities’ total revenues, a portion of which are generated from KGI Securities’ business of dealing in securities.
Copyright 2020. KGI Securities (Singapore) Pte. Ltd. All rights reserved