Embed Size (px)
Citation preview

Keystone Exams: Algebra IAssessment Anchors and Eligible Content
with Sample Questions and Glossary
Pennsylvania Department of Education
www.education.state.pa.us
April 2014

Pennsylvania Department of Education—Assessment Anchors and Eligible Content Page 2
PENNSYLVANIA DEPARTMENT OF EDUCATION
General Introduction to the Keystone Exam Assessment Anchors
Introduction
Since the introduction of the Keystone Exams, the Pennsylvania Department of Education (PDE) has been working to create a set of tools designed to help educators improve instructional practices and better understand the Keystone Exams. The Assessment Anchors, as defined by the Eligible Content, are one of the many tools the Department believes will better align curriculum, instruction, and assessment practices throughout the Commonwealth. Without this alignment, it will not be possible to significantly improve student achievement across the Commonwealth.
How were Keystone Exam Assessment Anchors developed?
Prior to the development of the Assessment Anchors, multiple groups of PA educators convened to create a set of standards for each of the Keystone Exams. Enhanced Standards, derived from a review of existing standards, focused on what students need to know and be able to do in order to be college and career ready. (Note: Since that time, PA Core Standards have replaced the Enhanced Standards and reflect the college- and career-ready focus.) Additionally, the Assessment Anchors and Eligible Content statements were created by other groups of educators charged with the task of clarifying the standards assessed on the Keystone Exams. The Assessment Anchors, as defined by the Eligible Content, have been designed to hold together, or anchor, the state assessment system and the curriculum/instructional practices in schools.
Assessment Anchors, as defined by the Eligible Content, were created with the following design parameters: Clear: The Assessment Anchors are easy to read and are user friendly; they clearly detail which
standards are assessed on the Keystone Exams.
Focused: The Assessment Anchors identify a core set of standards that can be reasonably assessed on a large-scale assessment; this will keep educators from having to guess which standards are critical.
Rigorous: The Assessment Anchors support the rigor of the state standards by assessing higher-order and reasoning skills.
Manageable: The Assessment Anchors define the standards in a way that can be easily incorporated into a course to prepare students for success.
How can teachers, administrators, schools, and districts use these Assessment Anchors?
The Assessment Anchors, as defined by the Eligible Content, can help focus teaching and learning because they are clear, manageable, and closely aligned with the Keystone Exams. Teachers and administrators will be better informed about which standards will be assessed. The Assessment Anchors and Eligible Content should be used along with the Standards and the Curriculum Framework of the Standards Aligned System (SAS) to build curriculum, design lessons, and support student achievement.
The Assessment Anchors and Eligible Content are designed to enable educators to determine when they feel students are prepared to be successful in the Keystone Exams. An evaluation of current course offerings, through the lens of what is assessed on those particular Keystone Exams, may provide an opportunity for an alignment to ensure student preparedness.

Pennsylvania Department of Education—Assessment Anchors and Eligible Content Page 3
How are the Assessment Anchors organized?
The Assessment Anchors, as defined by the Eligible Content, are organized into cohesive blueprints, each structured with a common labeling system that can be read like an outline. This framework is organized first by module, then by Assessment Anchor, followed by Anchor Descriptor, and then finally, at the greatest level of detail, by an Eligible Content statement. The common format of this outline is followed across the Keystone Exams.
Here is a description of each level in the labeling system for the Keystone Exams: Module: The Assessment Anchors are organized into two thematic modules for each of the
Keystone Exams. The module title appears at the top of each page. The module level is important because the Keystone Exams are built using a module format, with each of the Keystone Exams divided into two equal-size test modules. Each module is made up of two or more Assessment Anchors.
Assessment Anchor: The Assessment Anchor appears in the shaded bar across the top of each Assessment Anchor table. The Assessment Anchors represent categories of subject matter that anchor the content of the Keystone Exams. Each Assessment Anchor is part of a module and has one or more Anchor Descriptors unified under it.
Anchor Descriptor: Below each Assessment Anchor is a specific Anchor Descriptor. The Anchor Descriptor level provides further details that delineate the scope of content covered by the Assessment Anchor. Each Anchor Descriptor is part of an Assessment Anchor and has one or more Eligible Content statements unified under it.
Eligible Content: The column to the right of the Anchor Descriptor contains the Eligible Content statements. The Eligible Content is the most specific description of the content that is assessed on the Keystone Exams. This level is considered the assessment limit and helps educators identify the range of the content covered on the Keystone Exams.
PA Core Standard: In the column to the right of each Eligible Content statement is a code representing one or more PA Core Standards that correlate to the Eligible Content statement. Some Eligible Content statements include annotations that indicate certain clarifications about the scope of an Eligible Content.
“e.g.” (“for example”)—sample approach, but not a limit to the Eligible Content
“i.e.” (“that is”)—specific limit to the Eligible Content
“Note”—content exclusions or definable range of the Eligible Content
How do the K–12 Pennsylvania Core Standards affect this document?
Assessment Anchor and Eligible Content statements are aligned to the PA Core Standards; thus, the former enhanced standards are no longer necessary. Within this document, all standard references reflect the PA Core Standards.
Standards Aligned System—www.pdesas.org
Pennsylvania Department of Education—www.education.state.pa.us
Pennsylvania Department of Education—Assessment Anchors and Eligible Content Page 4
Keystone Exams: Algebra I
FORMULA SHEET
Formulas that you may need to work questions in this document are found below.You may use calculator π or the number 3.14.
A = lw
l
w
V = lwh
lw
h
Arithmetic Properties
Additive Inverse: a + (ˉa) = 0
Multiplicative Inverse: a · = 1
Commutative Property: a + b = b + a a · b = b · a
Associative Property: (a + b) + c = a + (b + c) (a · b) · c = a · (b · c)
Identity Property: a + 0 = a a · 1 = a
Distributive Property: a · (b + c) = a · b + a · c
Multiplicative Property of Zero: a · 0 = 0
Additive Property of Equality: If a = b, then a + c = b + c
Multiplicative Property of Equality: If a = b, then a · c = b · c
1a
Linear Equations
Slope: m =
Point-Slope Formula: (y – y 1) = m(x – x 1)
Slope-Intercept Formula: y = mx + b
Standard Equation of a Line: Ax + By = C
y 2 – y 1x 2 – x 1
Pennsylvania Department of Education—Assessment Anchors and Eligible Content Page 5
Keystone Exams: Algebra I
MODULE 1—Operations and Linear Equations & Inequalities
ASSESSMENT ANCHOR
A1.1.1 Operations with Real Numbers and Expressions
Anchor Descriptor Eligible ContentPA Core
Standards
A1.1.1.1 Represent and/or use numbers in equivalent forms (e.g., integers, fractions, decimals, percents, square roots, and exponents).
A1.1.1.1.1 Compare and/or order any real numbers.Note: Rational and irrational may be mixed.
CC.2.1.8.E.1
CC.2.1.8.E.4
CC.2.1.HS.F.1
CC.2.1.HS.F.2
A1.1.1.1.2 Simplify square roots (e.g., Ï}
24 = 2 Ï}
6 ).
Sample Exam Questions
Standard A1.1.1.1.1
Which of the following inequalities is true for all real values of x?
A. x3 ≥ x2
B. 3x2 ≥ 2x3
C. (2x)2 ≥ 3x2
D. 3(x – 2)2 ≥ 3x2 – 2
Standard A1.1.1.1.2
An expression is shown below.
2 Ï}
51x
Which value of x makes the expression equivalent to 10 Ï
}
51 ?
A. 5
B. 25
C. 50
D. 100
An expression is shown below.
Ï}
87x
For which value of x should the expression be further simplified?
A. x = 10
B. x = 13
C. x = 21
D. x = 38
Pennsylvania Department of Education—Assessment Anchors and Eligible Content Page 6
MODULE 1—Operations and Linear Equations & Inequalities
Keystone Exams: Algebra I
ASSESSMENT ANCHOR
A1.1.1 Operations with Real Numbers and Expressions
Anchor Descriptor Eligible ContentPA Core
Standards
A1.1.1.2 Apply number theory concepts to show relationships between real numbers in problem-solving settings.
A1.1.1.2.1 Find the Greatest Common Factor (GCF) and/or the Least Common Multiple (LCM) for sets of monomials.
CC.2.1.6.E.3
CC.2.1.HS.F.2
Sample Exam Question
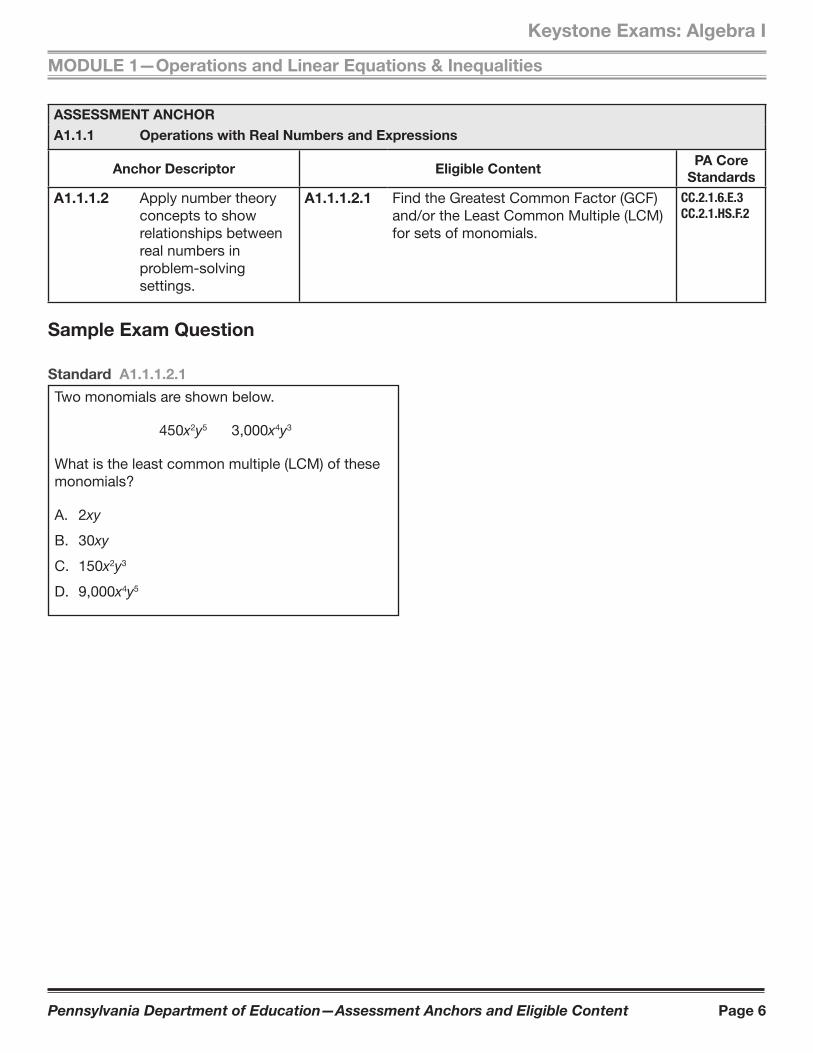
Standard A1.1.1.2.1
Two monomials are shown below.
450x2y5 3,000x4y3
What is the least common multiple (LCM) of these monomials?
A. 2xy
B. 30xy
C. 150x2y3
D. 9,000x4y5

Pennsylvania Department of Education—Assessment Anchors and Eligible Content Page 7
Keystone Exams: Algebra I
MODULE 1—Operations and Linear Equations & Inequalities
ASSESSMENT ANCHOR
A1.1.1 Operations with Real Numbers and Expressions
Anchor Descriptor Eligible ContentPA Core
Standards
A1.1.1.3 Use exponents, roots, and/or absolute values to solve problems.
A1.1.1.3.1 Simplify/evaluate expressions involving properties/laws of exponents, roots, and/or absolute values to solve problems. Note: Exponents should be integers from –10 to 10.
CC.2.1.HS.F.1
CC.2.1.HS.F.2
CC.2.2.8.B.1
Sample Exam Question
Standard A1.1.1.3.1
Simplify:
2(2 Ï}
4 ) –2
A. 1 __ 8
B. 1 __ 4
C. 16
D. 32

Pennsylvania Department of Education—Assessment Anchors and Eligible Content Page 8
MODULE 1—Operations and Linear Equations & Inequalities
Keystone Exams: Algebra I
ASSESSMENT ANCHOR
A1.1.1 Operations with Real Numbers and Expressions
Anchor Descriptor Eligible ContentPA Core
Standards
A1.1.1.4 Use estimation strategies in problem-solving situations.
A1.1.1.4.1 Use estimation to solve problems. CC.2.2.7.B.3
CC.2.2.HS.D.9
Sample Exam Question
Standard A1.1.1.4.1
A theme park charges $52 for a day pass and $110 for a week pass. Last month, 4,432 day passes were sold and 979 week passes were sold. Which is the closest estimate of the total amount of money paid for the day and week passes for last month?
A. $300,000
B. $400,000
C. $500,000
D. $600,000
Pennsylvania Department of Education—Assessment Anchors and Eligible Content Page 9
Keystone Exams: Algebra I
MODULE 1—Operations and Linear Equations & Inequalities
ASSESSMENT ANCHOR
A1.1.1 Operations with Real Numbers and Expressions
Anchor Descriptor Eligible ContentPA Core
Standards
A1.1.1.5 Simplify expressions involving polynomials.
A1.1.1.5.1 Add, subtract, and/or multiply polynomial expressions (express answers in simplest form). Note: Nothing larger than a binomial multiplied by a trinomial.
CC.2.2.HS.D.1
CC.2.2.HS.D.2 CC.2.2.HS.D.3
CC.2.2.HS.D.5
CC.2.2.HS.D.6
A1.1.1.5.2 Factor algebraic expressions, including difference of squares and trinomials.Note: Trinomials are limited to the form ax2 + bx + c where a is equal to 1 after factoring out all monomial factors.
A1.1.1.5.3 Simplify/reduce a rational algebraic expression.
Sample Exam Questions
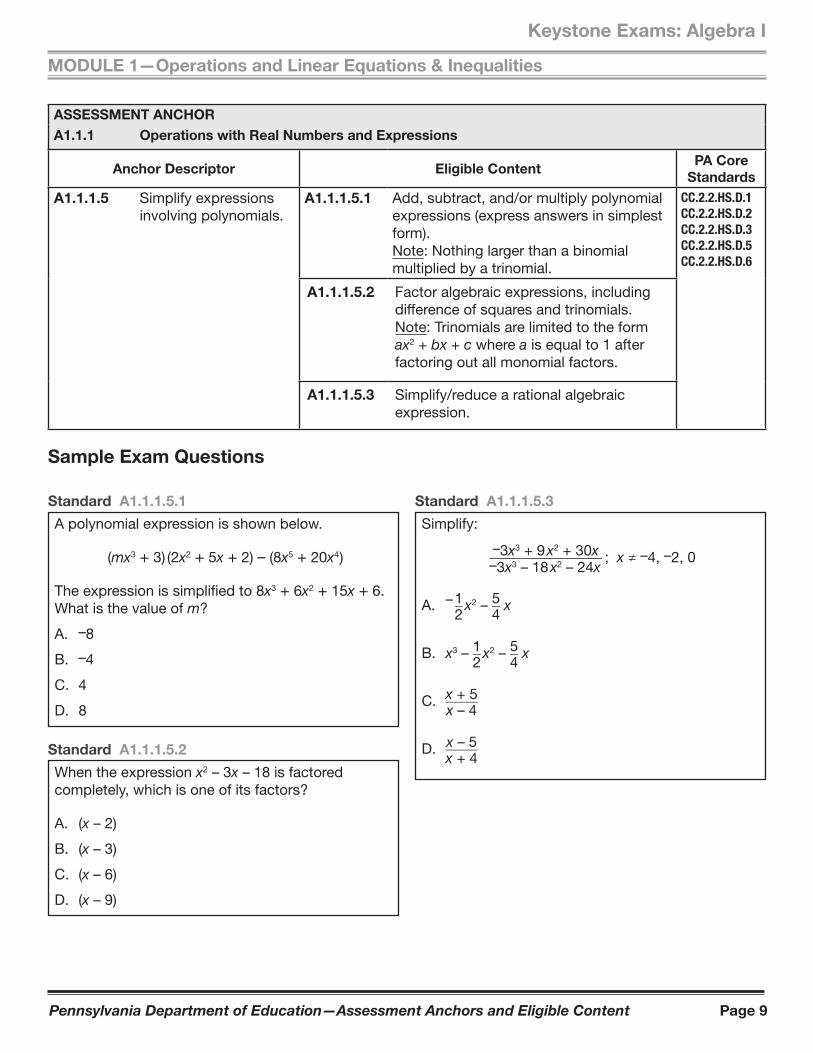
Standard A1.1.1.5.1
A polynomial expression is shown below.
(mx3 + 3 ) (2x2 + 5x + 2) – (8x5 + 20x4 )
The expression is simplified to 8x3 + 6x2 + 15x + 6. What is the value of m?
A. –8
B. –4
C. 4
D. 8
Standard A1.1.1.5.2
When the expression x2 – 3x – 18 is factored completely, which is one of its factors?
A. (x – 2)
B. (x – 3)
C. (x – 6)
D. (x – 9)
Standard A1.1.1.5.3
Simplify:
–3x3 + 9 x2 + 30x }} –3x3 – 18 x2 – 24x ; x ≠ –4, –2, 0
A. – 1 } 2 x2 – 5 }
4 x
B. x3 – 1 } 2
x2 – 5 } 4 x
C. x + 5 } x – 4
D. x – 5 } x + 4
Pennsylvania Department of Education—Assessment Anchors and Eligible Content Page 10
MODULE 1—Operations and Linear Equations & Inequalities
Keystone Exams: Algebra I
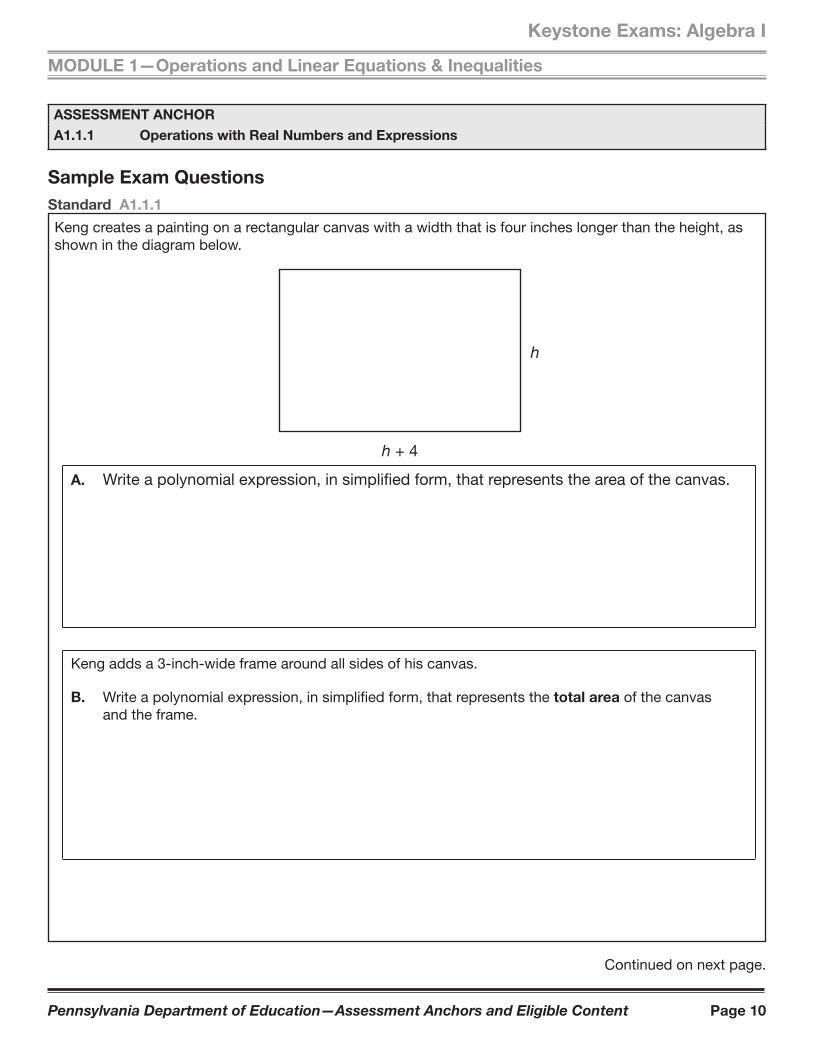
Standard A1.1.1
Keng creates a painting on a rectangular canvas with a width that is four inches longer than the height, as shown in the diagram below.
h
h + 4
A. Write a polynomial expression, in simplifi ed form, that represents the area of the canvas.
Keng adds a 3-inch-wide frame around all sides of his canvas.
B. Write a polynomial expression, in simplified form, that represents the total area of the canvas and the frame.
Continued on next page.
ASSESSMENT ANCHOR
A1.1.1 Operations with Real Numbers and Expressions
Sample Exam Questions

Pennsylvania Department of Education—Assessment Anchors and Eligible Content Page 11
Keystone Exams: Algebra I
MODULE 1—Operations and Linear Equations & Inequalities
Continued. Please refer to the previous page for task explanation.
Keng is unhappy with his 3-inch-wide frame, so he decides to put a frame with a different width around his canvas. The total area of the canvas and the new frame is given by the polynomial h2 + 8h + 12, where h represents the height of the canvas.
C. Determine the width of the new frame. Show all your work. Explain why you did each step.
Pennsylvania Department of Education—Assessment Anchors and Eligible Content Page 12
MODULE 1—Operations and Linear Equations & Inequalities
Keystone Exams: Algebra I
Standard A1.1.1
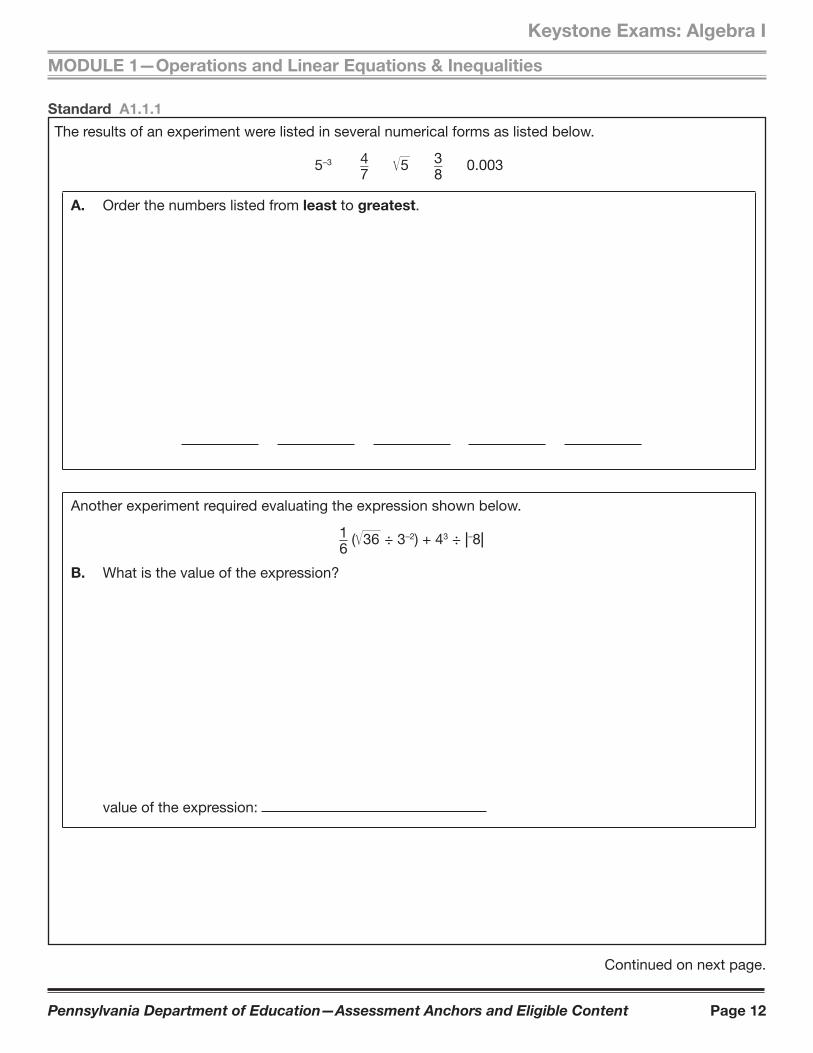
The results of an experiment were listed in several numerical forms as listed below.
5–3 4 } 7 Ï
}
5 3 } 8 0.003
A. Order the numbers listed from least to greatest.
Another experiment required evaluating the expression shown below.
1 } 6 ( Ï
}
36 ÷ 3–2) + 43 ÷ z–8z
B. What is the value of the expression?
value of the expression:
Continued on next page.

Pennsylvania Department of Education—Assessment Anchors and Eligible Content Page 13
Keystone Exams: Algebra I
MODULE 1—Operations and Linear Equations & Inequalities
Continued. Please refer to the previous page for task explanation.
The final experiment required simplifying 7 Ï}
425 . The steps taken are shown below.
7 425
step 1: 7 400 25)
step 2: 7(20 + 5)
step 3: 7(25)
step 4: 175
+
One of the steps shown is incorrect.
C. Rewrite the incorrect step so that it is correct.
correction:
D. Using the corrected step from part C, simplify 7 Ï}
425 .
7 Ï}
425 =

Pennsylvania Department of Education—Assessment Anchors and Eligible Content Page 14
MODULE 1—Operations and Linear Equations & Inequalities
Keystone Exams: Algebra I
ASSESSMENT ANCHOR
A1.1.2 Linear Equations
Anchor Descriptor Eligible ContentPA Core
Standards
A1.1.2.1 Write, solve, and/or graph linear equations using various methods.
A1.1.2.1.1 Write, solve, and/or apply a linear equation (including problem situations).
CC.2.1.HS.F.3
CC.2.1.HS.F.4
CC.2.1.HS.F.5
CC.2.2.8.B.3
CC.2.2.8.C.1
CC.2.2.8.C.2
CC.2.2.HS.C.3
CC.2.2.HS.D.7
CC.2.2.HS.D.8
CC.2.2.HS.D.9
CC.2.2.HS.D.10
A1.1.2.1.2 Use and/or identify an algebraic property to justify any step in an equation-solving process.Note: Linear equations only.
A1.1.2.1.3 Interpret solutions to problems in the context of the problem situation.Note: Linear equations only.
Sample Exam Questions
Standard A1.1.2.1.1
Jenny has a job that pays her $8 per hour plus tips (t). Jenny worked for 4 hours on Monday and made $65 in all. Which equation could be used to find t, the amount Jenny made in tips?
A. 65 = 4t + 8
B. 65 = 8t ÷ 4
C. 65 = 8t + 4
D. 65 = 8(4) + t
Standard A1.1.2.1.2
One of the steps Jamie used to solve an equation is shown below.
–5(3x + 7) = 10–15x + –35 = 10
Which statements describe the procedure Jamie used in this step and identify the property that justifies the procedure?
A. Jamie added –5 and 3x to eliminate the parentheses. This procedure is justifi ed by the associative property.
B. Jamie added –5 and 3x to eliminate the parentheses. This procedure is justifi ed by the distributive property.
C. Jamie multiplied 3x and 7 by –5 to eliminate the parentheses. This procedure is justifi ed by the associative property.
D. Jamie multiplied 3x and 7 by –5 to eliminate the parentheses. This procedure is justifi ed by the distributive property.
Pennsylvania Department of Education—Assessment Anchors and Eligible Content Page 15
Keystone Exams: Algebra I
MODULE 1—Operations and Linear Equations & Inequalities
Sample Exam Question
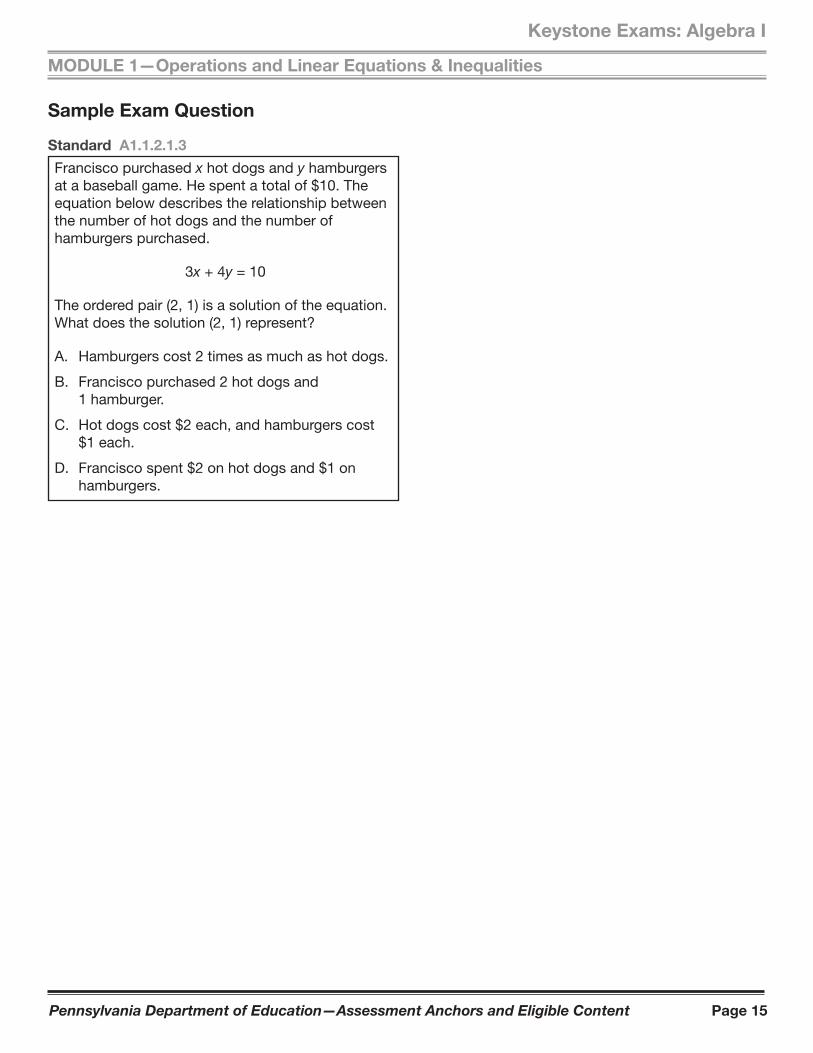
Standard A1.1.2.1.3
Francisco purchased x hot dogs and y hamburgers at a baseball game. He spent a total of $10. The equation below describes the relationship between the number of hot dogs and the number of hamburgers purchased.
3x + 4y = 10
The ordered pair (2, 1) is a solution of the equation. What does the solution (2, 1) represent?
A. Hamburgers cost 2 times as much as hot dogs.
B. Francisco purchased 2 hot dogs and 1 hamburger.
C. Hot dogs cost $2 each, and hamburgers cost $1 each.
D. Francisco spent $2 on hot dogs and $1 on hamburgers.
Pennsylvania Department of Education—Assessment Anchors and Eligible Content Page 16
MODULE 1—Operations and Linear Equations & Inequalities
Keystone Exams: Algebra I
ASSESSMENT ANCHOR
A1.1.2 Linear Equations
Anchor Descriptor Eligible ContentPA Core
Standards
A1.1.2.2 Write, solve, and/or graph systems of linear equations using various methods.
A1.1.2.2.1 Write and/or solve a system of linear equations (including problem situations) using graphing, substitution, and/or elimination.Note: Limit systems to two linear equations.
CC.2.1.HS.F.5
CC.2.2.8.B.3
CC.2.2.HS.D.7
CC.2.2.HS.D.9
CC.2.2.HS.D.10
A1.1.2.2.2 Interpret solutions to problems in the context of the problem situation.Note: Limit systems to two linear equations.
Sample Exam Questions
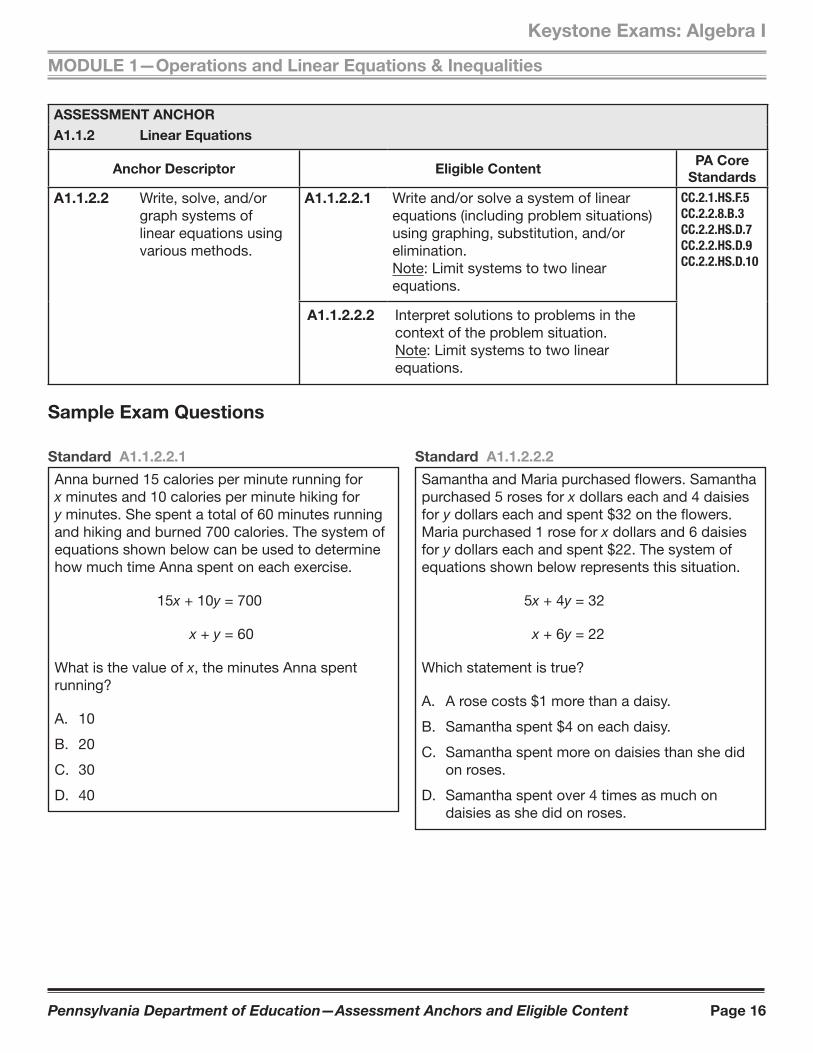
Standard A1.1.2.2.1
Anna burned 15 calories per minute running for x minutes and 10 calories per minute hiking for y minutes. She spent a total of 60 minutes running and hiking and burned 700 calories. The system of equations shown below can be used to determine how much time Anna spent on each exercise.
15x + 10y = 700
x + y = 60
What is the value of x, the minutes Anna spent running?
A. 10
B. 20
C. 30
D. 40
Standard A1.1.2.2.2
Samantha and Maria purchased flowers. Samantha purchased 5 roses for x dollars each and 4 daisies for y dollars each and spent $32 on the flowers. Maria purchased 1 rose for x dollars and 6 daisies for y dollars each and spent $22. The system of equations shown below represents this situation.
5x + 4y = 32
x + 6y = 22
Which statement is true?
A. A rose costs $1 more than a daisy.
B. Samantha spent $4 on each daisy.
C. Samantha spent more on daisies than she did on roses.
D. Samantha spent over 4 times as much on daisies as she did on roses.

Pennsylvania Department of Education—Assessment Anchors and Eligible Content Page 17
Keystone Exams: Algebra I
MODULE 1—Operations and Linear Equations & Inequalities
Standard A1.1.2
Nolan has $15.00. He earns $6.00 an hour babysitting. The equation below can be used to determine how much money in dollars (m) Nolan has after any number of hours of babysitting (h).
m = 6h + 15
A. After how many hours of babysitting will Nolan have $51.00?
hours:
Claire has $9.00. She makes $8.00 an hour babysitting.
B. Use the system of linear equations below to find the number of hours of babysitting after which Nolan and Claire will have the same amount of money.
m = 6h + 15
m = 8h + 9
hours:
Continued on next page.
ASSESSMENT ANCHOR
A1.1.2 Linear Equations
Sample Exam Questions
Pennsylvania Department of Education—Assessment Anchors and Eligible Content Page 18
MODULE 1—Operations and Linear Equations & Inequalities
Keystone Exams: Algebra I
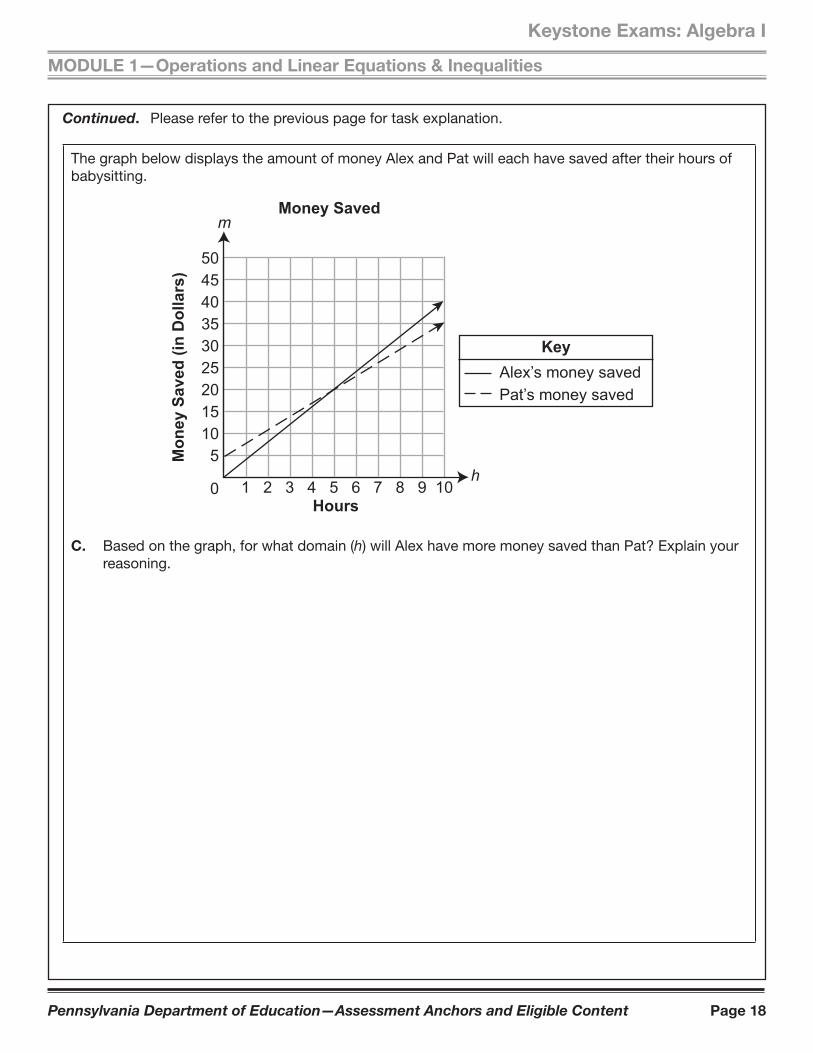
Continued. Please refer to the previous page for task explanation.
The graph below displays the amount of money Alex and Pat will each have saved after their hours of babysitting.
0Hours
Mon
ey S
aved
(in
Dol
lars
)
h
m
504540353025201510
5
1 2 3 4 5 6 7 8 9 10
Money Saved
KeyAlex’s money savedPat’s money saved
C. Based on the graph, for what domain (h) will Alex have more money saved than Pat? Explain your reasoning.

Pennsylvania Department of Education—Assessment Anchors and Eligible Content Page 19
Keystone Exams: Algebra I
MODULE 1—Operations and Linear Equations & Inequalities
Standard A1.1.2
The diagram below shows 5 identical bowls stacked one inside the other.
2 inches
5 inches
Bowls
The height of 1 bowl is 2 inches. The height of a stack of 5 bowls is 5 inches.
A. Write an equation using x and y to find the height of a stack of bowls based on any number of bowls.
equation:
Continued on next page.

Pennsylvania Department of Education—Assessment Anchors and Eligible Content Page 20
MODULE 1—Operations and Linear Equations & Inequalities
Keystone Exams: Algebra I
Continued. Please refer to the previous page for task explanation.
B. Describe what the x and y variables represent.
x-variable:
y-variable:
C. What is the height, in inches, of a stack of 10 bowls?
height: inches

Pennsylvania Department of Education—Assessment Anchors and Eligible Content Page 21
Keystone Exams: Algebra I
MODULE 1—Operations and Linear Equations & Inequalities
ASSESSMENT ANCHOR
A1.1.3 Linear Inequalities
Anchor Descriptor Eligible ContentPA Core
Standards
A1.1.3.1 Write, solve, and/or graph linear inequalities using various methods.
A1.1.3.1.1 Write or solve compound inequalities and/or graph their solution sets on a number line (may include absolute value inequalities).
CC.2.1.HS.F.5
CC.2.2.HS.D.7
CC.2.2.HS.D.9
CC.2.2.HS.D.10
A1.1.3.1.2 Identify or graph the solution set to a linear inequality on a number line.
A1.1.3.1.3 Interpret solutions to problems in the context of the problem situation.Note: Linear inequalities only.
Sample Exam Questions
Standard A1.1.3.1.1
A compound inequality is shown below.
5 < 2 – 3y < 14
What is the solution of the compound inequality?
A. –4 > y > –1
B. –4 < y < –1
C. 1 > y > 4
D. 1 < y < 4
Standard A1.1.3.1.3
A baseball team had $1,000 to spend on supplies. The team spent $185 on a new bat. New baseballs cost $4 each. The inequality 185 + 4b ≤ 1,000 can be used to determine the number of new baseballs (b) that the team can purchase. Which statement about the number of new baseballs that can be purchased is true?
A. The team can purchase 204 new baseballs.
B. The minimum number of new baseballs that can be purchased is 185.
C. The maximum number of new baseballs that can be purchased is 185.
D. The team can purchase 185 new baseballs, but this number is neither the maximum nor the minimum.
Standard A1.1.3.1.2
The solution set of an inequality is graphed on the number line below.
–4–5 –3 –2 –1 0 1 2
The graph shows the solution set of which inequality?
A. 2x + 5 < –1
B. 2x + 5 ≤ –1
C. 2x + 5 > –1
D. 2x + 5 ≥ –1
Pennsylvania Department of Education—Assessment Anchors and Eligible Content Page 22
MODULE 1—Operations and Linear Equations & Inequalities
Keystone Exams: Algebra I
ASSESSMENT ANCHOR
A1.1.3 Linear Inequalities
Anchor Descriptor Eligible ContentPA Core
Standards
A1.1.3.2 Write, solve, and/or graph systems of linear inequalities using various methods.
A1.1.3.2.1 Write and/or solve a system of linear inequalities using graphing.Note: Limit systems to two linear inequalities.
CC.2.1.HS.F.5
CC.2.2.HS.D.7
CC.2.2.HS.D.10
A1.1.3.2.2 Interpret solutions to problems in the context of the problem situation.Note: Limit systems to two linear inequalities.
Pennsylvania Department of Education—Assessment Anchors and Eligible Content Page 23
Keystone Exams: Algebra I
MODULE 1—Operations and Linear Equations & Inequalities
Sample Exam Question
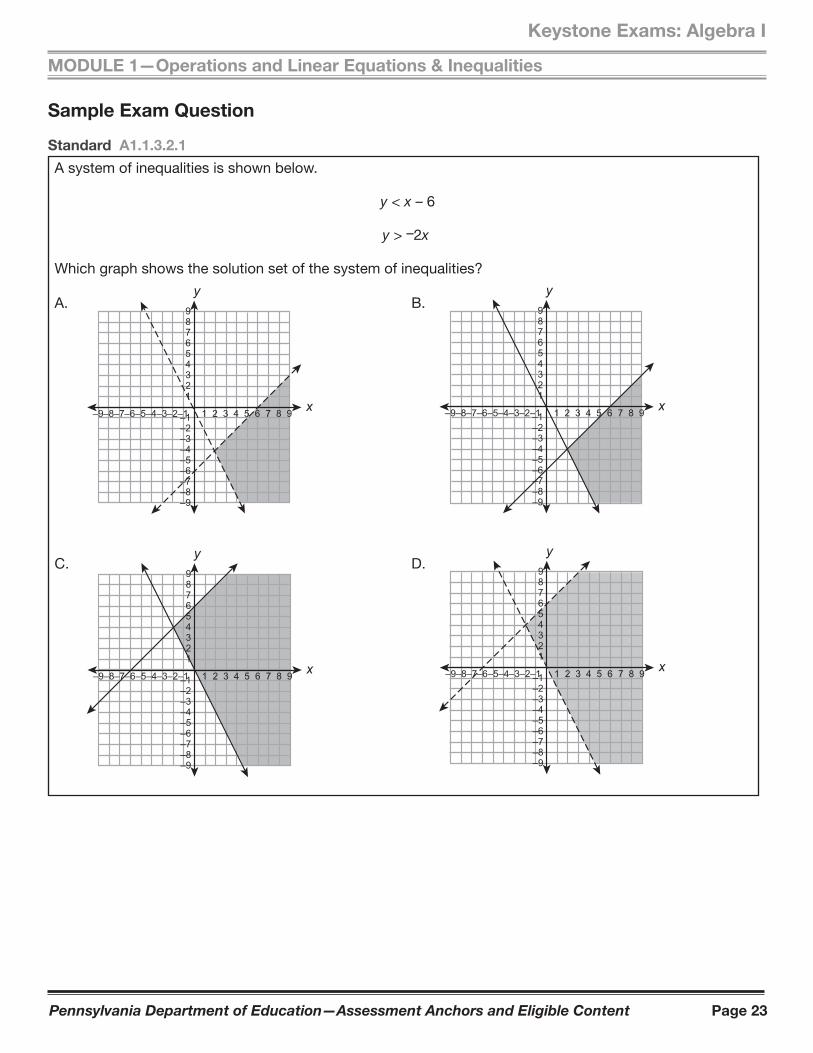
Standard A1.1.3.2.1
A system of inequalities is shown below.
y < x – 6
y > –2x
Which graph shows the solution set of the system of inequalities?
987654321
–1–2–3–4–5–6–7–8–9
1 2 3 4 5 6 7 8 9–9–8–7–6–5–4–3–2–1
y
x
987654321
–1–2–3–4–5–6–7–8–9
1 2 3 4 5 6 7 8 9–9–8–7–6–5–4–3–2–1
y
x
987654321
–1–2–3–4–5–6–7–8–9
1 2 3 4 5 6 7 8 9–9–8–7–6–5–4–3–2–1
y
x
987654321
–1–2–3–4–5–6–7–8–9
1 2 3 4 5 6 7 8 9–9–8–7–6–5–4–3–2–1
y
x
A. B.
C. D.

Pennsylvania Department of Education—Assessment Anchors and Eligible Content Page 24
MODULE 1—Operations and Linear Equations & Inequalities
Keystone Exams: Algebra I
Sample Exam Question
Standard A1.1.3.2.2
Tyreke always leaves a tip of between 8% and 20% for the server when he pays for his dinner. This can be represented by the system of inequalities shown below, where y is the amount of tip and x is the cost of dinner.
y > 0.08x
y < 0.2x
Which of the following is a true statement?
A. When the cost of dinner ( x) is $10, the amount of tip ( y) must be between $2 and $8.
B. When the cost of dinner ( x) is $15, the amount of tip ( y) must be between $1.20 and $3.00.
C. When the amount of tip ( y) is $3, the cost of dinner ( x) must be between $11 and $23.
D. When the amount of tip ( y) is $2.40, the cost of dinner ( x) must be between $3 and $6.
Pennsylvania Department of Education—Assessment Anchors and Eligible Content Page 25
Keystone Exams: Algebra I
MODULE 1—Operations and Linear Equations & Inequalities
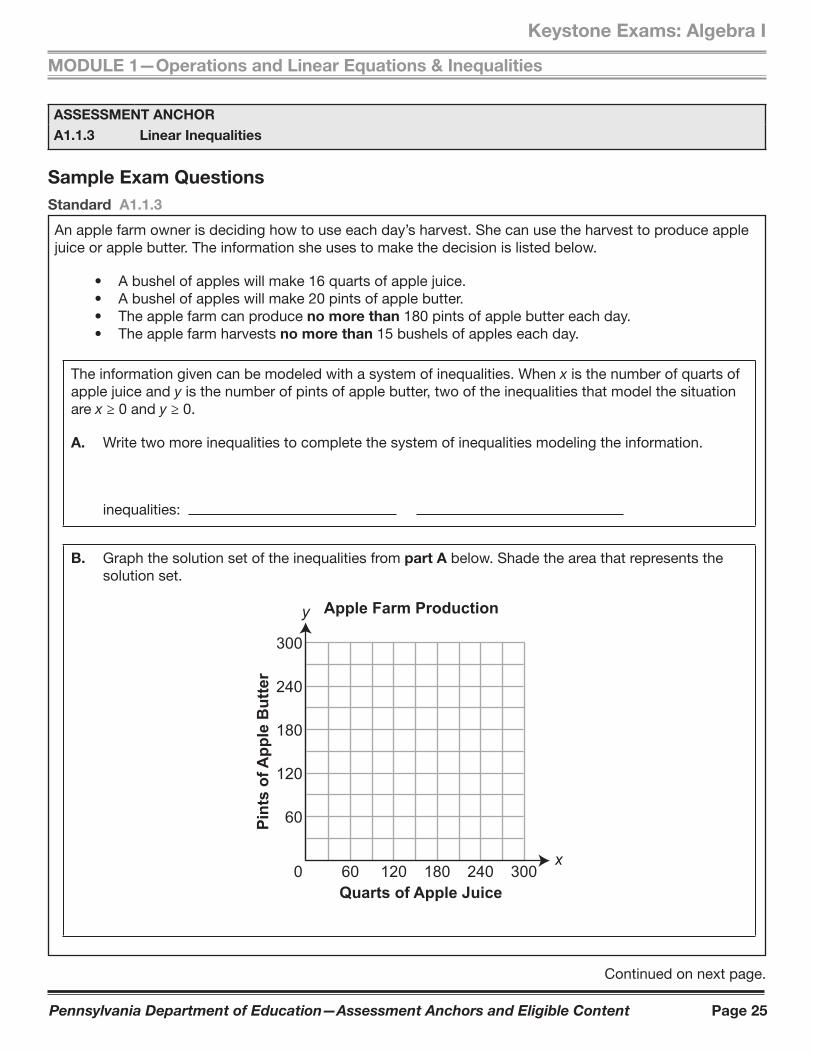
Standard A1.1.3
An apple farm owner is deciding how to use each day’s harvest. She can use the harvest to produce apple juice or apple butter. The information she uses to make the decision is listed below.
• A bushel of apples will make 16 quarts of apple juice. • A bushel of apples will make 20 pints of apple butter. • The apple farm can produce no more than 180 pints of apple butter each day. • The apple farm harvests no more than 15 bushels of apples each day.
The information given can be modeled with a system of inequalities. When x is the number of quarts of apple juice and y is the number of pints of apple butter, two of the inequalities that model the situation are x ≥ 0 and y ≥ 0.
A. Write two more inequalities to complete the system of inequalities modeling the information.
inequalities:
B. Graph the solution set of the inequalities from part A below. Shade the area that represents the solution set.
0Quarts of Apple Juice
Pint
s of
App
le B
utte
r
300
240
180
120
60
60 120 180 240 300
Apple Farm Production
x
y
Continued on next page.
ASSESSMENT ANCHOR
A1.1.3 Linear Inequalities
Sample Exam Questions

Pennsylvania Department of Education—Assessment Anchors and Eligible Content Page 26
MODULE 1—Operations and Linear Equations & Inequalities
Keystone Exams: Algebra I
Continued. Please refer to the previous page for task explanation.
The apple farm makes a profit of $2.25 on each pint of apple butter and $2.50 on each quart of apple juice.
C. Explain how you can be certain the maximum profit will be realized when the apple farm produces 96 quarts of apple juice and 180 pints of apple butter.
Pennsylvania Department of Education—Assessment Anchors and Eligible Content Page 27
Keystone Exams: Algebra I
MODULE 1—Operations and Linear Equations & Inequalities
Standard A1.1.3
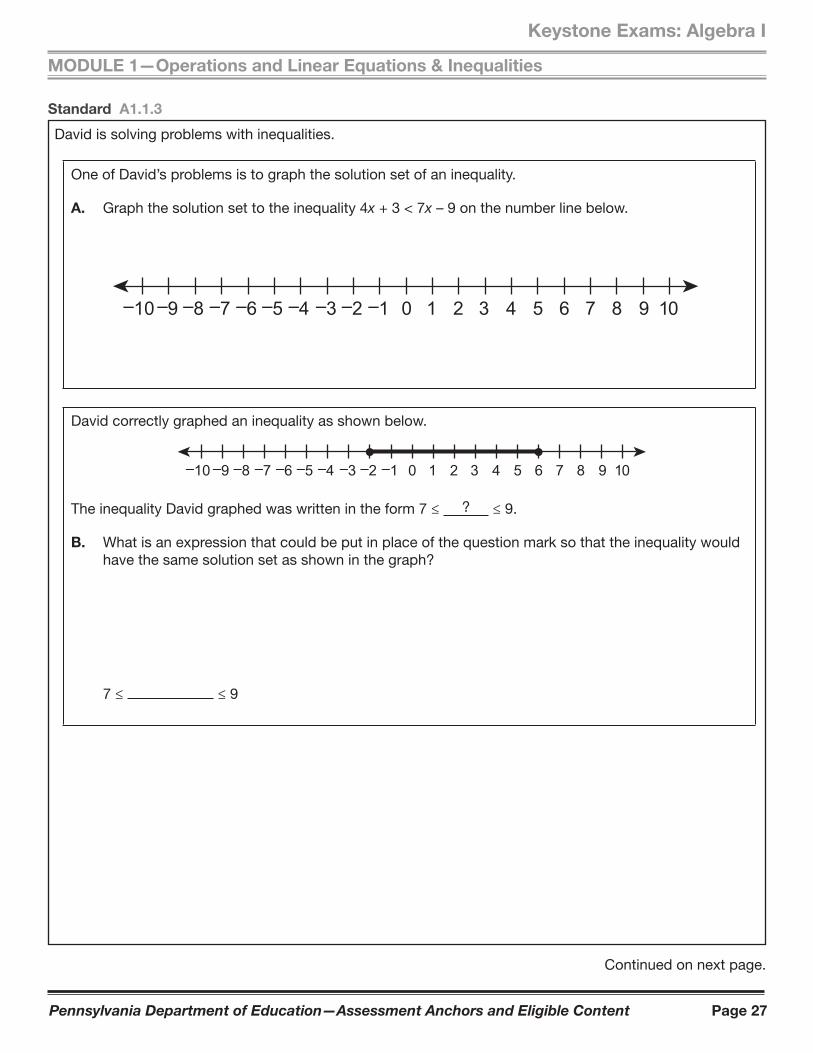
David is solving problems with inequalities.
One of David’s problems is to graph the solution set of an inequality.
A. Graph the solution set to the inequality 4x + 3 < 7x – 9 on the number line below.
–8–10 –9 –7 –6 104–5 7–2 –1 0 1 2 3 5 6 8 9–4 –3
David correctly graphed an inequality as shown below.
104 71 2 3 5 6 8 9–8–10 –9 –7 –6 –5 –2 –1 0–4 –3
The inequality David graphed was written in the form 7 ≤ ? ≤ 9.
B. What is an expression that could be put in place of the question mark so that the inequality would have the same solution set as shown in the graph?
7 ≤ ≤ 9
Continued on next page.

Pennsylvania Department of Education—Assessment Anchors and Eligible Content Page 28
MODULE 1—Operations and Linear Equations & Inequalities
Keystone Exams: Algebra I
Continued. Please refer to the previous page for task explanation.
The solution set to a system of linear inequalities is graphed below.
x
y
1 2 3 4 5–5 –4 –3 –2 –1
54321
–1–2–3–4–5
C. Write a system of two linear inequalities that would have the solution set shown in the graph.
linear inequality 1:
linear inequality 2:
Pennsylvania Department of Education—Assessment Anchors and Eligible Content Page 29
Keystone Exams: Algebra I
MODULE 2—Linear Functions and Data Organizations
ASSESSMENT ANCHOR
A1.2.1 Functions
Anchor Descriptor Eligible ContentPA Core
Standards
A1.2.1.1 Analyze and/or use patterns or relations.
A1.2.1.1.1 Analyze a set of data for the existence of a pattern and represent the pattern algebraically and/or graphically.
CC.2.2.8.C.1
CC.2.2.8.C.2
CC.2.2.HS.C.1
CC.2.2.HS.C.2
CC.2.2.HS.C.3
CC.2.4.HS.B.2
A1.2.1.1.2 Determine whether a relation is a function, given a set of points or a graph.
A1.2.1.1.3 Identify the domain or range of a relation (may be presented as ordered pairs, a graph, or a table).
Sample Exam Question
Standard A1.2.1.1.1
Tim’s scores the first 5 times he played a video game are listed below.
4,526 4,599 4,672 4,745 4,818
Tim’s scores follow a pattern. Which expression can be used to determine his score after he played the video game n times?
A. 73n + 4,453
B. 73(n + 4,453)
C. 4,453n + 73
D. 4,526n

Pennsylvania Department of Education—Assessment Anchors and Eligible Content Page 30
Keystone Exams: Algebra I
MODULE 2—Linear Functions and Data Organizations
Sample Exam Question
Standard A1.2.1.1.2
Which graph shows y as a function of x?
x
y
21 3 4–2–3–4
–4–3–2
1234
–1–1
x
y
21 3 4–2–3–4
–4–3–2
1234
–1–1
x
y
21 3 4–2–3–4
–4–3–2
1234
–1–1 x
y
21 3 4–2–3–4
–4–3–2
1234
–1–1
A. B.
C. D.
Pennsylvania Department of Education—Assessment Anchors and Eligible Content Page 31
Keystone Exams: Algebra I
MODULE 2—Linear Functions and Data Organizations
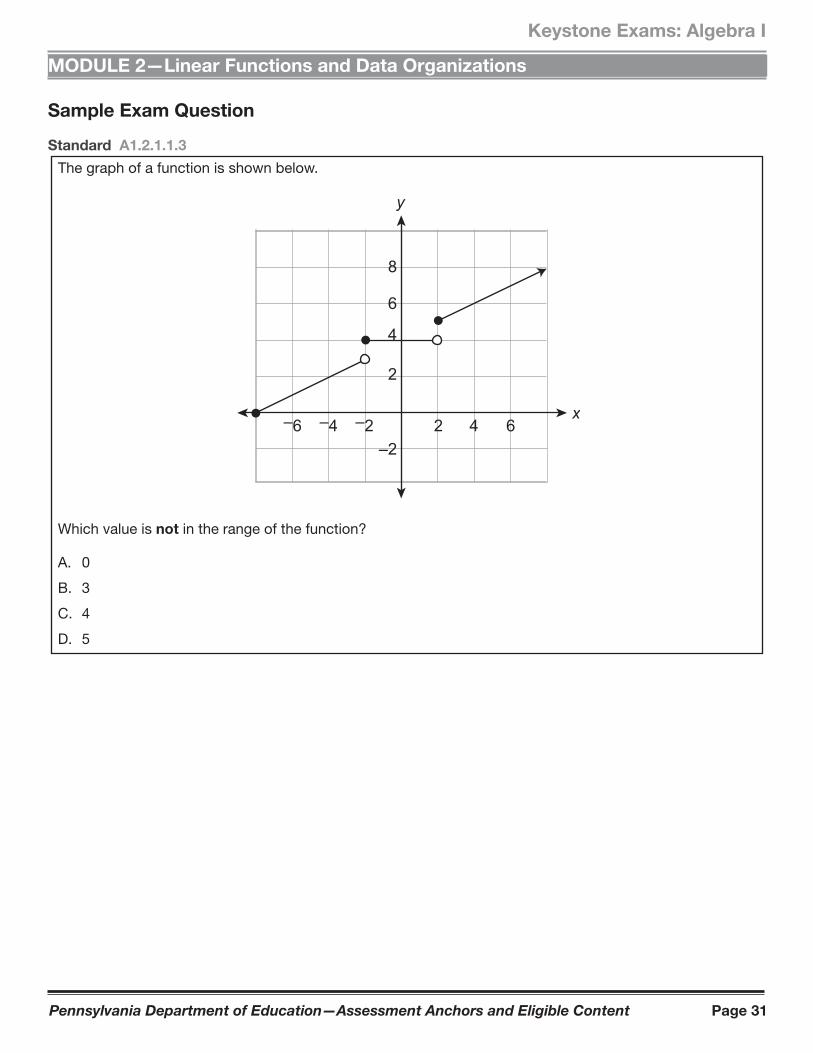
Sample Exam Question
Standard A1.2.1.1.3
The graph of a function is shown below.
x2 4 6–6 –4 –2
8
6
4
2
–2
y
Which value is not in the range of the function?
A. 0
B. 3
C. 4
D. 5

Pennsylvania Department of Education—Assessment Anchors and Eligible Content Page 32
Keystone Exams: Algebra I
MODULE 2—Linear Functions and Data Organizations
ASSESSMENT ANCHOR
A1.2.1 Functions
Anchor Descriptor Eligible ContentPA Core
Standards
A1.2.1.2 Interpret and/or use linear functions and their equations, graphs, or tables.
A1.2.1.2.1 Create, interpret, and/or use the equation, graph, or table of a linear function.
CC.2.1.HS.F.3
CC.2.1.HS.F.4
CC.2.2.8.B.2
CC.2.2.8.C.1
CC.2.2.8.C.2
CC.2.2.HS.C.2
CC.2.2.HS.C.3
CC.2.2.HS.C.4
CC.2.2.HS.C.6
CC.2.4.HS.B.2
A1.2.1.2.2 Translate from one representation of a linear function to another (i.e., graph, table, and equation).
Sample Exam Questions
Standard A1.2.1.2.1
A pizza restaurant charges for each pizza and adds a delivery fee. The cost (c), in dollars, to have any number of pizzas (p) delivered to a home is described by the function c = 8p + 3. Which statement is true?
A. The cost of 8 pizzas is $11.
B. The cost of 3 pizzas is $14.
C. Each pizza costs $8, and the delivery fee is $3.
D. Each pizza costs $3, and the delivery fee is $8.
Standard A1.2.1.2.2
The table below shows values of y as a function of x.
x y
2 10
6 25
14 55
26 100
34 130
Which linear equation describes the relationship between x and y?
A. y = 2.5x + 5
B. y = 3.75x + 2.5
C. y = 4x + 1
D. y = 5x
Pennsylvania Department of Education—Assessment Anchors and Eligible Content Page 33
Keystone Exams: Algebra I
MODULE 2—Linear Functions and Data Organizations
Standard A1.2.1
Hector’s family is on a car trip.
When they are 84 miles from home, Hector begins recording the distance they have driven (d ), in miles, after h hours as shown in the table below.
Distance from Home
Time
in Hours
(h)
Distance
in Miles
(d )
0 84
1 146
2 208
3 270
The pattern continues.
A. Write an equation to find the distance driven (d ), in miles, after a given number of hours ( h).
Continued on next page.
ASSESSMENT ANCHOR
A1.2.1 Functions
Sample Exam Questions

Pennsylvania Department of Education—Assessment Anchors and Eligible Content Page 34
Keystone Exams: Algebra I
MODULE 2—Linear Functions and Data Organizations
Continued. Please refer to the previous page for task explanation.
B. Hector also kept track of the remaining gasoline. The equation shown below can be used to find the gallons of gasoline remaining ( g) after driving a distance of d miles.
g = 16 – 1 } 20
d
Use the equation to find the missing values for gallons of gasoline remaining.
Gasoline Remaining by Mile
Distance
in Miles
(d )
Gallons of Gasoline
Remaining
( g)
100
200
300
C. Draw the graph of the line formed by the points in the table from part B.
g
d25 50 75 100 125 150 175 200 225 250 275 300
20
18
16
14
12
10
8
6
4
2
0
Gasoline Remaining by Mile
Ga
llo
ns o
f G
aso
lin
e R
em
ain
ing
Distance in Miles
Continued on next page.

Pennsylvania Department of Education—Assessment Anchors and Eligible Content Page 35
Keystone Exams: Algebra I
MODULE 2—Linear Functions and Data Organizations
Continued. Please refer to the previous page for task explanation.
D. Explain why the slope of the line drawn in part C must be negative.
Pennsylvania Department of Education—Assessment Anchors and Eligible Content Page 36
Keystone Exams: Algebra I
MODULE 2—Linear Functions and Data Organizations
Standard A1.2.1
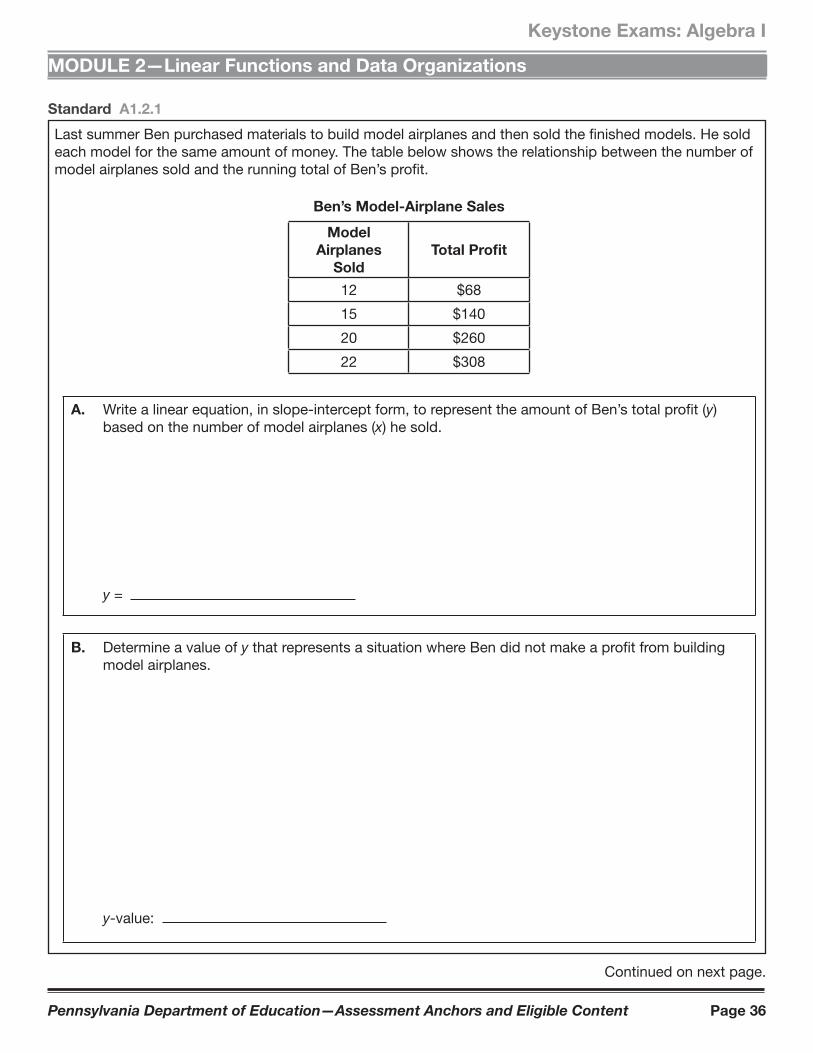
Last summer Ben purchased materials to build model airplanes and then sold the finished models. He sold each model for the same amount of money. The table below shows the relationship between the number of model airplanes sold and the running total of Ben’s profit.
Ben’s Model-Airplane Sales
Model
Airplanes
Sold
Total Profi t
12 $68
15 $140
20 $260
22 $308
A. Write a linear equation, in slope-intercept form, to represent the amount of Ben’s total profit (y) based on the number of model airplanes (x) he sold.
y =
B. Determine a value of y that represents a situation where Ben did not make a profit from building model airplanes.
y-value:
Continued on next page.

Pennsylvania Department of Education—Assessment Anchors and Eligible Content Page 37
Keystone Exams: Algebra I
MODULE 2—Linear Functions and Data Organizations
Continued. Please refer to the previous page for task explanation.
C. How much did Ben spend on the materials he needed to build his models?
$
D. What is the least number of model airplanes Ben needed to sell in order to make a profit?
least number:

Pennsylvania Department of Education—Assessment Anchors and Eligible Content Page 38
Keystone Exams: Algebra I
MODULE 2—Linear Functions and Data Organizations
ASSESSMENT ANCHOR
A1.2.2 Coordinate Geometry
Anchor Descriptor Eligible ContentPA Core
Standards
A1.2.2.1 Describe, compute, and/or use the rate of change (slope) of a line.
A1.2.2.1.1 Identify, describe, and/or use constant rates of change.
CC.2.2.8.C.2
CC.2.2.HS.C.1
CC.2.2.HS.C.2
CC.2.2.HS.C.3
CC.2.2.HS.C.5
CC.2.2.HS.C.6
CC.2.4.HS.B.1
A1.2.2.1.2 Apply the concept of linear rate of change (slope) to solve problems.
A1.2.2.1.3 Write or identify a linear equation when given • the graph of the line, • two points on the line, or • the slope and a point on the line.
Note: Linear equation may be in point-slope, standard, and/or slope-intercept form.
A1.2.2.1.4 Determine the slope and/or y-intercept represented by a linear equation or graph.
Sample Exam Questions
Standard A1.2.2.1.1
Jeff’s restaurant sells hamburgers. The amount charged for a hamburger ( h) is based on the cost for a plain hamburger plus an additional charge for each topping (t ) as shown in the equation below.
h = 0.60t + 5
What does the number 0.60 represent in the equation?
A. the number of toppings
B. the cost of a plain hamburger
C. the additional cost for each topping
D. the cost of a hamburger with 1 topping
Pennsylvania Department of Education—Assessment Anchors and Eligible Content Page 39
Keystone Exams: Algebra I
MODULE 2—Linear Functions and Data Organizations
Sample Exam Questions
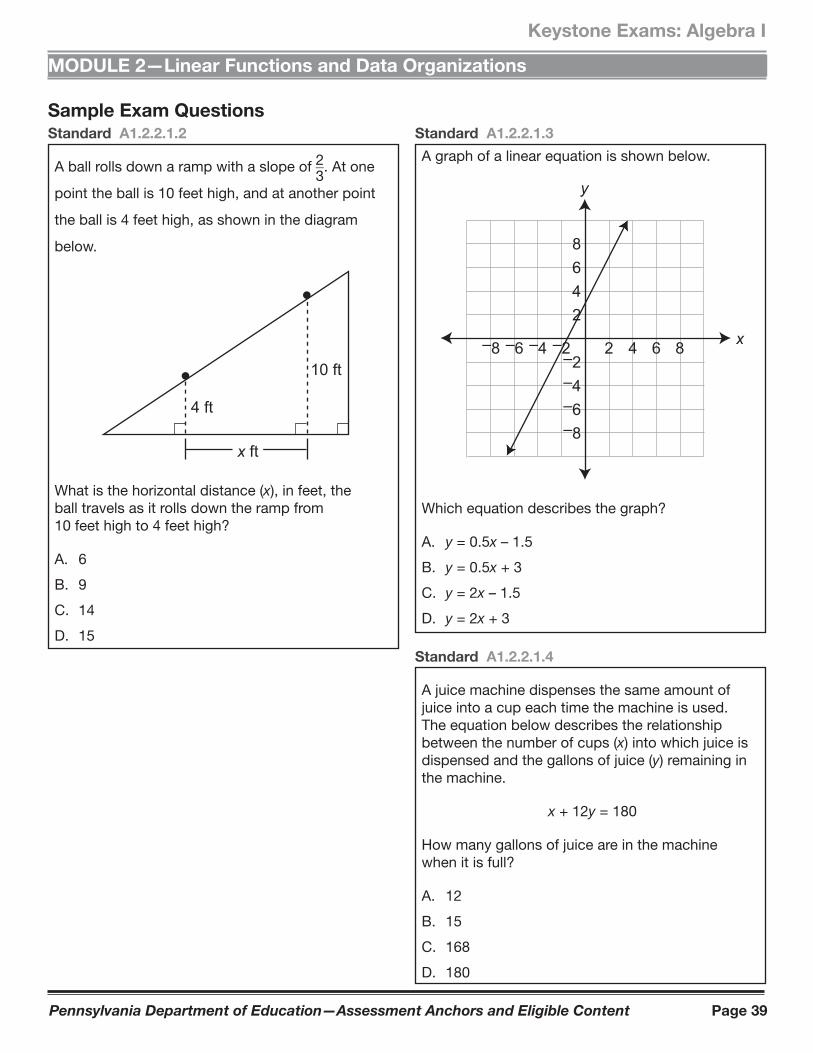
Standard A1.2.2.1.2
A ball rolls down a ramp with a slope of 2 } 3 . At one
point the ball is 10 feet high, and at another point
the ball is 4 feet high, as shown in the diagram
below.
x ft
4 ft
10 ft
What is the horizontal distance (x), in feet, the ball travels as it rolls down the ramp from 10 feet high to 4 feet high?
A. 6
B. 9
C. 14
D. 15
Standard A1.2.2.1.3
A graph of a linear equation is shown below.
x
y
8642
–2–4–6–8
2 4 6 8–8 –6 –4 –2
Which equation describes the graph?
A. y = 0.5x – 1.5
B. y = 0.5x + 3
C. y = 2x – 1.5
D. y = 2x + 3
Standard A1.2.2.1.4
A juice machine dispenses the same amount of juice into a cup each time the machine is used. The equation below describes the relationship between the number of cups (x) into which juice is dispensed and the gallons of juice (y) remaining in the machine.
x + 12y = 180
How many gallons of juice are in the machine when it is full?
A. 12
B. 15
C. 168
D. 180
Pennsylvania Department of Education—Assessment Anchors and Eligible Content Page 40
Keystone Exams: Algebra I
MODULE 2—Linear Functions and Data Organizations
ASSESSMENT ANCHOR
A1.2.2 Coordinate Geometry
Anchor Descriptor Eligible ContentPA Core
Standards
A1.2.2.2 Analyze and/or interpret data on a scatter plot.
A1.2.2.2.1 Draw, identify, fi nd, and/or write an equation for a line of best fi t for a scatter plot.
CC.2.2.HS.C.6
CC.2.4.8.B.1
CC.2.4.HS.B.2
CC.2.4.HS.B.3
Sample Exam Questions
Standard A1.2.2.2.1
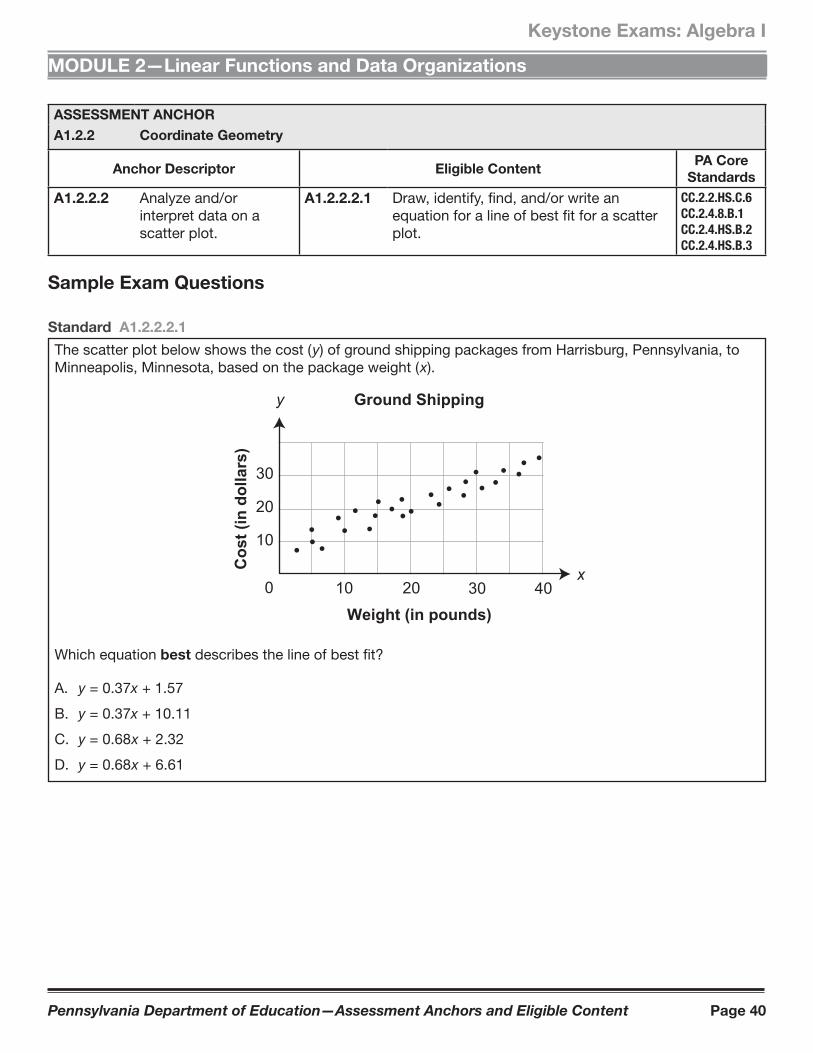
The scatter plot below shows the cost ( y) of ground shipping packages from Harrisburg, Pennsylvania, to Minneapolis, Minnesota, based on the package weight ( x).
x
y
Weight (in pounds)
Cos
t (in
dol
lars
)
10 20 30 40
Ground Shipping
0
30
20
10
Which equation best describes the line of best fit?
A. y = 0.37x + 1.57
B. y = 0.37x + 10.11
C. y = 0.68 x + 2.32
D. y = 0.68 x + 6.61

Pennsylvania Department of Education—Assessment Anchors and Eligible Content Page 41
Keystone Exams: Algebra I
MODULE 2—Linear Functions and Data Organizations
Standard A1.2.2
Georgia is purchasing treats for her classmates. Georgia can spend exactly $10.00 to purchase 25 fruit bars, each equal in price. Georgia can also spend exactly $10.00 to purchase 40 granola bars, each equal in price.
A. Write an equation that can be used to find all combinations of fruit bars ( x) and granola bars ( y) that will cost exactly $10.00.
equation:
B. Graph the equation from part A below.
Fruit Bars0
Gra
nola
Bar
s
50
40
30
20
10
10 20 30 40 50
Purchasing Treats
x
y
Continued on next page.
ASSESSMENT ANCHOR
A1.2.2 Coordinate Geometry
Sample Exam Questions

Pennsylvania Department of Education—Assessment Anchors and Eligible Content Page 42
Keystone Exams: Algebra I
MODULE 2—Linear Functions and Data Organizations
Continued. Please refer to the previous page for task explanation.
C. What is the slope of the line graphed in part B?
slope:
D. Explain what the slope from part C means in the context of Georgia purchasing treats.
Pennsylvania Department of Education—Assessment Anchors and Eligible Content Page 43
Keystone Exams: Algebra I
MODULE 2—Linear Functions and Data Organizations
Standard A1.2.2
Ahava is traveling on a train.
The train is going at a constant speed of 80 miles per hour.
A. How many hours will it take for the train to travel 1,120 miles?
hours:
Ahava also considered taking an airplane. The airplane can travel the same 1,120 miles in 12 hours less time than it takes the train.
B. What is the speed of the airplane in miles per hour (mph)?
speed of the airplane: mph
Continued on next page.

Pennsylvania Department of Education—Assessment Anchors and Eligible Content Page 44
Keystone Exams: Algebra I
MODULE 2—Linear Functions and Data Organizations
Continued. Please refer to the previous page for task explanation.
Ahava is very concerned about the environment. The graph below displays the carbon dioxide (CO2), in metric tons, for each traveler on an airplane and each traveler on a train.
0Miles Traveled
Met
ric T
ons
of C
O2
x
y
0.40
0.32
0.24
0.16
0.08
200 400 600 800 1000
Carbon Footprint
KeyTraveler on anairplaneTraveler on atrain
C. What equation could be used to find the metric tons of CO2 produced (y) by a traveler on an airplane for x miles traveled?
equation:
Continued on next page.

Pennsylvania Department of Education—Assessment Anchors and Eligible Content Page 45
Keystone Exams: Algebra I
MODULE 2—Linear Functions and Data Organizations
Continued. Please refer to the previous page for task explanation.
On another trip, Ahava traveled to her destination on a train and returned home on an airplane. Her total carbon footprint for the trip was 0.42 metric tons of CO2 produced.
D. How far, in miles, is Ahava’s destination from her home?
miles:
Pennsylvania Department of Education—Assessment Anchors and Eligible Content Page 46
Keystone Exams: Algebra I
MODULE 2—Linear Functions and Data Organizations
ASSESSMENT ANCHOR
A1.2.3 Data Analysis
Anchor Descriptor Eligible ContentPA Core
Standards
A1.2.3.1 Use measures of dispersion to describe a set of data.
A1.2.3.1.1 Calculate and/or interpret the range, quartiles, and interquartile range of data.
CC.2.4.HS.B.1
CC.2.4.HS.B.3
Sample Exam Question
Standard A1.2.3.1.1
The daily high temperatures, in degrees Fahrenheit (°F), of a town are recorded for one year. The median high temperature is 62°F. The interquartile range of high temperatures is 32. Which statement is most likely true?
A. Approximately 25% of the days had a high temperature less than 30°F.
B. Approximately 25% of the days had a high temperature greater than 62°F.
C. Approximately 50% of the days had a high temperature greater than 62°F.
D. Approximately 75% of the days had a high temperature less than 94°F.

Pennsylvania Department of Education—Assessment Anchors and Eligible Content Page 47
Keystone Exams: Algebra I
MODULE 2—Linear Functions and Data Organizations
ASSESSMENT ANCHOR
A1.2.3 Data Analysis
Anchor Descriptor Eligible ContentPA Core
Standards
A1.2.3.2 Use data displays in problem-solving settings and/or to make predictions.
A1.2.3.2.1 Estimate or calculate to make predictions based on a circle, line, bar graph, measure of central tendency, or other representation.
CC.2.4.HS.B.1
CC.2.4.HS.B.3
CC.2.4.HS.B.5
A1.2.3.2.2 Analyze data, make predictions, and/or answer questions based on displayed data (box-and-whisker plots, stem-and-leaf plots, scatter plots, measures of central tendency, or other representations).
A1.2.3.2.3 Make predictions using the equations or graphs of best-fi t lines of scatter plots.
Sample Exam Questions
Standard A1.2.3.2.1
Vy asked 200 students to select their favorite sport and then recorded the results in the bar graph below.
Favorite Sport
Sports
Vote
s
8070605040302010
0football basketball baseball hockey volleyball track
and field
Vy will ask another 80 students to select their favorite sport. Based on the information in the bar graph, how many more students of the next 80 asked are likely to select basketball rather than football as their favorite sport?
A. 10
B. 20
C. 25
D. 30

Pennsylvania Department of Education—Assessment Anchors and Eligible Content Page 48
Keystone Exams: Algebra I
MODULE 2—Linear Functions and Data Organizations
Sample Exam Questions
Standard A1.2.3.2.2
The points scored by a football team are shown in the stem-and-leaf plot below.
Football-Team Points
0123
6 2 3 4 7 0 3 4 4 7 8 8 80 7 8
Key1 | 3 = 13 points
What was the median number of points scored by the football team?
A. 24
B. 27
C. 28
D. 32
Pennsylvania Department of Education—Assessment Anchors and Eligible Content Page 49
Keystone Exams: Algebra I
MODULE 2—Linear Functions and Data Organizations
Sample Exam Questions
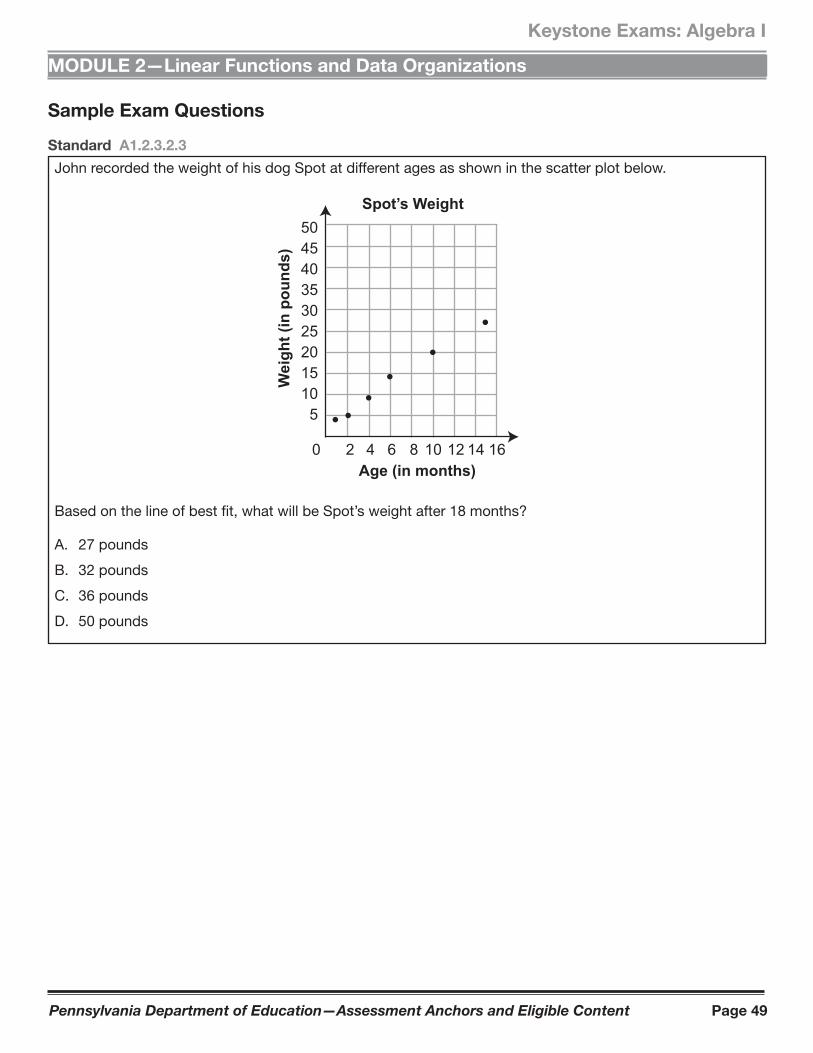
Standard A1.2.3.2.3
John recorded the weight of his dog Spot at different ages as shown in the scatter plot below.
Spot’s Weight
Age (in months)
Wei
ght (
in p
ound
s)
504540353025201510
5
20 4 6 8 1210 14 16
Based on the line of best fit, what will be Spot’s weight after 18 months?
A. 27 pounds
B. 32 pounds
C. 36 pounds
D. 50 pounds

Pennsylvania Department of Education—Assessment Anchors and Eligible Content Page 50
Keystone Exams: Algebra I
MODULE 2—Linear Functions and Data Organizations
ASSESSMENT ANCHOR
A1.2.3 Data Analysis
Anchor Descriptor Eligible ContentPA Core
Standards
A1.2.3.3 Apply probability to practical situations.
A1.2.3.3.1 Find probabilities for compound events (e.g., fi nd probability of red and blue, fi nd probability of red or blue) and represent as a fraction, decimal, or percent.
CC.2.4.7.B.3
CC.2.4.HS.B.4
CC.2.4.HS.B.7
Sample Exam Questions
Standard A1.2.3.3.1
A number cube with sides labeled 1 through 6 is rolled two times, and the sum of the numbers that end face up is calculated. What is the probability that the sum of the numbers is 3?
A. 1 } 18
B. 1 } 12
C. 1 } 9
D. 1 } 2

Pennsylvania Department of Education—Assessment Anchors and Eligible Content Page 51
Keystone Exams: Algebra I
MODULE 2—Linear Functions and Data Organizations
Standard A1.2.3
The box-and-whisker plot shown below represents students’ test scores on Mr. Ali’s history test.
52 60 68 76 84 92 100
History-Test Scores
A. What is the range of scores for the history test?
range:
B. What is the best estimate for the percent of students scoring greater than 92 on the test?
percent: %
Continued on next page.
ASSESSMENT ANCHOR
A1.2.3 Data Analysis
Sample Exam Questions

Pennsylvania Department of Education—Assessment Anchors and Eligible Content Page 52
Keystone Exams: Algebra I
MODULE 2—Linear Functions and Data Organizations
Continued. Please refer to the previous page for task explanation.
Mr. Ali wanted more than half of the students to score 75 or greater on the test.
C. Explain how you know that more than half of the students did not score greater than 75.
Michael is a student in Mr. Ali’s class. The scatter plot below shows Michael’s test scores for each test given by Mr. Ali.
0Test Number
Te
st
Sc
ore
100908070605040302010
1 2 3 4 5 6 7 8
Michael’s Test Scores
D. Draw a line of best fit on the scatter plot above.

Pennsylvania Department of Education—Assessment Anchors and Eligible Content Page 53
Keystone Exams: Algebra I
MODULE 2—Linear Functions and Data Organizations
Standard A1.2.3
The weight, in pounds, of each wrestler on the high school wrestling team at the beginning of the season is listed below.
178 142 112 150 206 130
A. What is the median weight of the wrestlers?
median: pounds
B. What is the mean weight of the wrestlers?
mean: pounds
Continued on next page.

Pennsylvania Department of Education—Assessment Anchors and Eligible Content Page 54
Keystone Exams: Algebra I
MODULE 2—Linear Functions and Data Organizations
Continued. Please refer to the previous page for task explanation.
Two more wrestlers join the team during the season. The addition of these wrestlers has no effect on the mean weight of the wrestlers, but the median weight of the wrestlers increases 3 pounds.
C. Determine the weights of the two new wrestlers.
new wrestlers: pounds and pounds

Pennsylvania Department of Education—Assessment Anchors and Eligible Content Page 55
KEYSTONE ALGEBRA I ASSESSMENT ANCHORS
KEY TO SAMPLE MULTIPLE-CHOICE ITEMS
Algebra I
Eligible Content Key
A1.1.1.1.1 C
A1.1.1.1.2 (top) B
A1.1.1.1.2 (bottom) C
A1.1.1.2.1 D
A1.1.1.3.1 A
A1.1.1.4.1 A
A1.1.1.5.1 C
A1.1.1.5.2 C
A1.1.1.5.3 D
Eligible Content Key
A1.1.2.1.1 D
A1.1.2.1.2 D
A1.1.2.1.3 B
A1.1.2.2.1 B
A1.1.2.2.2 A
Eligible Content Key
A1.1.3.1.1 B
A1.1.3.1.2 D
A1.1.3.1.3 D
A1.1.3.2.1 A
A1.1.3.2.2 B
Eligible Content Key
A1.2.1.1.1 A
A1.2.1.1.2 B
A1.2.1.1.3 B
A1.2.1.2.1 C
A1.2.1.2.2 B
Eligible Content Key
A1.2.2.1.1 C
A1.2.2.1.2 B
A1.2.2.1.3 D
A1.2.2.1.4 B
A1.2.2.2.1 D
Eligible Content Key
A1.2.3.1.1 C
A1.2.3.2.1 A
A1.2.3.2.2 A
A1.2.3.2.3 B
A1.2.3.3.1 A


Ke
yst
on
e E
xa
ms:
Alg
eb
ra
Glo
ssar
y t
o t
he
A
sses
smen
t A
nch
or
& E
ligi
ble
Co
nte
nt
The
Key
sto
ne
Glo
ssar
y in
clu
des
te
rms
and
de
fin
itio
ns
asso
ciat
ed
wit
h t
he
Ke
ysto
ne
Ass
essm
en
t A
nch
ors
an
d
Elig
ible
Co
nte
nt.
Th
e te
rms
and
de
fin
itio
ns
incl
ud
ed
in
th
e g
loss
ary
are
in
ten
ded
to
ass
ist
Pe
nn
sylv
ania
ed
uca
tors
in
bet
ter
un
der
stan
din
g th
e K
eys
ton
e A
sse
ssm
en
t A
nch
ors
an
d E
ligib
le C
on
ten
t. T
he
glo
ssar
y d
oes
n
ot
def
ine
all
po
ssib
le t
erm
s in
clu
de
d o
n a
n a
ctu
al K
eys
ton
e E
xam
, an
d i
t is
no
t in
ten
ded
to
def
ine
term
s fo
r u
se in
cla
ssro
om
inst
ruct
ion
fo
r a
par
ticu
lar
grad
e le
vel o
r co
urs
e.
Pen
nsy
lva
nia
Dep
art
men
t o
f E
du
cati
on
ww
w.e
du
cati
on
.sta
te.p
a.u
s A
pri
l 20
14

K
ey
sto
ne
Ex
am
s: A
lge
bra
Ass
ess
me
nt
An
cho
r &
Eli
gib
le C
on
ten
t G
loss
ary
A
pri
l 2
01
4
Pen
nsy
lva
nia
Dep
art
men
t o
f E
du
cati
on
Pag
e 2
A
pri
l 20
14
Ab
so
lute
Va
lue
A
nu
mb
er’s d
ista
nce
fro
m z
ero
on
th
e n
um
be
r lin
e.
It is w
ritt
en
|a
| a
nd
is r
ead
“th
e a
bso
lute
va
lue
of
a.”
It
resu
lts in
a n
um
be
r gre
ate
r th
an
or
equ
al to
ze
ro (
e.g
., |4
| =
4 a
nd
|–4
| =
4).
Exa
mp
le o
f a
bso
lute
va
lue
s o
f –4
and
4 o
n a
nu
mb
er
line
:
Ad
dit
ive
In
ve
rse
T
he
op
po
site
of
a n
um
be
r (i.e
., fo
r an
y n
um
be
r a
, th
e a
dd
itiv
e in
ve
rse
is –
a).
An
y n
um
be
r an
d its
a
dd
itiv
e in
ve
rse w
ill h
ave
a s
um
of
ze
ro (
e.g
., –
4 is th
e a
dd
itiv
e inve
rse o
f 4
sin
ce
4 +
–4 =
0;
like
wis
e,
the
ad
ditiv
e in
ve
rse o
f –4
is 4
sin
ce
–4
+ 4
= 0
).
Ari
thm
eti
c S
eq
uen
ce
A
n o
rde
red
lis
t of
nu
mb
ers
tha
t in
cre
ase
s o
r d
ecre
ase
s a
t a
co
nsta
nt
rate
(i.e.,
th
e d
iffe
ren
ce
be
twe
en
n
um
be
rs r
em
ain
s t
he
sa
me
). E
xa
mp
le:
1,
7, 13
, 19
, …
is a
n a
rith
me
tic s
equ
en
ce
as it h
as a
co
nsta
nt
diffe
ren
ce
of
+6
(i.e., 6
is a
dde
d o
ve
r an
d o
ver)
.

K
ey
sto
ne
Ex
am
s: A
lge
bra
Ass
ess
me
nt
An
cho
r &
Eli
gib
le C
on
ten
t G
loss
ary
A
pri
l 2
01
4
Pen
nsy
lva
nia
Dep
art
men
t o
f E
du
cati
on
Pag
e 3
A
pri
l 20
14
As
ym
pto
te
A s
traig
ht
line
to
wh
ich
th
e c
urv
e o
f a
gra
ph
co
me
s c
lose
r an
d c
loser.
The
dis
tan
ce
betw
ee
n t
he
cu
rve
an
d th
e a
sym
pto
te a
ppro
ach
es z
ero
as t
he
y t
en
d to
infin
ity.
The
asym
pto
te is d
en
ote
d b
y a
da
she
d
line
on a
gra
ph.
The m
ost
co
mm
on
asym
pto
tes a
re h
orizo
nta
l an
d v
ert
ical. E
xa
mp
le o
f a
ho
rizo
nta
l a
sym
pto
te:
Ba
r G
rap
h
A g
rap
h th
at
sh
ow
s a
se
t of fr
equ
en
cie
s u
sin
g b
ars
of
equ
al w
idth
, bu
t he
igh
ts t
ha
t a
re p
rop
ort
iona
l to
th
e f
reque
ncie
s. It
is u
se
d to
su
mm
ari
ze
dis
cre
te d
ata
. E
xa
mp
le o
f a
ba
r gra
ph
:

K
ey
sto
ne
Ex
am
s: A
lge
bra
Ass
ess
me
nt
An
cho
r &
Eli
gib
le C
on
ten
t G
loss
ary
A
pri
l 2
01
4
Pen
nsy
lva
nia
Dep
art
men
t o
f E
du
cati
on
Pag
e 4
A
pri
l 20
14
Bin
om
ial
A p
oly
no
mia
l w
ith
tw
o u
nlik
e te
rms (
e.g
., 3
x +
4y o
r a
3 –
4b
2).
Ea
ch
te
rm is a
mo
no
mia
l, a
nd
the
mo
no
mia
ls a
re jo
ine
d b
y a
n a
dd
itio
n s
ym
bo
l (+
) or
a s
ub
tractio
n s
ym
bo
l (–
). I
t is
co
nsid
ere
d a
n
alg
eb
raic
exp
ressio
n.
Bo
x-a
nd
-Wh
iske
r P
lot
A g
rap
hic
me
tho
d fo
r sh
ow
ing a
su
mm
ary
an
d d
istr
ibu
tio
n o
f da
ta u
sin
g m
ed
ian
, qu
art
iles, a
nd
extr
em
es (
i.e
., m
inim
um
an
d m
axim
um
) of
data
. T
his
sh
ow
s h
ow
fa
r ap
art
an
d h
ow
eve
nly
da
ta is
dis
trib
ute
d.
It is h
elp
ful w
he
n a
vis
ua
l is
ne
ed
ed
to
se
e if
a d
istr
ibu
tion
is s
ke
we
d o
r if th
ere
are
an
y
ou
tlie
rs.
Exa
mp
le o
f a b
ox-a
nd
-wh
isker
plo
t:
Cir
cle
Gra
ph
(o
r P
ie C
hart
) A
circula
r dia
gra
m u
sin
g d
iffe
ren
t-siz
ed
se
cto
rs o
f a c
ircle
wh
ose
an
gle
s a
t th
e c
en
ter
are
pro
po
rtio
na
l to
the
fre
qu
en
cy.
Se
cto
rs c
an
be
vis
ua
lly c
om
pa
red
to
sho
w in
form
atio
n (
e.g
., s
tatistica
l da
ta).
Se
cto
rs
rese
mb
le s
lice
s o
f a
pie
. E
xa
mp
le o
f a
circle
gra
ph
:

K
ey
sto
ne
Ex
am
s: A
lge
bra
Ass
ess
me
nt
An
cho
r &
Eli
gib
le C
on
ten
t G
loss
ary
A
pri
l 2
01
4
Pen
nsy
lva
nia
Dep
art
men
t o
f E
du
cati
on
Pag
e 5
A
pri
l 20
14
Co
eff
icie
nt
The
nu
mb
er,
usu
ally
a c
on
sta
nt,
th
at
is m
ultip
lied
by a
va
ria
ble
in a
te
rm (
e.g
., 3
5 is t
he
co
eff
icie
nt of
35
x2y);
the
ab
sen
ce
of a
co
eff
icie
nt is
th
e s
am
e a
s a
1 b
ein
g p
rese
nt (e
.g.,
x is t
he s
am
e a
s 1
x).
Co
mb
ina
tio
n
An
un
ord
ere
d a
rra
nge
me
nt,
lis
tin
g o
r sele
ction
of
ob
jects
(e.g
., t
wo
-le
tte
r com
bin
ation
s o
f th
e th
ree
le
tte
rs X
, Y
, a
nd Z
wo
uld
be
XY
, X
Z,
an
d Y
Z; X
Y is t
he
sa
me
as Y
X a
nd
is n
ot co
un
ted
as a
diffe
ren
t co
mb
ina
tio
n).
A c
om
bin
ation
is s
imila
r to
, b
ut n
ot
the
sa
me
as,
a p
erm
uta
tio
n.
Co
mm
on
Lo
ga
rith
m
A loga
rith
m w
ith
ba
se
10
. It is w
ritt
en
log x
. T
he
co
mm
on
lo
ga
rith
m is t
he
po
we
r o
f 10
ne
cessa
ry t
o
equ
al a
giv
en
nu
mb
er
(i.e
., log x
= y
is e
qu
ivale
nt
to 1
0y =
x).
Co
mp
lex
Nu
mb
er
The
su
m o
r diffe
ren
ce
of
a r
ea
l nu
mb
er
an
d a
n im
agin
ary
nu
mb
er.
It
is w
ritt
en
in th
e fo
rm a
+ b
i,
wh
ere
a a
nd
b a
re r
ea
l n
um
be
rs a
nd i
is th
e im
agin
ary
un
it (
i.e
., i
=
1
). T
he
a is c
alle
d t
he r
ea
l p
art
,
an
d th
e b
i is
ca
lled
th
e im
agin
ary
pa
rt.
Co
mp
osit
e N
um
be
r A
ny n
atu
ral n
um
be
r w
ith
mo
re t
ha
n t
wo
fa
cto
rs (
e.g
., 6
is a
co
mp
osite
nu
mb
er
sin
ce
it h
as fo
ur
facto
rs: 1
, 2,
3,
and
6).
A c
om
po
site
nu
mb
er
is n
ot a
prim
e n
um
be
r.
Co
mp
ou
nd
(o
r C
om
bin
ed
) E
ve
nt
An
eve
nt th
at
is m
ad
e u
p o
f tw
o o
r m
ore
sim
ple
even
ts,
su
ch
as t
he
flip
pin
g o
f tw
o o
r m
ore
co
ins.
Co
mp
ou
nd
In
eq
ua
lity
W
hen t
wo
or
mo
re ine
qu
alit
ies a
re ta
ke
n t
oge
the
r a
nd w
ritt
en
with
th
e ine
qu
alit
ies c
on
ne
cte
d b
y t
he
w
ord
s a
nd
or
or
(e.g
., x
> 6
and
x <
12
, w
hic
h c
an a
lso b
e w
ritt
en
as 6
< x
< 1
2).

K
ey
sto
ne
Ex
am
s: A
lge
bra
Ass
ess
me
nt
An
cho
r &
Eli
gib
le C
on
ten
t G
loss
ary
A
pri
l 2
01
4
Pen
nsy
lva
nia
Dep
art
men
t o
f E
du
cati
on
Pag
e 6
A
pri
l 20
14
Co
ns
tan
t A
te
rm o
r exp
ressio
n w
ith
no v
aria
ble
in it. It
ha
s t
he
sa
me
va
lue a
ll th
e t
ime
.
Co
ord
ina
te P
lan
e
A p
lane
fo
rme
d b
y p
erp
end
icula
r nu
mb
er
line
s.
The
ho
rizo
nta
l nu
mb
er
line
is t
he
x-a
xis
, a
nd
the
ve
rtic
al n
um
be
r lin
e is th
e y
-axis
. T
he
po
int
wh
ere
th
e a
xe
s m
ee
t is
ca
lled
th
e o
rigin
. E
xa
mp
le o
f a
co
ord
inate
pla
ne
:
K
ey
sto
ne
Ex
am
s: A
lge
bra
Ass
ess
me
nt
An
cho
r &
Eli
gib
le C
on
ten
t G
loss
ary
A
pri
l 2
01
4
Pen
nsy
lva
nia
Dep
art
men
t o
f E
du
cati
on
Pag
e 7
A
pri
l 20
14
Cu
be
Ro
ot
On
e o
f th
ree
equ
al fa
cto
rs (
roo
ts)
of
a n
um
be
r or
exp
ressio
n; a
rad
ica
l e
xp
ressio
n w
ith
a d
egre
e o
f 3
(e.g
.,
3a
). T
he
cu
be r
oo
t of
a n
um
be
r or
exp
ressio
n h
as t
he
sa
me
sig
n a
s t
he
nu
mb
er
or
exp
ressio
n
un
de
r th
e r
ad
ical (e
.g.,
3
_6
343
x =
–(7
x2)
an
d
36
343
x =
7x
2).
Cu
rve
of
Bes
t F
it (
for
a
Sc
att
er
Plo
t)
Se
e lin
e o
r curv
e o
f b
est fit
(fo
r a s
ca
tte
r plo
t).
De
gre
e (
of
a P
oly
no
mia
l)
The
va
lue
of
the
gre
ate
st
exp
one
nt in
a p
oly
no
mia
l.
De
pe
nd
en
t E
ve
nts
T
wo
or
mo
re e
ve
nts
in
wh
ich t
he
outc
om
e o
f o
ne
eve
nt
aff
ects
or
influ
en
ce
s t
he o
utc
om
e o
f th
e o
the
r e
ve
nt(
s).
De
pe
nd
en
t V
ari
ab
le
The
ou
tpu
t nu
mb
er
or
va
ria
ble
in a
rela
tio
n o
r fu
nctio
n th
at d
ep
end
s u
pon
ano
the
r variab
le, ca
lled
th
e
ind
epe
nde
nt va
ria
ble
, o
r in
pu
t n
um
be
r (e
.g.,
in
the
equ
atio
n y
= 2
x +
4,
y is th
e d
ep
end
ent va
ria
ble
sin
ce
its
va
lue
de
pe
nds o
n th
e v
alu
e o
f x).
It
is t
he
va
ria
ble
fo
r w
hic
h a
n e
qu
atio
n is s
olv
ed
. It
s v
alu
es
ma
ke
up
the
ran
ge
of
the
rela
tio
n o
r fu
nctio
n.
Do
main
(o
f a
Rela
tio
n o
r F
un
cti
on
) T
he
se
t of
all
po
ssib
le v
alu
es o
f th
e ind
epe
nde
nt
va
ria
ble
on
wh
ich a
fu
nctio
n o
r re
lation is a
llow
ed
to
o
pe
rate
. A
lso,
the
first n
um
be
rs in
th
e o
rde
red
pa
irs o
f a
re
lation
; th
e v
alu
es o
f th
e x
-co
ord
ina
tes in
(x
, y).
Eli
min
ati
on
Me
tho
d
Se
e lin
ea
r com
bin
ation
.

K
ey
sto
ne
Ex
am
s: A
lge
bra
Ass
ess
me
nt
An
cho
r &
Eli
gib
le C
on
ten
t G
loss
ary
A
pri
l 2
01
4
Pen
nsy
lva
nia
Dep
art
men
t o
f E
du
cati
on
Pag
e 8
A
pri
l 20
14
Eq
ua
tio
n
A m
ath
em
atica
l sta
tem
en
t o
r sen
ten
ce
tha
t says o
ne
ma
the
ma
tica
l e
xp
ressio
n o
r qu
an
tity
is e
qu
al to
a
no
the
r (e
.g.,
x +
5 =
y –
7).
An
equ
atio
n w
ill a
lwa
ys c
on
tain
an
equ
al sig
n (
=).
Es
tim
ati
on
Str
ate
gy
An
ap
pro
xim
atio
n b
ased
on a
ju
dgm
en
t; m
ay in
clu
de d
ete
rmin
ing a
pp
roxim
ate
va
lue
s, e
sta
blis
hin
g
the
rea
so
na
ble
ne
ss o
f a
nsw
ers
, a
sse
ssin
g t
he
am
ou
nt of
err
or
resu
ltin
g f
rom
estim
atio
n,
an
d/o
r d
ete
rmin
ing if
an
err
or
is w
ith
in a
cce
pta
ble
lim
its.
Ex
po
nen
t T
he
po
we
r to
wh
ich a
nu
mb
er
or
exp
ressio
n is r
ais
ed
. W
hen
th
e e
xpo
nen
t is
a f
raction
, th
e n
um
be
r or
exp
ressio
n c
an b
e r
ew
ritt
en
with
a r
ad
ical sig
n (
e.g
., x
3/4
=
43
x).
Se
e a
lso
po
sitiv
e e
xpo
ne
nt a
nd
ne
ga
tive
exp
on
ent.
Ex
po
nen
tia
l E
qu
ati
on
A
n e
qu
atio
n w
ith
va
ria
ble
s in its
exp
on
en
ts (
e.g
., 4
x =
50
). It
can
be
so
lved
by t
akin
g loga
rith
ms o
f b
oth
sid
es.
Ex
po
nen
tia
l E
xp
res
sio
n
An
exp
ressio
n in
wh
ich
th
e v
aria
ble
occu
rs in
th
e e
xp
on
ent
(such a
s 4
x r
ath
er
than
x4).
Oft
en
it
occu
rs
wh
en
a q
ua
ntity
ch
an
ge
s b
y t
he
sa
me
fa
cto
r fo
r ea
ch u
nit o
f tim
e (
e.g
., “
do
ub
les e
ve
ry y
ea
r” o
r “d
ecre
ase
s 2
% e
ach m
on
th”)
.
Ex
po
nen
tia
l F
un
cti
on
(o
r M
od
el)
A
fu
nctio
n w
ho
se
ge
nera
l e
qu
atio
n is y
= a
• b
x w
he
re a
an
d b
are
con
sta
nts
.
Ex
po
nen
tia
l G
row
th/D
ec
ay
A s
itu
atio
n w
he
re a
qu
an
tity
in
cre
ase
s o
r d
ecre
ase
s e
xp
on
entia
lly b
y t
he
sa
me
fa
cto
r o
ve
r tim
e;
it is
use
d fo
r such
ph
eno
me
na
as inflatio
n, p
op
ula
tio
n g
row
th,
rad
ioa
ctivity o
r de
pre
cia
tion
.

K
ey
sto
ne
Ex
am
s: A
lge
bra
Ass
ess
me
nt
An
cho
r &
Eli
gib
le C
on
ten
t G
loss
ary
A
pri
l 2
01
4
Pen
nsy
lva
nia
Dep
art
men
t o
f E
du
cati
on
Pag
e 9
A
pri
l 20
14
Ex
pre
ss
ion
A
ma
the
ma
tica
l p
hra
se t
ha
t in
clu
de
s o
pe
ration
s,
nu
mb
ers
, a
nd
/or
varia
ble
s (
e.g
., 2
x +
3y is a
n
alg
eb
raic
exp
ressio
n,
13
.4 –
4.7
is a
nu
me
ric e
xp
ressio
n).
An e
xp
ressio
n d
oe
s n
ot
co
nta
in a
n e
qu
al
sig
n (
=)
or
an
y t
yp
e o
f in
equ
alit
y s
ign
.
Fa
cto
r (n
ou
n)
The
nu
mb
er
or
exp
ressio
n t
ha
t is
mu
ltip
lied
by a
no
the
r to
ge
t a
pro
du
ct
(e.g
., 6
is a
fa
cto
r of
30
, a
nd
6x is a
fa
cto
r of
42
x2).
Fa
cto
r (v
erb
) T
o e
xp
ress o
r w
rite
a n
um
be
r, m
on
om
ial, o
r po
lyn
om
ial a
s a
pro
du
ct of
two
or
mo
re f
acto
rs.
Fa
cto
r a
Mo
no
mia
l T
o e
xp
ress a
mo
no
mia
l a
s t
he
pro
du
ct of
two
or
mo
re m
on
om
ials
.
Fa
cto
r a
Po
lyn
om
ial
To e
xp
ress a
po
lyn
om
ial a
s th
e p
rod
uct
of
mo
no
mia
ls a
nd
/or
po
lyn
om
ials
(e.g
., f
acto
rin
g t
he
po
lyn
om
ial x
2 +
x –
12
resu
lts in
th
e p
rod
uct
(x –
3)(
x +
4))
.
Fre
qu
en
cy
Ho
w o
ften
so
me
thin
g o
ccu
rs (
i.e
., th
e n
um
be
r of
tim
es a
n ite
m,
nu
mb
er,
or
eve
nt h
ap
pen
s in a
se
t of
da
ta).
Fu
nc
tio
n
A r
ela
tion
in w
hic
h e
ach
va
lue
of
an ind
ep
en
de
nt
va
ria
ble
is a
sso
cia
ted
with
a u
niq
ue
va
lue
of
a
de
pe
nde
nt
va
ria
ble
(e
.g.,
on
e e
lem
en
t of
the
do
ma
in is p
aire
d w
ith
on
e a
nd
on
ly o
ne
ele
me
nt
of
the
ra
nge
). I
t is
a m
ap
pin
g w
hic
h invo
lves e
ithe
r a o
ne
-to
-on
e c
orr
espo
nd
en
ce
or
a m
an
y-t
o-o
ne
co
rre
sp
ond
en
ce
, b
ut no
t a
one
-to
-ma
ny c
orr
esp
ond
en
ce
.

K
ey
sto
ne
Ex
am
s: A
lge
bra
Ass
ess
me
nt
An
cho
r &
Eli
gib
le C
on
ten
t G
loss
ary
A
pri
l 2
01
4
Pen
nsy
lva
nia
Dep
art
men
t o
f E
du
cati
on
Pag
e 1
0
Ap
ril 2
01
4
Fu
nd
am
en
tal
Co
un
tin
g
Pri
nc
iple
A
wa
y t
o c
alc
ula
te a
ll of
the p
ossib
le c
om
bin
ation
s o
f a
giv
en
nu
mb
er
of
eve
nts
. It
sta
tes t
hat
if t
he
re
are
x d
iffe
rent
wa
ys o
f d
oin
g o
ne
th
ing a
nd y
diffe
rent
wa
ys o
f do
ing a
noth
er
thin
g,
the
n the
re a
re
xy d
iffe
ren
t w
ays o
f d
oin
g b
oth
th
ings.
It u
se
s th
e m
ultip
lication
rule
.
Ge
om
etr
ic S
eq
uen
ce
A
n o
rde
red
lis
t of
nu
mb
ers
tha
t ha
s th
e s
am
e r
atio
be
twe
en
co
nse
cu
tive
te
rms (
e.g
., 1
, 7
, 4
9, 3
43, …
is
a g
eo
me
tric
se
qu
ence
tha
t ha
s a
ratio o
f 7/1
betw
ee
n c
on
se
cu
tive t
erm
s;
ea
ch
te
rm a
fte
r th
e f
irst
term
ca
n b
e fo
un
d b
y m
ultip
lyin
g t
he
pre
vio
us t
erm
by a
co
nsta
nt,
in
th
is c
ase
th
e n
um
be
r 7 o
r 7/1
).
Gre
ate
st
Co
mm
on
Fac
tor
(GC
F)
The
la
rge
st fa
cto
r th
at tw
o o
r m
ore
nu
mb
ers
or
alg
eb
raic
te
rms h
ave
in
co
mm
on
. In
so
me
ca
se
s th
e
GC
F m
ay b
e 1
or
on
e o
f th
e a
ctu
al n
um
be
rs (
e.g
., t
he
GC
F o
f 1
8x
3 a
nd
24
x5 is 6
x3).
Ima
gin
ary
Nu
mb
er
The
squ
are
roo
t of
a n
ega
tive
nu
mb
er,
or
the o
ppo
site
of
the
squ
are
roo
t of
a n
ega
tive n
um
be
r. It is
wri
tte
n in
th
e fo
rm b
i, w
he
re b
is a
rea
l n
um
be
r a
nd i
is th
e im
agin
ary
roo
t (i.e
., i
=
1
or
i2 =
–1
).
Ind
ep
en
de
nt
Eve
nt(
s)
Tw
o o
r m
ore
eve
nts
in
wh
ich t
he
outc
om
e o
f o
ne
eve
nt
do
es n
ot aff
ect
the
ou
tco
me
of
the o
the
r e
ve
nt(
s)
(e.g
., to
ssin
g a
co
in a
nd r
olli
ng a
num
be
r cub
e a
re in
dep
en
den
t e
ve
nts
). T
he
pro
ba
bili
ty o
f tw
o in
de
pen
den
t e
ve
nts
(A
and
B)
occu
rrin
g is w
ritte
n P
(A a
nd
B)
or
P(A
B
) an
d e
qu
als
P(A
) •
P(B
)
(i.e
., t
he
pro
du
ct of
the p
rob
ab
ilities o
f th
e t
wo
in
div
idu
al e
ven
ts).
Ind
ep
en
de
nt
Va
ria
ble
T
he
in
pu
t n
um
be
r or
va
ria
ble
in a
rela
tio
n o
r fu
nction
wh
ose
va
lue
is s
ub
ject
to c
ho
ice.
It is n
ot
de
pe
nde
nt u
po
n a
ny o
the
r valu
es.
It is u
sua
lly t
he
x-v
alu
e o
r th
e x
in f(x
). I
t is
gra
ph
ed
on
the
x-a
xis
. It
s v
alu
es m
ake
up
th
e d
om
ain
of
the
re
lation o
r fu
nctio
n.
K
ey
sto
ne
Ex
am
s: A
lge
bra
Ass
ess
me
nt
An
cho
r &
Eli
gib
le C
on
ten
t G
loss
ary
A
pri
l 2
01
4
Pen
nsy
lva
nia
Dep
art
men
t o
f E
du
cati
on
Pag
e 1
1
Ap
ril 2
01
4
Ine
qu
ali
ty
A m
ath
em
atica
l se
nte
nce
tha
t con
tain
s a
n in
equ
alit
y s
ym
bo
l (i.e
., >
, <
, ≥, ≤,
or
≠).
It
co
mp
are
s t
wo
qu
an
titie
s.
Th
e s
ym
bo
l >
me
an
s g
rea
ter
than
, th
e s
ym
bo
l <
me
an
s le
ss t
ha
n, th
e s
ym
bo
l
me
an
s
gre
ate
r th
an
or
equ
al to
, th
e s
ym
bo
l m
ea
ns le
ss t
ha
n o
r equ
al to
, a
nd
th
e s
ym
bo
l m
ea
ns n
ot
equ
al to
.
Inte
ge
r A
na
tura
l nu
mb
er,
th
e a
dd
itiv
e in
ve
rse
of
a n
atu
ral nu
mb
er,
or
ze
ro.
An
y n
um
be
r fr
om
th
e s
et
of
nu
mb
ers
re
pre
se
nte
d b
y {
…,
–3
, –2
, –1,
0, 1
, 2
, 3
, …
}.
Inte
rqu
art
ile
Ra
ng
e (
of
Da
ta)
The
diffe
ren
ce
be
twe
en
the
first
(lo
we
r) a
nd
th
ird
(up
pe
r) q
ua
rtile
. It
rep
rese
nts
the
sp
rea
d o
f th
e
mid
dle
50%
of
a s
et
of d
ata
.
Inve
rse
(o
f a
Re
lati
on
) A
rela
tion
in w
hic
h t
he
co
ord
inate
s in e
ach
ord
ere
d p
air
are
sw
itch
ed
fro
m a
giv
en
rela
tion
. T
he
po
int
(x,
y)
be
co
me
s (
y,
x),
so
(3
, 8
) w
ou
ld b
eco
me
(8,
3).
Irra
tio
nal
Nu
mb
er
A r
ea
l nu
mb
er
tha
t ca
nn
ot b
e w
ritte
n a
s a
sim
ple
fra
ction
(i.e
., t
he
ratio
of
two
in
tege
rs).
It
is a
no
n-
term
ina
tin
g (
infinite
) and
non
-rep
ea
tin
g d
ecim
al. T
he
squa
re r
oot
of a
ny p
rim
e n
um
be
r is
irr
atio
na
l, a
s
are
π a
nd
e.
Le
as
t (o
r L
ow
es
t) C
om
mo
n
Mu
ltip
le (
LC
M)
The
sm
alle
st
nu
mb
er
or
exp
ressio
n th
at
is a
co
mm
on
mu
ltip
le o
f tw
o o
r m
ore
nu
mb
ers
or
alg
eb
raic
te
rms,
oth
er
tha
n z
ero
.
Lik
e T
erm
s
Mo
no
mia
ls t
ha
t con
tain
the
sa
me
va
ria
ble
s a
nd
co
rre
sp
ond
ing p
ow
ers
an
d/o
r ro
ots
. O
nly
th
e
co
eff
icie
nts
can
be
diffe
ren
t (e
.g.,
4x
3 a
nd
12x
3).
Lik
e t
erm
s c
an
be
ad
de
d o
r su
btr
acte
d.

K
ey
sto
ne
Ex
am
s: A
lge
bra
Ass
ess
me
nt
An
cho
r &
Eli
gib
le C
on
ten
t G
loss
ary
A
pri
l 2
01
4
Pen
nsy
lva
nia
Dep
art
men
t o
f E
du
cati
on
Pag
e 1
2
Ap
ril 2
01
4
Lin
e G
rap
h
A g
rap
h th
at u
se
s a
lin
e o
r lin
e s
egm
en
ts t
o c
on
ne
ct
da
ta p
oin
ts,
plo
tte
d o
n a
coo
rdin
ate
pla
ne
, u
su
ally
to
sh
ow
tre
nd
s o
r cha
nge
s in
da
ta o
ver
tim
e.
Mo
re b
roa
dly
, a
gra
ph
to
re
pre
sen
t th
e
rela
tion
sh
ip b
etw
ee
n t
wo
co
ntin
uou
s v
aria
ble
s.
Lin
e o
r C
urv
e o
f B
es
t F
it (
for
a S
ca
tte
r P
lot)
A
lin
e o
r cu
rve d
raw
n o
n a
sca
tte
r p
lot
to b
est e
stim
ate
th
e r
ela
tio
nship
be
twe
en
tw
o s
ets
of d
ata
. It
d
escrib
es th
e tre
nd o
f th
e d
ata
. D
iffe
ren
t m
ea
su
res a
re p
ossib
le t
o d
escrib
e t
he
be
st fit. T
he
mo
st
co
mm
on
is a
lin
e o
r curv
e t
ha
t m
inim
ize
s t
he
su
m o
f th
e s
qu
are
s o
f th
e e
rro
rs (
ve
rtic
al d
ista
nce
s)
from
th
e d
ata
po
ints
to
th
e lin
e.
The
lin
e o
f b
est fit is
a s
ub
se
t of
the
cu
rve o
f be
st fit. E
xa
mp
les o
f a
lin
e o
f b
est fit a
nd
a c
urv
e o
f b
est fit:
Lin
ea
r C
om
bin
ati
on
A
me
tho
d b
y w
hic
h a
syste
m o
f lin
ea
r e
qu
ation
s c
an b
e s
olv
ed.
It u
se
s a
dd
itio
n o
r sub
tractio
n in
co
mb
ina
tio
n w
ith
mu
ltip
lica
tio
n o
r div
isio
n to
elim
ina
te o
ne
of
the
varia
ble
s in o
rde
r to
so
lve
fo
r th
e
oth
er
va
ria
ble
.
Lin
ea
r E
qu
ati
on
A
n e
qu
atio
n fo
r w
hic
h t
he
gra
ph
is a
str
aig
ht
line
(i.e., a
po
lyn
om
ial e
qu
atio
n o
f th
e f
irst d
egre
e o
f th
e
form
Ax +
By =
C,
wh
ere
A,
B,
an
d C
are
re
al n
um
be
rs a
nd
wh
ere
A a
nd
B a
re n
ot
both
ze
ro;
an
e
qu
atio
n in
wh
ich t
he
va
ria
ble
s a
re n
ot
mu
ltip
lied
by o
ne
ano
the
r or
rais
ed
to
an
y p
ow
er
oth
er
than
1).
K
ey
sto
ne
Ex
am
s: A
lge
bra
Ass
ess
me
nt
An
cho
r &
Eli
gib
le C
on
ten
t G
loss
ary
A
pri
l 2
01
4
Pen
nsy
lva
nia
Dep
art
men
t o
f E
du
cati
on
Pag
e 1
3
Ap
ril 2
01
4
Lin
ea
r F
un
cti
on
A
fu
nctio
n fo
r w
hic
h t
he
gra
ph
is a
non
-ve
rtic
al str
aig
ht
line
. It
is a
first
de
gre
e p
oly
no
mia
l o
f th
e
co
mm
on
fo
rm f
(x)
= m
x +
b,
wh
ere
m a
nd
b a
re c
on
sta
nts
and
x is a
rea
l va
ria
ble
. T
he
consta
nt m
is
ca
lled
th
e s
lop
e a
nd b
is c
alle
d th
e y
-inte
rcep
t. I
t ha
s a
co
nsta
nt
rate
of
cha
nge
.
Lin
ea
r In
eq
uali
ty
The
rela
tio
n o
f tw
o e
xp
ressio
ns u
sin
g th
e s
ym
bo
ls <
, >
, ≤,
≥,
or
≠ a
nd
wh
ose
bou
nd
ary
is a
str
aig
ht
line
. T
he lin
e d
ivid
es the
co
ord
ina
te p
lan
e into
tw
o p
art
s.
If t
he
ine
qua
lity is e
ith
er
≤ o
r ≥, th
en
th
e
bo
un
da
ry is s
olid
. If
the
in
equ
alit
y is e
ith
er
< o
r >
, th
en
the
bo
un
da
ry is d
ash
ed
. If
th
e in
equ
alit
y is ≠
, th
en t
he
so
lutio
n c
on
tain
s e
ve
ryth
ing e
xce
pt fo
r th
e b
ou
nda
ry.
Lo
ga
rith
m
Th
e e
xp
one
nt
requ
ire
d t
o p
rod
uce
a g
iven n
um
be
r (e
.g.,
sin
ce
2 r
ais
ed
to
a p
ow
er
of
5 is 3
2,
the
loga
rith
m b
ase
2 o
f 3
2 is 5
; th
is is w
ritt
en
as log
2 3
2 =
5).
Tw
o f
reque
ntly u
se
d b
ase
s a
re 1
0 (
co
mm
on
loga
rith
m)
an
d e
(n
atu
ral lo
ga
rith
m).
Wh
en
a lo
ga
rith
m is w
ritte
n w
ith
ou
t a
ba
se
, it is u
nd
ers
too
d t
o b
e
ba
se
10
.
Lo
ga
rith
mic
Eq
uati
on
A
n e
qu
atio
n w
hic
h c
onta
ins a
loga
rith
m o
f a
va
ria
ble
or
nu
mb
er.
Som
etim
es it
is s
olv
ed
by r
ew
ritin
g
the
equ
atio
n in
exp
on
en
tia
l fo
rm a
nd
so
lvin
g f
or
the
va
ria
ble
(e
.g.,
log
2 3
2 =
5 is the
sa
me
as 2
5 =
32
).
It is a
n in
ve
rse fu
nctio
n o
f th
e e
xp
on
entia
l fu
nctio
n.
Ma
pp
ing
T
he
ma
tch
ing o
r pa
irin
g o
f o
ne
se
t of
nu
mb
ers
to
an
oth
er
by u
se
of
a r
ule
. A
nu
mb
er
in t
he d
om
ain
is
ma
tch
ed
or
pa
ire
d w
ith
a n
um
be
r in
th
e r
an
ge (
or
a r
ela
tion
or
fun
ctio
n).
It m
ay b
e a
on
e-t
o-o
ne
co
rre
sp
ond
en
ce
, a
on
e-t
o-m
an
y c
orr
esp
on
den
ce
, o
r a m
an
y-t
o-o
ne
co
rre
sp
ond
en
ce
.
Ma
xim
um
Va
lue
(o
f a
Gra
ph
) T
he
va
lue
of
the
de
pe
nd
en
t va
ria
ble
fo
r th
e h
igh
est
po
int
on
the
gra
ph
of
a c
urv
e.

K
ey
sto
ne
Ex
am
s: A
lge
bra
Ass
ess
me
nt
An
cho
r &
Eli
gib
le C
on
ten
t G
loss
ary
A
pri
l 2
01
4
Pen
nsy
lva
nia
Dep
art
men
t o
f E
du
cati
on
Pag
e 1
4
Ap
ril 2
01
4
Me
an
A
me
asu
re o
f ce
ntr
al te
nde
ncy t
ha
t is
ca
lcula
ted
by a
dd
ing a
ll th
e v
alu
es o
f a s
et of
da
ta a
nd
div
idin
g
tha
t su
m b
y t
he
to
tal nu
mb
er
of
va
lue
s.
Unlik
e m
ed
ian
, th
e m
ea
n is s
en
sitiv
e to
ou
tlie
r va
lue
s.
It is
als
o c
alle
d “
arith
me
tic m
ea
n”
or
“ave
rage
”.
Me
as
ure
of
Cen
tral
Te
nd
en
cy
A m
ea
su
re o
f lo
ca
tion
of
the
mid
dle
(cen
ter)
of
a d
istr
ibu
tion
of
a s
et
of
da
ta (
i.e., h
ow
da
ta c
luste
rs).
T
he
th
ree
mo
st
co
mm
on
me
asu
res o
f cen
tral te
nd
en
cy a
re m
ea
n,
me
dia
n,
and
mo
de
.
Me
as
ure
of
Dis
pers
ion
A
me
asu
re o
f th
e w
ay in
wh
ich t
he
dis
trib
ution o
f a s
et of
da
ta is s
pre
ad
ou
t. In
ge
ne
ral th
e m
ore
sp
rea
d o
ut a
dis
trib
ution
is,
the
la
rge
r th
e m
ea
su
re o
f d
ispe
rsio
n.
Ran
ge
an
d inte
rqu
art
ile r
an
ge
are
tw
o m
ea
su
res o
f d
ispers
ion
.
Me
dia
n
A m
ea
su
re o
f ce
ntr
al te
nde
ncy t
ha
t is
th
e m
idd
le v
alu
e in a
n o
rde
red
se
t of
da
ta o
r th
e a
vera
ge
of
the
tw
o m
idd
le v
alu
es w
he
n t
he
se
t h
as t
wo
mid
dle
va
lue
s (
occu
rs w
he
n t
he
se
t of
da
ta h
as a
n e
ve
n
nu
mb
er
of
da
ta p
oin
ts).
It
is th
e v
alu
e h
alfw
ay t
hro
ugh
th
e o
rde
red
se
t of
data
, b
elo
w a
nd
ab
ove
wh
ich
the
re is a
n e
qu
al nu
mb
er
of
da
ta v
alu
es.
It is g
en
era
lly a
go
od
de
scriptive m
ea
su
re f
or
skew
ed
da
ta o
r d
ata
with
ou
tlie
rs.
Min
imu
m V
alu
e (
of
a G
rap
h)
The
va
lue
of
the
de
pe
nd
en
t va
ria
ble
fo
r th
e low
est
po
int
on
th
e g
raph
of
a c
urv
e.
Mo
de
A
me
asu
re o
f ce
ntr
al te
nde
ncy t
ha
t is
th
e v
alu
e o
r va
lue
s th
at
occu
r(s)
mo
st
oft
en
in
a s
et of
da
ta.
A
se
t of
data
ca
n h
ave o
ne
mo
de
, m
ore
tha
n o
ne
mo
de
, o
r no m
od
e.
Mo
no
mia
l A
po
lyn
om
ial w
ith
on
ly o
ne
te
rm;
it c
on
tain
s n
o a
dd
itio
n o
r sub
traction
. It
ca
n b
e a
nu
mb
er,
a v
aria
ble
,
or
a p
rod
uct
of
nu
mb
ers
an
d/o
r m
ore
va
ria
ble
s (
e.g
., 2
• 5
or
x3y
4 o
r 2
4 3r
).

K
ey
sto
ne
Ex
am
s: A
lge
bra
Ass
ess
me
nt
An
cho
r &
Eli
gib
le C
on
ten
t G
loss
ary
A
pri
l 2
01
4
Pen
nsy
lva
nia
Dep
art
men
t o
f E
du
cati
on
Pag
e 1
5
Ap
ril 2
01
4
Mu
ltip
lic
ati
ve
In
ve
rse
T
he
recip
roca
l of
a n
um
be
r (i.e
., f
or
an
y n
on
-ze
ro n
um
be
r a
, th
e m
ultip
licative inve
rse is 1 a
; fo
r an
y
ratio
na
l n
um
be
r b c
, w
he
re b
≠ 0
an
d c
≠ 0
, th
e m
ultip
licative inve
rse is c b
). A
ny n
um
be
r an
d its
mu
ltip
licative inve
rse h
ave
a p
rodu
ct of
1 (
e.g
.,
1 4 is th
e m
ultip
licative in
ve
rse o
f 4
sin
ce
4 •
1 4
= 1
;
like
wis
e,
the
mu
ltip
licative inve
rse o
f 1 4
is 4
sin
ce
1 4
• 4
= 1
).
Mu
tuall
y E
xc
lus
ive
Eve
nts
T
wo
eve
nts
tha
t ca
nnot
occu
r at
the
sa
me
tim
e (
i.e.,
eve
nts
tha
t h
ave
no o
utc
om
es in
co
mm
on
). If
two
e
ve
nts
A a
nd
B a
re m
utu
ally
exclu
siv
e,
the
n th
e p
rob
ab
ility
of
A o
r B
occu
rrin
g is t
he
su
m o
f th
eir
ind
ivid
ua
l p
rob
ab
ilities:
P(A
B
) =
P(A
) +
P(B
). A
lso d
efined
as w
he
n th
e inte
rsection
of
two
se
ts is
em
pty
, w
ritte
n a
s A
B
= Ø
.
Na
tura
l L
og
ari
thm
A
loga
rith
m w
ith
ba
se
e.
It is w
ritt
en
ln
x.
The
na
tura
l lo
ga
rith
m is th
e p
ow
er
of
e n
ece
ssa
ry t
o e
qu
al a
giv
en
nu
mb
er
(i.e
., ln
x =
y is e
qu
ivale
nt to
e y =
x).
The
con
sta
nt
e is
an
irr
atio
na
l n
um
be
r w
ho
se
va
lue
is
ap
pro
xim
ate
ly 2
.71
82
8…
.
Na
tura
l N
um
be
r A
co
un
tin
g n
um
be
r. A
nu
mb
er
rep
rese
ntin
g a
po
sitiv
e,
wh
ole
am
ou
nt.
An
y n
um
be
r fr
om
th
e s
et
of
nu
mb
ers
re
pre
se
nte
d b
y {
1,
2,
3, …
}. S
om
etim
es,
it is r
efe
rred
to a
s a
“p
ositiv
e inte
ge
r”.
Ne
ga
tive
Ex
po
nen
t A
n e
xp
one
nt th
at
ind
icate
s a
recip
roca
l th
at
ha
s t
o b
e ta
ken
befo
re th
e e
xp
one
nt ca
n b
e a
pp
lied
(e.g
.,
2
215
5
or
1x
xa
a
). It
is u
se
d in
scie
ntific n
ota
tio
n f
or
nu
mb
ers
be
twe
en
–1
and
1.

K
ey
sto
ne
Ex
am
s: A
lge
bra
Ass
ess
me
nt
An
cho
r &
Eli
gib
le C
on
ten
t G
loss
ary
A
pri
l 2
01
4
Pen
nsy
lva
nia
Dep
art
men
t o
f E
du
cati
on
Pag
e 1
6
Ap
ril 2
01
4
Nu
mb
er
Lin
e
A g
rad
ua
ted
str
aig
ht
line
th
at
rep
resen
ts th
e s
et
of
all
rea
l n
um
be
rs in o
rde
r. T
yp
ically
, it is m
ark
ed
sh
ow
ing inte
ge
r va
lue
s.
Od
ds
A
co
mp
ariso
n,
in r
atio
fo
rm (
as a
fra
ctio
n o
r w
ith
a c
olo
n),
of
ou
tco
me
s.
“Odd
s in f
avo
r” (
or
sim
ply
“o
dd
s”)
is th
e r
atio o
f fa
vo
rab
le o
utc
om
es t
o u
nfa
vo
rab
le o
utc
om
es (
e.g
., t
he o
dd
s in
fa
vo
r of
pic
kin
g a
re
d h
at
wh
en
th
ere
are
3 r
ed
ha
ts a
nd
5 n
on
-red
ha
ts is 3
:5).
“O
dd
s a
ga
inst”
is th
e r
atio o
f u
nfa
vo
rab
le
ou
tco
me
s t
o fa
vo
rab
le o
utc
om
es (
e.g
., th
e o
dd
s a
ga
inst p
ickin
g a
red
hat
wh
en
th
ere
are
3 r
ed
ha
ts
an
d 5
no
n-r
ed
ha
ts is 5
:3).
Ord
er
of
Op
era
tio
ns
Rule
s d
escrib
ing w
ha
t o
rde
r to
use in
eva
lua
tin
g e
xp
ressio
ns:
(1)
Pe
rfo
rm o
pe
ration
s in
gro
up
ing s
ym
bo
ls (
pa
ren
the
se
s a
nd b
racke
ts),
(2
) E
va
lua
te e
xp
on
ential exp
ressio
ns a
nd r
ad
ical e
xp
ressio
ns f
rom
le
ft to
rig
ht,
(3
) M
ultip
ly o
r d
ivid
e f
rom
left
to
rig
ht,
(4
) A
dd
or
su
btr
act fr
om
le
ft t
o r
igh
t.
Ord
ere
d P
air
A
pa
ir o
f nu
mb
ers
used
to
lo
ca
te a
po
int o
n a
co
ord
ina
te p
lane
, o
r th
e s
olu
tio
n o
f an
equ
atio
n in t
wo
va
ria
ble
s.
The
first n
um
be
r te
lls h
ow
fa
r to
move
ho
rizo
nta
lly,
an
d th
e s
eco
nd
nu
mb
er
tells
ho
w f
ar
to
mo
ve
ve
rtic
ally
; w
ritte
n in
the
fo
rm (
x-c
oo
rdin
ate
, y-c
oo
rdin
ate
). O
rde
r m
att
ers
: th
e p
oin
t (x
, y)
is n
ot
the
sa
me
as (
y,
x).
Ori
gin
T
he
po
int
(0,
0)
on
a c
oo
rdin
ate
pla
ne
. It is t
he
po
int
of
inte
rsection fo
r th
e x
-axis
and
the
y-a
xis
.
Ou
tlie
r A
va
lue t
ha
t is
mu
ch
gre
ate
r o
r m
uch
le
ss t
han
the
rest of
the
da
ta.
It is d
iffe
ren
t in
so
me
wa
y f
rom
th
e
ge
ne
ral p
att
ern
of
da
ta.
It d
ire
ctly s
tan
ds o
ut fr
om
th
e r
est
of
the d
ata
. S
om
etim
es it
is r
efe
rre
d t
o a
s
an
y d
ata
po
int
mo
re t
ha
n 1
.5 inte
rqu
art
ile r
ange
s g
rea
ter
than
the
up
pe
r (t
hird
) qu
art
ile o
r le
ss t
ha
n
the
lo
we
r (f
irst)
qu
art
ile.

K
ey
sto
ne
Ex
am
s: A
lge
bra
Ass
ess
me
nt
An
cho
r &
Eli
gib
le C
on
ten
t G
loss
ary
A
pri
l 2
01
4
Pen
nsy
lva
nia
Dep
art
men
t o
f E
du
cati
on
Pag
e 1
7
Ap
ril 2
01
4
Pa
tte
rn (
or
Se
qu
en
ce)
A s
et of
nu
mb
ers
arr
ange
d in
ord
er
(or
in a
sequ
en
ce
). T
he
nu
mb
ers
an
d t
he
ir a
rra
nge
me
nt
are
d
ete
rmin
ed
by a
rule
, in
clu
din
g r
epe
titio
n a
nd g
row
th/d
eca
y r
ule
s.
Se
e a
rith
me
tic s
equ
en
ce
and
ge
om
etr
ic s
equ
en
ce
.
Pe
rfec
t S
qu
are
A
nu
mb
er
wh
ose
squ
are
ro
ot
is a
wh
ole
nu
mb
er
(e.g
., 2
5 is a
pe
rfect
squ
are
sin
ce
25
= 5
). A
pe
rfe
ct
squa
re c
an
be
fo
und
by r
ais
ing a
wh
ole
nu
mb
er
to t
he
se
cond
po
we
r (e
.g.,
52 =
25
).
Pe
rmu
tati
on
A
n o
rde
red
arr
an
ge
me
nt
of
ob
jects
fro
m a
giv
en
set
in w
hic
h t
he
ord
er
of
the
ob
jects
is s
ign
ific
an
t (e
.g.,
tw
o-lett
er
pe
rmu
tatio
ns o
f th
e th
ree le
tters
X,
Y,
an
d Z
wo
uld
be
XY
, Y
X,
XZ
, Z
X,
YZ
, a
nd
ZY
). A
p
erm
uta
tio
n is s
imila
r to
, bu
t no
t th
e s
am
e a
s, a
co
mb
ina
tion
.
Po
int-
Slo
pe
Fo
rm (
of
a
Lin
ea
r E
qu
ati
on
) A
n e
qu
atio
n o
f a
str
aig
ht,
no
n-v
ert
ical lin
e w
ritt
en
in t
he
fo
rm y
– y
1 =
m(x
– x
1),
wh
ere
m is th
e s
lop
e
of
the
lin
e a
nd
(x
1,
y1)
is a
giv
en
po
int o
n t
he
lin
e.
Po
lyn
om
ial
A
n a
lge
bra
ic e
xp
ressio
n t
ha
t is
a m
on
om
ial o
r th
e s
um
or
diffe
ren
ce
of
two
or
mo
re m
on
om
ials
(e.g
.,
6a
or
5a
2 +
3a
– 1
3 w
he
re t
he
exp
one
nts
are
na
tura
l n
um
be
rs).
Po
lyn
om
ial
Fu
nc
tio
n
A f
un
ctio
n o
f th
e fo
rm f
(x)
= a
nx
n +
an–1x
n–1 +
… +
a1x +
a0,
wh
ere
an ≠
0 a
nd
na
tura
l nu
mb
er
n is the
d
egre
e o
f th
e p
oly
no
mia
l.
Po
sit
ive
Ex
po
nen
t In
dic
ate
s h
ow
ma
ny t
ime
s a
ba
se
nu
mb
er
is m
ultip
lied
by its
elf.
In th
e e
xp
ressio
n x
n,
n is th
e p
ositiv
e
exp
on
en
t, a
nd
x is th
e b
ase
nu
mb
er
(e.g
., 2
3 =
2 •
2 •
2).

K
ey
sto
ne
Ex
am
s: A
lge
bra
Ass
ess
me
nt
An
cho
r &
Eli
gib
le C
on
ten
t G
loss
ary
A
pri
l 2
01
4
Pen
nsy
lva
nia
Dep
art
men
t o
f E
du
cati
on
Pag
e 1
8
Ap
ril 2
01
4
Po
we
r T
he
va
lue
of
the
exp
one
nt
in a
te
rm.
The
exp
ressio
n a
n is r
ea
d “
a to
th
e p
ow
er
of
n.”
To r
ais
e a
nu
mb
er,
a,
to th
e p
ow
er
of
ano
the
r w
ho
le n
um
be
r, n
, is
to
mu
ltip
ly a
by its
elf n
tim
es (
e.g
., th
e n
um
be
r
43 is r
ea
d “
fou
r to
th
e th
ird
po
we
r” a
nd
rep
rese
nts
4 •
4 •
4).
Po
we
r o
f a P
ow
er
An
exp
ressio
n o
f th
e form
(a
m)n
. It
ca
n b
e f
ou
nd
by m
ultip
lyin
g t
he
exp
one
nts
(e.g
.,
(23)4
= 2
3•4
= 2
12 =
4,0
96
).
Po
we
rs o
f P
rod
ucts
A
n e
xp
ressio
n o
f th
e form
am •
an. It
ca
n b
e fou
nd
by a
dd
ing t
he
expo
nen
ts w
he
n m
ultip
lyin
g p
ow
ers
tha
t h
ave
the
sa
me
base
(e.g
., 2
3 •
24 =
23+
4 =
27 =
12
8).
Pri
me
Nu
mb
er
An
y n
atu
ral n
um
be
r w
ith
exa
ctly t
wo
fa
cto
rs, 1 a
nd its
elf (
e.g
., 3
is a
prim
e n
um
be
r sin
ce
it
ha
s o
nly
tw
o f
acto
rs: 1
and
3).
[N
ote
: S
ince
1 h
as o
nly
on
e f
acto
r, its
elf, it is n
ot
a p
rim
e n
um
be
r.]
A p
rim
e
nu
mb
er
is n
ot a
co
mp
osite
nu
mb
er.
Pro
ba
bilit
y
A n
um
be
r fr
om
0 t
o 1
(o
r 0%
to
10
0%
) th
at
ind
icate
s h
ow
lik
ely
an
eve
nt
is to
ha
pp
en
. A
very
un
like
ly
eve
nt h
as a
pro
bab
ility
ne
ar
0 (
or
0%
) w
hile
a v
ery
lik
ely
eve
nt
ha
s a
pro
bab
ility
ne
ar
1 (
or
10
0%
). It
is
wri
tte
n a
s a
ratio (
fra
ctio
n, d
ecim
al, o
r e
qu
ivale
nt p
erc
ent)
. T
he n
um
be
r of
wa
ys a
n e
ve
nt
co
uld
h
app
en
(fa
vo
rab
le o
utc
om
es)
is p
lace
d o
ve
r th
e to
tal n
um
be
r of
even
ts (
tota
l p
ossib
le o
utc
om
es)
tha
t co
uld
ha
pp
en.
A p
robab
ility
of
0 m
ea
ns it
is im
po
ssib
le,
an
d a
pro
ba
bili
ty o
f 1
me
an
s it
is c
ert
ain
.
Pro
ba
bilit
y o
f a
Co
mp
ou
nd
(o
r C
om
bin
ed
) E
ve
nt
The
re a
re t
wo
typ
es:
1.
Th
e u
nio
n o
f tw
o e
ve
nts
A a
nd
B,
wh
ich is th
e p
rob
ab
ility
of
A o
r B
occu
rrin
g.
This
is
rep
rese
nte
d a
s P
(A
B)
= P
(A)
+ P
(B)
– P
(A)
• P
(B).
2.
Th
e in
ters
ection o
f tw
o e
ve
nts
A a
nd B
, w
hic
h is th
e p
roba
bili
ty o
f A
an
d B
occu
rrin
g.
This
is
rep
rese
nte
d a
s P
(A
B)
= P
(A)
• P
(B).

K
ey
sto
ne
Ex
am
s: A
lge
bra
Ass
ess
me
nt
An
cho
r &
Eli
gib
le C
on
ten
t G
loss
ary
A
pri
l 2
01
4
Pen
nsy
lva
nia
Dep
art
men
t o
f E
du
cati
on
Pag
e 1
9
Ap
ril 2
01
4
Qu
ad
ran
ts
The
fou
r re
gio
ns o
f a
co
ord
inate
pla
ne
tha
t a
re s
epa
rate
d b
y t
he
x-a
xis
an
d th
e y
-axis
, a
s s
ho
wn
b
elo
w.
(1
) T
he
first
qu
ad
ran
t (Q
ua
dra
nt I)
con
tain
s a
ll th
e p
oin
ts w
ith
po
sitiv
e x
an
d p
ositiv
e y
coo
rdin
ate
s
(e.g
., (
3,
4))
. (2
) T
he
se
co
nd q
ua
dra
nt
(Qu
ad
ran
t II)
co
nta
ins a
ll th
e p
oin
ts w
ith
ne
ga
tive
x a
nd
po
sitiv
e y
co
ord
inate
s (
e.g
., (
–3, 4
)).
(3)
Th
e t
hird q
ua
dra
nt
(Qua
dra
nt II
I) c
on
tain
s a
ll th
e p
oin
ts w
ith
ne
ga
tive x
and
ne
ga
tive
y
co
ord
inate
s (
e.g
., (
–3,
–4
)).
(4)
Th
e f
ou
rth q
ua
dra
nt
(Qu
ad
ran
t IV
) con
tain
s a
ll th
e p
oin
ts w
ith
po
sitiv
e x
an
d n
ega
tive
y
co
ord
inate
s (
e.g
., (
3,
–4
)).
Qu
ad
rati
c E
qu
ati
on
A
n e
qu
atio
n th
at
can
be
writt
en
in
the
sta
nda
rd f
orm
ax
2 +
bx +
c =
0,
wh
ere
a,
b,
an
d c
are
rea
l
nu
mb
ers
an
d a
do
es n
ot
equ
al ze
ro.
Th
e h
ighe
st
po
we
r o
f th
e v
aria
ble
is 2
. It h
as,
at
mo
st,
tw
o
so
lution
s.
The g
rap
h is a
pa
rab
ola
.

K
ey
sto
ne
Ex
am
s: A
lge
bra
Ass
ess
me
nt
An
cho
r &
Eli
gib
le C
on
ten
t G
loss
ary
A
pri
l 2
01
4
Pen
nsy
lva
nia
Dep
art
men
t o
f E
du
cati
on
Pag
e 2
0
Ap
ril 2
01
4
Qu
ad
rati
c F
orm
ula
T
he
so
lutio
ns o
r ro
ots
of
a q
ua
dra
tic e
qu
atio
n in t
he
fo
rm a
x2 +
bx +
c =
0,
wh
ere
a ≠
0, a
re g
iven
by
the
fo
rmu
la
24
2
bb
ac
xa
.
Qu
ad
rati
c F
un
cti
on
A
fu
nctio
n th
at
can
be
exp
ressed
in
th
e fo
rm f
(x)
= a
x2 +
bx +
c,
wh
ere
a ≠
0 a
nd
th
e h
igh
est
po
we
r o
f
the
va
ria
ble
is 2
. T
he
gra
ph
is a
pa
rab
ola
.
Qu
art
ile
On
e o
f th
ree
va
lue
s tha
t d
ivid
es a
se
t of
da
ta in
to fo
ur
equa
l p
art
s:
1.
Me
dia
n d
ivid
es a
se
t of
da
ta into
tw
o e
qu
al p
art
s.
2.
Lo
we
r qu
art
ile (
25
th p
erc
en
tile
) is
th
e m
ed
ian
of
the
lo
we
r ha
lf o
f th
e d
ata
. 3
. U
pp
er
qu
art
ile (
75
th p
erc
en
tile
) is
th
e m
ed
ian
of
the
up
pe
r ha
lf o
f th
e d
ata
.
Ra
dic
al E
xp
res
sio
n
An
exp
ressio
n c
on
tain
ing a
rad
ical sym
bo
l (
na
). T
he
exp
ressio
n o
r nu
mb
er
insid
e t
he
rad
ical (a
) is
ca
lled
th
e r
ad
ican
d,
and
the
nu
mb
er
ap
pea
ring a
bo
ve
th
e r
ad
ical (n
) is
th
e d
egre
e.
Th
e d
egre
e is
alw
ays a
po
sitiv
e inte
ge
r. W
hen
a r
ad
ical is
writt
en
with
ou
t a
de
gre
e, it is u
nd
ers
too
d to
be
a d
egre
e
of
2 a
nd
is r
ead
as “
the s
qu
are
ro
ot of
a.”
When
the
de
gre
e is 3
, it is r
ea
d a
s “
the
cub
e r
oo
t of
a.”
Fo
r
an
y o
the
r de
gre
e,
the
exp
ressio
n
na
is r
ea
d a
s “
the
nth
roo
t of
a.”
Whe
n th
e d
egre
e is a
n e
ve
n
nu
mb
er,
th
e r
ad
ical e
xp
ressio
n is a
ssu
me
d t
o b
e th
e p
rin
cip
al (p
ositiv
e)
roo
t (e
.g.,
altho
ugh (
–7
)2 =
49
,
49
= 7
).
Ra
ng
e (
of
a R
ela
tio
n o
r F
un
cti
on
) T
he
se
t of
all
po
ssib
le v
alu
es fo
r th
e o
utp
ut
(de
pen
den
t va
riab
le)
of
a f
un
ctio
n o
r re
lation;
the
se
t of
se
co
nd
nu
mb
ers
in
th
e o
rde
red
pa
irs o
f a f
unctio
n o
r re
latio
n; th
e v
alu
es o
f th
e y
-co
ord
ina
tes in (
x,
y).
K
ey
sto
ne
Ex
am
s: A
lge
bra
Ass
ess
me
nt
An
cho
r &
Eli
gib
le C
on
ten
t G
loss
ary
A
pri
l 2
01
4
Pen
nsy
lva
nia
Dep
art
men
t o
f E
du
cati
on
Pag
e 2
1
Ap
ril 2
01
4
Ra
ng
e (
of
Da
ta)
In s
tatistics,
a m
ea
su
re o
f d
isp
ers
ion
th
at
is the
diffe
ren
ce b
etw
ee
n th
e g
rea
test
va
lue
(m
axim
um
va
lue
) an
d th
e le
ast
valu
e (
min
imu
m v
alu
e)
in a
se
t of
da
ta.
Ra
te
A r
atio
th
at co
mp
are
s tw
o q
ua
ntitie
s h
avin
g d
iffe
ren
t u
nits (
e.g
., 1
68 m
iles
3.5
hours
or
122
.5 c
alo
rie
s
5 c
ups
). W
hen
the
rate
is s
imp
lifie
d s
o t
ha
t th
e s
eco
nd (
ind
epe
nde
nt)
qu
an
tity
is 1
, it is c
alle
d a
un
it r
ate
(e.g
.,
48
mile
s p
er
hou
r o
r 24
.5 c
alo
rie
s p
er
cup
).
Ra
te (
of
Ch
an
ge
) T
he
am
ou
nt
a q
uan
tity
ch
an
ge
s o
ve
r tim
e (
e.g
., 3
.2 c
m p
er
ye
ar)
. A
lso t
he
am
ou
nt a
fu
nction
’s o
utp
ut
ch
an
ge
s (
incre
ase
s o
r d
ecre
ase
s)
for
ea
ch
unit o
f cha
nge
in t
he in
put.
See
slo
pe
.
Ra
te (
of
Inte
res
t)
The
pe
rcen
t b
y w
hic
h a
mo
ne
tary
acco
un
t a
ccru
es in
tere
st.
It
is m
ost
co
mm
on
fo
r th
e r
ate
of
inte
rest
to b
e m
ea
su
red
on
an
an
nu
al ba
sis
(e.g
., 4
.5%
pe
r ye
ar)
, e
ve
n if
the
in
tere
st
is c
om
po
unde
d
pe
rio
dic
ally
(i.e
., m
ore
fre
qu
en
tly t
ha
n o
nce
pe
r ye
ar)
.
Ra
tio
A
co
mp
ariso
n o
f tw
o n
um
be
rs, qu
an
titie
s o
r exp
ressio
ns b
y d
ivis
ion
. It
is o
fte
n w
ritt
en
as a
fra
ctio
n,
bu
t n
ot a
lwa
ys (
e.g
., 2 3
, 2
:3,
2 to
3,
2 ÷
3 a
re a
ll th
e s
am
e r
atios).
Ra
tio
na
l E
xp
ress
ion
A
n e
xp
ressio
n th
at
can b
e w
ritte
n a
s a
po
lyn
om
ial d
ivid
ed
by a
po
lyn
om
ial, d
efin
ed o
nly
wh
en
th
e
latt
er
is n
ot
equa
l to
zero
.

K
ey
sto
ne
Ex
am
s: A
lge
bra
Ass
ess
me
nt
An
cho
r &
Eli
gib
le C
on
ten
t G
loss
ary
A
pri
l 2
01
4
Pen
nsy
lva
nia
Dep
art
men
t o
f E
du
cati
on
Pag
e 2
2
Ap
ril 2
01
4
Ra
tio
na
l N
um
be
r A
ny n
um
be
r th
at
ca
n b
e w
ritt
en
in
the
fo
rm a b
wh
ere
a is a
ny inte
ge
r a
nd
b is a
ny inte
ge
r e
xce
pt
ze
ro.
All
rep
eatin
g d
ecim
al a
nd
te
rmin
atin
g d
ecim
al n
um
be
rs a
re r
ation
al n
um
be
rs.
Re
al
Nu
mb
er
The
co
mb
ine
d s
et of
ratio
na
l a
nd
irr
ation
al n
um
be
rs. A
ll n
um
be
rs o
n t
he
nu
mb
er
line
. N
ot
an
im
agin
ary
nu
mb
er.
Re
gre
ssio
n C
urv
e
The
lin
e o
r cu
rve o
f b
est fit
tha
t re
pre
sen
ts the
le
ast d
evia
tio
n f
rom
th
e p
oin
ts in a
sca
tte
r plo
t of
da
ta.
Mo
st
co
mm
on
ly it
is lin
ea
r a
nd
use
s a
“le
ast
squ
are
s”
me
tho
d.
Exa
mp
les o
f re
gre
ssio
n c
urv
es:
Re
lati
on
A
se
t of
pa
irs o
f va
lue
s (
e.g
., {
(1,
2),
(2, 3
) (3
, 2
)}).
The
first
va
lue
in
ea
ch
pa
ir is t
he
inp
ut
(ind
ep
en
de
nt
va
lue
), a
nd
th
e s
eco
nd
va
lue
in t
he
pa
ir is t
he
ou
tpu
t (d
epe
nde
nt
va
lue
). I
n a
rela
tion
, n
eithe
r th
e in
pu
t va
lues n
or
the
ou
tpu
t va
lue
s n
eed
to
be
un
iqu
e.
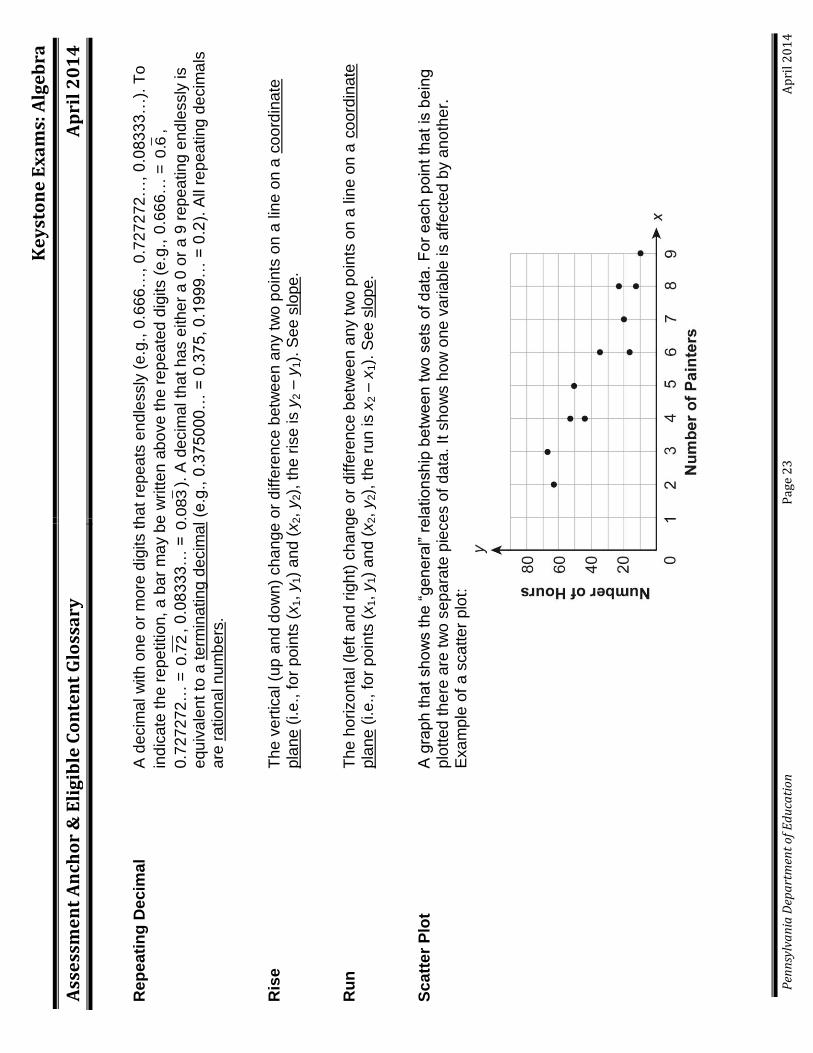
K
ey
sto
ne
Ex
am
s: A
lge
bra
Ass
ess
me
nt
An
cho
r &
Eli
gib
le C
on
ten
t G
loss
ary
A
pri
l 2
01
4
Pen
nsy
lva
nia
Dep
art
men
t o
f E
du
cati
on
Pag
e 2
3
Ap
ril 2
01
4
Re
pe
ati
ng
De
cim
al
A d
ecim
al w
ith
on
e o
r m
ore
dig
its t
ha
t re
pea
ts e
nd
lessly
(e.g
., 0
.666
…,
0.7
27
272…
, 0.0
83
33…
). T
o
ind
icate
th
e r
epe
titio
n, a
ba
r m
ay b
e w
ritt
en
ab
ove
th
e r
ep
ea
ted
dig
its (
e.g
., 0
.66
6…
= 0
.6,
0.7
27
272…
= 0
.72
, 0
.08
333
… =
0.0
83
). A
de
cim
al th
at h
as e
ith
er
a 0
or
a 9
rep
ea
tin
g e
nd
lessly
is
equ
ivale
nt
to a
te
rmin
atin
g d
ecim
al (e
.g.,
0.3
75
000…
= 0
.37
5, 0
.19
99
… =
0.2
). A
ll re
pea
ting d
ecim
als
a
re r
ation
al nu
mb
ers
.
Ris
e
The
ve
rtic
al (u
p a
nd
dow
n)
cha
nge
or
diffe
rence
betw
ee
n a
ny t
wo
po
ints
on a
lin
e o
n a
co
ord
ina
te
pla
ne (
i.e
., fo
r po
ints
(x
1,
y1)
an
d (
x2,
y2),
the
ris
e is y
2 –
y1).
Se
e s
lope
.
Ru
n
The
ho
rizo
nta
l (left
an
d r
igh
t) c
ha
nge
or
diffe
ren
ce
be
twe
en
an
y t
wo
po
ints
on
a lin
e o
n a
co
ord
inate
p
lan
e (
i.e
., fo
r po
ints
(x
1,
y1)
an
d (
x2,
y2),
the
ru
n is x
2 –
x1).
See
slo
pe
.
Sc
att
er
Plo
t A
gra
ph
th
at
sh
ow
s t
he
“ge
ne
ral” r
ela
tio
nsh
ip b
etw
ee
n t
wo
se
ts o
f d
ata
. F
or
ea
ch p
oin
t th
at
is b
ein
g
plo
tted
th
ere
are
tw
o s
ep
ara
te p
iece
s o
f da
ta. It
sho
ws h
ow
on
e v
aria
ble
is a
ffe
cte
d b
y a
no
the
r.
Exa
mp
le o
f a s
ca
tte
r plo
t:
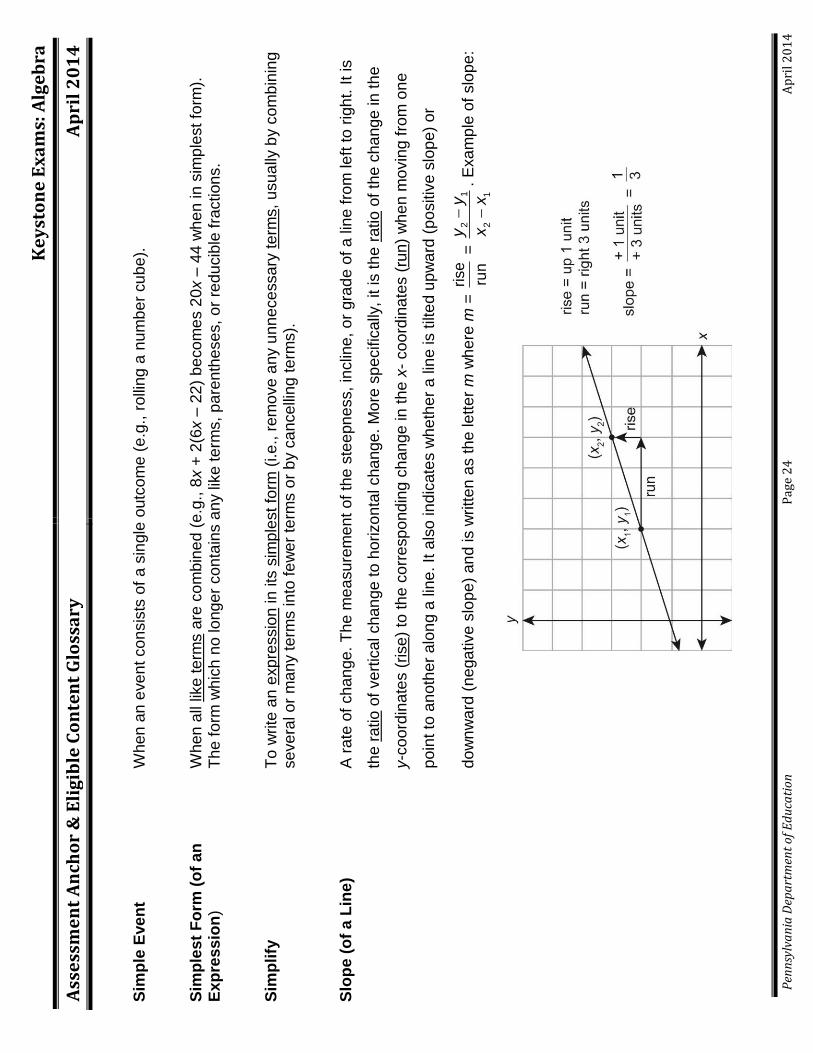
K
ey
sto
ne
Ex
am
s: A
lge
bra
Ass
ess
me
nt
An
cho
r &
Eli
gib
le C
on
ten
t G
loss
ary
A
pri
l 2
01
4
Pen
nsy
lva
nia
Dep
art
men
t o
f E
du
cati
on
Pag
e 2
4
Ap
ril 2
01
4
Sim
ple
Eve
nt
When a
n e
ve
nt co
nsis
ts o
f a s
ingle
outc
om
e (
e.g
., r
olli
ng a
nu
mb
er
cu
be
).
Sim
ple
st
Fo
rm (
of
an
E
xp
ress
ion
) W
hen a
ll lik
e te
rms a
re c
om
bin
ed
(e.g
., 8
x +
2(6
x –
22
) b
eco
me
s 2
0x –
44
wh
en
in
sim
ple
st
form
).
The
fo
rm w
hic
h n
o lo
nge
r co
nta
ins a
ny lik
e t
erm
s,
pa
ren
the
se
s,
or
red
ucib
le f
raction
s.
Sim
plify
T
o w
rite
an
exp
ressio
n in
its
sim
ple
st
form
(i.e
., r
em
ove
an
y u
nn
ece
ssa
ry t
erm
s,
usu
ally
by c
om
bin
ing
se
ve
ral o
r m
an
y t
erm
s into
fe
we
r te
rms o
r b
y c
an
ce
lling t
erm
s).
Slo
pe
(o
f a
Lin
e)
A r
ate
of
ch
an
ge
. T
he
me
asu
rem
en
t o
f th
e s
tee
pn
ess,
inclin
e, o
r gra
de
of
a lin
e f
rom
le
ft to
rig
ht.
It
is
the
ratio
of
ve
rtic
al chan
ge
to
ho
rizo
nta
l cha
nge
. M
ore
sp
ecific
ally
, it is t
he
ratio
of
the
cha
nge
in
th
e
yc
oo
rdin
ate
s (
rise
) to
th
e c
orr
esp
ond
ing c
hange
in
th
e x
- co
ord
ina
tes (
run
) w
he
n m
ovin
g f
rom
on
e
po
int to
an
oth
er
alo
ng a
lin
e. It
als
o in
dic
ate
s w
he
the
r a lin
e is t
ilte
d u
pw
ard
(p
ositiv
e s
lop
e)
or
do
wn
wa
rd (
ne
ga
tive
slo
pe
) an
d is w
ritt
en
as th
e le
tte
r m
wh
ere
m =
rise
run
=
21
21
yy
xx
.
Exa
mp
le o
f slo
pe:
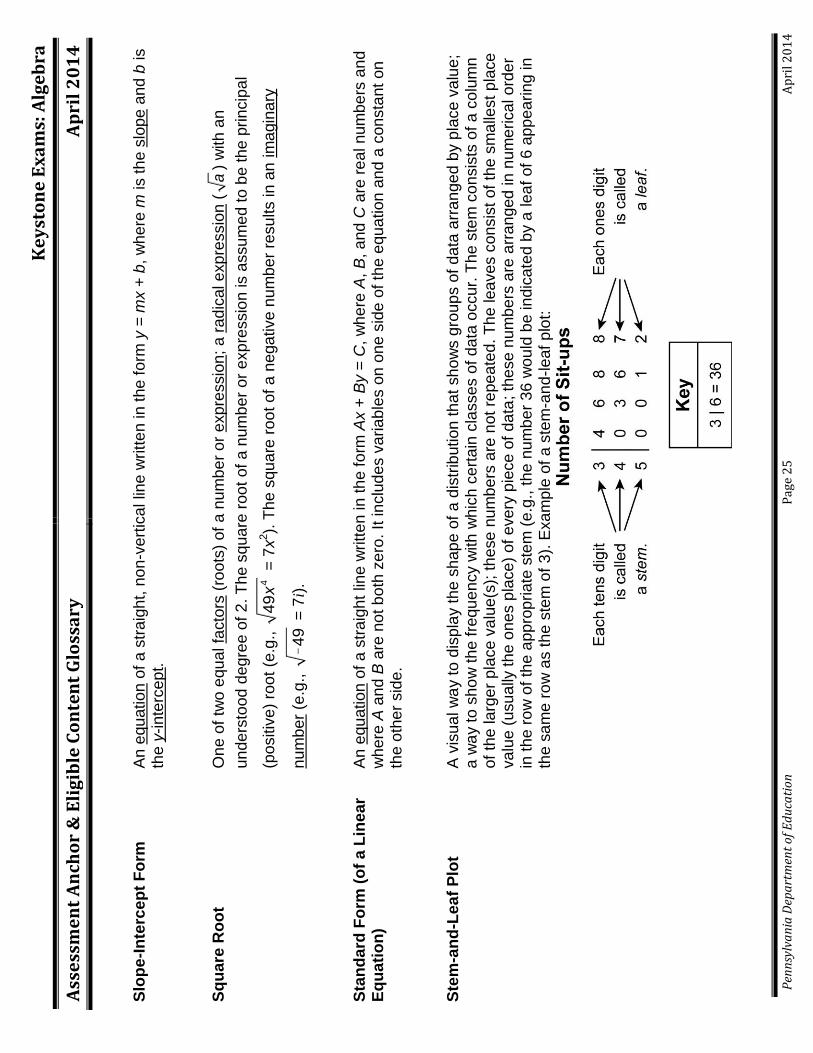
K
ey
sto
ne
Ex
am
s: A
lge
bra
Ass
ess
me
nt
An
cho
r &
Eli
gib
le C
on
ten
t G
loss
ary
A
pri
l 2
01
4
Pen
nsy
lva
nia
Dep
art
men
t o
f E
du
cati
on
Pag
e 2
5
Ap
ril 2
01
4
Slo
pe
-In
terc
ep
t F
orm
A
n e
qu
atio
n o
f a
str
aig
ht,
no
n-v
ert
ical lin
e w
ritt
en
in t
he
fo
rm y
= m
x +
b,
wh
ere
m is th
e s
lop
e a
nd
b is
the
yinte
rcep
t.
Sq
ua
re R
oo
t O
ne
of
two
equ
al fa
cto
rs (
roo
ts)
of
a n
um
be
r o
r e
xp
ressio
n;
a r
ad
ical e
xp
ressio
n (
a)
with
an
un
de
rsto
od
de
gre
e o
f 2
. T
he s
qu
are
roo
t of
a n
um
be
r or
exp
ressio
n is a
ssu
me
d t
o b
e th
e p
rin
cip
al
(po
sitiv
e)
roo
t (e
.g.,
4
49
x =
7x
2).
Th
e s
qu
are
roo
t of
a n
ega
tive
nu
mb
er
resu
lts in
an
im
agin
ary
nu
mb
er
(e.g
.,
_49
= 7
i).
Sta
nd
ard
Fo
rm (
of
a L
ine
ar
Eq
ua
tio
n)
An
equ
atio
n o
f a
str
aig
ht
line
writt
en
in
th
e f
orm
Ax +
By =
C,
wh
ere
A,
B, a
nd
C a
re r
ea
l num
be
rs a
nd
w
he
re A
an
d B
are
no
t b
oth
ze
ro.
It in
clu
de
s v
aria
ble
s o
n o
ne
sid
e o
f th
e e
qu
ation
an
d a
con
sta
nt
on
th
e o
the
r sid
e.
Ste
m-a
nd
-Lea
f P
lot
A v
isua
l w
ay t
o d
ispla
y t
he
sh
ap
e o
f a d
istr
ibutio
n th
at
sh
ow
s g
rou
ps o
f da
ta a
rra
nge
d b
y p
lace
va
lue
; a
wa
y t
o s
ho
w t
he
fre
qu
en
cy w
ith
wh
ich c
ert
ain
cla
sse
s o
f da
ta o
ccur.
Th
e s
tem
co
nsis
ts o
f a
co
lum
n
of
the
la
rge
r pla
ce v
alu
e(s
); t
he
se
nu
mb
ers
are
not
repe
ate
d.
Th
e lea
ve
s c
on
sis
t of
the
sm
alle
st
pla
ce
va
lue
(usu
ally
th
e o
ne
s p
lace
) of
eve
ry p
iece
of
da
ta; th
ese
nu
mb
ers
are
arr
an
ged
in
nu
me
rica
l o
rde
r in
th
e r
ow
of
the a
pp
rop
ria
te s
tem
(e.g
., t
he
nu
mb
er
36
wo
uld
be in
dic
ate
d b
y a
lea
f of
6 a
pp
ea
rin
g in
th
e s
am
e r
ow
as t
he
ste
m o
f 3
). E
xa
mp
le o
f a s
tem
-an
d-leaf
plo
t:

K
ey
sto
ne
Ex
am
s: A
lge
bra
Ass
ess
me
nt
An
cho
r &
Eli
gib
le C
on
ten
t G
loss
ary
A
pri
l 2
01
4
Pen
nsy
lva
nia
Dep
art
men
t o
f E
du
cati
on
Pag
e 2
6
Ap
ril 2
01
4
Su
bs
titu
tio
n
The
rep
lace
me
nt
of
a t
erm
or
va
ria
ble
in a
n e
xp
ressio
n o
r e
qu
ation
by a
no
the
r th
at
ha
s th
e s
am
e
va
lue
in o
rde
r to
sim
plif
y o
r eva
lua
te t
he
exp
ressio
n o
r equ
ation
.
Sys
tem
of
Lin
ea
r E
qu
ati
on
s
A s
et of
two
or
mo
re lin
ea
r equ
atio
ns w
ith
th
e s
am
e v
aria
ble
s.
The
so
lution t
o a
syste
m o
f lin
ea
r e
qu
atio
ns m
ay b
e f
ou
nd
by lin
ea
r com
bin
atio
n,
sub
stitu
tio
n, o
r gra
ph
ing
. A
syste
m o
f tw
o lin
ea
r e
qu
atio
ns w
ill e
ith
er
have
one
so
lutio
n, in
finitely
ma
ny s
olu
tion
s,
or
no
so
lutio
ns.
Sys
tem
of
Lin
ea
r In
eq
uali
ties
Tw
o o
r m
ore
lin
ea
r in
equ
alit
ies w
ith
th
e s
am
e v
aria
ble
s. S
om
e s
yste
ms o
f in
equ
alit
ies m
ay inclu
de
e
qu
atio
ns a
s w
ell
as in
equ
alit
ies.
The
so
lutio
n r
egio
n m
ay b
e c
lose
d o
r bo
un
de
d b
ecau
se
the
re a
re
line
s o
n a
ll sid
es,
wh
ile o
the
r solu
tion
s m
ay b
e o
pe
n o
r u
nb
ou
nde
d.
Sys
tem
s o
f E
qu
ati
on
s
A s
et of
two
or
mo
re e
qu
atio
ns c
on
tain
ing a
se
t of
co
mm
on
va
ria
ble
s.
Te
rm
A p
art
of
an
alg
eb
raic
exp
ressio
n.
Term
s a
re s
ep
ara
ted
by e
ith
er
an
ad
ditio
n s
ym
bo
l (+
) or
a
su
btr
action
sym
bo
l (–
). I
t can
be
a n
um
be
r, a
va
ria
ble
, o
r a p
rod
uct
of
a n
um
be
r an
d o
ne
or
mo
re
va
ria
ble
s (
e.g
., in t
he
exp
ressio
n 4
x2+
6y,
4x
2 a
nd
6y a
re b
oth
te
rms).
Te
rmin
ati
ng
De
cim
al
A d
ecim
al w
ith
a f
inite
nu
mb
er
of
dig
its.
A d
ecim
al fo
r w
hic
h t
he
div
isio
n o
pe
ration
resu
lts in e
ith
er
rep
ea
tin
g z
ero
es o
r re
pe
atin
g n
ine
s (
e.g
., 0
.37
500
0…
= 0
.375
, 0.1
99
9…
= 0
.2).
It is
ge
ne
rally
wri
tte
n
to t
he
la
st n
on
-ze
ro p
lace
va
lue
, bu
t ca
n a
lso
be
writt
en
with
ad
ditio
na
l ze
roe
s in
sm
alle
r pla
ce
va
lue
s
as n
ee
ded
(e.g
., 0
.25
ca
n a
lso
be w
ritt
en
as 0
.25
00
). A
ll te
rmin
ating d
ecim
als
are
ratio
na
l nu
mb
ers
.
Tri
no
mia
l A
po
lyn
om
ial w
ith
th
ree
un
like t
erm
s (
e.g
., 7
a +
4b
+ 9
c).
Ea
ch t
erm
is a
mo
no
mia
l, a
nd
the
mo
no
mia
ls a
re jo
ine
d b
y a
n a
dd
itio
n s
ym
bo
l (+
) or
a s
ub
tractio
n s
ym
bo
l (–
). I
t is
co
nsid
ere
d a
n
alg
eb
raic
exp
ressio
n.

K
ey
sto
ne
Ex
am
s: A
lge
bra
Ass
ess
me
nt
An
cho
r &
Eli
gib
le C
on
ten
t G
loss
ary
A
pri
l 2
01
4
Pen
nsy
lva
nia
Dep
art
men
t o
f E
du
cati
on
Pag
e 2
7
Ap
ril 2
01
4
Un
it R
ate
A
rate
in
wh
ich t
he
se
co
nd
(in
de
pe
nde
nt)
quan
tity
of
the
ratio
is 1
(e.g
., 6
0 w
ord
s p
er
min
ute
, $4
.50
p
er
pou
nd
, 21
stu
den
ts p
er
cla
ss).
Va
ria
ble
A
le
tte
r o
r sym
bo
l u
se
d t
o r
ep
rese
nt
an
y o
ne
of
a g
iven s
et of
nu
mb
ers
or
oth
er
ob
jects
(e
.g.,
in t
he
equ
atio
n y
= x
+ 5
, th
e y
an
d x
are
va
ria
ble
s).
Sin
ce
it
ca
n ta
ke
on
diffe
ren
t va
lue
s,
it is th
e o
ppo
site
of
a c
on
sta
nt.
Wh
ole
Nu
mb
er
A n
atu
ral nu
mb
er
or
ze
ro.
An
y n
um
be
r fr
om
th
e s
et of
nu
mb
ers
re
pre
se
nte
d b
y {
0,
1,
2, 3
, …
}.
So
me
tim
es it
is r
efe
rred
to
as a
“no
n-n
ega
tive inte
ge
r”.
x-A
xis
T
he
ho
rizo
nta
l n
um
be
r lin
e o
n a
co
ord
ina
te p
lan
e th
at
inte
rsects
with
a v
ert
ical n
um
be
r lin
e, th
e
ya
xis
; th
e lin
e w
ho
se
equ
atio
n is y
= 0
. T
he
x-a
xis
co
nta
ins a
ll th
e p
oin
ts w
ith
a z
ero
y-c
oo
rdin
ate
(e
.g.,
(5,
0))
.
x-I
nte
rce
pt(
s)
The
x-c
oo
rdin
ate
(s)
of
the
po
int(
s)
at
wh
ich t
he
gra
ph
of
an
equ
atio
n c
rosse
s t
he
x-a
xis
(i.e
., t
he
va
lue
(s)
of
the x
-co
ord
ina
te w
he
n y
= 0
). T
he
so
lution
(s)
or
roo
t(s)
of
an
equ
atio
n t
ha
t is
set e
qu
al
to 0
.
y-A
xis
T
he
ve
rtic
al n
um
be
r lin
e o
n a
co
ord
ina
te p
lane
tha
t in
ters
ects
with
a h
orizo
nta
l n
um
be
r lin
e, th
e
xa
xis
; th
e lin
e w
ho
se
equ
atio
n is x
= 0
. T
he
y-a
xis
co
nta
ins a
ll th
e p
oin
ts w
ith
a z
ero
x-c
oo
rdin
ate
(e
.g.,
(0,
7))
.
y-I
nte
rce
pt(
s)
The
y-c
oo
rdin
ate
(s)
of
the
po
int(
s)
at
wh
ich t
he
gra
ph
of
an
equ
atio
n c
rosse
s t
he
y-
axis
(i.e.,
the
va
lue
(s)
of
the y
-co
ord
ina
te w
he
n x
= 0
). F
or
a lin
ea
r e
qu
atio
n in s
lop
e-inte
rcep
t fo
rm (
y =
mx +
b),
it is
in
dic
ate
d b
y b
.

Cover photo © Hill Street Studios/Harmik Nazarian/Blend Images/Corbis.
Copyright © 2014 by the Pennsylvania Department of Education. The materials contained in this publication may be
duplicated by Pennsylvania educators for local classroom use. This permission does not extend to the duplication
of materials for commercial use.
Keystone Exams: Algebra I
Assessment Anchors and Eligible Contentwith Sample Questions and Glossary
April 2014