Embed Size (px)
Citation preview
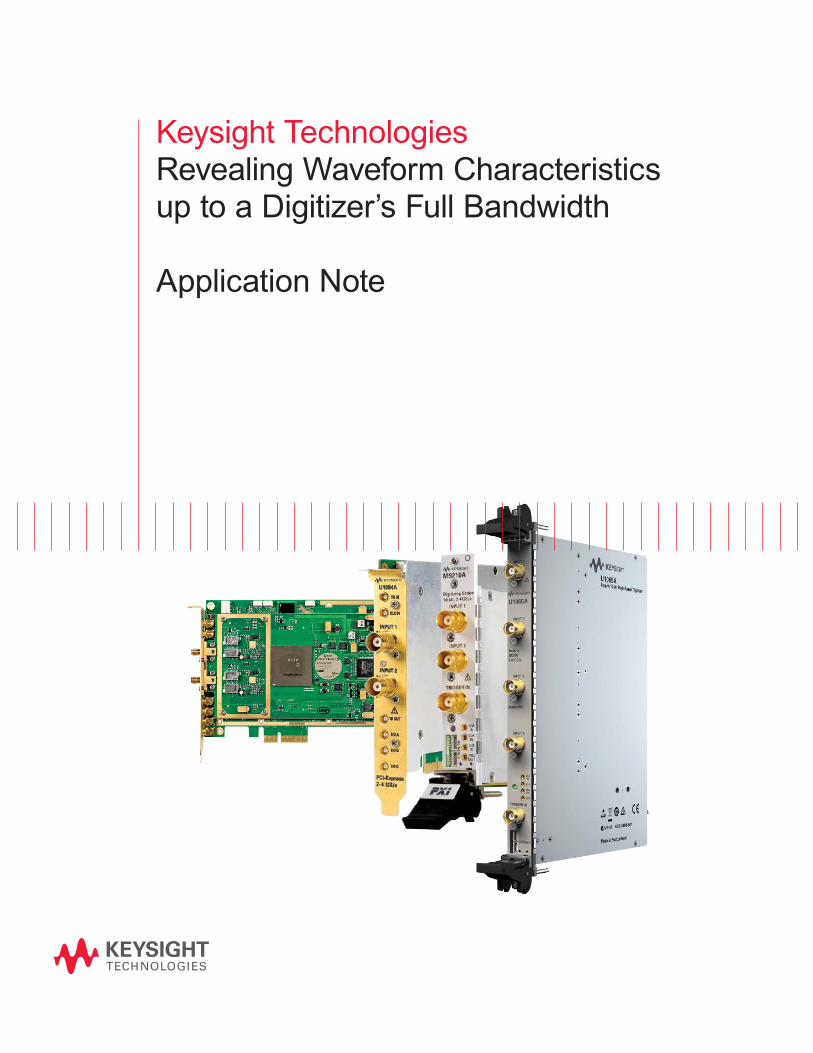
Keysight TechnologiesRevealing Waveform Characteristics up to a Digitizer’s Full Bandwidth
Application Note
Introduction
Increasing the effective sampling rate when measuring repetitive signals
To acquire a signal accurately and without aliasing using a discrete sampling system such as a digitizer
or oscilloscope, Nyquist showed that the sampling rate must be at least twice the rate of the highest
frequency component in the measured signal. However, digitizer specifications often quote bandwidth
not to this Nyquist frequency but instead to the system analog bandwidth. This value describes signal
attenuation (to 3 dB) as a function of its frequency. This is often shown as a Bode plot.
When working with fast repetitive signals, in which the fastest signal components are more than half
the frequency of the maximum sampling rate of the acquisition system, it may be possible to artificially
increase the effective sampling rate of acquisition. This can accurately reveal waveform characteristics
beyond the instantaneous Nyquist frequency, up to the full analog bandwidth of the digitizer.
03 Keysight Revealing Waveform Characteristics up to a Digitizer’s Full Bandwidth Application Note
Measur ing h igher- f requency waveforms
One way to enable a higher effective sampling rate is
called random interleaved sampling or RIS (pronounced
“riss”). This method creates a composite waveform
by combining data from many lower-sampling-rate
waveforms of the same signal, recorded out of phase
with one another. RIS works only with stable repetitive
waveforms that can be accurately acquired with a well-
defined trigger position for each repeated acquisition.
The oversampling factor will be an integer multiple of
the real-time (single-shot) sampling rate.
To create an effective rate that exceeds the analog-
to-digital converter (ADC) sampling rate, RIS needs a
mechanism that accurately positions trigger events that
fall between the sample clocks. This can be achieved
with trigger time interpolation (TTI), which accurately
positions trigger arrival to within a few picoseconds.
This TTI resolution determines the maximum
oversampling factor and the oversampling accuracy.
Because TTI is implemented in most Keysight digitizers,
RIS is easily implemented in user-written software.
TTI enables RIS, which can be used to create an accurate
representation of a signal with the maximum frequency
reaching up to the analog bandwidth limit of the digitizer.
However, this process will increase the time required for
waveform acquisition because the signal waveform of
interest must be repetitively captured, and the new sam-
pling interval components acquired bin by bin.
Descr ib ing the process
This note begins with a brief review of the conventional
sampling approach that rapidly and sequentially builds
a data record. It then discusses how to achieve a higher
effective sampling rate with TTI and RIS. The note includes
an example code listing as well as references that offer
more information on RIS sampling and the use of TTI.
04 Keysight Revealing Waveform Characteristics up to a Digitizer’s Full Bandwidth Application Note
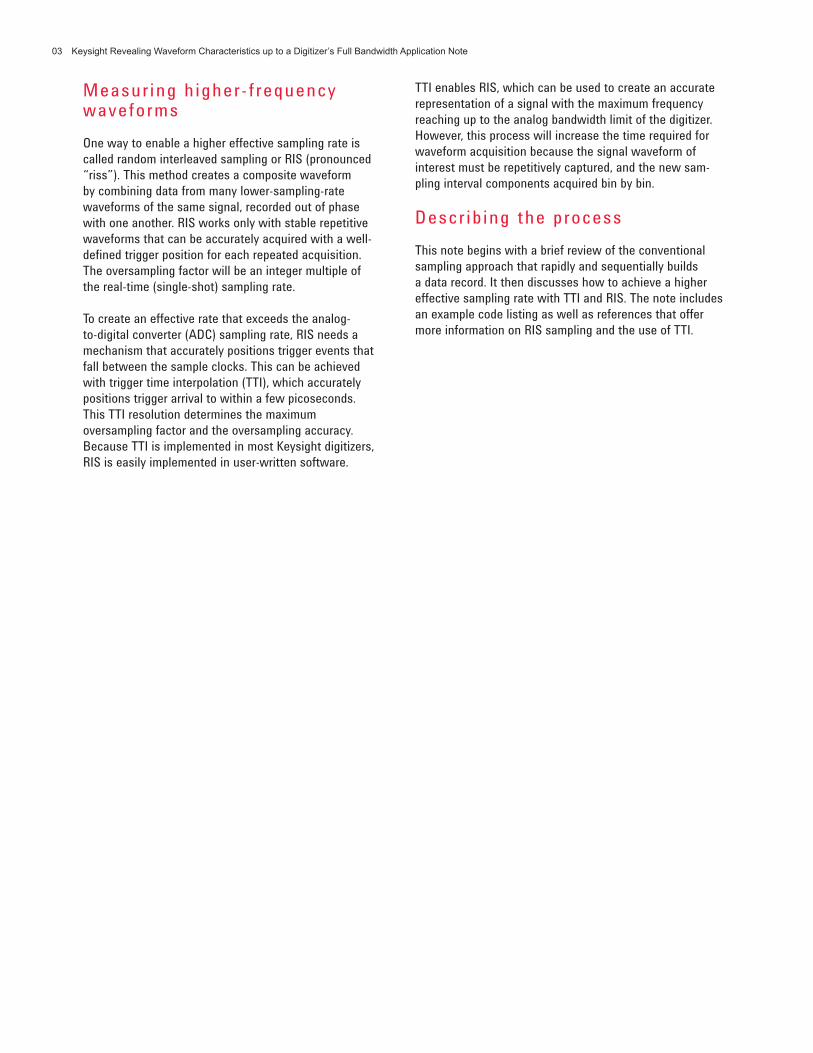
In the conventional approach, a digitizer rapidly and
sequentially builds a data record that contains a specific
number of evenly spaced bins. This is accomplished at
a precise sample rate with sample-and-hold technology
capturing successive waveform values (Figure 1). These
are converted into digital representation using an ADC and
the results are accumulated in the data record (Table 1).
Figure 1. Digitizers usually build a data record with a sequential
set of evenly spaced samples
Reviewing convent ional sampl ing
Bin number Time (ns) 8-bit ADC data
0 0.0 128
1 0.5 139
2 1.0 150
3 1.5 161
4 2.0 172
5 2.5 182
6 3.0 192
7 3.5 201
8 4.0 209
9 4.5 217
Table 1. First ten bins of a data record with 2 GSa/s sampling on
a sine wave as shown in figure 1.
The maximum bandwidth of a measured signal that
can be resolved with a sampling system is the Nyquist
frequency, which is half the sampling rate of the digitizer1.
Conventional sampling quickly builds the data record by
proceeding directly from bin 0 to bin N. The data record is
then ready for further handling: display in the time domain,
conversion into frequency spectra via fast Fourier trans-
form (FFT), demodulation analysis, and so on.
1. It is common practice, however, to use a factor of 2.5, which
provides some margin.
05 Keysight Revealing Waveform Characteristics up to a Digitizer’s Full Bandwidth Application Note
To achieve a higher effective sampling rate, users can
manipulate the sampling process through successive
acquisitions of a repetitive waveform in which there is no
correlation between the ADC clock and the external signal.
With this method, the ADC captures different points on
the waveform during successive cycles of acquisition and
creates bins within a “time width” that is equivalent to the
ideal sample interval. You can think of these as “sub-bins”
that exist within (and subdivide) the bins that occur in
conventional sampling.
Understanding RIS
RIS, a form of equivalent-time sampling, increases repeti-
tive-signal sample rates by creating a composite waveform
with sampled data combined from multiple lower-sampling-
rate waveforms. However, this approach works only with
repetitive waveforms that have a well-defined trigger
point. RIS will potentially identify waveform characteristics
up to the digitizer’s analog limit, rather than the Nyquist
frequency as defined by the instantaneous sampling rate.
In Keysight software code, RIS is typically implemented
through use of the horizontal waveform position (“hor-
Pos”) values obtained from a digitizer (see page 9 for an
example code listing). The program gradually fills all of the
bins in the data record with horPos values. On the fly, the
program selects and orders the acquired data segments
into pre-defined bins (the sub-bins). Once the entire data
record is filled, the data can be displayed as a single high-
sample-rate waveform.
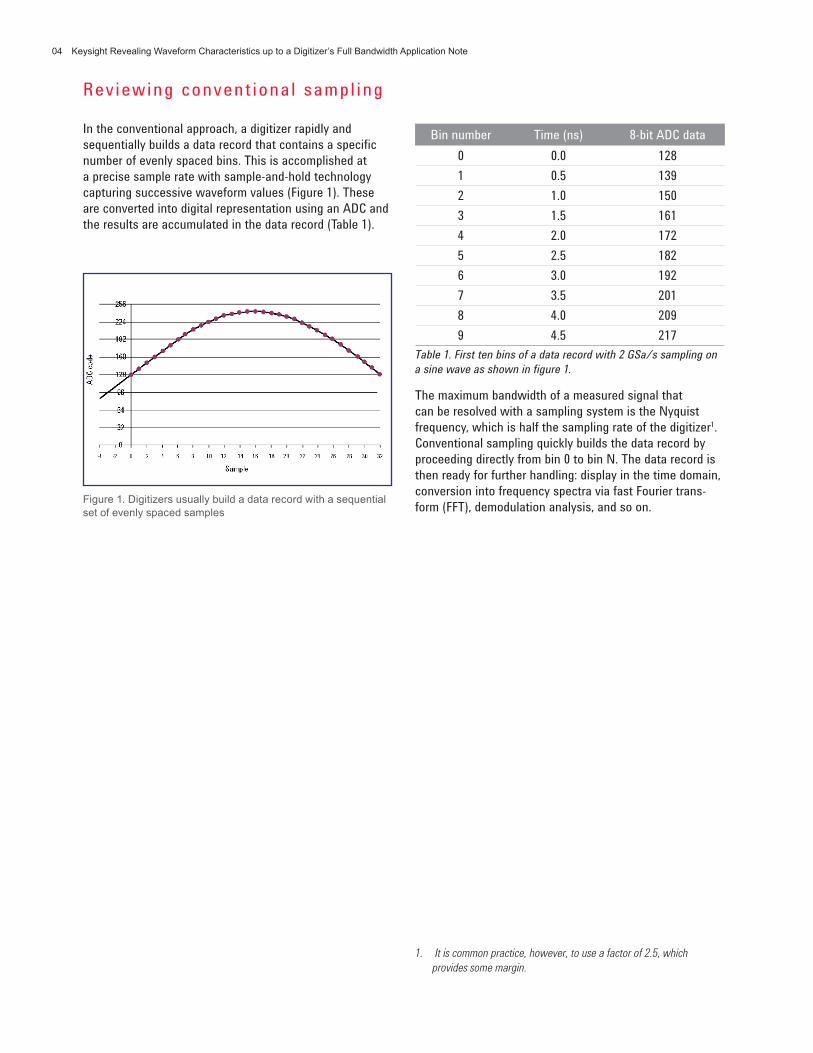
Figure 2. Oversampling by a factor of 4 within a 1-ns sampling
interval yields an effective sampling rate of 4 GSa/s
Achiev ing a h igher ef fect ive sampl ing rate
si � � ��
of � �
To determine the effective sampling rate, the first step is
to determine the oversampling factor (of ), or the ratio of
the RIS effective sampling rate to the real-time sampling
rate. The of is an integer multiple of the real-time sam-
pling rate with the horPos value in the sampling interval,
or (si) range. Figure 2 shows the relationship between
conventional and RIS-based bins, for a digitizer operating
at 1 GSa/s, oversampling by a factor of four (of = 4) within
a 1-ns sampling interval (si = 1 ns) creates four bins per
conventional bin and provides an effective sample rate of
4 GSa/s.
The underlying hypothesis is that the ADC sample clock is
not correlated with the external (measured) signal. If this
is true, the horPos values will be random and uniformly
distributed over the allowed interval. You can improve
RIS acquisition accuracy if the time differences between
accepted horPos values are located within the ideal RIS
sampling interval (si / of ). Further, the horPos values
must be nearly centered in each bin, with the allowed
range around the center determined by the oversampling
accuracy (oa) parameter.
06 Keysight Revealing Waveform Characteristics up to a Digitizer’s Full Bandwidth Application Note
Enabling RIS with TTI
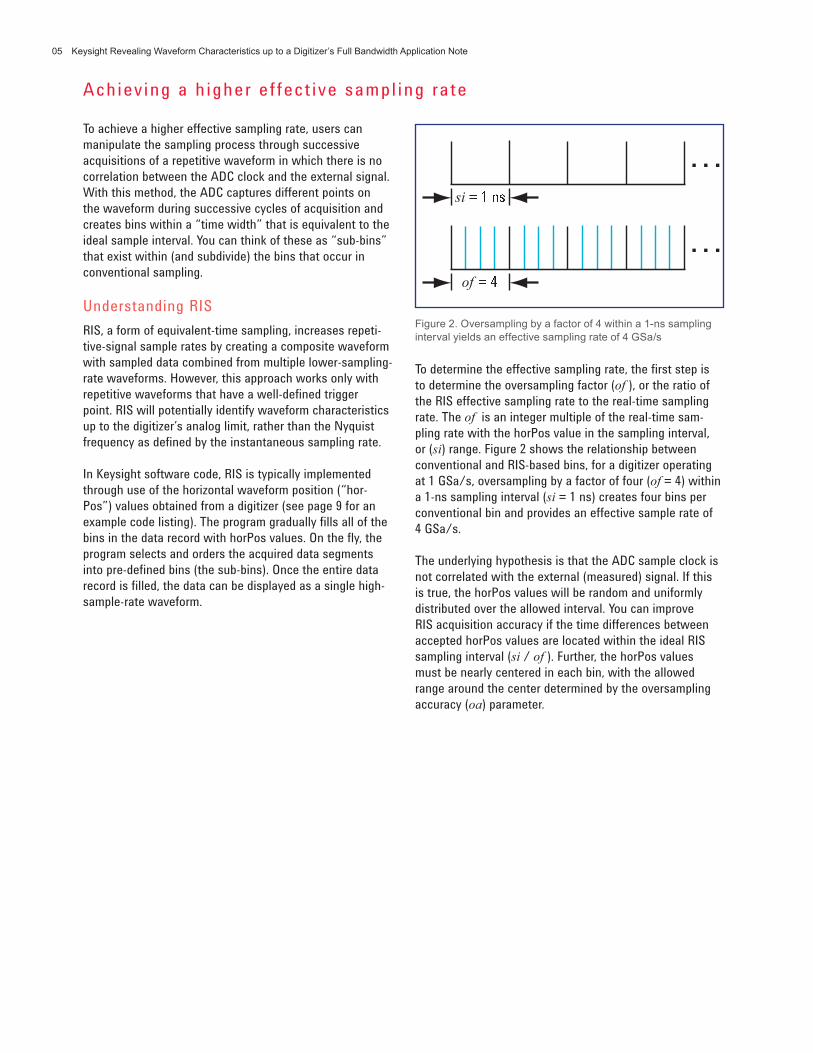
When using a digitizer, there are three instrument setup
variables with which to position the acquired waveform in
time:
• sampInterval is the sampling interval, or inverse of the
sampling frequency
• nbrSamples is the number of samples to acquire
• delayTime is the nominal trigger delay
These values are highlighted in Figure 3.
Figure 3. The acquired waveform can be positioned in time us-
ing sampling interval and delay time
Conventionally, the nominal trigger delay is measured rela-
tive to the beginning of the trace, or the left edge of a real
or virtual display grid. It represents the time from the trig-
ger to the start of waveform recording. A positive number
indicates a post-trigger acquisition, or when the reading
begins after the trigger. Conversely, a negative number is
a pre-trigger acquisition. Keep in mind the acquisition runs
before a trigger occurs; the delayTime controls the time
between the trigger and when the acquisition is stopped.
Because triggers typically occur asynchronously to the
sampling clock, the time between the trigger and next
sample occurs at a random time between zero and samp-
Interval. However, the true time reference point for any
waveform acquisition is not the sampling time but rather
the trigger point, which is attached to a specific feature of
the waveform (e.g., a positive- or negative-going transition
to a specific level).
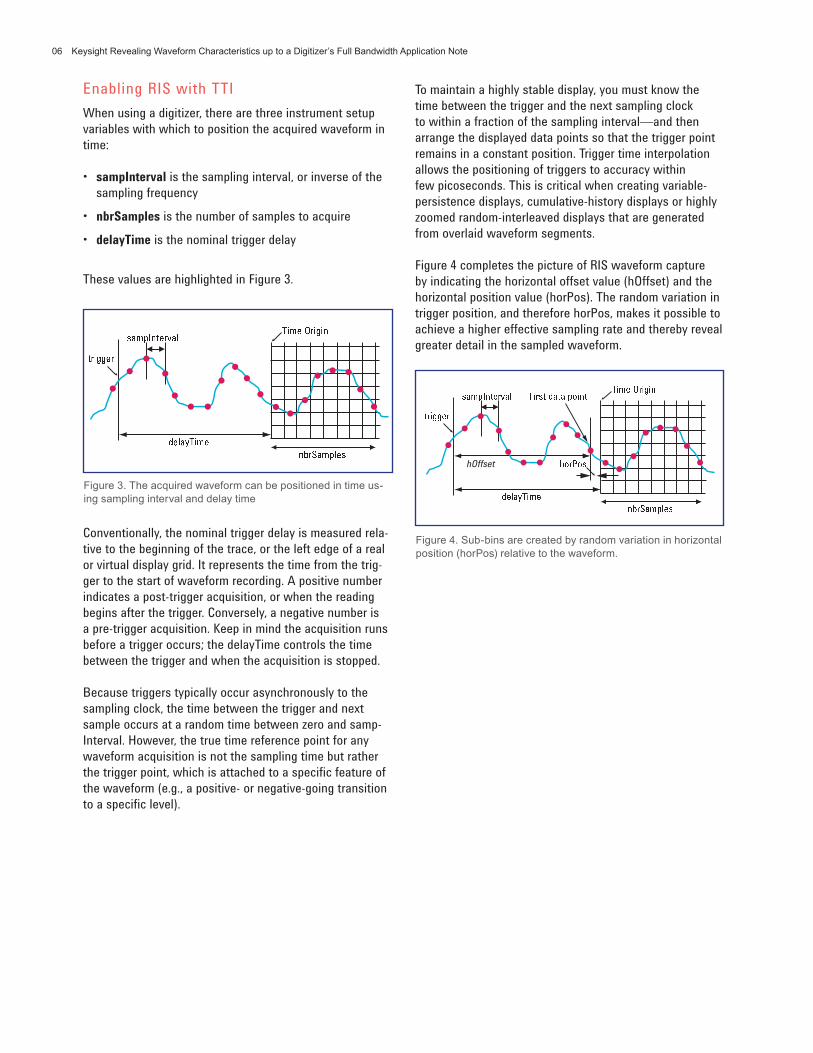
Figure 4. Sub-bins are created by random variation in horizontal
position (horPos) relative to the waveform.
������������ ���
�������
�� ����������� ������
��������� !"#��$��%
&"�''�"
%��$( &�")�� *�"%& ��&� $+� &���� ,"�'�
hOffset -+".+%
To maintain a highly stable display, you must know the
time between the trigger and the next sampling clock
to within a fraction of the sampling interval—and then
arrange the displayed data points so that the trigger point
remains in a constant position. Trigger time interpolation
allows the positioning of triggers to accuracy within
few picoseconds. This is critical when creating variable-
persistence displays, cumulative-history displays or highly
zoomed random-interleaved displays that are generated
from overlaid waveform segments.
Figure 4 completes the picture of RIS waveform capture
by indicating the horizontal offset value (hOffset) and the
horizontal position value (horPos). The random variation in
trigger position, and therefore horPos, makes it possible to
achieve a higher effective sampling rate and thereby reveal
greater detail in the sampled waveform.
07 Keysight Revealing Waveform Characteristics up to a Digitizer’s Full Bandwidth Application Note
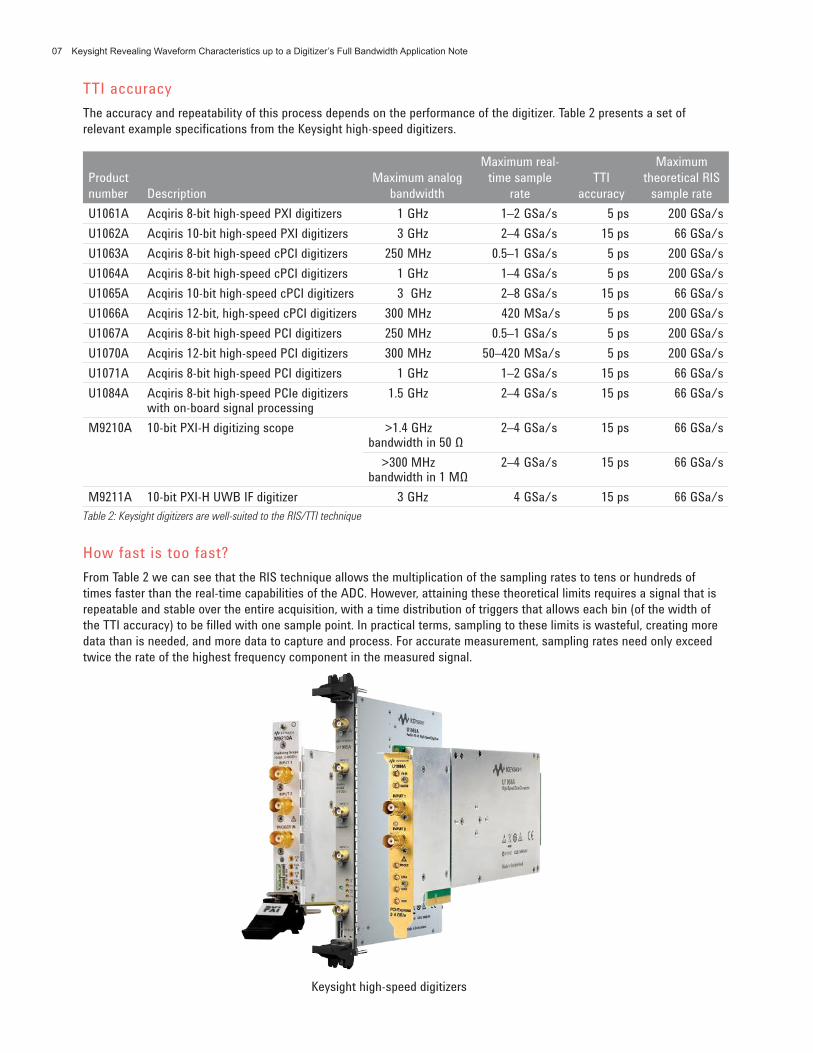
TTI accuracy
The accuracy and repeatability of this process depends on the performance of the digitizer. Table 2 presents a set of
relevant example specifications from the Keysight high-speed digitizers.
How fast is too fast?
From Table 2 we can see that the RIS technique allows the multiplication of the sampling rates to tens or hundreds of
times faster than the real-time capabilities of the ADC. However, attaining these theoretical limits requires a signal that is
repeatable and stable over the entire acquisition, with a time distribution of triggers that allows each bin (of the width of
the TTI accuracy) to be filled with one sample point. In practical terms, sampling to these limits is wasteful, creating more
data than is needed, and more data to capture and process. For accurate measurement, sampling rates need only exceed
twice the rate of the highest frequency component in the measured signal.
Product
number Description
Maximum analog
bandwidth
Maximum real-
time sample
rate
TTI
accuracy
Maximum
theoretical RIS
sample rate
U1061A Acqiris 8-bit high-speed PXI digitizers 1 GHz 1–2 GSa/s 5 ps 200 GSa/s
U1062A Acqiris 10-bit high-speed PXI digitizers 3 GHz 2–4 GSa/s 15 ps 66 GSa/s
U1063A Acqiris 8-bit high-speed cPCI digitizers 250 MHz 0.5–1 GSa/s 5 ps 200 GSa/s
U1064A Acqiris 8-bit high-speed cPCI digitizers 1 GHz 1–4 GSa/s 5 ps 200 GSa/s
U1065A Acqiris 10-bit high-speed cPCI digitizers 3 GHz 2–8 GSa/s 15 ps 66 GSa/s
U1066A Acqiris 12-bit, high-speed cPCI digitizers 300 MHz 420 MSa/s 5 ps 200 GSa/s
U1067A Acqiris 8-bit high-speed PCI digitizers 250 MHz 0.5–1 GSa/s 5 ps 200 GSa/s
U1070A Acqiris 12-bit high-speed PCI digitizers 300 MHz 50–420 MSa/s 5 ps 200 GSa/s
U1071A Acqiris 8-bit high-speed PCI digitizers 1 GHz 1–2 GSa/s 15 ps 66 GSa/s
U1084A Acqiris 8-bit high-speed PCIe digitizers with on-board signal processing
1.5 GHz 2–4 GSa/s 15 ps 66 GSa/s
M9210A 10-bit PXI-H digitizing scope >1.4 GHz bandwidth in 50 Ω
2–4 GSa/s 15 ps 66 GSa/s
>300 MHz bandwidth in 1 MΩ
2–4 GSa/s 15 ps 66 GSa/s
M9211A 10-bit PXI-H UWB IF digitizer 3 GHz 4 GSa/s 15 ps 66 GSa/s
Table 2: Keysight digitizers are well-suited to the RIS/TTI technique
Keysight high-speed digitizers
08 Keysight Revealing Waveform Characteristics up to a Digitizer’s Full Bandwidth Application Note
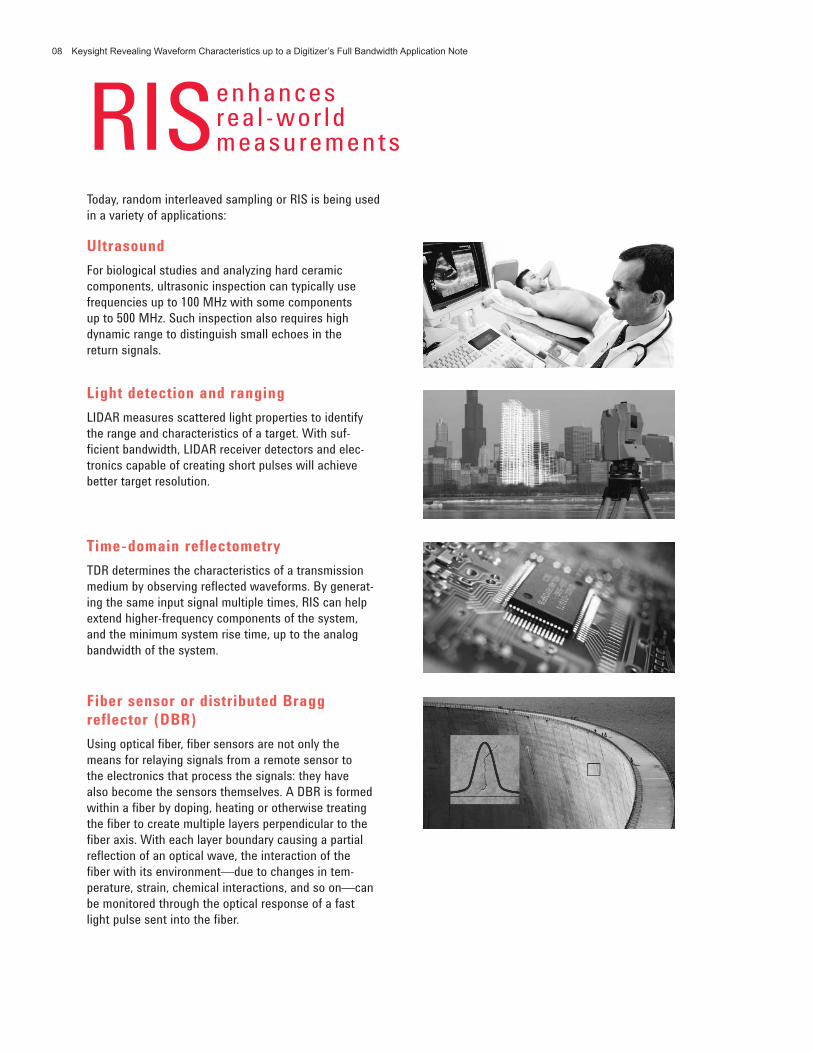
LightdetectionandrangingLIDAR measures scattered light properties to identify
the range and characteristics of a target. With suf-
ficient bandwidth, LIDAR receiver detectors and elec-
tronics capable of creating short pulses will achieve
better target resolution.
Today, random interleaved sampling or RIS is being used
in a variety of applications:
UltrasoundFor biological studies and analyzing hard ceramic
components, ultrasonic inspection can typically use
frequencies up to 100 MHz with some components
up to 500 MHz. Such inspection also requires high
dynamic range to distinguish small echoes in the
return signals.
Time-domainreflectometryTDR determines the characteristics of a transmission
medium by observing reflected waveforms. By generat-
ing the same input signal multiple times, RIS can help
extend higher-frequency components of the system,
and the minimum system rise time, up to the analog
bandwidth of the system.
FibersensorordistributedBraggreflector(DBR)Using optical fiber, fiber sensors are not only the
means for relaying signals from a remote sensor to
the electronics that process the signals: they have
also become the sensors themselves. A DBR is formed
within a fiber by doping, heating or otherwise treating
the fiber to create multiple layers perpendicular to the
fiber axis. With each layer boundary causing a partial
reflection of an optical wave, the interaction of the
fiber with its environment—due to changes in tem-
perature, strain, chemical interactions, and so on—can
be monitored through the optical response of a fast
light pulse sent into the fiber.
enhances rea l -wor ld measurementsRIS
09 Keysight Revealing Waveform Characteristics up to a Digitizer’s Full Bandwidth Application Note
● ● ● ● ● ● ● ● ● ● ● ● ● ● ● ●●
●
●
●
● ● ● ●● ● ● ● ● ● ●
▲ ▲ ▲ ▲ ▲ ▲ ▲ ▲▲ ▲ ▲ ▲ ▲ ▲ ▲ ▲▲
▲
▲
▲
▲▲
▲ ▲▲
▲ ▲ ▲▲ ▲ ▲
■ ■
■■
/0 /123 /1 /423 0 423 1 123
ns
U1064A digitizer at 1 GSa/s
Step signal (150 ps, 800 mVpp)
▲
■
● With RIS: oversampling factor 10 - oversampling accuracy 20
With RIS: oversampling factor 10 - oversampling accuracy 100
Without RIS
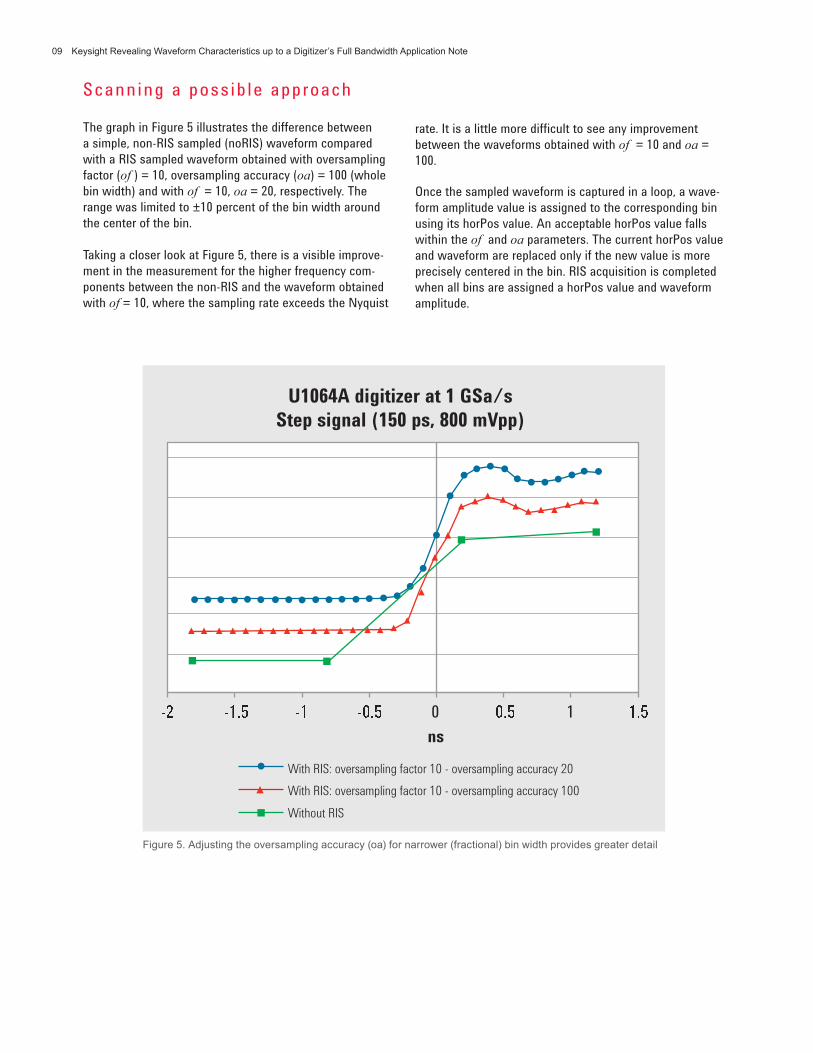
The graph in Figure 5 illustrates the difference between
a simple, non-RIS sampled (noRIS) waveform compared
with a RIS sampled waveform obtained with oversampling
factor (of ) = 10, oversampling accuracy (oa) = 100 (whole
bin width) and with of = 10, oa = 20, respectively. The
range was limited to ±10 percent of the bin width around
the center of the bin.
Taking a closer look at Figure 5, there is a visible improve-
ment in the measurement for the higher frequency com-
ponents between the non-RIS and the waveform obtained
with of = 10, where the sampling rate exceeds the Nyquist
Figure 5. Adjusting the oversampling accuracy (oa) for narrower (fractional) bin width provides greater detail
Once the sampled waveform is captured in a loop, a wave-
form amplitude value is assigned to the corresponding bin
using its horPos value. An acceptable horPos value falls
within the of and oa parameters. The current horPos value
and waveform are replaced only if the new value is more
precisely centered in the bin. RIS acquisition is completed
when all bins are assigned a horPos value and waveform
amplitude.
Scanning a possible approach
rate. It is a little more difficult to see any improvement
between the waveforms obtained with of = 10 and oa =
100.

010 Keysight Revealing Waveform Characteristics up to a Digitizer’s Full Bandwidth Application Note
The final steps are to interleave the acquired horPos values in the correct order and then build a waveform with a time
increment (ti) value between samples, equal to the sampling interval (si) divided by oversampling factor (of ):
The following code sample demonstrates one way to acquire and build a complete set of bins:
011 Keysight Revealing Waveform Characteristics up to a Digitizer’s Full Bandwidth Application Note
Conclus ion
When working with fast repetitive signals, TTI-enabled RIS can reveal waveform characteristics up to the full
analog bandwidth limit of the digitizer. This can be especially useful when the analog bandwidth of the digitizer
is higher than the Nyquist frequency at the maximum sample rate of the digitizing channel.
The TTI mechanism accurately positions the acquisition trigger between sample clocks and records that data
with each waveform. This added timing accuracy makes it possible to acquire repetitive waveforms and create
sub-bins of time (with associated data) within the conventional time bins of the ADC. The net result is an
effective sampling rate that is an integer multiple of the digitizer’s maximum sampling rate. In this way the full
analog bandwidth of a digitizer can be used, even when the maximum real-time sampling rate of the digitizer
defines an inadequate Nyquist frequency.
This approach has been leveraged in applications such as ultrasound, LIDAR, TDR and fiber sensors that utilize
repetitive waveforms and can benefit from greater detail in the waveform display.
To learn more about Keysight digitizers that support RIS and TTI, please visit
www.keysight.com/find/embedded-digitizers
012 Keysight Revealing Waveform Characteristics up to a Digitizer’s Full Bandwidth Application Note
Related informat ion
Product Brochures
• Keysight U1061A: Acqiris 8-bit high-speed PXI digitizers, Keysight publication 5989-7361EN
http://cp.literature.keysight.com/litweb/pdf/5989-7361EN.pdf
• Keysight U1062A: Acqiris 10-bit high-speed PXI digitizers, Keysight publication 5989-7111EN
http://cp.literature.keysight.com/litweb/pdf/5989-7111EN.pdf
• Keysight U1064A: Acqiris 8-bit high-speed cPCI digitizers, Keysight publication 5989-7444EN
http://cp.literature.keysight.com/litweb/pdf/5989-7444EN.pdf
• Keysight U1065A: Acqiris 10-bit high-speed cPCI digitizers, Keysight publication 5989-7443EN
http://cp.literature.keysight.com/litweb/pdf/5989-7443EN.pdf
• Keysight U1066A: Acqiris 12-bit high-speed cPCI digitizers, Keysight publication 5989-7115EN
http://cp.literature.keysight.com/litweb/pdf/5989-7115EN.pdf
• Keysight U1067A: Acqiris 8-bit high-speed PCI digitizers, Keysight publication 5989-7121EN
http://cp.literature.keysight.com/litweb/pdf/5989-7121EN.pdf
• Keysight U1070A: Acqiris 12-bit high-speed PCI digitizers, Keysight publication 5989-7114EN
http://cp.literature.keysight.com/litweb/pdf/5989-7114EN.pdf
• Keysight U1071A: Acqiris 8-bit high-speed PCI digitizers, Keysight publication 5989-7100EN
http://cp.literature.keysight.com/litweb/pdf/5989-7100EN.pdf
• Keysight U1084A: Acqiris 8-bit high-speed PCIe digitizers with on-board signal processing, Keysight publication 5990-4316EN
http://cp.literature.keysight.com/litweb/pdf/5990-4316EN.pdf
• Keysight M9210A: 10-bit PXI-H digitizing scope, Keysight publication 5990-6462EN
• http://cp.literature.keysight.com/litweb/pdf/5990-6462EN.pdf
• Keysight M9211A: 10-bit PXI-H UWB IF digitizer, Keysight publication 5990-6463EN
• http://cp.literature.keysight.com/litweb/pdf/5990-6463EN.pdf
On the Web
• www.keysight.com/find/u1061a
• www.keysight.com/find/u1062a
• www.keysight.com/find/u1063a
• www.keysight.com/find/u1064a
• www.keysight.com/find/u1065a
• www.keysight.com/find/u1066a
• www.keysight.com/find/u1067a
• www.keysight.com/find/u1070a
• www.keysight.com/find/u1071a
• www.keysight.com/find/u1084a
• www.keysight.com/find/m9210a
• www.keysight.com/find/m9211a
myKeysight
www.keysight.com/find/mykeysight
A personalized view into the information most relevant to you.
www.axiestandard.org
AdvancedTCA® Extensions for Instrumentation and Test (AXIe) is an
open standard that extends the AdvancedTCA for general purpose and
semiconductor test. Keysight is a founding member of the AXIe consortium.
www.pxisa.org
PCI eXtensions for Instrumentation (PXI) modular instrumentation delivers
a rugged, PC-based high-performance measurement and automation
system.
Keysight Channel Partners
www.keysight.com/find/channelpartners
Get the best of both worlds: Keysight’s measurement expertise and product
breadth, combined with channel partner convenience.
PICMG and the PICMG logo; CompactPCI and the CompactPCI logo; ATCA, AdvancedTCA, and the ATCA logo are registered US trademarks of the PCI Industrial Computer Manufacturers Group.
PCIe and the PCI Express are US registered trademarks and/or service marks of PCI-SIG.
www.keysight.com/find/modular
www.keysight.com/find/digitizers
www.keysight.com/find/emailupdates
For more information on Keysight
Technologies’ products, applications or
services, please contact your local Keysight
office. The complete list is available at:
www.keysight.com/find/contactus
Americas
Canada (877) 894 4414
Brazil 55 11 33 51 7010
Mexico 001 800 254 2440
United States (800) 829 4444
Asia Paciic Australia 1 800 629 485
China 800 810 0189
Hong Kong 800 938 693
India 1 800 112 929
Japan 0120 (421) 345
Korea 080 769 0800
Malaysia 1 800 888 848
Singapore 1 800 375 8100
Taiwan 0800 047 866
Other AP Countries (65) 375 8100
Europe & Middle East
Belgium 32 (0) 2 404 93 40
Denmark 45 45 80 12 15
Finland 358 (0) 10 855 2100
France 0825 010 700*
*0.125 €/minute
Germany 49 (0) 7031 464 6333
Ireland 1890 924 204
Israel 972-3-9288-504/544
Italy 39 02 92 60 8484
Netherlands 31 (0) 20 547 2111
Spain 34 (91) 631 3300
Sweden 0200-88 22 55
United Kingdom 44 (0) 118 927 6201
For other unlisted countries:
www.keysight.com/find/contactus
(BP-04-23-14)
Keysight | Revealing Waveform Characteristics up to a Digitizer’s Full Bandwidth Application Note
This information is subject to change without notice.
© Keysight Technologies 2010 - 2014
Published in USA, July 31, 2014
5990-6611EN
www.keysight.com