Embed Size (px)
Citation preview
Keysight TechnologiesJitter AnalysisUsing InfiniiVision 6000 X-Series and Infiniium Series Oscilloscopes
Application Note
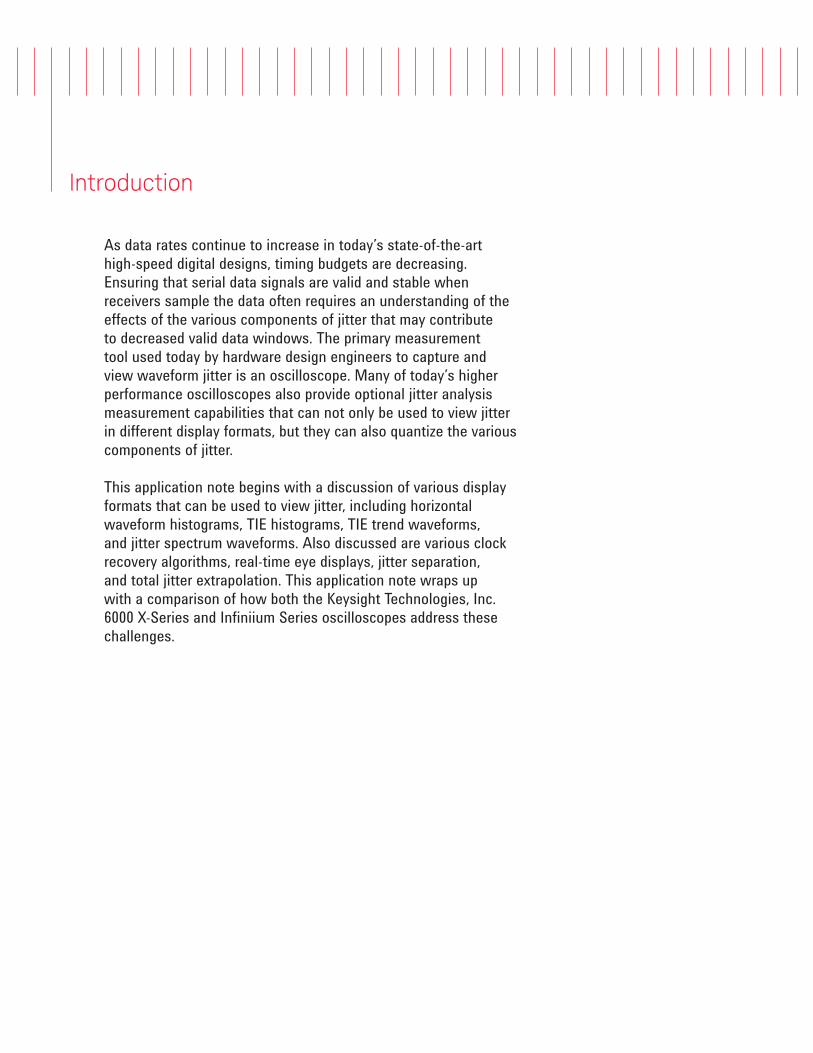
As data rates continue to increase in today’s state-of-the-art high-speed digital designs, timing budgets are decreasing. Ensuring that serial data signals are valid and stable when receivers sample the data often requires an understanding of the effects of the various components of jitter that may contribute to decreased valid data windows. The primary measurement tool used today by hardware design engineers to capture and view waveform jitter is an oscilloscope. Many of today’s higher performance oscilloscopes also provide optional jitter analysis measurement capabilities that can not only be used to view jitter in different display formats, but they can also quantize the various components of jitter.
This application note begins with a discussion of various display formats that can be used to view jitter, including horizontal waveform histograms, TIE histograms, TIE trend waveforms, and jitter spectrum waveforms. Also discussed are various clock recovery algorithms, real-time eye displays, jitter separation, and total jitter extrapolation. This application note wraps up with a comparison of how both the Keysight Technologies, Inc. 6000 X-Series and Infiniium Series oscilloscopes address these challenges.
Introduction
3
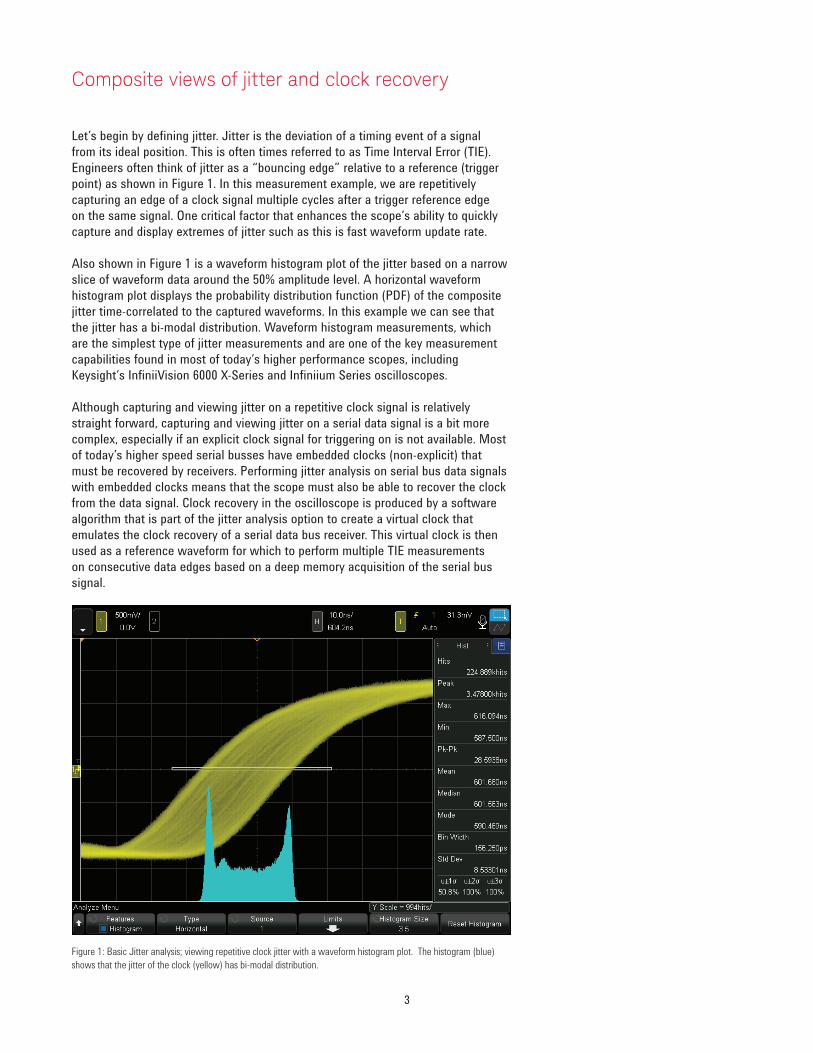
Let’s begin by defining jitter. Jitter is the deviation of a timing event of a signal from its ideal position. This is often times referred to as Time Interval Error (TIE). Engineers often think of jitter as a “bouncing edge” relative to a reference (trigger point) as shown in Figure 1. In this measurement example, we are repetitively capturing an edge of a clock signal multiple cycles after a trigger reference edge on the same signal. One critical factor that enhances the scope’s ability to quickly capture and display extremes of jitter such as this is fast waveform update rate.
Also shown in Figure 1 is a waveform histogram plot of the jitter based on a narrow slice of waveform data around the 50% amplitude level. A horizontal waveform histogram plot displays the probability distribution function (PDF) of the composite jitter time-correlated to the captured waveforms. In this example we can see that the jitter has a bi-modal distribution. Waveform histogram measurements, which are the simplest type of jitter measurements and are one of the key measurement capabilities found in most of today’s higher performance scopes, including Keysight’s InfiniiVision 6000 X-Series and Infiniium Series oscilloscopes.
Although capturing and viewing jitter on a repetitive clock signal is relatively straight forward, capturing and viewing jitter on a serial data signal is a bit more complex, especially if an explicit clock signal for triggering on is not available. Most of today’s higher speed serial busses have embedded clocks (non-explicit) that must be recovered by receivers. Performing jitter analysis on serial bus data signals with embedded clocks means that the scope must also be able to recover the clock from the data signal. Clock recovery in the oscilloscope is produced by a software algorithm that is part of the jitter analysis option to create a virtual clock that emulates the clock recovery of a serial data bus receiver. This virtual clock is then used as a reference waveform for which to perform multiple TIE measurements on consecutive data edges based on a deep memory acquisition of the serial bus signal.
Composite views of jitter and clock recovery
Figure 1: Basic Jitter analysis; viewing repetitive clock jitter with a waveform histogram plot. The histogram (blue) shows that the jitter of the clock (yellow) has bi-modal distribution.

4
Figure 2: Repetitively capturing a continuous serial bus data signal while triggering on the data signal.
Figure 2 shows an example of repetitive acquisitions of a continuous serial data signal. Since we don’t have a reference signal — other than the signal itself — to use as a trigger source, we can’t view the timing error of each data edge (jitter). To perform jitter analysis on this waveform, we will need to use the scope’s jitter analysis option with clock recovery.
Using the scope’s jitter analysis option, we first set up the scope to capture multiple bit periods of the data signal using the scope’s deep memory acquisition. A bit period of a serial data signal is typically called a Unit Interval (UI). We then perform jitter analysis on Data TIE based on a constant clock recovery algorithm.
Figure 3 shows the measured jitter in a histogram plot. However, the data that produced this histogram plot is very different than the data used to produce the histogram plot in the previous measurement example (Figure 1) of clock jitter. Rather than producing the histogram plot from captured waveform data relative to a trigger point, this plot is based on measured timing error (TIE) of every captured data edge (rising and falling) relative to the recovered clock (not shown). In addition to displaying the histogram, today’s higher performance oscilloscopes also show full statistics of the measurement histogram (refer to far right panel of the scope’s display in Figure 3).
From this histogram plot we can see that the jitter in this serial data signal appears to have a strong Gaussian (random) component as well as a bi-modal deterministic component. Also notice that the histogram plot shows extreme “outliers” near the lower-right side of the scope’s waveform display area. Let’s now view this timing error in another display/plot format that may reveal additional information about this jitter. Figure 3: Jitter analysis using a TIE histogram plot.
Outliers
5
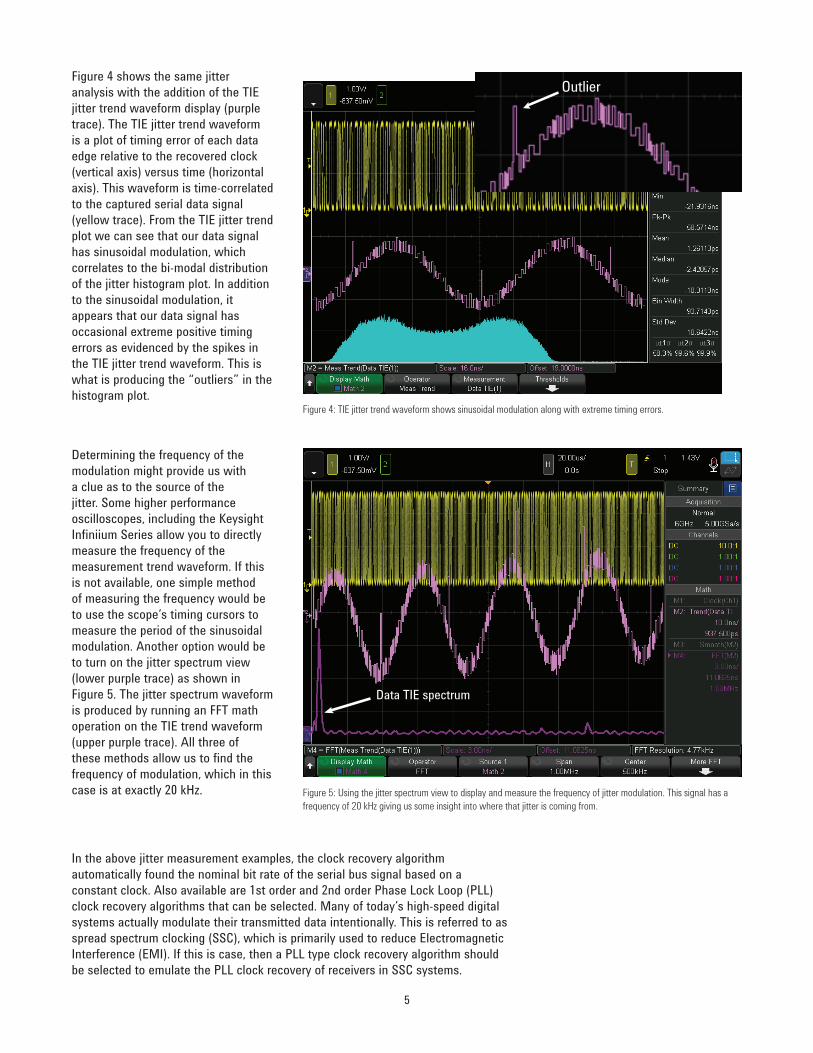
Figure 5: Using the jitter spectrum view to display and measure the frequency of jitter modulation. This signal has a frequency of 20 kHz giving us some insight into where that jitter is coming from.
Figure 4: TIE jitter trend waveform shows sinusoidal modulation along with extreme timing errors.
Data TIE spectrum
OutlierFigure 4 shows the same jitter analysis with the addition of the TIE jitter trend waveform display (purple trace). The TIE jitter trend waveform is a plot of timing error of each data edge relative to the recovered clock (vertical axis) versus time (horizontal axis). This waveform is time-correlated to the captured serial data signal (yellow trace). From the TIE jitter trend plot we can see that our data signal has sinusoidal modulation, which correlates to the bi-modal distribution of the jitter histogram plot. In addition to the sinusoidal modulation, it appears that our data signal has occasional extreme positive timing errors as evidenced by the spikes in the TIE jitter trend waveform. This is what is producing the “outliers” in the histogram plot.
Determining the frequency of the modulation might provide us with a clue as to the source of the jitter. Some higher performance oscilloscopes, including the Keysight Infiniium Series allow you to directly measure the frequency of the measurement trend waveform. If this is not available, one simple method of measuring the frequency would be to use the scope’s timing cursors to measure the period of the sinusoidal modulation. Another option would be to turn on the jitter spectrum view (lower purple trace) as shown in Figure 5. The jitter spectrum waveform is produced by running an FFT math operation on the TIE trend waveform (upper purple trace). All three of these methods allow us to find the frequency of modulation, which in this case is at exactly 20 kHz.
In the above jitter measurement examples, the clock recovery algorithm automatically found the nominal bit rate of the serial bus signal based on a constant clock. Also available are 1st order and 2nd order Phase Lock Loop (PLL) clock recovery algorithms that can be selected. Many of today’s high-speed digital systems actually modulate their transmitted data intentionally. This is referred to as spread spectrum clocking (SSC), which is primarily used to reduce Electromagnetic Interference (EMI). If this is case, then a PLL type clock recovery algorithm should be selected to emulate the PLL clock recovery of receivers in SSC systems.
6
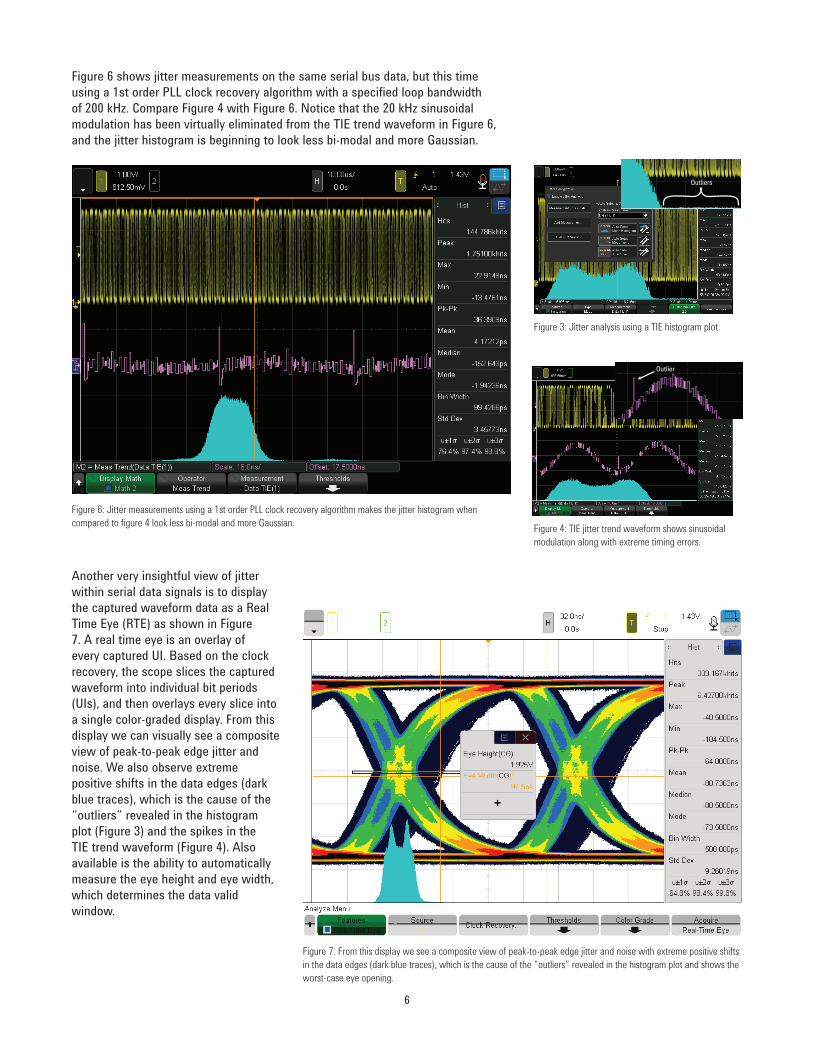
Figure 6 shows jitter measurements on the same serial bus data, but this time using a 1st order PLL clock recovery algorithm with a specified loop bandwidth of 200 kHz. Compare Figure 4 with Figure 6. Notice that the 20 kHz sinusoidal modulation has been virtually eliminated from the TIE trend waveform in Figure 6, and the jitter histogram is beginning to look less bi-modal and more Gaussian.
Figure 4: TIE jitter trend waveform shows sinusoidal modulation along with extreme timing errors.
Figure 3: Jitter analysis using a TIE histogram plot.
Outlier
Figure 7: From this display we see a composite view of peak-to-peak edge jitter and noise with extreme positive shifts in the data edges (dark blue traces), which is the cause of the “outliers” revealed in the histogram plot and shows the worst-case eye opening.
Figure 6: Jitter measurements using a 1st order PLL clock recovery algorithm makes the jitter histogram when compared to figure 4 look less bi-modal and more Gaussian.
Outliers
Another very insightful view of jitter within serial data signals is to display the captured waveform data as a Real Time Eye (RTE) as shown in Figure 7. A real time eye is an overlay of every captured UI. Based on the clock recovery, the scope slices the captured waveform into individual bit periods (UIs), and then overlays every slice into a single color-graded display. From this display we can visually see a composite view of peak-to-peak edge jitter and noise. We also observe extreme positive shifts in the data edges (dark blue traces), which is the cause of the “outliers” revealed in the histogram plot (Figure 3) and the spikes in the TIE trend waveform (Figure 4). Also available is the ability to automatically measure the eye height and eye width, which determines the data valid window.
7
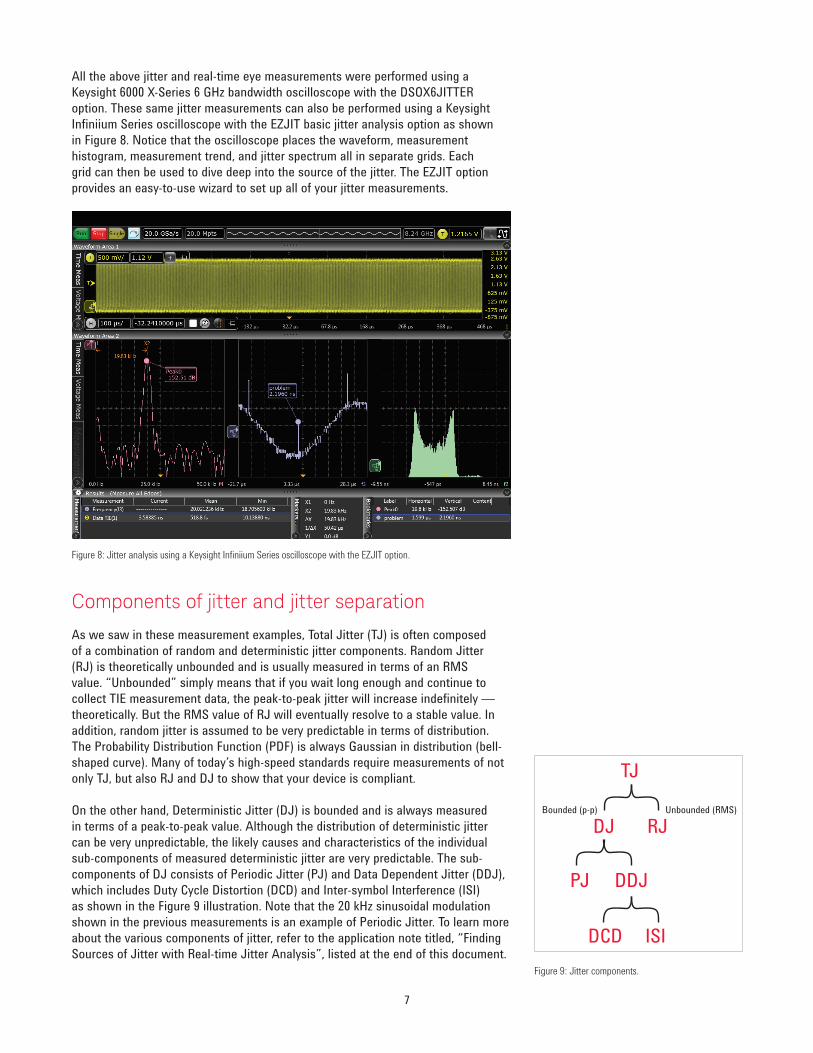
All the above jitter and real-time eye measurements were performed using a Keysight 6000 X-Series 6 GHz bandwidth oscilloscope with the DSOX6JITTER option. These same jitter measurements can also be performed using a Keysight Infiniium Series oscilloscope with the EZJIT basic jitter analysis option as shown in Figure 8. Notice that the oscilloscope places the waveform, measurement histogram, measurement trend, and jitter spectrum all in separate grids. Each grid can then be used to dive deep into the source of the jitter. The EZJIT option provides an easy-to-use wizard to set up all of your jitter measurements.
Components of jitter and jitter separation
As we saw in these measurement examples, Total Jitter (TJ) is often composed of a combination of random and deterministic jitter components. Random Jitter (RJ) is theoretically unbounded and is usually measured in terms of an RMS value. “Unbounded” simply means that if you wait long enough and continue to collect TIE measurement data, the peak-to-peak jitter will increase indefinitely — theoretically. But the RMS value of RJ will eventually resolve to a stable value. In addition, random jitter is assumed to be very predictable in terms of distribution. The Probability Distribution Function (PDF) is always Gaussian in distribution (bell-shaped curve). Many of today’s high-speed standards require measurements of not only TJ, but also RJ and DJ to show that your device is compliant.
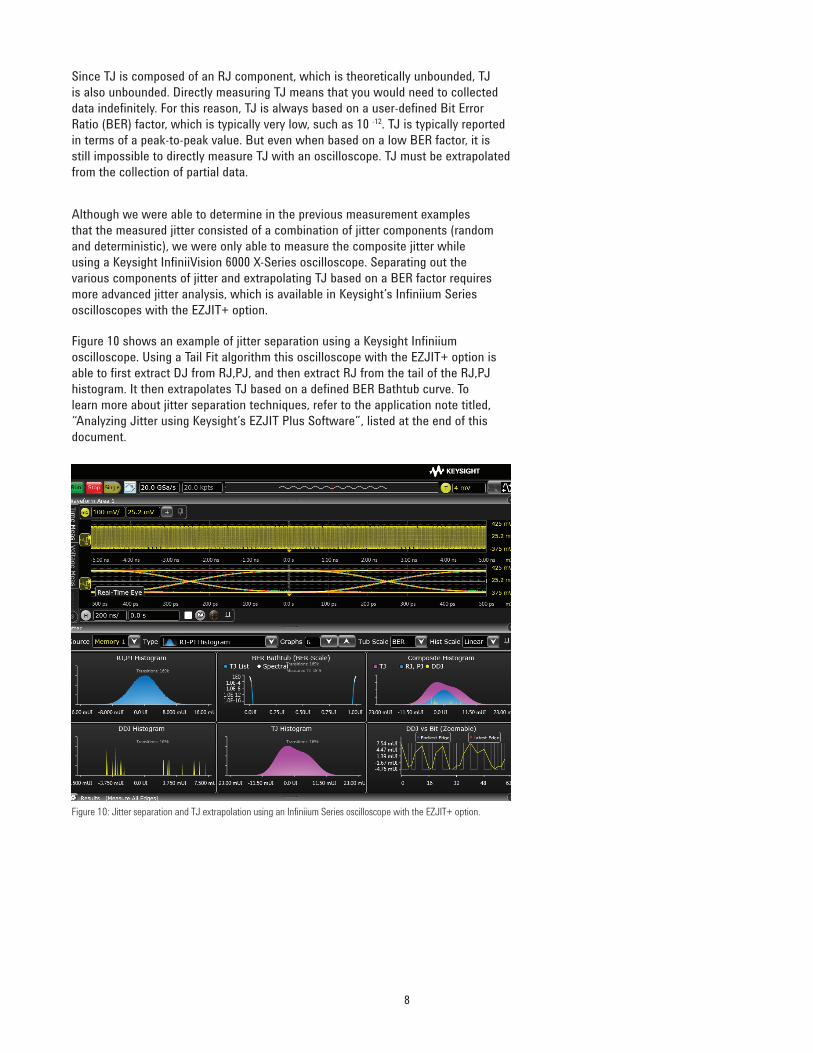
On the other hand, Deterministic Jitter (DJ) is bounded and is always measured in terms of a peak-to-peak value. Although the distribution of deterministic jitter can be very unpredictable, the likely causes and characteristics of the individual sub-components of measured deterministic jitter are very predictable. The sub-components of DJ consists of Periodic Jitter (PJ) and Data Dependent Jitter (DDJ), which includes Duty Cycle Distortion (DCD) and Inter-symbol Interference (ISI) as shown in the Figure 9 illustration. Note that the 20 kHz sinusoidal modulation shown in the previous measurements is an example of Periodic Jitter. To learn more about the various components of jitter, refer to the application note titled, “Finding Sources of Jitter with Real-time Jitter Analysis”, listed at the end of this document.
Figure 8: Jitter analysis using a Keysight Infiniium Series oscilloscope with the EZJIT option.
Figure 9: Jitter components.
TJ
Bounded (p-p) Unbounded (RMS)
DJ RJ
PJ DDJ
DCD ISI
8
Although we were able to determine in the previous measurement examples that the measured jitter consisted of a combination of jitter components (random and deterministic), we were only able to measure the composite jitter while using a Keysight InfiniiVision 6000 X-Series oscilloscope. Separating out the various components of jitter and extrapolating TJ based on a BER factor requires more advanced jitter analysis, which is available in Keysight’s Infiniium Series oscilloscopes with the EZJIT+ option.
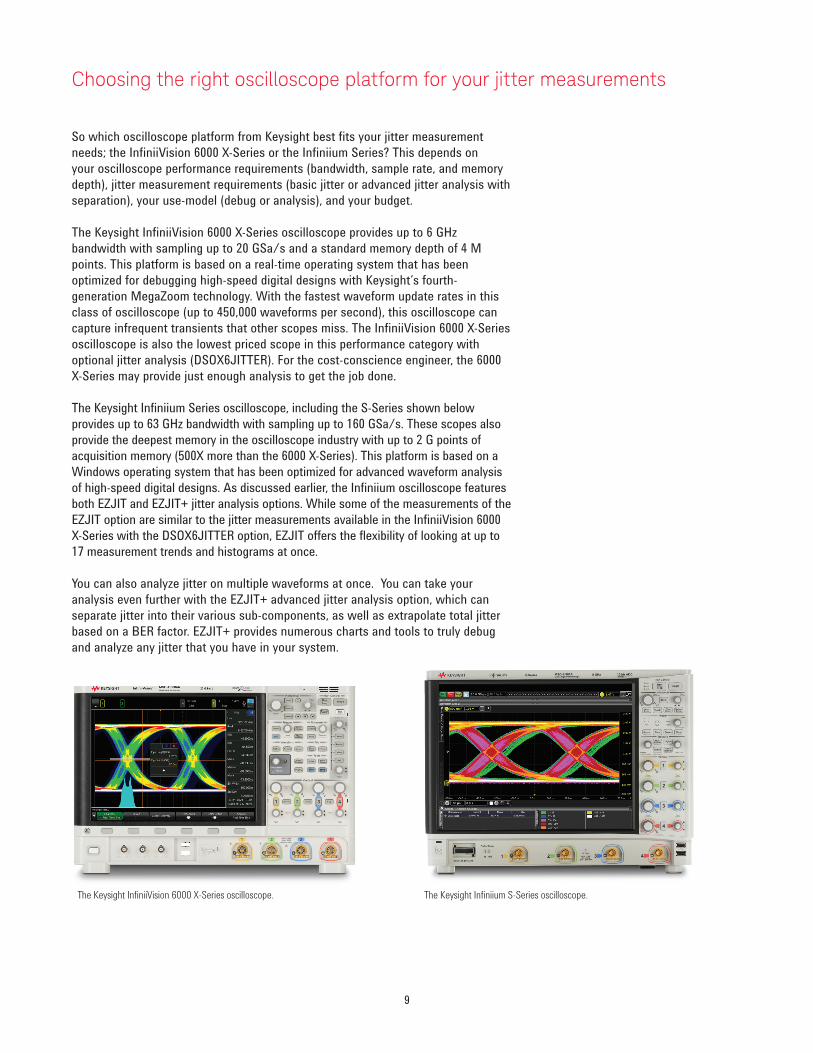
Figure 10 shows an example of jitter separation using a Keysight Infiniium oscilloscope. Using a Tail Fit algorithm this oscilloscope with the EZJIT+ option is able to first extract DJ from RJ,PJ, and then extract RJ from the tail of the RJ,PJ histogram. It then extrapolates TJ based on a defined BER Bathtub curve. To learn more about jitter separation techniques, refer to the application note titled, “Analyzing Jitter using Keysight’s EZJIT Plus Software”, listed at the end of this document.
Figure 10: Jitter separation and TJ extrapolation using an Infiniium Series oscilloscope with the EZJIT+ option.
Since TJ is composed of an RJ component, which is theoretically unbounded, TJ is also unbounded. Directly measuring TJ means that you would need to collected data indefinitely. For this reason, TJ is always based on a user-defined Bit Error Ratio (BER) factor, which is typically very low, such as 10 -12. TJ is typically reported in terms of a peak-to-peak value. But even when based on a low BER factor, it is still impossible to directly measure TJ with an oscilloscope. TJ must be extrapolated from the collection of partial data.
9
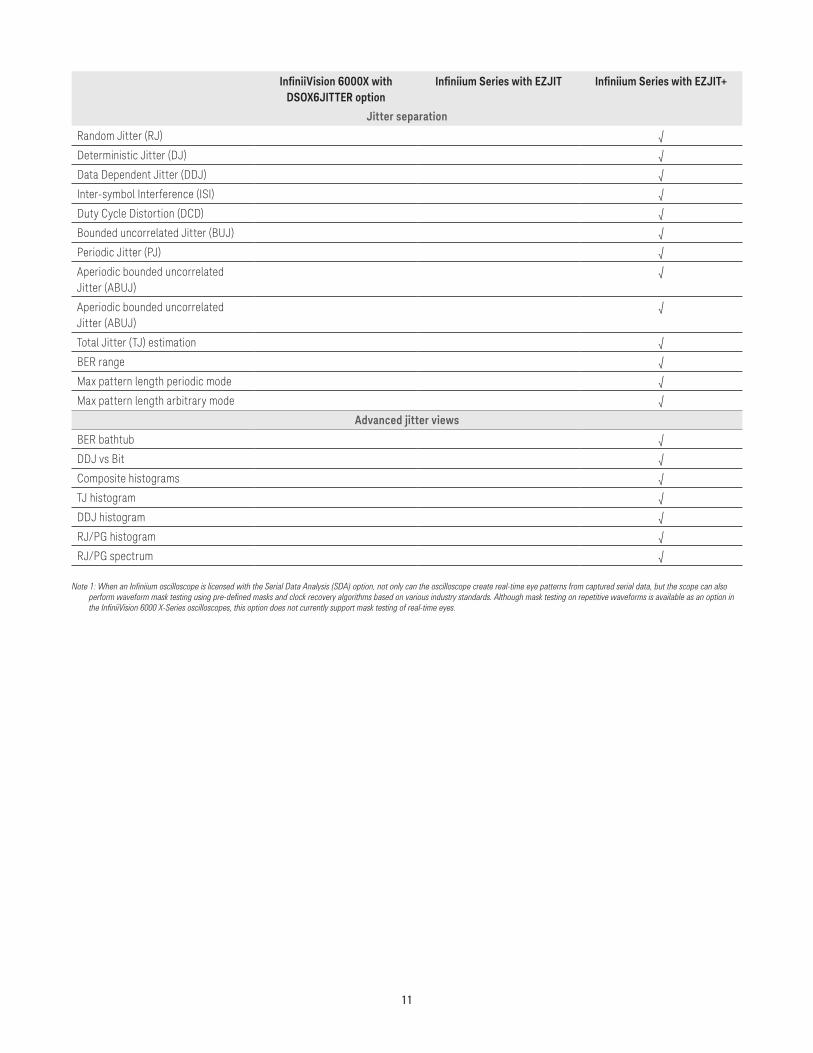
The Keysight InfiniiVision 6000 X-Series oscilloscope. The Keysight Infiniium S-Series oscilloscope.
So which oscilloscope platform from Keysight best fits your jitter measurement needs; the InfiniiVision 6000 X-Series or the Infiniium Series? This depends on your oscilloscope performance requirements (bandwidth, sample rate, and memory depth), jitter measurement requirements (basic jitter or advanced jitter analysis with separation), your use-model (debug or analysis), and your budget.
The Keysight InfiniiVision 6000 X-Series oscilloscope provides up to 6 GHz bandwidth with sampling up to 20 GSa/s and a standard memory depth of 4 M points. This platform is based on a real-time operating system that has been optimized for debugging high-speed digital designs with Keysight’s fourth-generation MegaZoom technology. With the fastest waveform update rates in this class of oscilloscope (up to 450,000 waveforms per second), this oscilloscope can capture infrequent transients that other scopes miss. The InfiniiVision 6000 X-Series oscilloscope is also the lowest priced scope in this performance category with optional jitter analysis (DSOX6JITTER). For the cost-conscience engineer, the 6000 X-Series may provide just enough analysis to get the job done.
The Keysight Infiniium Series oscilloscope, including the S-Series shown below provides up to 63 GHz bandwidth with sampling up to 160 GSa/s. These scopes also provide the deepest memory in the oscilloscope industry with up to 2 G points of acquisition memory (500X more than the 6000 X-Series). This platform is based on a Windows operating system that has been optimized for advanced waveform analysis of high-speed digital designs. As discussed earlier, the Infiniium oscilloscope features both EZJIT and EZJIT+ jitter analysis options. While some of the measurements of the EZJIT option are similar to the jitter measurements available in the InfiniiVision 6000 X-Series with the DSOX6JITTER option, EZJIT offers the flexibility of looking at up to 17 measurement trends and histograms at once.
You can also analyze jitter on multiple waveforms at once. You can take your analysis even further with the EZJIT+ advanced jitter analysis option, which can separate jitter into their various sub-components, as well as extrapolate total jitter based on a BER factor. EZJIT+ provides numerous charts and tools to truly debug and analyze any jitter that you have in your system.
Choosing the right oscilloscope platform for your jitter measurements

10
The following table summarizes the features of Keysight’s various jitter analysis options in InfiniiVision 6000 X-Series and Infiniium oscilloscopes:
InfiniiVision 6000X with DSOX6JITTER option
Infiniium Series with EZJIT Infiniium Series with EZJIT+
Jitter views
Jitter trend √ √ √
Jitter histogram √ √ √
Jitter spectrum √ √ √
Real-time eye √ With SDA Option1 With SDA Option1
Clock recovery
Constant clock √ √ √
1st order PLL clock √ √ √
2nd order PLL clock √ √ √
Explicit clock √ √ √
Clock jitter measurements
Clock TIE √ √ √
N-period √ √ √
Period to period √ √ √
+Width to +width √ √ √
-Width to –width √ √ √
+ Duty cycle √ √ √
- Duty cycle √ √
Period √ √
Frequency √ √
Pulse width (+,-, both) √ √
Data jitter measurements
Data TIE √ √ √
Data rate √ √
Unit interval √ √
Data/edge measurements
Setup/hold √ √
Phase √ √
Rise/fall time √ √
11
InfiniiVision 6000X with DSOX6JITTER option
Infiniium Series with EZJIT Infiniium Series with EZJIT+
Jitter separation
Random Jitter (RJ) √
Deterministic Jitter (DJ) √
Data Dependent Jitter (DDJ) √
Inter-symbol Interference (ISI) √
Duty Cycle Distortion (DCD) √
Bounded uncorrelated Jitter (BUJ) √
Periodic Jitter (PJ) √
Aperiodic bounded uncorrelated Jitter (ABUJ)
√
Aperiodic bounded uncorrelated Jitter (ABUJ)
√
Total Jitter (TJ) estimation √
BER range √
Max pattern length periodic mode √
Max pattern length arbitrary mode √
Advanced jitter views
BER bathtub √
DDJ vs Bit √
Composite histograms √
TJ histogram √
DDJ histogram √
RJ/PG histogram √
RJ/PG spectrum √
Note 1: When an Infiniium oscilloscope is licensed with the Serial Data Analysis (SDA) option, not only can the oscilloscope create real-time eye patterns from captured serial data, but the scope can also perform waveform mask testing using pre-defined masks and clock recovery algorithms based on various industry standards. Although mask testing on repetitive waveforms is available as an option in the InfiniiVision 6000 X-Series oscilloscopes, this option does not currently support mask testing of real-time eyes.

12
Related literature
Publication title Publication type Publication number
Keysight InfiniiVision 6000 X-Series Oscilloscopes (1 GHz to 6 GHz) Data sheet 5991-4087EN
Keysight Infiniium S-Series Oscilloscopes (500 MHz to 8 GHz) Data sheet 5991-3904EN
Keysight Infiniium 90000A Series Oscilloscopes (2.5 GHz to 13 GHz) Data sheet 5989-7819EN
Keysight Infiniium 90000 X-Series Oscilloscopes (13 GHz to 33 GHz Data sheet 5990-5271EN
Keysight Infiniium 90000 Q-Series Oscilloscopes (20 GHz to 63 GHz) Data sheet 5990-5299EN
Keysight EZJIT and EZJIT Plus Jitter Analysis for Infiniium Oscilloscopes Data sheet 5989-0109EN
Finding Sources of Jitter with Real-time Jitter Analysis Application note 5988-9740EN
Analyzing Jitter using Keysight EZJIT Plus Software Application note 5989-3776EN
Choosing the ISI Filter Size for EZJIT Plus Arbitrary Data Jitter Analysis Application note 5989-4974EN
Selecting RJ Bandwidth in EZJIT Plus Software Application note 5989-5056EN
To download these documents, insert the publication number in the URL: http://cp.literature.keysight.com/litweb/pdf/xxxx-xxxxEN.pdf
Product web site
For the most up-to-date and complete application and product information, please visit our product Web site at: www.keysight.com/find/s-serieswww.keysight.com/find/6000x-series
myKeysight
www.keysight.com/find/mykeysightA personalized view into the information most relevant to you.
www.lxistandard.org
LAN eXtensions for Instruments puts the power of Ethernet and the Web inside your test systems. Keysight is a founding member of the LXI consortium.
Three-Year Warranty
www.keysight.com/find/ThreeYearWarrantyKeysight’s commitment to superior product quality and lower total cost of ownership. The only test and measurement company with three-year warranty standard on all instruments, worldwide.
Keysight Assurance Planswww.keysight.com/find/AssurancePlansUp to five years of protection and no budgetary surprises to ensure your instruments are operating to specification so you can rely on accurate measurements.
www.keysight.com/go/qualityKeysight Technologies, Inc.DEKRA Certified ISO 9001:2008 Quality Management System
Keysight Channel Partnerswww.keysight.com/find/channelpartnersGet the best of both worlds: Keysight’s measurement expertise and product breadth, combined with channel partner convenience.
www.keysight.com/find/s-serieswww.keysight.com/find/6000x-series
For more information on Keysight Technologies’ products, applications or services, please contact your local Keysight office. The complete list is available at:www.keysight.com/find/contactus
Americas Canada (877) 894 4414Brazil 55 11 3351 7010Mexico 001 800 254 2440United States (800) 829 4444
Asia PacificAustralia 1 800 629 485China 800 810 0189Hong Kong 800 938 693India 1 800 112 929Japan 0120 (421) 345Korea 080 769 0800Malaysia 1 800 888 848Singapore 1 800 375 8100Taiwan 0800 047 866Other AP Countries (65) 6375 8100
Europe & Middle EastAustria 0800 001122Belgium 0800 58580Finland 0800 523252France 0805 980333Germany 0800 6270999Ireland 1800 832700Israel 1 809 343051Italy 800 599100Luxembourg +32 800 58580Netherlands 0800 0233200Russia 8800 5009286Spain 0800 000154Sweden 0200 882255Switzerland 0800 805353
Opt. 1 (DE)Opt. 2 (FR)Opt. 3 (IT)
United Kingdom 0800 0260637
For other unlisted countries:www.keysight.com/find/contactus(BP-09-04-14)
13 | Keysight | Jitter Analysis - Using InfiniiVision 6000 X-Series and Infiniium Series Oscilloscopes - Application Note
This information is subject to change without notice.© Keysight Technologies, 2014Published in USA, August 4, 20145991-4000ENwww.keysight.com