Embed Size (px)
Citation preview
How the UK population has changed and what this means for you and your organisation
Key trends in the UK population
An Experian Marketing Services white paper
Key trends in the UK population | 3
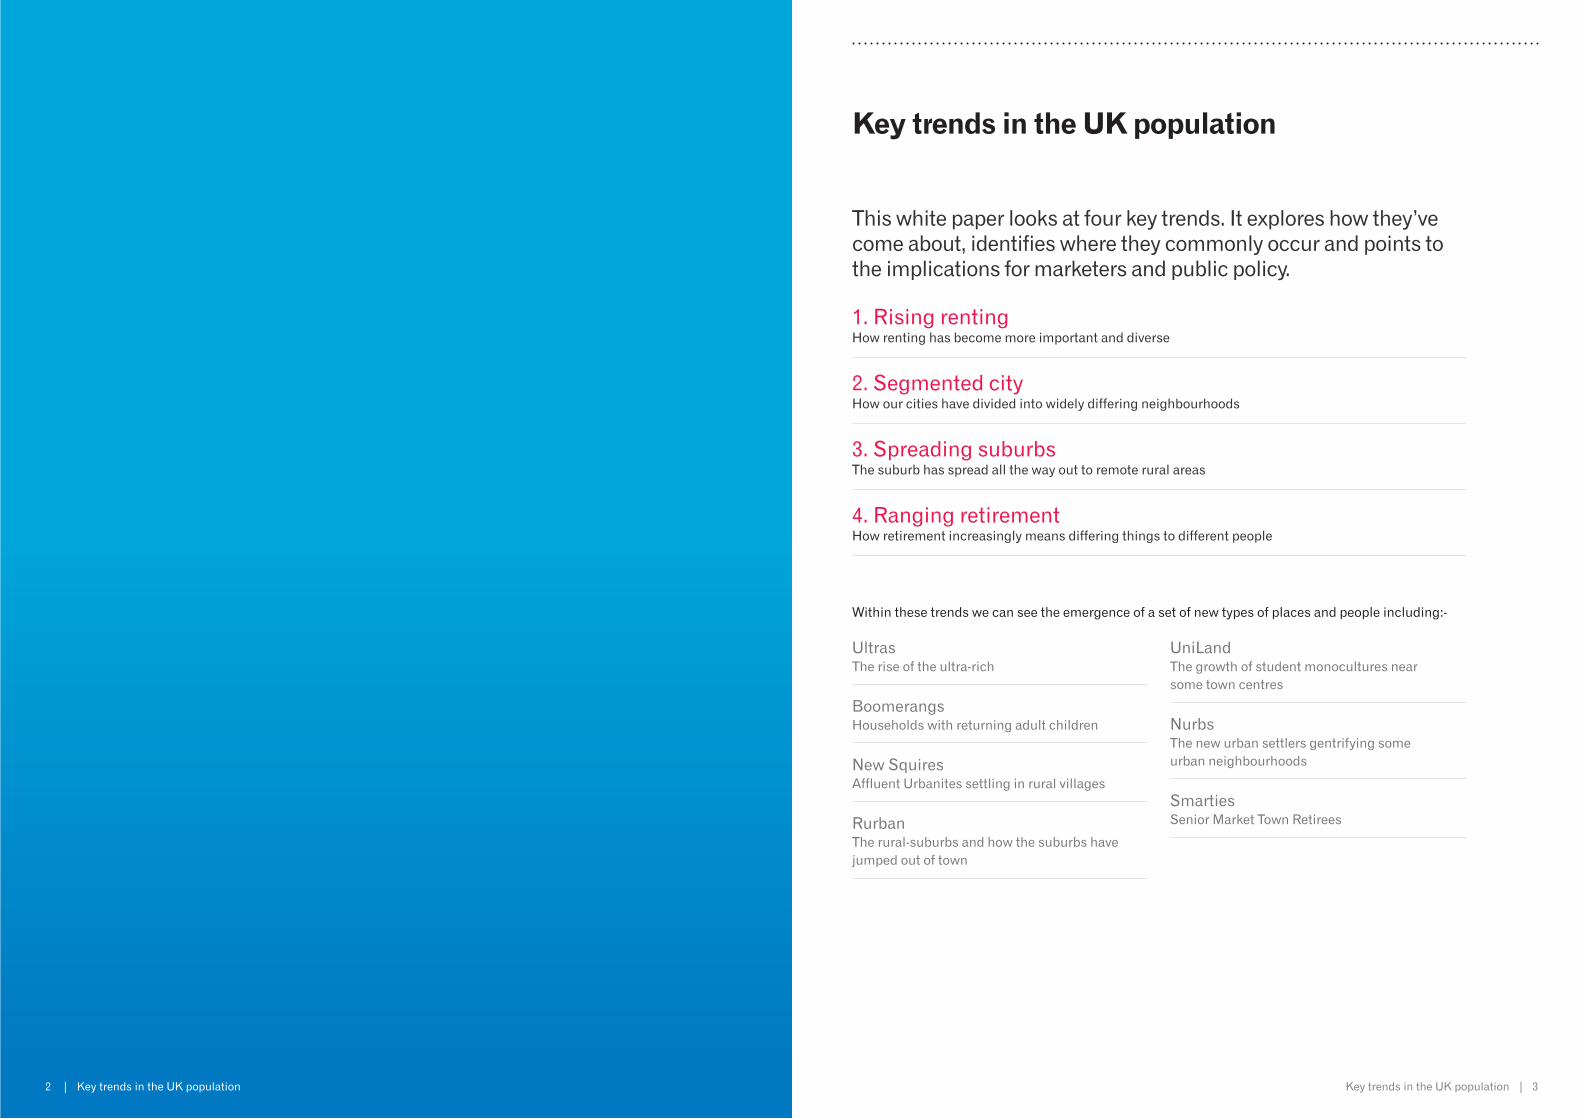
This white paper looks at four key trends. It explores how they’ve come about, identifies where they commonly occur and points to the implications for marketers and public policy.
1. Rising renting How renting has become more important and diverse
2. Segmented city How our cities have divided into widely differing neighbourhoods
3. Spreading suburbs The suburb has spread all the way out to remote rural areas
4. Ranging retirement How retirement increasingly means differing things to different people
Within these trends we can see the emergence of a set of new types of places and people including:-
Ultras The rise of the ultra-rich
Boomerangs Households with returning adult children
New Squires Affluent Urbanites settling in rural villages
Rurban The rural-suburbs and how the suburbs have jumped out of town
UniLand The growth of student monocultures near some town centres
Nurbs The new urban settlers gentrifying some urban neighbourhoods
Smarties Senior Market Town Retirees
Key trends in the UK population
2 | Key trends in the UK population
4 | Key trends in the UK population Key trends in the UK population | 5
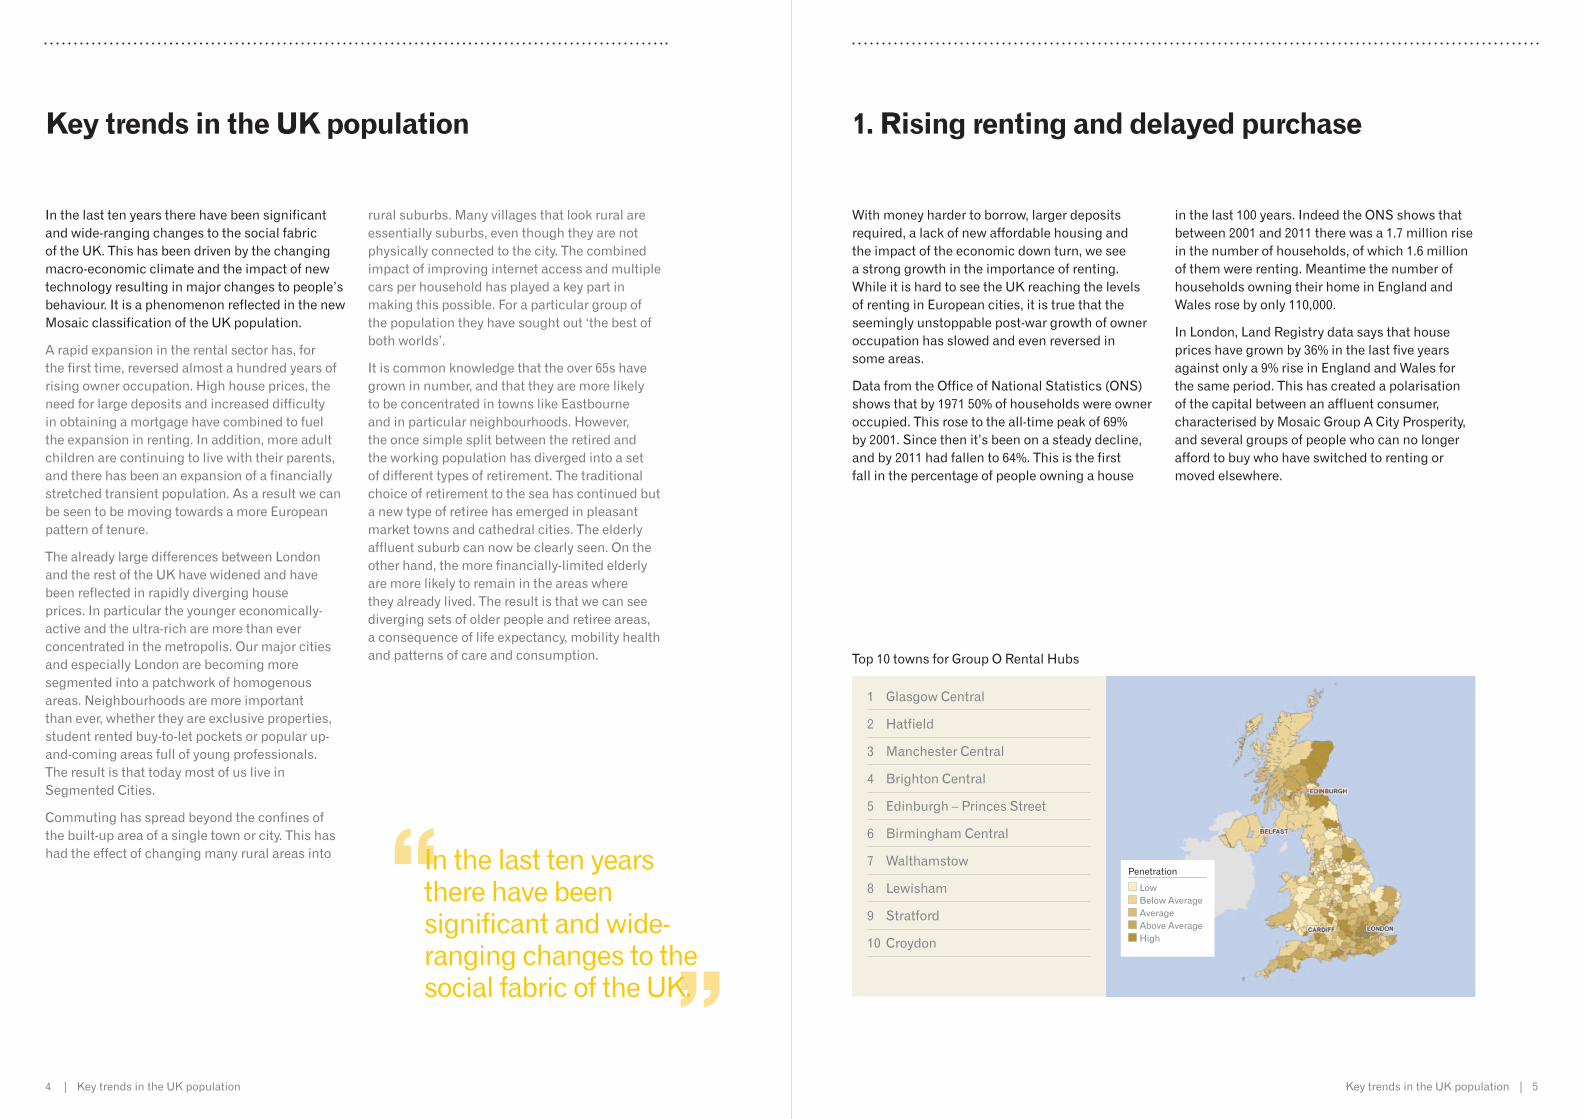
With money harder to borrow, larger deposits required, a lack of new affordable housing and the impact of the economic down turn, we see a strong growth in the importance of renting. While it is hard to see the UK reaching the levels of renting in European cities, it is true that the seemingly unstoppable post-war growth of owner occupation has slowed and even reversed in some areas.
Data from the Office of National Statistics (ONS) shows that by 1971 50% of households were owner occupied. This rose to the all-time peak of 69% by 2001. Since then it’s been on a steady decline, and by 2011 had fallen to 64%. This is the first fall in the percentage of people owning a house
in the last 100 years. Indeed the ONS shows that between 2001 and 2011 there was a 1.7 million rise in the number of households, of which 1.6 million of them were renting. Meantime the number of households owning their home in England and Wales rose by only 110,000.
In London, Land Registry data says that house prices have grown by 36% in the last five years against only a 9% rise in England and Wales for the same period. This has created a polarisation of the capital between an affluent consumer, characterised by Mosaic Group A City Prosperity, and several groups of people who can no longer afford to buy who have switched to renting or moved elsewhere.
Top 10 towns for Group O Rental Hubs
1. Rising renting and delayed purchase
1 Glasgow Central
2 Hatfield
3 Manchester Central
4 Brighton Central
5 Edinburgh – Princes Street
6 Birmingham Central
7 Walthamstow
8 Lewisham
9 Stratford
10 Croydon
Key trends in the UK population
In the last ten years there have been significant and wide-ranging changes to the social fabric of the UK. This has been driven by the changing macro-economic climate and the impact of new technology resulting in major changes to people’s behaviour. It is a phenomenon reflected in the new Mosaic classification of the UK population.
A rapid expansion in the rental sector has, for the first time, reversed almost a hundred years of rising owner occupation. High house prices, the need for large deposits and increased difficulty in obtaining a mortgage have combined to fuel the expansion in renting. In addition, more adult children are continuing to live with their parents, and there has been an expansion of a financially stretched transient population. As a result we can be seen to be moving towards a more European pattern of tenure.
The already large differences between London and the rest of the UK have widened and have been reflected in rapidly diverging house prices. In particular the younger economically-active and the ultra-rich are more than ever concentrated in the metropolis. Our major cities and especially London are becoming more segmented into a patchwork of homogenous areas. Neighbourhoods are more important than ever, whether they are exclusive properties, student rented buy-to-let pockets or popular up-and-coming areas full of young professionals. The result is that today most of us live in Segmented Cities.
Commuting has spread beyond the confines of the built-up area of a single town or city. This has had the effect of changing many rural areas into
rural suburbs. Many villages that look rural are essentially suburbs, even though they are not physically connected to the city. The combined impact of improving internet access and multiple cars per household has played a key part in making this possible. For a particular group of the population they have sought out ‘the best of both worlds’.
It is common knowledge that the over 65s have grown in number, and that they are more likely to be concentrated in towns like Eastbourne and in particular neighbourhoods. However, the once simple split between the retired and the working population has diverged into a set of different types of retirement. The traditional choice of retirement to the sea has continued but a new type of retiree has emerged in pleasant market towns and cathedral cities. The elderly affluent suburb can now be clearly seen. On the other hand, the more financially-limited elderly are more likely to remain in the areas where they already lived. The result is that we can see diverging sets of older people and retiree areas, a consequence of life expectancy, mobility health and patterns of care and consumption.
In the last ten years there have been significant and wide-ranging changes to the social fabric of the UK.
Penetration
Low Below Average Average Above Average High
6 | Key trends in the UK population Key trends in the UK population | 7
Mosaic Type B08 Bank of Mum and Dad The most affluent set of extended families in quality suburban homes are called the Bank of Mum and Dad. In these households the adult children make the most of their comfortable childhood bedroom by not leaving. Households with adult children and disposable income represent a good opportunity for sales of products
to benefit the parents but more especially the children. As they have higher incomes and savings, the freed-up income of the child and the pressure on the parents to spend results in a fertile market for small cars, holidays, fashion, high end mobile phones and consumer electronics.
Top 10 towns for Type B08 Bank of Mum and Dad
1. Rising renting and delayed purchase Continued »
1 Camberley
2 Sutton Coldfield
3 Brentwood
4 Bracknell
5 Farnborough
6 Maidenhead
7 Eastleigh
8 Orpington
9 Woking
10 Epsom
The most affluent set of extended families in quality suburban homes are called the Bank of Mum and Dad.
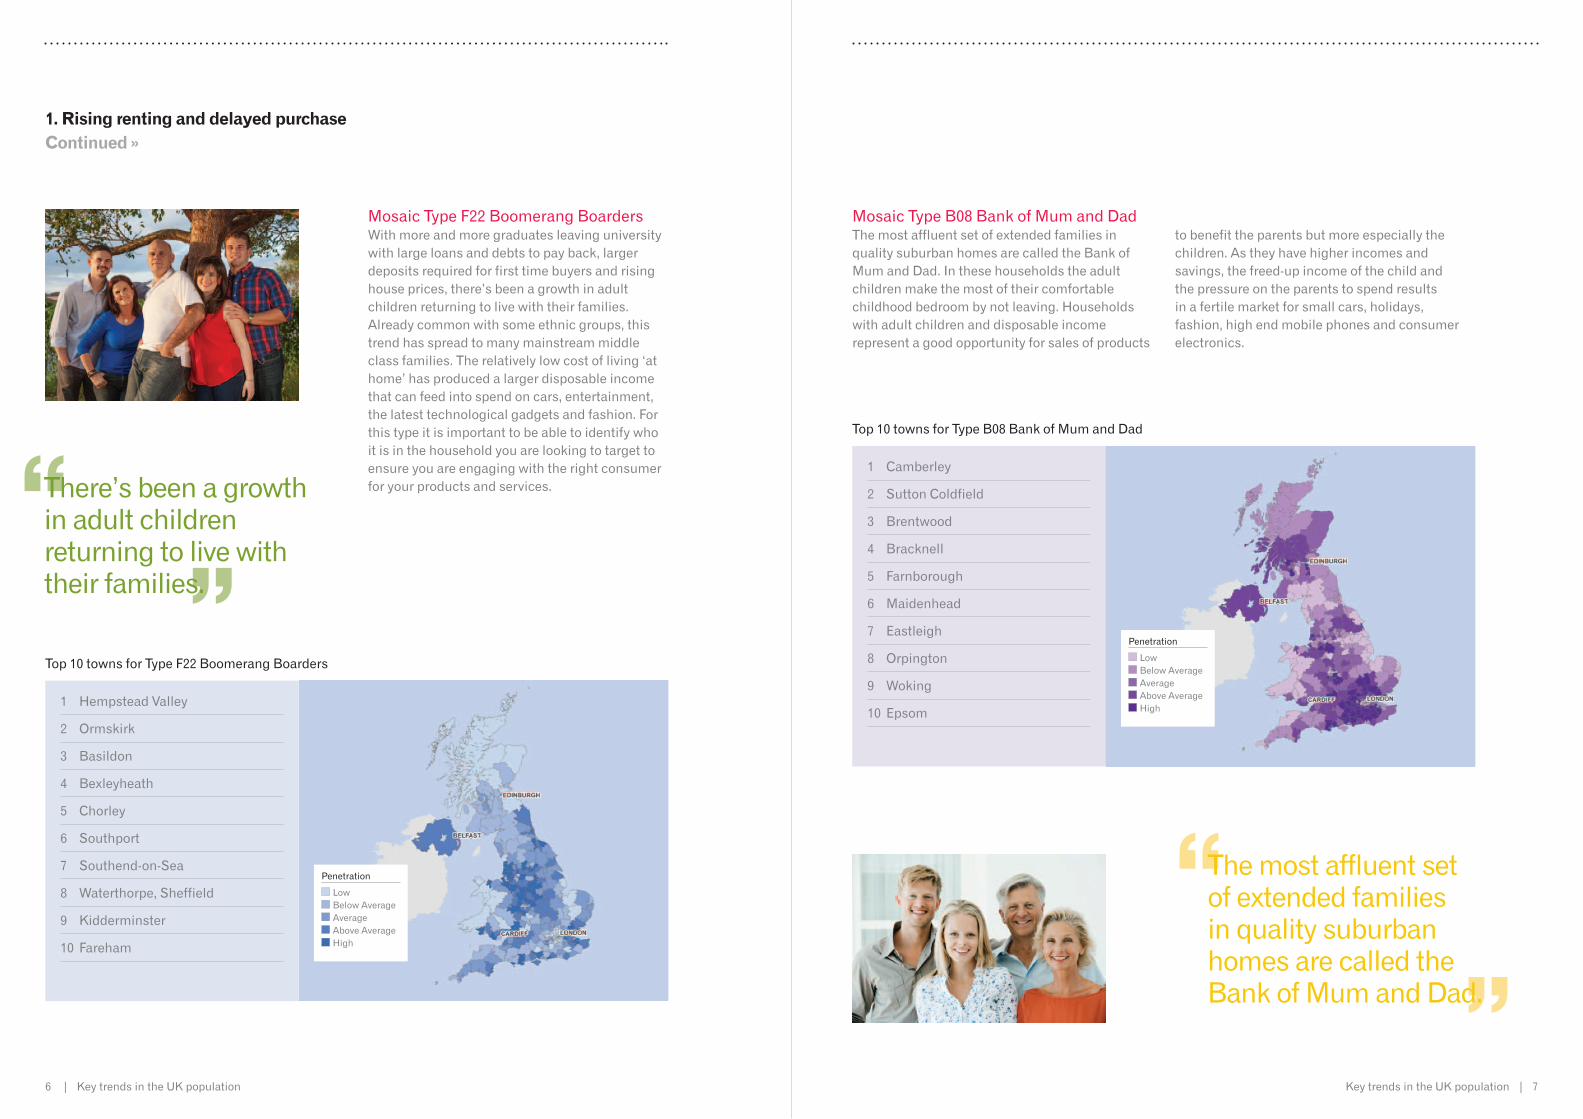
Mosaic Type F22 Boomerang Boarders With more and more graduates leaving university with large loans and debts to pay back, larger deposits required for first time buyers and rising house prices, there’s been a growth in adult children returning to live with their families. Already common with some ethnic groups, this trend has spread to many mainstream middle class families. The relatively low cost of living ‘at home’ has produced a larger disposable income that can feed into spend on cars, entertainment, the latest technological gadgets and fashion. For this type it is important to be able to identify who it is in the household you are looking to target to ensure you are engaging with the right consumer for your products and services.
Top 10 towns for Type F22 Boomerang Boarders
1 Hempstead Valley
2 Ormskirk
3 Basildon
4 Bexleyheath
5 Chorley
6 Southport
7 Southend-on-Sea
8 Waterthorpe, Sheffield
9 Kidderminster
10 Fareham
There’s been a growth in adult children returning to live with their families.
Penetration
Low Below Average Average Above Average High
Penetration
Low Below Average Average Above Average High
8 | Key trends in the UK population Key trends in the UK population | 9
1. Rising renting and delayed purchase Continued »
Top 10 towns for Type H35 Flying Solo
1 Hatfield
2 Bournemouth – Central
3 Uxbridge
4 Staines
5 Dartford
6 Cambridge West, Cambridge
7 Oxford
8 Loughborough
9 Guildford
10 Bury St Edmunds
Mosaic Type H35 Flying Solo They are young, often single and live in rented houses or flats. They prefer to be contacted via their mobile and are some of the most prolific users of Facebook outside of universities.
Flying Solo are some of the most prolific users of Facebook outside of universities.
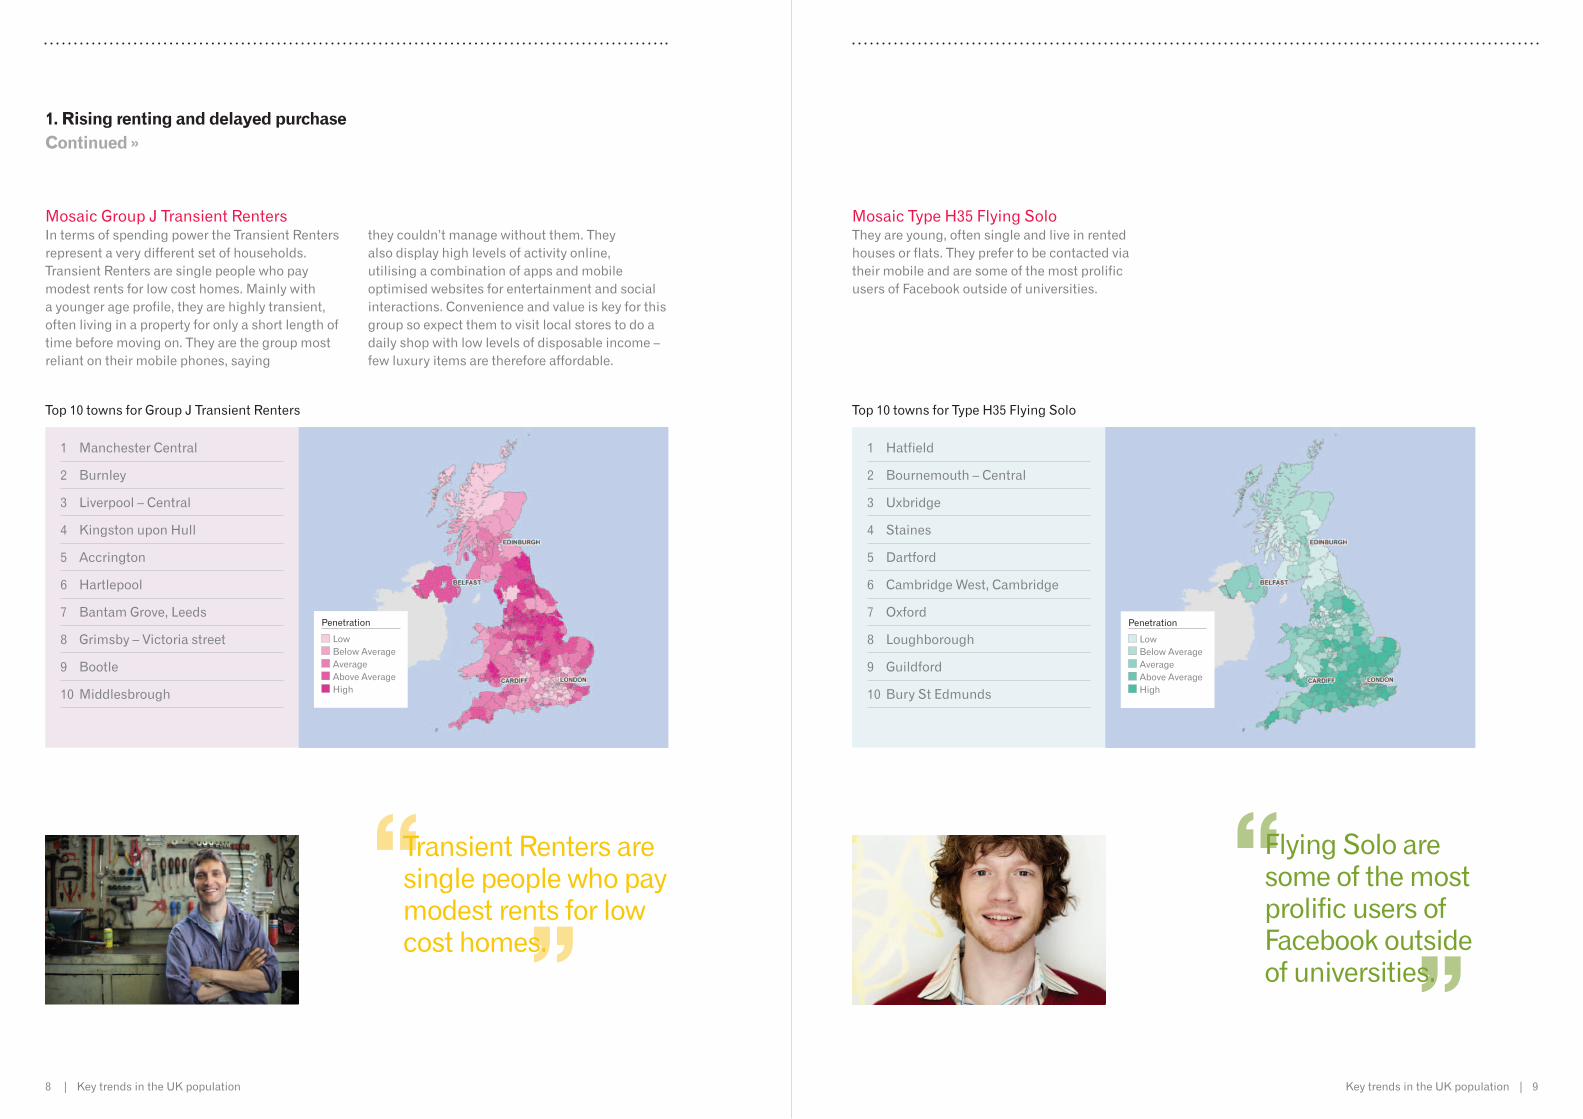
Mosaic Group J Transient Renters In terms of spending power the Transient Renters represent a very different set of households. Transient Renters are single people who pay modest rents for low cost homes. Mainly with a younger age profile, they are highly transient, often living in a property for only a short length of time before moving on. They are the group most reliant on their mobile phones, saying
they couldn’t manage without them. They also display high levels of activity online, utilising a combination of apps and mobile optimised websites for entertainment and social interactions. Convenience and value is key for this group so expect them to visit local stores to do a daily shop with low levels of disposable income – few luxury items are therefore affordable.
1 Manchester Central
2 Burnley
3 Liverpool – Central
4 Kingston upon Hull
5 Accrington
6 Hartlepool
7 Bantam Grove, Leeds
8 Grimsby – Victoria street
9 Bootle
10 Middlesbrough
Top 10 towns for Group J Transient Renters
Transient Renters are single people who pay modest rents for low cost homes.
Penetration
Low Below Average Average Above Average High
Penetration
Low Below Average Average Above Average High
10 | Key trends in the UK population Key trends in the UK population | 11
UniLand Today almost every university in the UK has spawned pockets of buy-to-let housing almost exclusively inhabited by students. That said, there are large variations between towns as the spending power of students varies, dictated by the standing of the institution and variations in their student bodies’ spending power. This has been traditionally fed by the purchase of old and cheap housing and their subdivision or sub-letting. However, more recently we can see a growth in the construction of large purpose built flats that offer better en-suite facilities within walking distance of the university.
Students are the largest users of the internet in terms of time and Mosaic Type O66 Student Scene are the most likely to use their smartphones to check Facebook and Twitter. This is perhaps not surprising as Facebook grew out of an application to help students contact their friends and manage their time.
For a number of large northern and midland cities such as Manchester, Leeds and Nottingham the imported spending power of large numbers of students strengthens the local economy. When many students stay on beyond graduation, this acts as a further boost to the city. For pubs and clubs, fast food retailers, fashion brands and technology related stores, knowing which areas in towns this group reside in is worth its weight in gold. For public policy – including health, police and local authorities – it is clear that the needs and services for a ward dominated by students will be seasonal and different from a residential area of families or the elderly.
Top 10 towns for Type O66 Student Scene
1 Sheffield – Central
2 Manchester – Central
3 Leeds – Central
4 Hatfield
5 Cardiff
6 Liverpool – Central
7 Swansea
8 Birmingham – Central
9 Nottingham – Central
10 Newcastle upon Tyne – Central
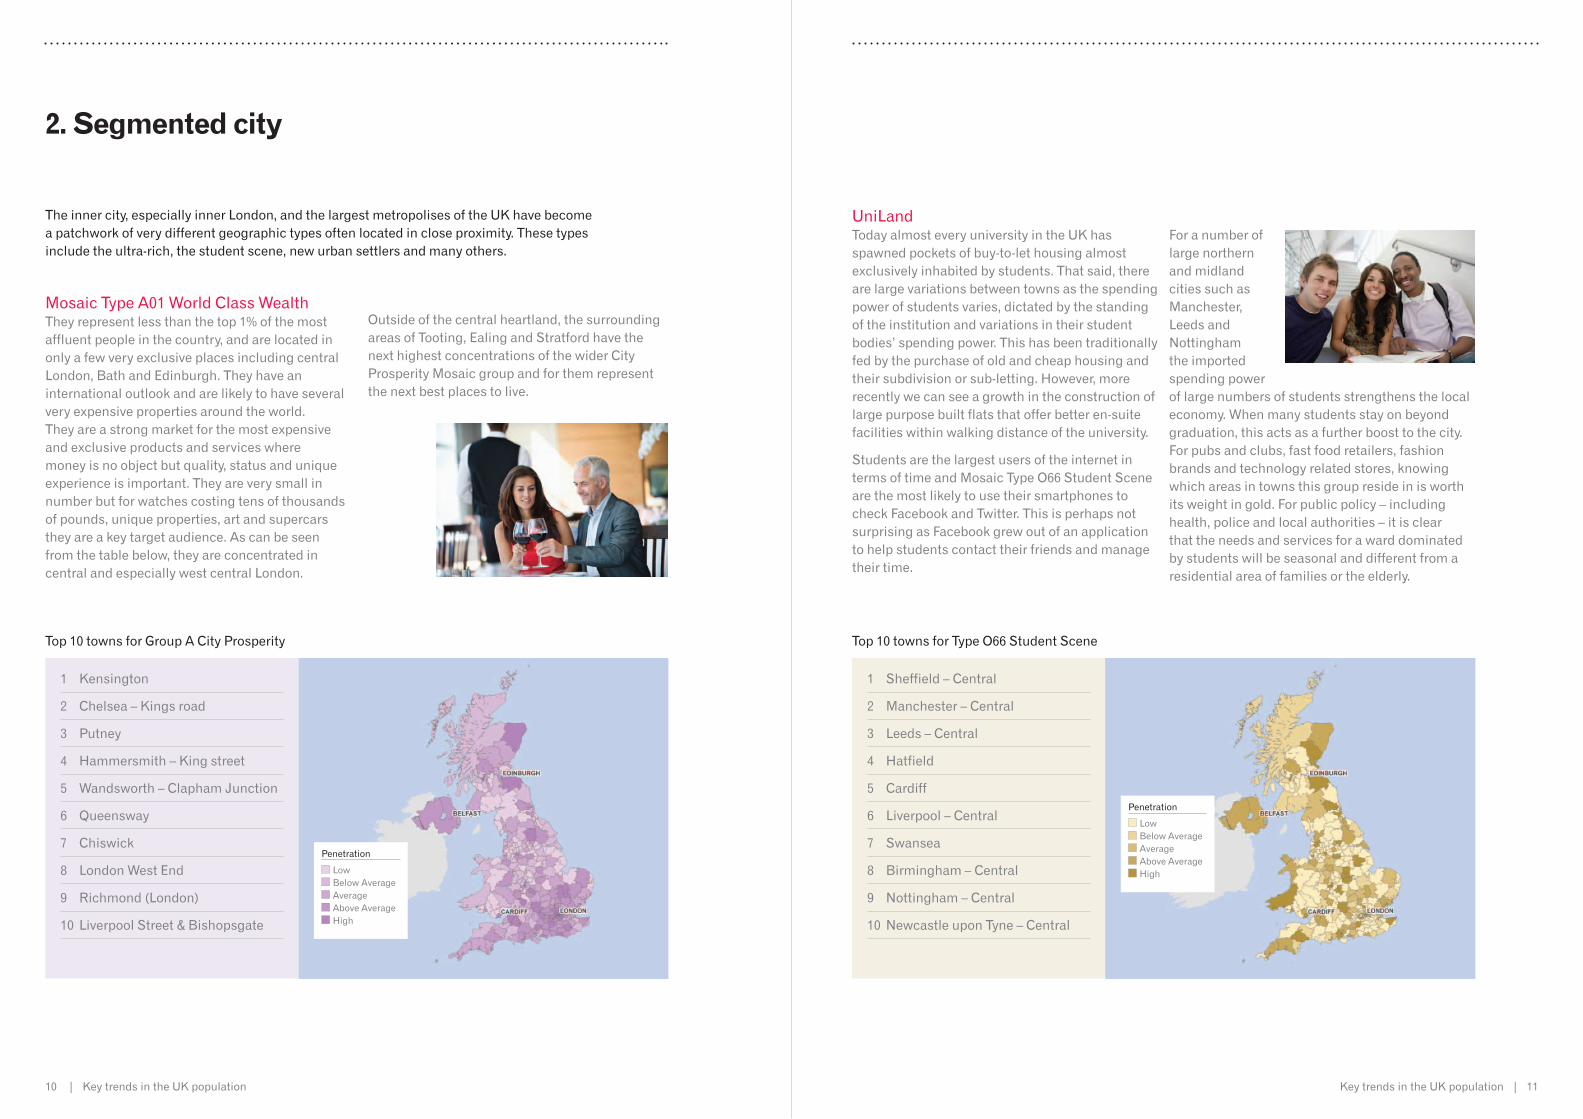
Mosaic Type A01 World Class Wealth They represent less than the top 1% of the most affluent people in the country, and are located in only a few very exclusive places including central London, Bath and Edinburgh. They have an international outlook and are likely to have several very expensive properties around the world. They are a strong market for the most expensive and exclusive products and services where money is no object but quality, status and unique experience is important. They are very small in number but for watches costing tens of thousands of pounds, unique properties, art and supercars they are a key target audience. As can be seen from the table below, they are concentrated in central and especially west central London.
Outside of the central heartland, the surrounding areas of Tooting, Ealing and Stratford have the next highest concentrations of the wider City Prosperity Mosaic group and for them represent the next best places to live.
Top 10 towns for Group A City Prosperity
1 Kensington
2 Chelsea – Kings road
3 Putney
4 Hammersmith – King street
5 Wandsworth – Clapham Junction
6 Queensway
7 Chiswick
8 London West End
9 Richmond (London)
10 Liverpool Street & Bishopsgate
The inner city, especially inner London, and the largest metropolises of the UK have become a patchwork of very different geographic types often located in close proximity. These types include the ultra-rich, the student scene, new urban settlers and many others.
2. Segmented city
Penetration
Low Below Average Average Above Average High
Penetration
Low Below Average Average Above Average High
12 | Key trends in the UK population Key trends in the UK population | 13
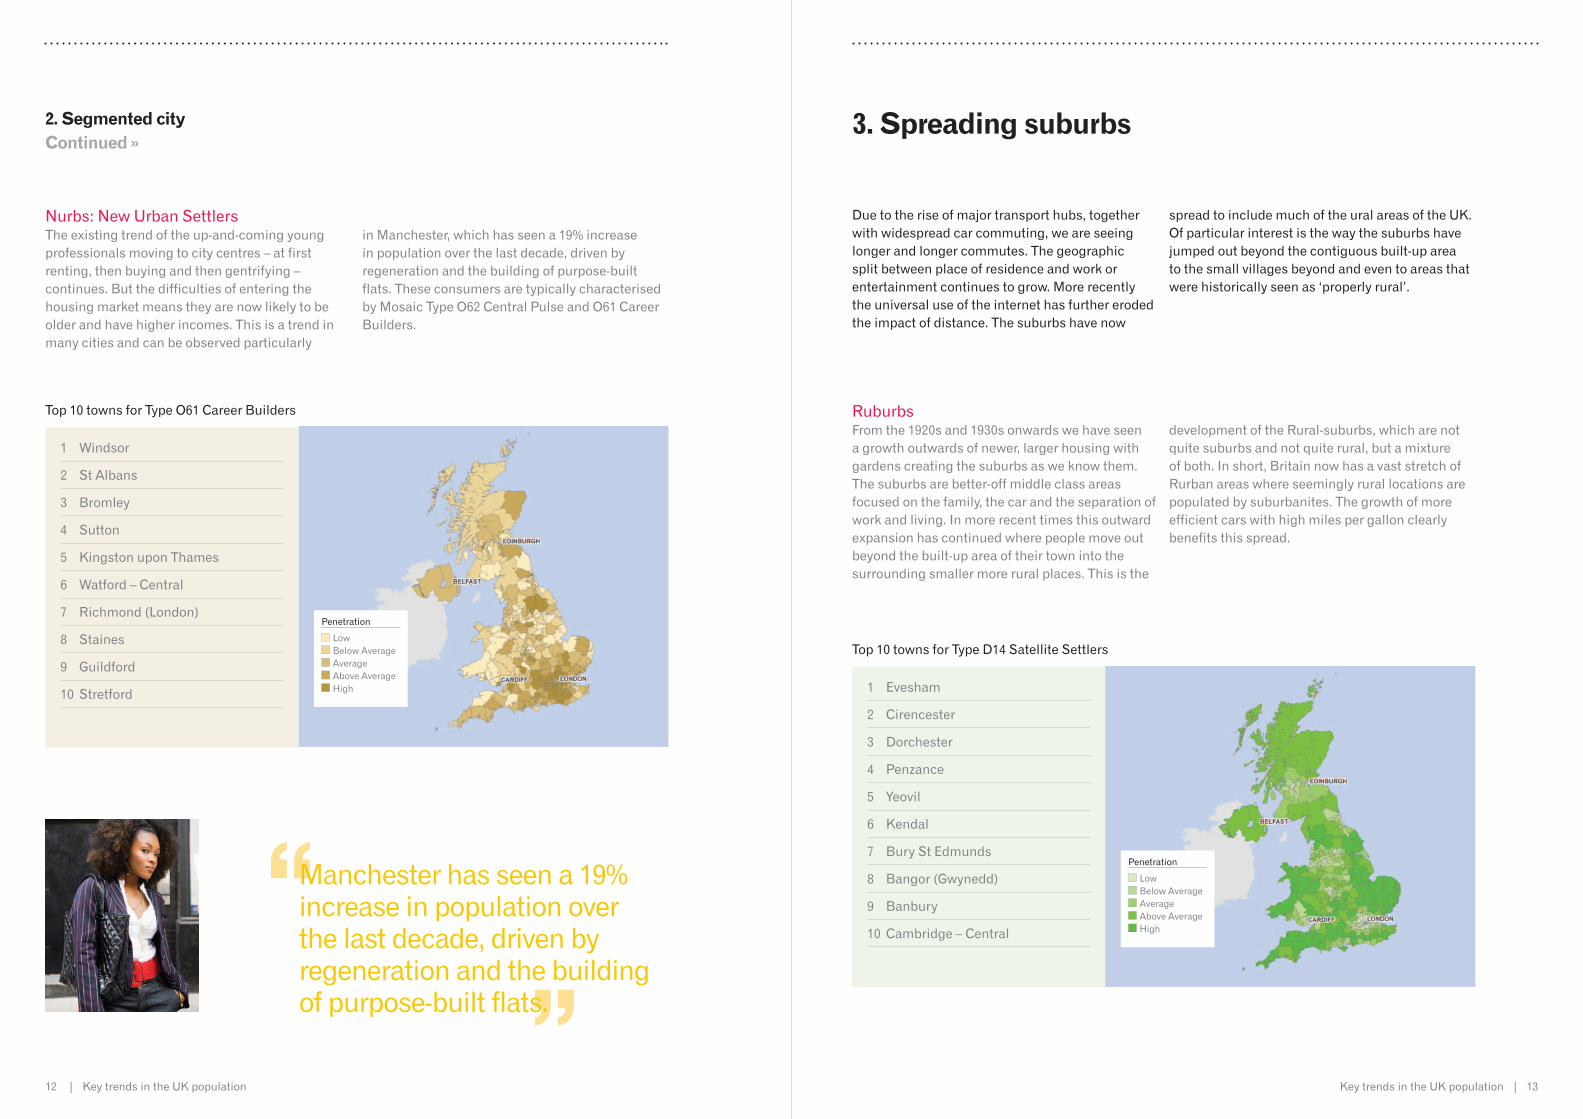
Ruburbs From the 1920s and 1930s onwards we have seen a growth outwards of newer, larger housing with gardens creating the suburbs as we know them. The suburbs are better-off middle class areas focused on the family, the car and the separation of work and living. In more recent times this outward expansion has continued where people move out beyond the built-up area of their town into the surrounding smaller more rural places. This is the
development of the Rural-suburbs, which are not quite suburbs and not quite rural, but a mixture of both. In short, Britain now has a vast stretch of Rurban areas where seemingly rural locations are populated by suburbanites. The growth of more efficient cars with high miles per gallon clearly benefits this spread.
Top 10 towns for Type D14 Satellite Settlers
1 Evesham
2 Cirencester
3 Dorchester
4 Penzance
5 Yeovil
6 Kendal
7 Bury St Edmunds
8 Bangor (Gwynedd)
9 Banbury
10 Cambridge – Central
Due to the rise of major transport hubs, together with widespread car commuting, we are seeing longer and longer commutes. The geographic split between place of residence and work or entertainment continues to grow. More recently the universal use of the internet has further eroded the impact of distance. The suburbs have now
spread to include much of the ural areas of the UK. Of particular interest is the way the suburbs have jumped out beyond the contiguous built-up area to the small villages beyond and even to areas that were historically seen as ‘properly rural’.
3. Spreading suburbs
Nurbs: New Urban Settlers The existing trend of the up-and-coming young professionals moving to city centres – at first renting, then buying and then gentrifying – continues. But the difficulties of entering the housing market means they are now likely to be older and have higher incomes. This is a trend in many cities and can be observed particularly
in Manchester, which has seen a 19% increase in population over the last decade, driven by regeneration and the building of purpose-built flats. These consumers are typically characterised by Mosaic Type O62 Central Pulse and O61 Career Builders.
1 Windsor
2 St Albans
3 Bromley
4 Sutton
5 Kingston upon Thames
6 Watford – Central
7 Richmond (London)
8 Staines
9 Guildford
10 Stretford
Top 10 towns for Type O61 Career Builders
Manchester has seen a 19% increase in population over the last decade, driven by regeneration and the building of purpose-built flats.
2. Segmented city Continued »
Penetration
Low Below Average Average Above Average High
Penetration
Low Below Average Average Above Average High
14 | Key trends in the UK population Key trends in the UK population | 15
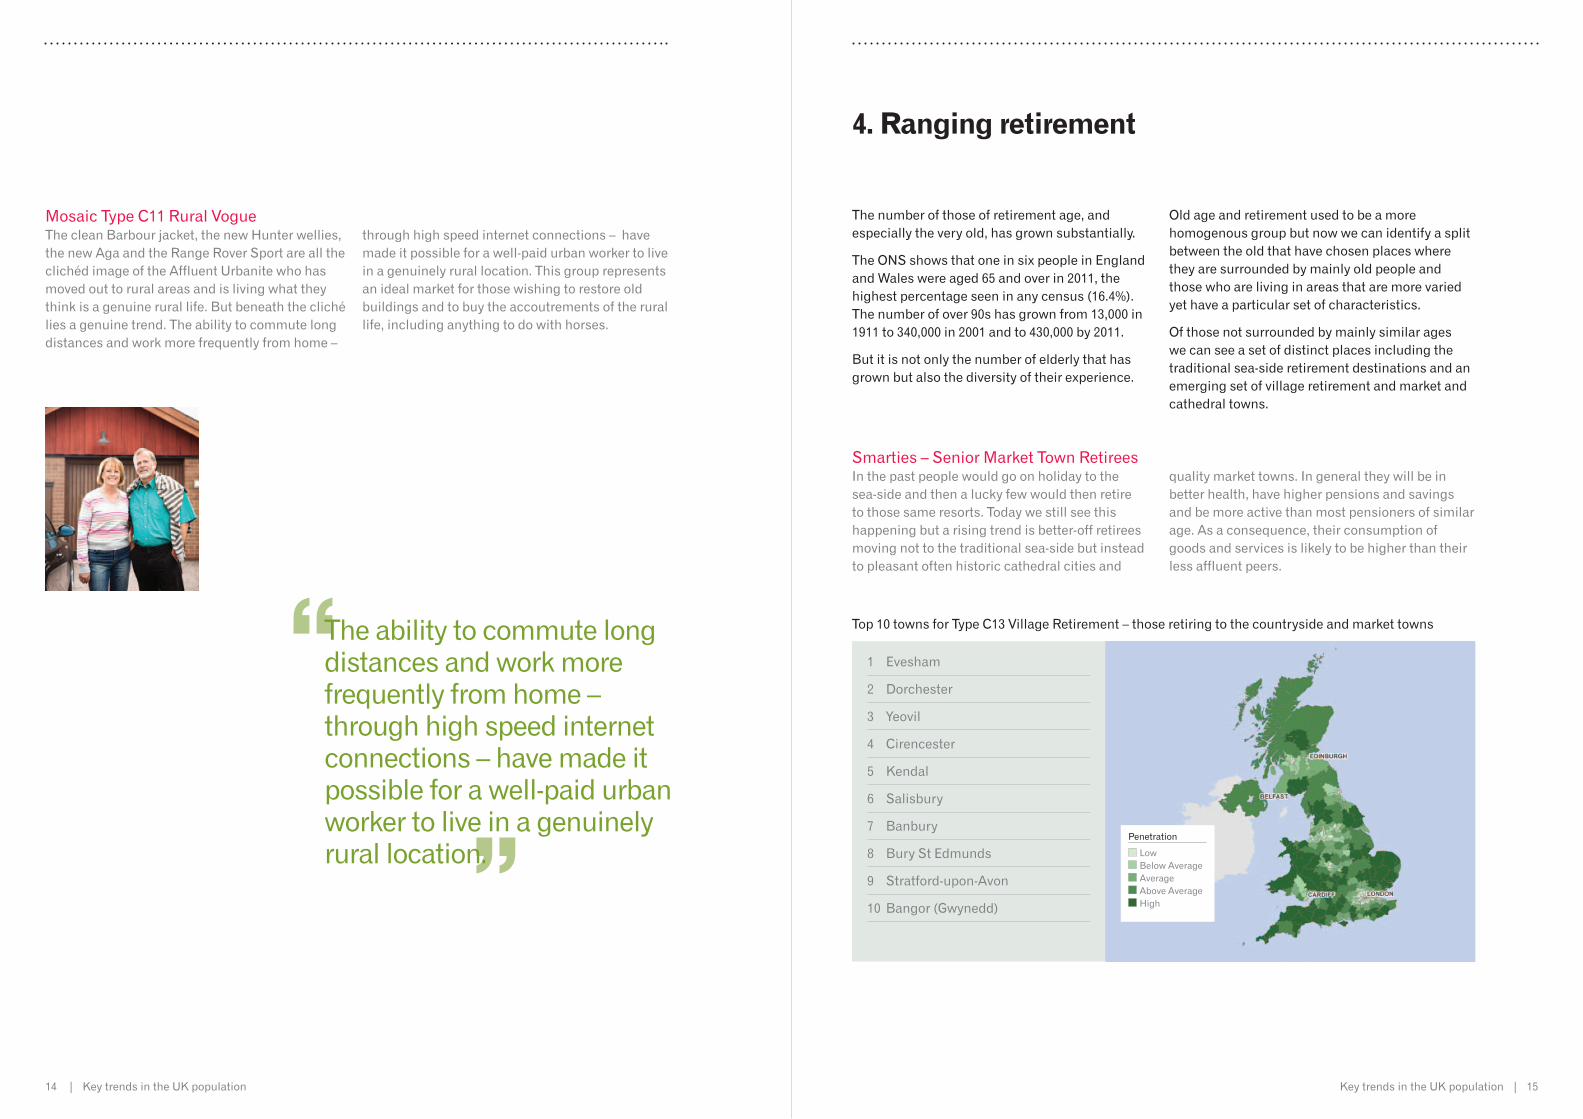
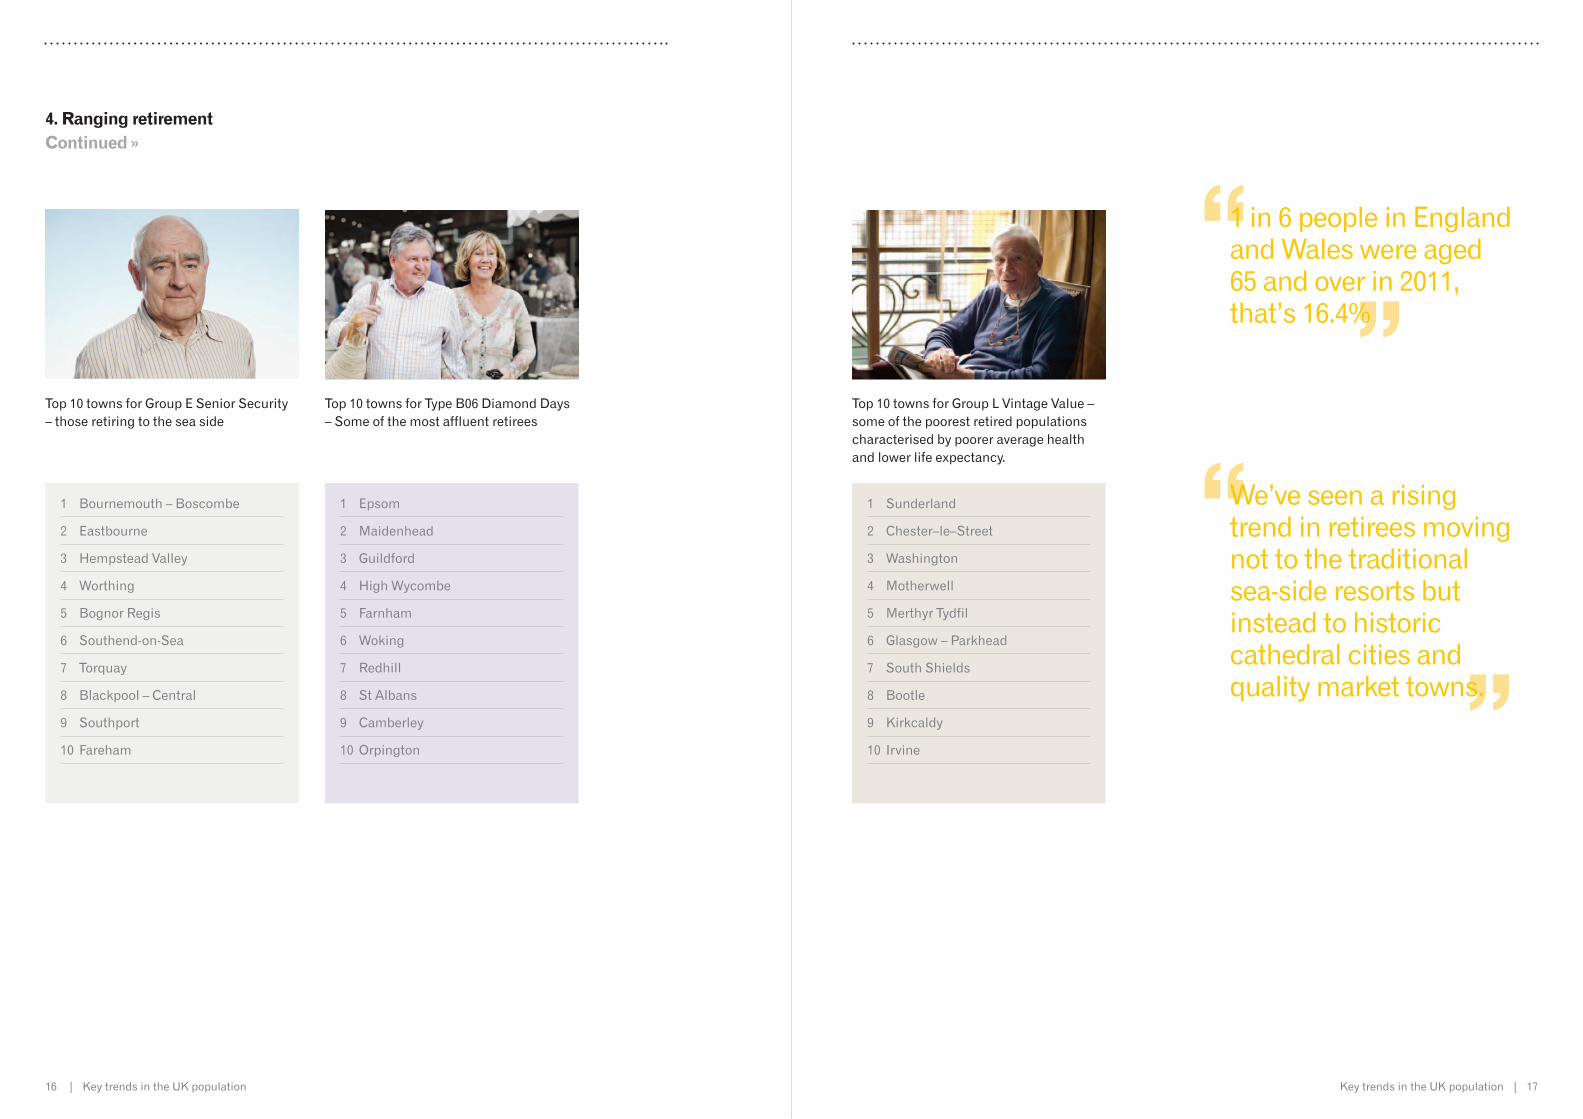
Smarties – Senior Market Town Retirees In the past people would go on holiday to the sea-side and then a lucky few would then retire to those same resorts. Today we still see this happening but a rising trend is better-off retirees moving not to the traditional sea-side but instead to pleasant often historic cathedral cities and
quality market towns. In general they will be in better health, have higher pensions and savings and be more active than most pensioners of similar age. As a consequence, their consumption of goods and services is likely to be higher than their less affluent peers.
Top 10 towns for Type C13 Village Retirement – those retiring to the countryside and market towns
1 Evesham
2 Dorchester
3 Yeovil
4 Cirencester
5 Kendal
6 Salisbury
7 Banbury
8 Bury St Edmunds
9 Stratford-upon-Avon
10 Bangor (Gwynedd)
The number of those of retirement age, and especially the very old, has grown substantially.
The ONS shows that one in six people in England and Wales were aged 65 and over in 2011, the highest percentage seen in any census (16.4%). The number of over 90s has grown from 13,000 in 1911 to 340,000 in 2001 and to 430,000 by 2011.
But it is not only the number of elderly that has grown but also the diversity of their experience.
Old age and retirement used to be a more homogenous group but now we can identify a split between the old that have chosen places where they are surrounded by mainly old people and those who are living in areas that are more varied yet have a particular set of characteristics.
Of those not surrounded by mainly similar ages we can see a set of distinct places including the traditional sea-side retirement destinations and an emerging set of village retirement and market and cathedral towns.
4. Ranging retirement
Mosaic Type C11 Rural Vogue The clean Barbour jacket, the new Hunter wellies, the new Aga and the Range Rover Sport are all the clichéd image of the Affluent Urbanite who has moved out to rural areas and is living what they think is a genuine rural life. But beneath the cliché lies a genuine trend. The ability to commute long distances and work more frequently from home –
through high speed internet connections – have made it possible for a well-paid urban worker to live in a genuinely rural location. This group represents an ideal market for those wishing to restore old buildings and to buy the accoutrements of the rural life, including anything to do with horses.
The ability to commute long distances and work more frequently from home – through high speed internet connections – have made it possible for a well-paid urban worker to live in a genuinely rural location.
Penetration
Low Below Average Average Above Average High
16 | Key trends in the UK population Key trends in the UK population | 17
Top 10 towns for Group L Vintage Value – some of the poorest retired populations characterised by poorer average health and lower life expectancy.
1 Sunderland
2 Chester–le–Street
3 Washington
4 Motherwell
5 Merthyr Tydfil
6 Glasgow – Parkhead
7 South Shields
8 Bootle
9 Kirkcaldy
10 Irvine
4. Ranging retirement Continued »
1 in 6 people in England and Wales were aged 65 and over in 2011, that’s 16.4%
We’ve seen a rising trend in retirees moving not to the traditional sea-side resorts but instead to historic cathedral cities and quality market towns.
Top 10 towns for Group E Senior Security – those retiring to the sea side
1 Bournemouth – Boscombe
2 Eastbourne
3 Hempstead Valley
4 Worthing
5 Bognor Regis
6 Southend-on-Sea
7 Torquay
8 Blackpool – Central
9 Southport
10 Fareham
Top 10 towns for Type B06 Diamond Days – Some of the most affluent retirees
1 Epsom
2 Maidenhead
3 Guildford
4 High Wycombe
5 Farnham
6 Woking
7 Redhill
8 St Albans
9 Camberley
10 Orpington
18 | Key trends in the UK population
What does this mean for your organisation?
We can clearly see from these patterns of change that the UK is an ever more segmented country. Even short distances can make a large difference to a range of key characteristics of people - their age, levels of affluence or poverty, their health, levels of activity and the houses they live in.
Clearly a full understanding of these patterns brings opportunities for commercial organisations to positively change their activity, such as the location of outlets, the type of products and services that best suit an area and the best people and locations to market to.
Similarly public policy can also take advantage of these same social and geographic patterns to target ever more constrained levels of public expenditure in the most effective way.
Media coverage on phenomena such as the emergence of the super-rich, the ageing population and students returning to their family home after graduation means that in most cases there has been a general awareness of these newly defined groups of people. However, until the development of new Mosaic, no-one has been able to accurately identify exactly who these individuals are. Equally, it has not been possible to identify with any confidence the types of products and services that should be targeted at these shifting segments.
Through new Mosaic, organisations can now identify with certainty the new consumer, household and location types within the UK population. This allows a much clearer view of the types of individuals living in particular locations, enabling organisations to better acknowledge individuals’ needs and motivations and, in turn, be more relevant when engaging them.
Armed with insight from new Mosaic, organisations can now identify segments within their own customer base or their wider audience and target these people across different channels to deliver consistent targeting and messages, driving incremental penetration, greater share of wallet and increased service uptake.
Key trends in the UK population | 19
Through new Mosaic, organisations can now identify with certainty the new consumer, household and location types within the UK population
About Experian Marketing Services Experian Marketing Services is a global provider of integrated consumer insight and targeting, data quality and cross-channel marketing. We help organisations from around the world intelligently interact with today’s dynamic, empowered and hyperconnected customers. By coordinating seamless interactions across all marketing channels, marketers are able to plan and execute superior brand experiences that deepen customer loyalty, strengthen brand advocacy and maximise profits.

© Experian Limited 2014.The word “EXPERIAN” and the graphical device are trade marks of Experian and/or its associated companies and may be registered in the EU, USA and other countries. The graphical device is a registered Community design in the EU. All rights reserved.
Experian Ltd is authorised and regulated by the Financial Conduct Authority. Experian Ltd is registered in England and Wales under company registration number 653331. Registered office address: Landmark House, Experian Way, NG2 Business Park, Nottingham, NG80 1ZZ.
Intelligent interactions.Every time.
6th Floor Cardinal Place80 Victoria StreetLondonSW1E 5JLwww.experian.co.uk/marketingservices
Embankment House Electric Avenue Nottingham NG80 1EH
160 Dundee St Fountainbridge Edinburgh EH11 1DQ