Embed Size (px)
Citation preview
Key results from the survey on organic agriculture worldwide 2012 Part 3: Organic agriculture in the regions 2010
Research Institute of Organic Agriculture FiBL, Frick, Switzerland, in cooperation with the International Federation of Organic Agriculture Movements IFOAM
Supported by: Swiss State Secretariat of Economic Affairs, International Trade Centre, NürnbergMesse
Data as published February 2012 in The World of Organic Agriculture. Statistics and Emerging Trends 2012For updates check www.organic-world.net
http://www.organic-world.net/yearbook-2012-presentations.html?&L=0Version of May 5, 2012
www.fibl.org
The Global Survey on Organic Agriculture: Supporters
› International Trade Centre, Geneva
› The Swiss State Secretariat of
Economic Affairs SECO, Berne
› Nürnberg Messe, the organizers of the
BioFach Organic Trade Fair

www.fibl.org
The World of Organic Agriculture 2012
› The 13th edition of ‚The World of Organic Agriculture‘, was published by FiBL and IFOAM in February 2012.*
› Contents:› Results of the survey on organic agriculture
worldwide;› Organic agriculture in the regions and
country reports;› Australia, Azerbaijan, Benin, Bulgaria,
Canada, Ethiopia, Iran, Pacific Islands, Peru, Thailand, Turkey and United States.
› Chapters on the global market, standards & legislations, voluntary standards , PGS and European market
› Numerous tables and graphs. › The book can be ordered via IFOAM.org
and shop.FiBL.org.
*Willer, H, and Kilcher, L. (2012) The World of Organic Agriculture. Statistics and Emerging Trends 2012. IFOAM, Bonn, and FiBL, Frick
www.fibl.org
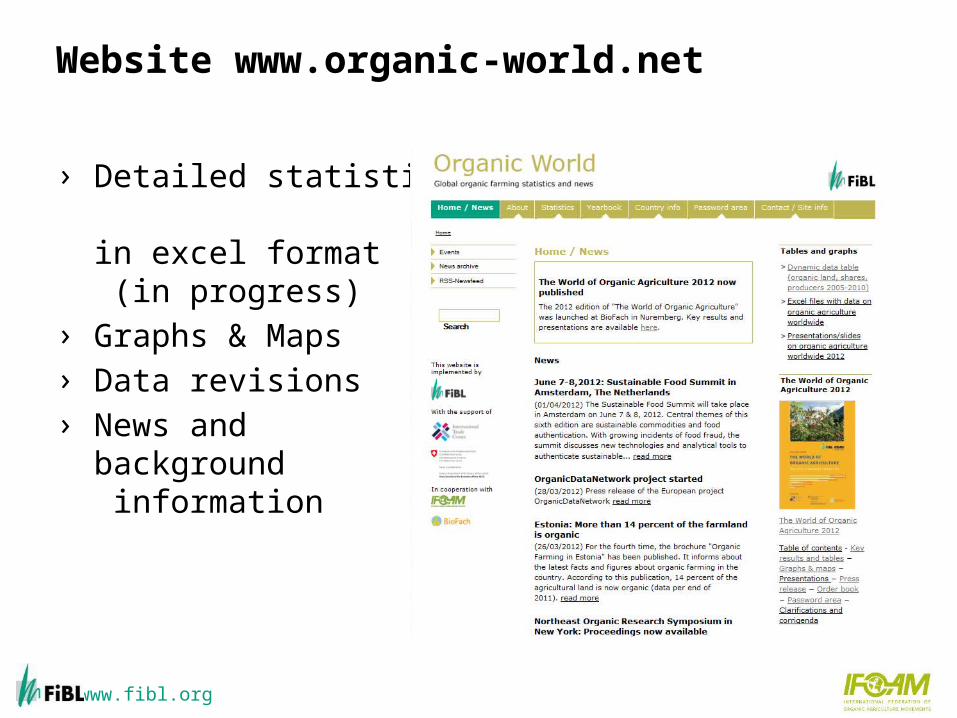
Website www.organic-world.net
› Detailed statistics in excel format (in progress)
› Graphs & Maps› Data revisions› News and
background information

www.fibl.org
About this presentation
› This presentation summarizes the key results of the FiBL-
IFOAM survey on organic agriculture worldwide 2012
(data 2010).
› In further presentations, other key results on organic
agriculture world-wide and on crop data are presented.
› The presentations are available at
http://www.organic-world.net/yearbook-2012-
presentations.html
www.fibl.org
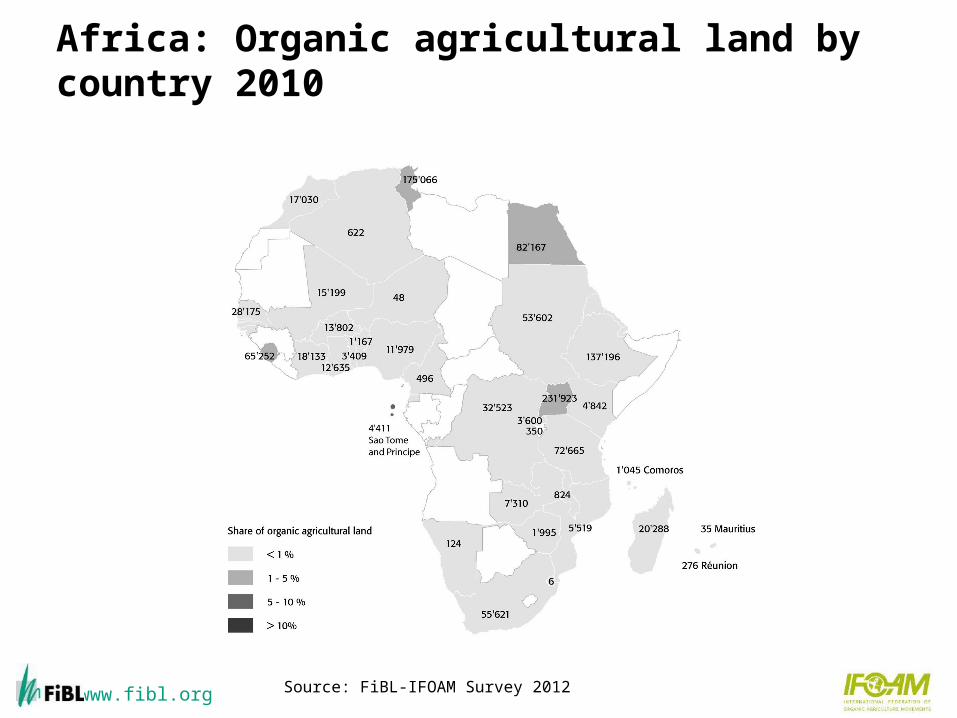
Africa: Organic agricultural land by country 2010
Source: FiBL-IFOAM Survey 2012
www.fibl.org
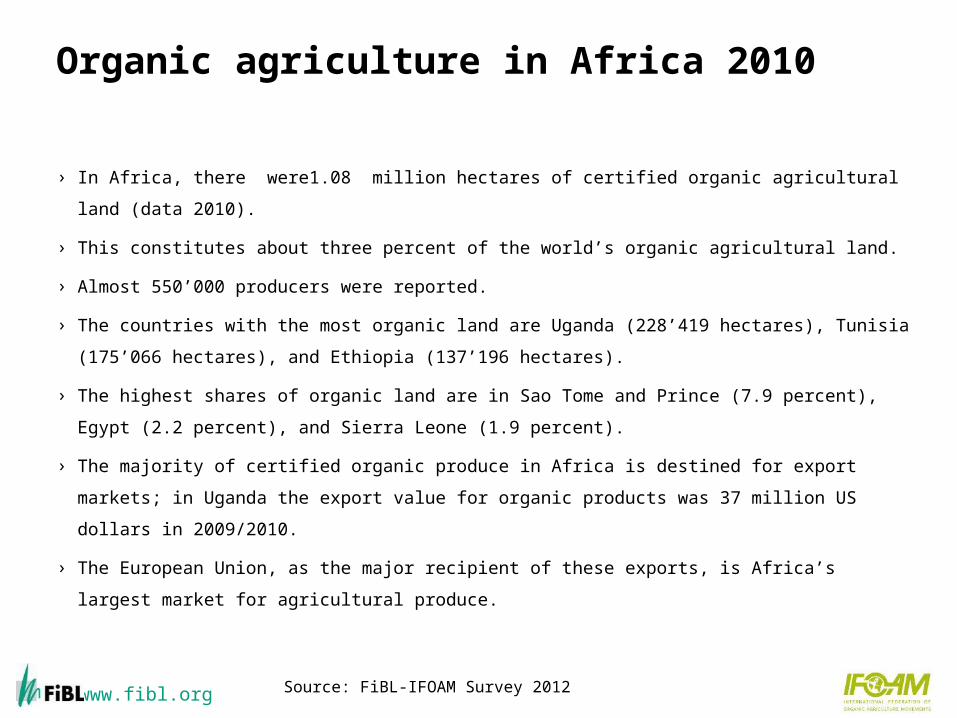
Organic agriculture in Africa 2010
› In Africa, there were1.08 million hectares of certified organic agricultural land (data
2010).
› This constitutes about three percent of the world’s organic agricultural land.
› Almost 550’000 producers were reported.
› The countries with the most organic land are Uganda (228’419 hectares), Tunisia
(175’066 hectares), and Ethiopia (137’196 hectares).
› The highest shares of organic land are in Sao Tome and Prince (7.9 percent), Egypt (2.2
percent), and Sierra Leone (1.9 percent).
› The majority of certified organic produce in Africa is destined for export markets; in
Uganda the export value for organic products was 37 million US dollars in 2009/2010.
› The European Union, as the major recipient of these exports, is Africa’s largest market
for agricultural produce.
Source: FiBL-IFOAM Survey 2012
www.fibl.org
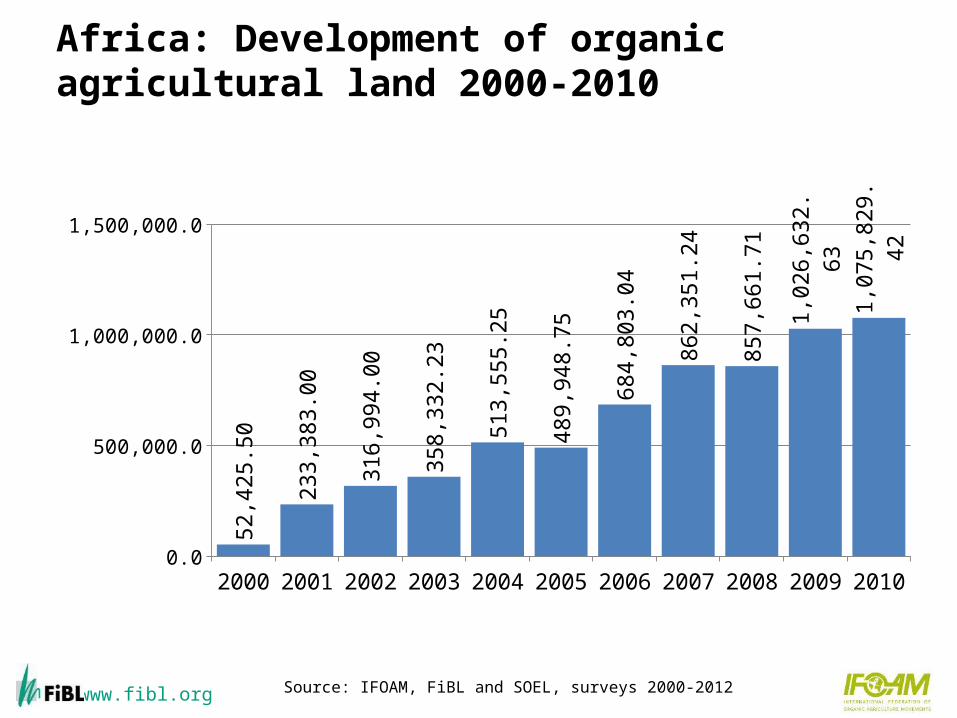
Africa: Development of organic agricultural land 2000-2010
Source: IFOAM, FiBL and SOEL, surveys 2000-2012
2000 2001 2002 2003 2004 2005 2006 2007 2008 2009 20100.0
500,000.0
1,000,000.0
1,500,000.052
,425
.50
233,
383.
00
316,
994.
00
358,
332.
23
513,
555.
25
489,
948.
75
684,
803.
04
862,
351.
24
857,
661.
71
1,02
6,63
2.63
1,07
5,82
9.42
www.fibl.org
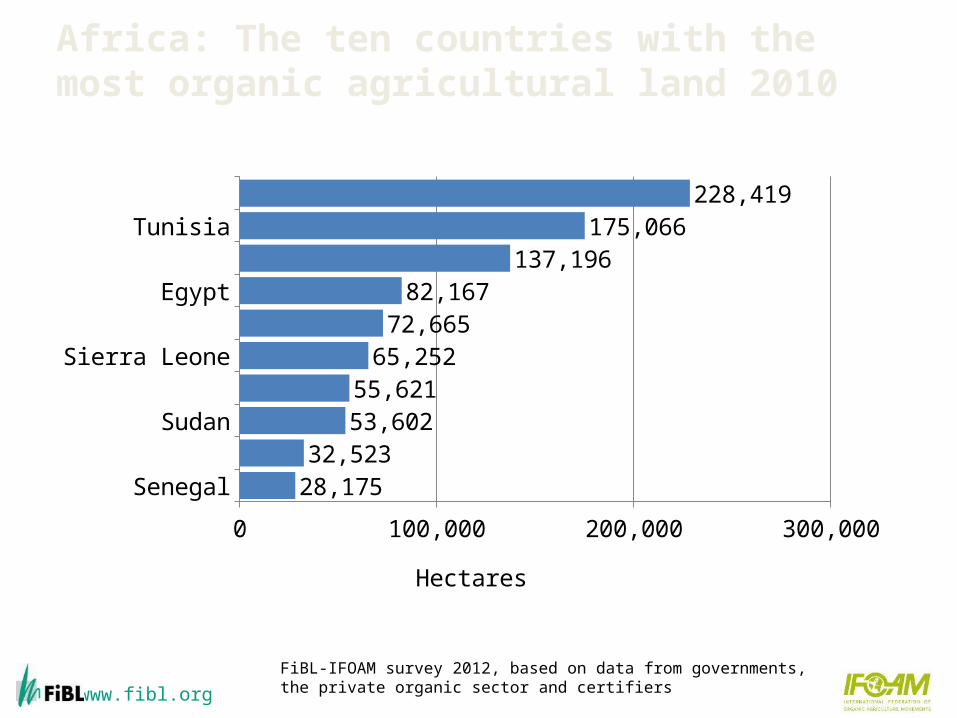
Africa: The ten countries with the most organic agricultural land 2010
FiBL-IFOAM survey 2012, based on data from governments, the private organic sector and certifiers
SenegalDemocratic Republic of the Congo
SudanSouth AfricaSierra Leone
Tanzania (2008)Egypt
EthiopiaTunisiaUganda
0 100,000 200,000 300,000
28,17532,523
53,60255,621
65,25272,665
82,167137,196
175,066228,419
Hectares

www.fibl.org
21%228’419ha
16%175’066ha
13%137’196ha
50%535’148ha
UgandaTunisiaEthiopiaRest
Africa: Distribution of organically managed agricultural land by country 2010 (total: 1.07 mio ha)
FiBL-IFOAM survey 2012
www.fibl.org
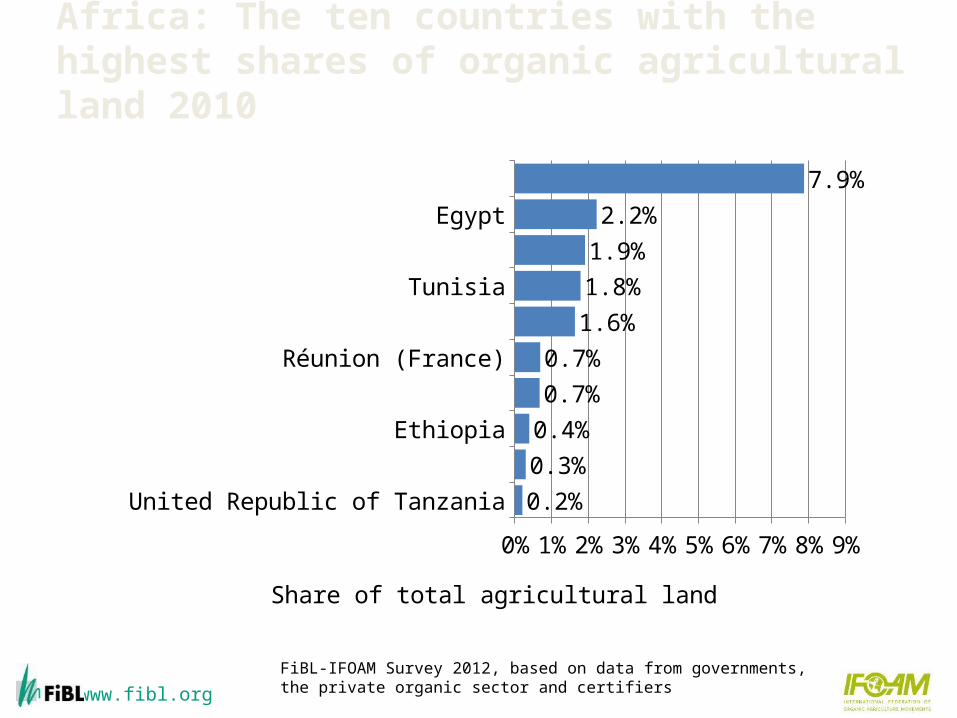
Africa: The ten countries with the highest shares of organic agricultural land 2010
FiBL-IFOAM Survey 2012, based on data from governments, the private organic sector and certifiers
United Republic of Tanzania
Senegal
Ethiopia
Comoros
Réunion (France)
Uganda
Tunisia
Sierra Leone
Egypt
Sao Tome and Principe
0% 1% 2% 3% 4% 5% 6% 7% 8% 9%
0.2%
0.3%
0.4%
0.7%
0.7%
1.6%
1.8%
1.9%
2.2%
7.9%
Share of total agricultural land
www.fibl.org
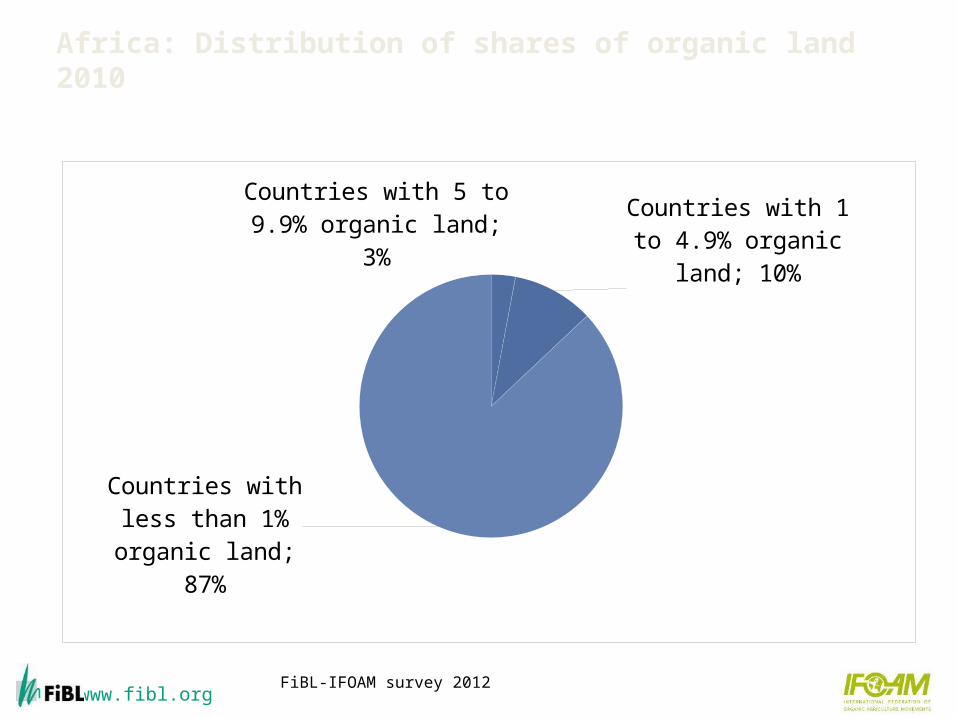
Countries with 5 to 9.9% organic land; 3%
Countries with 1 to 4.9% organic land;
10%
Countries with less than 1% organic
land; 87%
Africa: Distribution of shares of organic land 2010
FiBL-IFOAM survey 2012

www.fibl.org
Africa: Use of organic agricultural land 2010 (total: 1.08 million hectares)
FiBL-IFOAM survey 2012
Arable crops9%
Perm. crops45%
Perm. grassland3%
Other agr. land5%
No detail
s37%
Land use
Cereals
Medicinal and aromatic plants
Oilseeds
0
10,000
20,000
30,000
40,000
50,000
3,207.96,766.5
9,561.232,688.0
36,363.2
Key arable crop groups
In thousands of hectares
Fruit, tropical and subtropical
Nuts
Cocoa
Olives
Coffee
0 100,000 200,000
17,696.0
19,922.9
74,195.0
121,630.6
168,293.0
Key permanent crop groups
In thousands of hectares

www.fibl.org
Articles about Africa in the 2012 Edition of "The World of Organic Agriculture"
› Organic Farming in Africa: Latest Developments
Hervé Bouagnimbeck
› Benin: Country Report
Laurent Glin
› Organic Agriculture in Ethiopia: Current Status and
Perspectives
Addisu Alemayehu
www.fibl.org
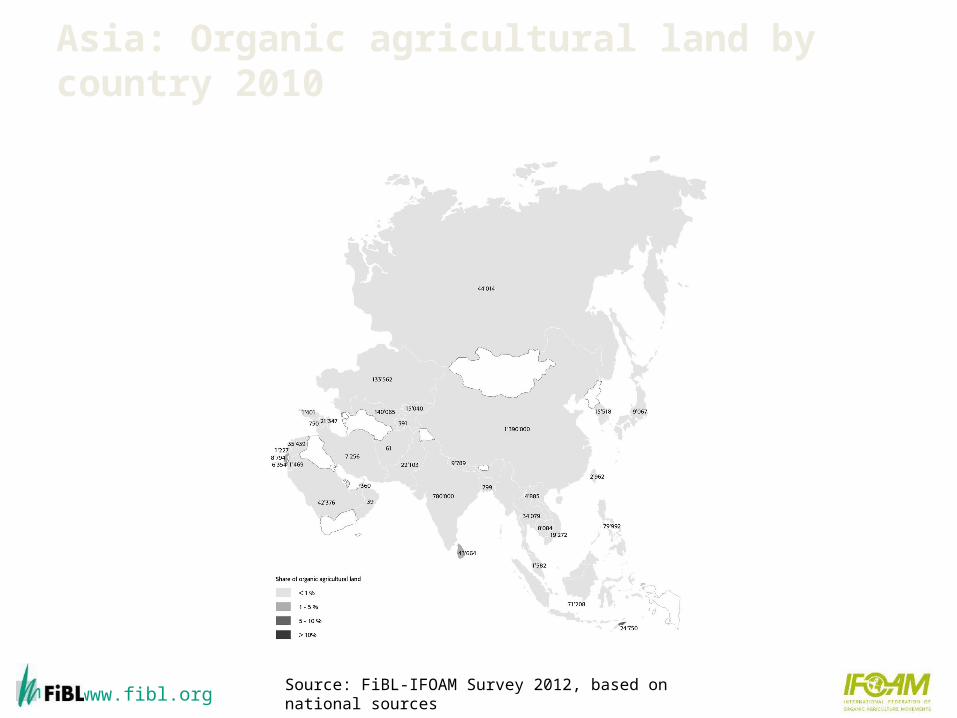
Asia: Organic agricultural land by country 2010
Source: FiBL-IFOAM Survey 2012, based on national sources

www.fibl.org
Organic Agriculture in Asia – Key Figures 2010
› The total organic agricultural area in was Asia 2.8 million hectares
in 2010.
› This constitutes seven percent of the world’s organic agricultural
land.
› There were 0.5 million producers reported.
› The leading countries by organic agricultural land are China (1.4
million hectares) and India (0.8 million hectares).
› Timor-Leste has the most organic agricultural area as a proportion
of total agricultural land (almost seven percent).
16
www.fibl.org
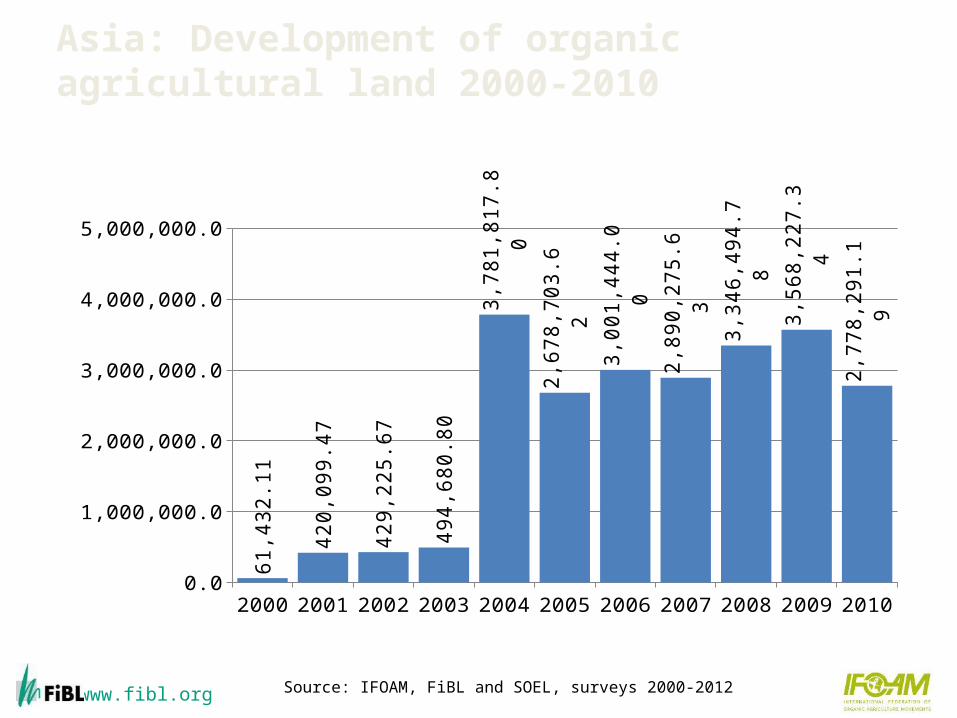
Asia: Development of organic agricultural land 2000-2010
Source: IFOAM, FiBL and SOEL, surveys 2000-2012
2000 2001 2002 2003 2004 2005 2006 2007 2008 2009 20100.0
1,000,000.0
2,000,000.0
3,000,000.0
4,000,000.0
5,000,000.061
,432
.11
420,
099.
47
429,
225.
67
494,
680.
80
3,78
1,81
7.80
2,67
8,70
3.62
3,00
1,44
4.00
2,89
0,27
5.63
3,34
6,49
4.78
3,56
8,22
7.34
2,77
8,29
1.19
www.fibl.org
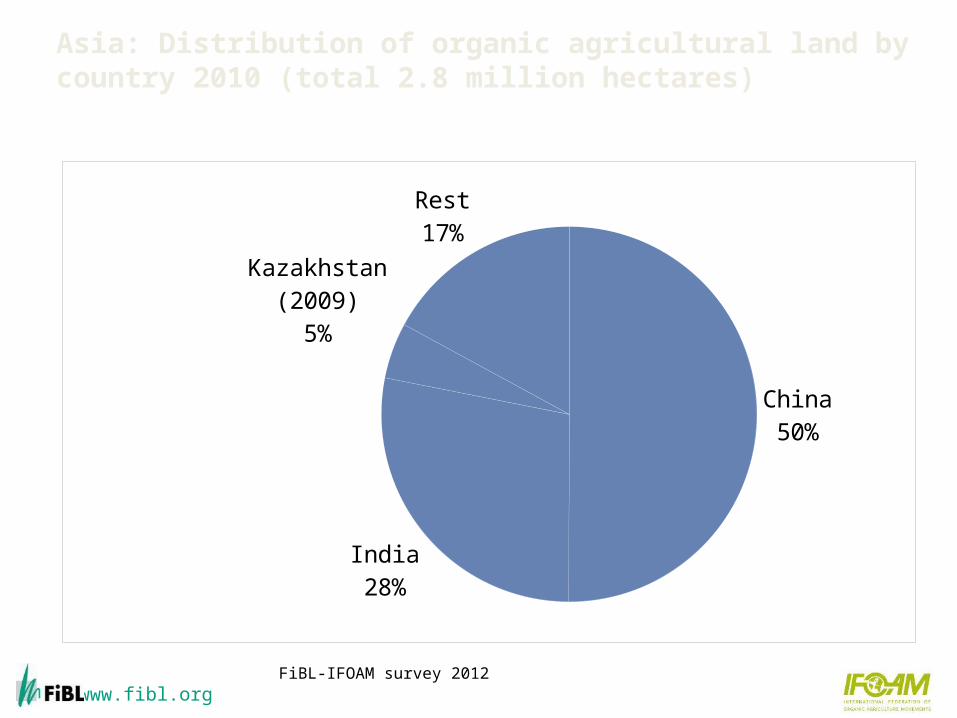
China50%
India28%
Kazakhstan (2009)
5%
Rest17%
Asia: Distribution of organic agricultural land by country 2010 (total 2.8 million hectares)
FiBL-IFOAM survey 2012

www.fibl.org
Asia: The ten countries with the most organic agricultural land 2010
FiBL-IFOAM Survey 2012, based on data from governments, the private organic sector and certifiers
PakistanTimor-Leste
ThailandSaudi Arabia
Sri LankaIndonesia
PhilippinesKazakhstan (2009)
IndiaChina
0 500,000 1,000,000 1,500,000
22,10324,75034,07942,37643,66471,20879,992
133,562780,000
1,390,000
Hectares

www.fibl.org
3%8%
89%
Countries with 5 to 9.9% organic landCountries with 1 to 4.9% organic landCountries with less than 1% organic land
Asia: Distribution of shares of organic land 2010
FiBL Survey 2012, based on data from governments, the private organic sector and certifiers

www.fibl.org
Asia: The ten countries/territories with the highest shares of organic agricultural land 2010
FiBL Survey 2012, based on data from governments, the private organic sector and certifiers
China
Taiwan
India
Azerbaijan
Philippines
Republic of Korea
Sri Lanka
Israel
Palestine
Timor-Leste
0% 1% 2% 3% 4% 5% 6% 7%
0.3%
0.3%
0.4%
0.4%
0.7%
0.8%
1.7%
1.7%
1.7%
6.6%

www.fibl.org
Asia: Use of organic agricultural land 2010(total: 2.8 million hectares)
Source: FiBL survey 2012
Arable crops7% Perm.
crops9%
Perm. grasslan
d22%
No details
63%
Land use 2010
Sugarcane
Medicinal/ aromatic plants
Vegetables
Oilseeds
Cereals
0 50,000 100,000
6,638.9
7,796.4
11,628.4
32,297.3
98,690.1
Key arable crop groups
In thousands of hectares
Nuts
Tea/mate, etc.
Fruit, tropical and subtropical
Coconut
Coffee
0 50,000 100,000
21,375.2
32,795.0
38,016.4
49,908.3
64,406.0
Key permanent crop groups
In thousands of hectares
www.fibl.org
Articles about Asia in the 2012 Edition of "The World of Organic Agriculture"
› Organic Asia 2012
Ong Kung Wai
› Organic Agriculture in Azerbaijan
Vugar Babayev
› Organic Food & Farming in Iran
Paul Rye Kledal, Hossein Mahmuodi and Majid Mahdavi
Damghani
› Overview of Thai Organic Agriculture
Vitoon R. Panyakul

www.fibl.org
Europe: Organic agricultural land by country 2010
Source: FiBL Survey 2012
www.fibl.org
Organic agriculture in Europe: Key data/indicators 2010
› 10 million hectares of agricultural land are organic
(including in conversion areas).
› This constitutes 2.1 percent of the agricultural land in
Europe.
› The organic agricultural land increased by 0.8 million
hectares or nine percent in 2010 .
› Amost 280’000 producers were reported.
Source: FiBL Survey 2012
www.fibl.org
Organic agriculture in the European Union: Key data/indicators 2010
› Nine million hectares of agricultural land are organic
(including in conversion areas).
› This constitutes 5.1 percent of the agricultural land in the
European Union.
› The organic agricultural land increased by 0.7 million
hectares or nine percent in 2010.
› Almost 220’000 producers were reported.
Source: FiBL Survey 2012
www.fibl.org
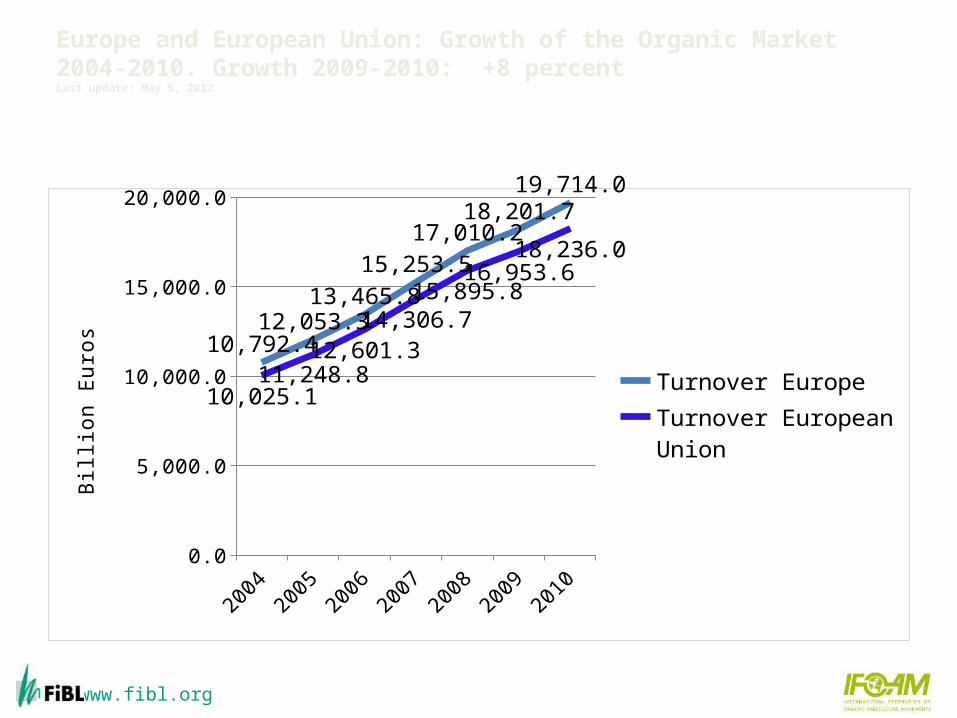
Organic market in Europe: Key data/indicators 2010
› The market was 19.6 billion euros, an increase of roughly eight
percent compared with 2009.
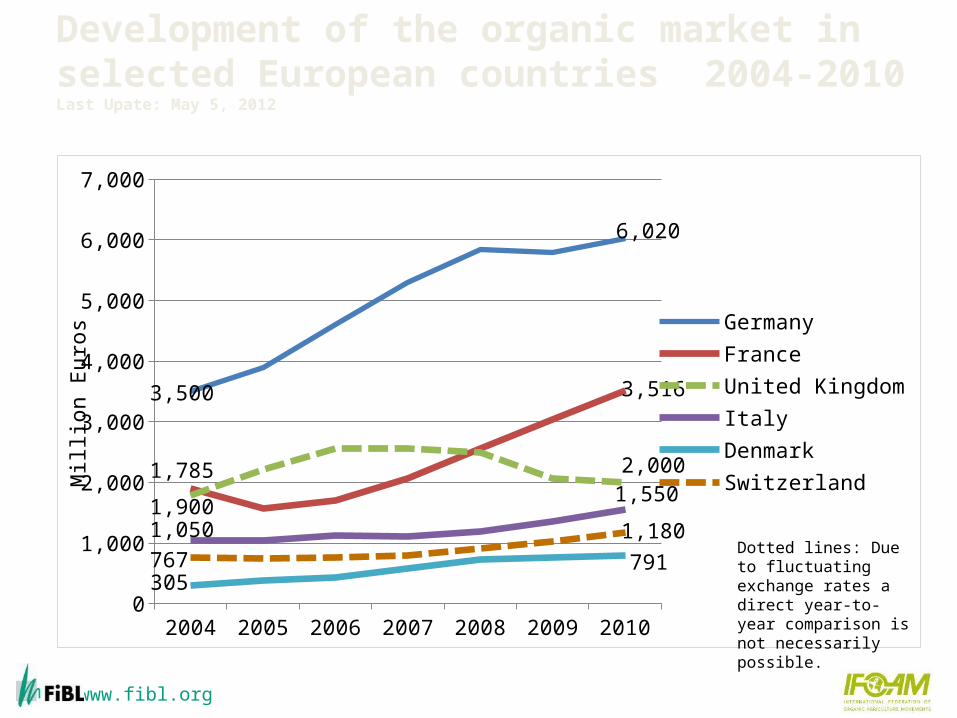
› The largest market for organic products in 2009 was Germany
with a turnover of 6’020 million euros, followed by France (3’385
million euros) and the UK (2'000 million euros).
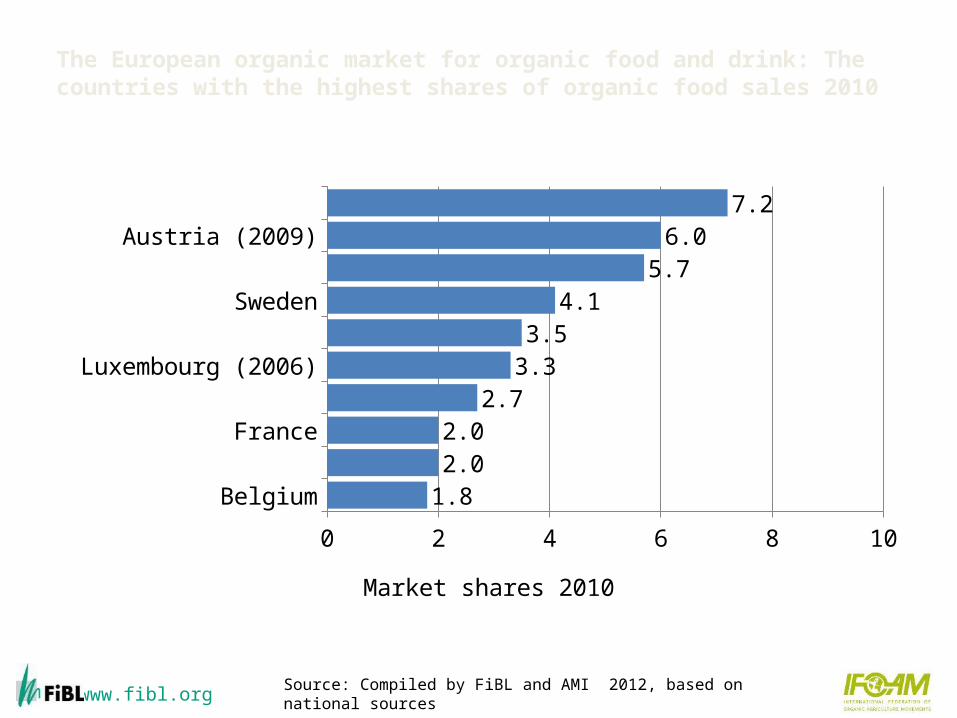
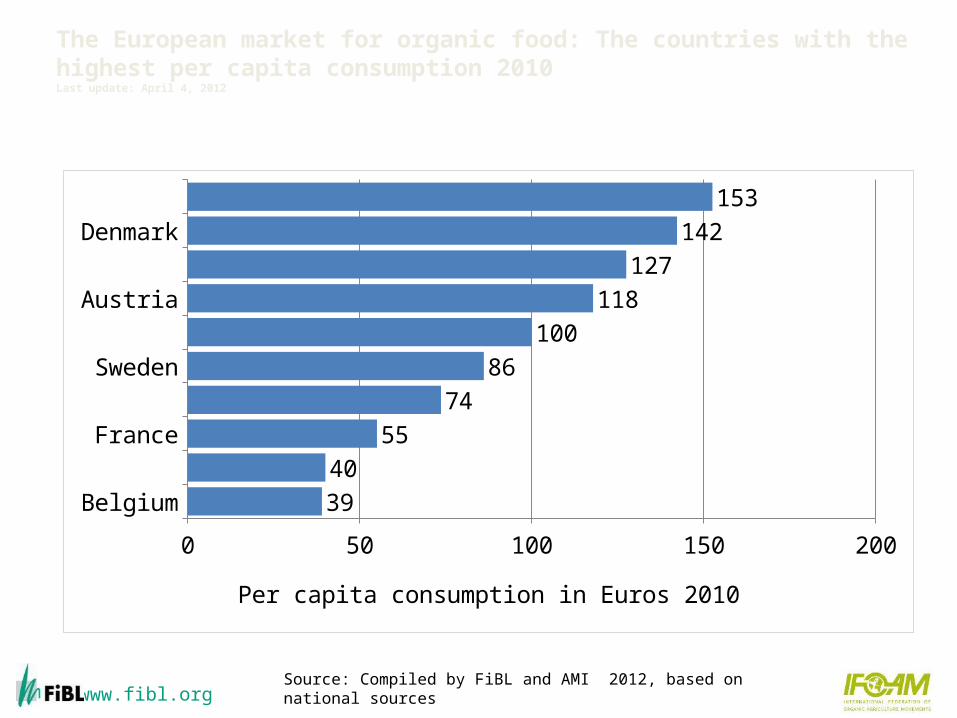
› As a portion of the total market share, the highest levels have
been reached in Denmark, Austria and Switzerland, with five
percent or more for organic products. The highest per capita
spending is also in these countries and in Luxembourg.

www.fibl.org
Europe: The ten countries with the most organic agricultural land 2010
FiBL-IFOAM Survey 2012, based on data from governments, the private sector and certifiers
TurkeySweden
Czech RepublicPolandAustria
United KingdomFrance
GermanyItaly
Spain
0 500,000 1,000,000 1,500,000
383,782438,693448,202
521,970543,605
699,638845,442
990,7021,113,742
1,456,672
Hectares

www.fibl.org
15%1’456’672ha
11%1’113’742ha
10%990’702ha
8%845’442ha
56%5’595’529ha
SpainItalyGermanyFranceRest
Europe: Distribution of organically managed agricultural land by country 2010 (Total: 10 million hectares)
FiBL-IFOAM survey 2012
www.fibl.org
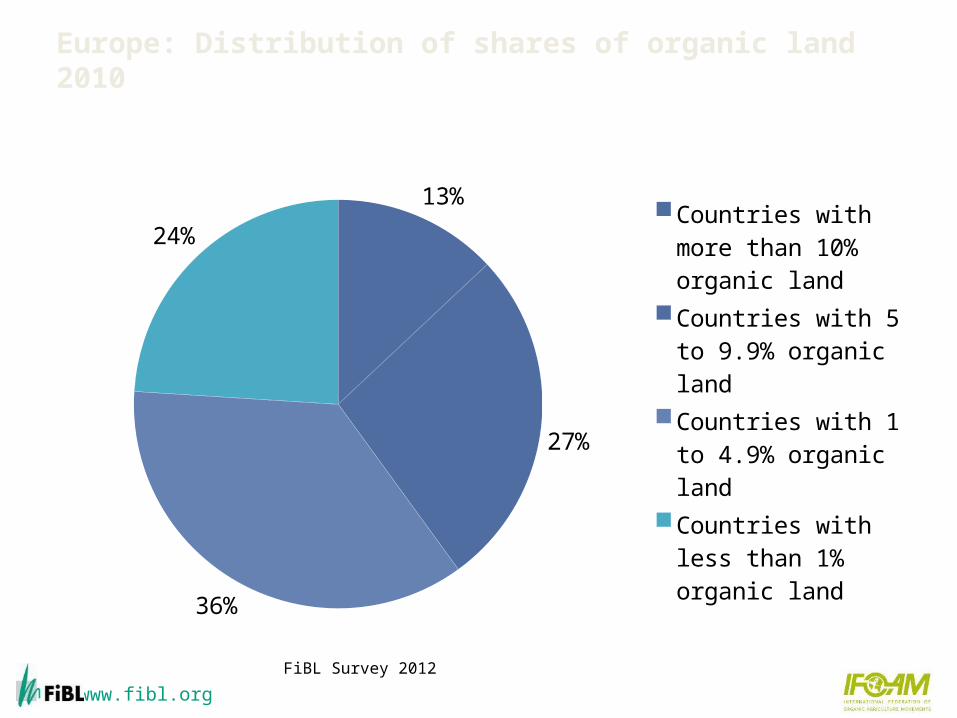
13%
27%
36%
24%
Countries with more than 10% organic landCountries with 5 to 9.9% organic landCountries with 1 to 4.9% organic landCountries with less than 1% organic land
Europe: Distribution of shares of organic land 2010
FiBL Survey 2012
www.fibl.org
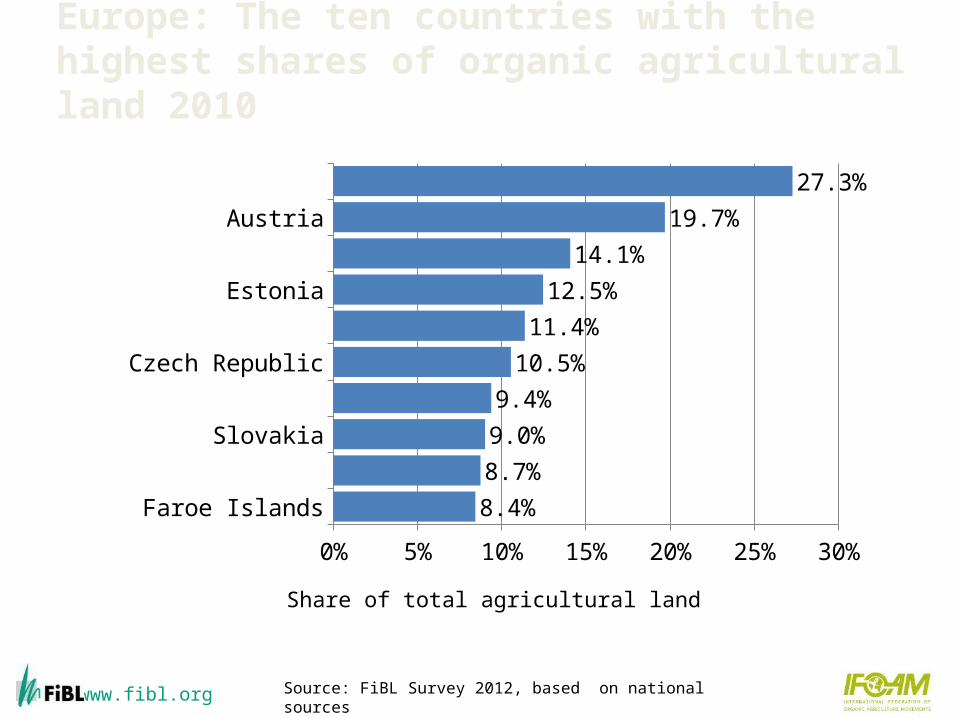
Europe: The ten countries with the highest shares of organic agricultural land 2010
Source: FiBL Survey 2012, based on national sources
Faroe Islands
Italy
Slovakia
Latvia
Czech Republic
Switzerland
Estonia
Sweden
Austria
Liechtenstein
0% 5% 10% 15% 20% 25% 30%
8.4%
8.7%
9.0%
9.4%
10.5%
11.4%
12.5%
14.1%
19.7%
27.3%
Share of total agricultural land
www.fibl.org
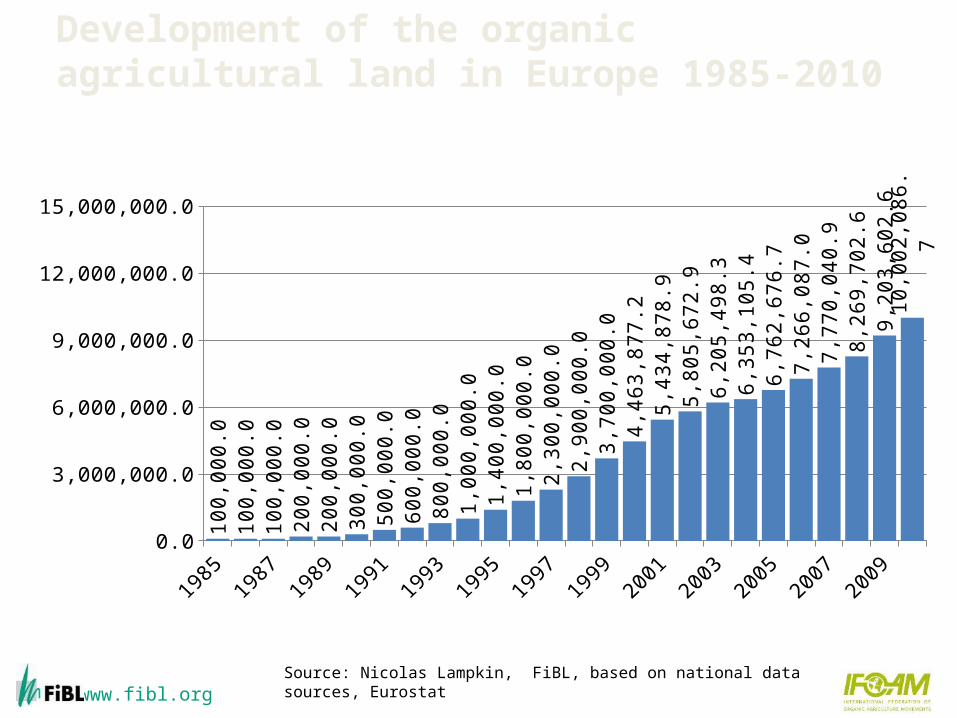
Development of the organic agricultural land in Europe 1985-2010
Source: Nicolas Lampkin, FiBL, based on national data sources, Eurostat
19851987
19891991
19931995
19971999
20012003
20052007
20090.0
3,000,000.0
6,000,000.0
9,000,000.0
12,000,000.0
15,000,000.010
0,00
0.0
100,
000.
010
0,00
0.0
200,
000.
020
0,00
0.0
300,
000.
050
0,00
0.0
600,
000.
080
0,00
0.0
1,00
0,00
0.0
1,40
0,00
0.0
1,80
0,00
0.0
2,30
0,00
0.0
2,90
0,00
0.0
3,70
0,00
0.0
4,46
3,87
7.2
5,43
4,87
8.9
5,80
5,67
2.9
6,20
5,49
8.3
6,35
3,10
5.4
6,76
2,67
6.7
7,26
6,08
7.0
7,77
0,04
0.9
8,26
9,70
2.6
9,20
3,60
2.6
10,0
02,0
86.7

www.fibl.org
Europe: Use of organic agricultural land 2010 (total: 10 million hectares)
Source: FiBL Survey 2012
Arable crops41%
Perm. crops10%
Perm. grassland
45%
Other agr. land3%
No details1%
Land use 2010
Vegetables
Oilseeds
Protein crops
Green fodder
Cereals
0 1,000,000 2,000,000
112,894.2
188,248.5
229,910.1
1,583,831.0
1,709,704.3
Key arable crop groups
In thousands of hectares
Citrus fruit
Fruit, temperate
Nuts
Grapes
Olives
31,760.1
94,811.5
187,034.0
192,670.8
367,462.6
Key permanent crop groups
In thousands of hectares
www.fibl.org
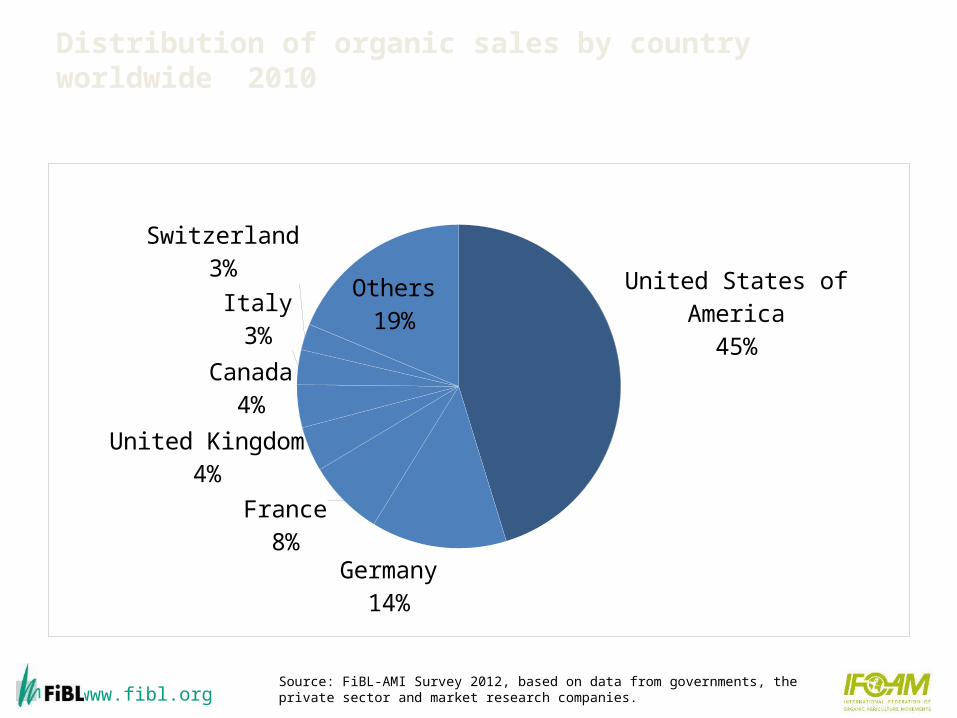
Distribution of organic sales by country worldwide 2010
United States of America
45%
Germany14%
France8%
United Kingdom4%
Canada4%
Italy3%
Switzerland3%
Others19%
Source: FiBL-AMI Survey 2012, based on data from governments, the private sector and market research companies.
www.fibl.org
Europe and European Union: Growth of the Organic Market 2004-2010. Growth 2009-2010: +8 percentLast update: May 5, 2012
2004 2005 2006 2007 2008 2009 20100.0
5,000.0
10,000.0
15,000.0
20,000.0
10,792.412,053.3
13,465.8
15,253.517,010.2
18,201.719,714.0
10,025.111,248.8
12,601.314,306.7
15,895.816,953.6
18,236.0
Turnover EuropeTurnover European Union
Billi
on E
uros
www.fibl.org
Development of the organic market in selected European countries 2004-2010Last Upate: May 5, 2012
2004 2005 2006 2007 2008 2009 20100
1,000
2,000
3,000
4,000
5,000
6,000
7,000
3,500
6,020
1,900
3,516
1,785 2,000
1,050
1,550
305791767
1,180
GermanyFranceUnited KingdomItalyDenmarkSwitzerland
Mill
ion
Euro
s
Dotted lines: Due to fluctuating exchange rates a direct year-to-year comparison is not necessarily possible.

www.fibl.org
Market growth 2009 and 2010 compared in selected countriesLast update: May 5, 2012
Austria
Belgium
Denmark
Finland
France
Germany
Italy
Netherlands
Sweden
Switz
erland UK US
-1500%
-1000%
-500%
0%
500%
1000%
1500%
2000%
2500%
20092010

www.fibl.org
Europe: Distribution of sales of organic food and drink by country 2010 (total: 19.7 billion Euros)Last update: April 4, 2012
30.5%
17.8%
10.1%
7.9%
6.0%
27.7%Germany
France
UK
Italy
Switzerland
Rest
Source: FiBL-AMI Survey 2011, based on national sources

www.fibl.org
The European market for organic food and drink: The countries with the highest sales 2010Last update: April 4, 2012
Source: Compiled by FiBL, and AMI 2012, based on national sources
Netherlands
Denmark
Sweden
Spain
Austria
Switzerland
Italy
United Kingdom
France
Germany
0 2,000 4,000 6,000 8,000 10,000
659.5791.0803.8905.0986.0
1,180.11,550.0
2,000.03,516.0
6,020.0
Domestic sales in million Euros
www.fibl.org
The European organic market for organic food and drink: The countries with the highest shares of organic food sales 2010
Source: Compiled by FiBL and AMI 2012, based on national sources
BelgiumFinlandFrance
NetherlandsLuxembourg (2006)
GermanySweden
SwitzerlandAustria (2009)
Denmark
0 2 4 6 8 10
1.82.02.0
2.73.3
3.54.1
5.76.0
7.2
Market shares 2010
www.fibl.org
The European market for organic food: The countries with the highest per capita consumption 2010Last update: April 4, 2012
Source: Compiled by FiBL and AMI 2012, based on national sources
BelgiumNetherlands
FranceGermany
SwedenLiechtenstein
AustriaLuxembourg
DenmarkSwitzerland
0 50 100 150 200
3940
5574
86100
118127
142153
Per capita consumption in Euros 2010
www.fibl.org
Articles about Europe in the 2012 Edition of "The World of Organic Agriculture"
› Organic Agriculture in Europe: Overview
Helga Willer
› The Organic Market in Europe
Diana Schaack, Helga Willer, and Susanne Padel
› Organic Imports to Germany
Diana Schaack, Christine Rampold, Helga Willer and Markus Rippin
› Bulgaria: Boom of Organic Agriculture
Stoilko Apostolov
› Organic Farming in Turkey and the Contribution of Buğday to the Sector‘s
Development
Gizem Altin Nance
www.fibl.org
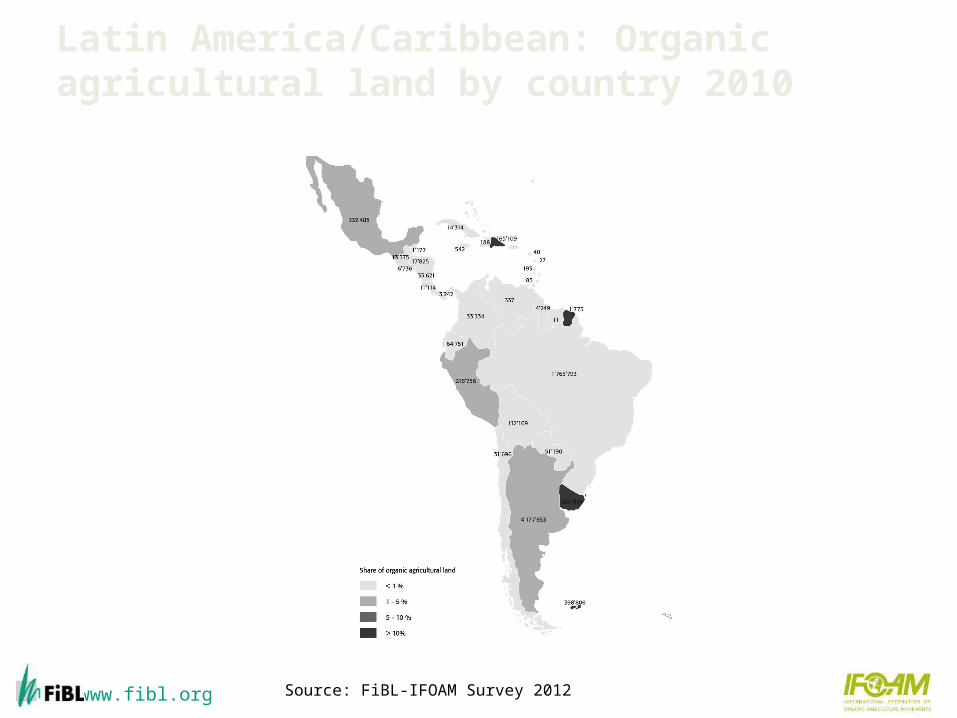
Latin America/Caribbean: Organic agricultural land by country 2010
Source: FiBL-IFOAM Survey 2012
www.fibl.org
Latin America: Key figures 2010
› In Latin America, more than 270’000 producers managed 8.4
million hectares of agricultural land organically in 2010.
› This constitutes 23 percent of the world’s organic land and 1.4
percent of the regions agricultural land.
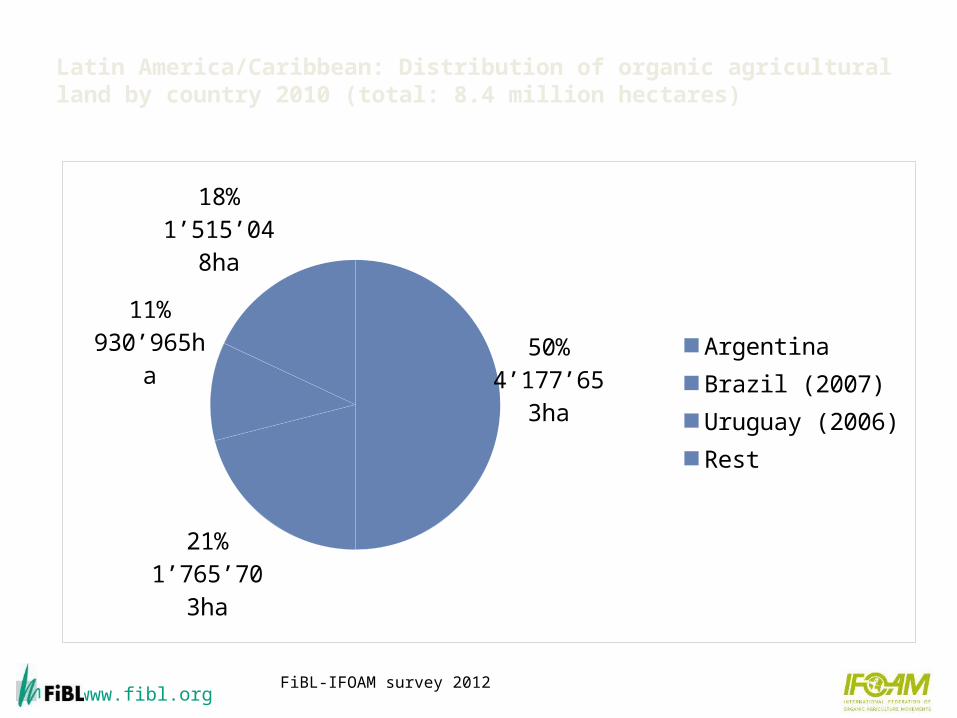
› The leading countries are Argentina (4.2 million hectares), Brazil
(1.8 million hectares), and Uruguay (90.93 million hectares).
› The highest shares of organic agricultural land are in the Falkland
Islands/Malvinas (35.9 percent), the Dominican Republic (8.5
percent), and French Guiana (7.8 percent).
www.fibl.org
Latin America: Key figures 2010
› Most organic products from Latin American countries are sold on the European,
North American or Japanese markets. Popular goods are especially those that
cannot be produced in these regions, as well as off-season products. Thus, the
development of robust local markets is still a major challenge, without which the
sustainability of organic production cannot be achieved. Important crops are
tropical fruits, grains and cereals, coffee, cocoa, sugar, and meats. Most organic
food sales in the domestic markets of the countries occur in major cities.
› Twenty-two countries have legislation on organic farming, and two additional
countries are currently developing organic regulations. Costa Rica and
Argentina have both attained Third Country status according to the EU
regulation on organic farming.
www.fibl.org
50%4’177’653
ha
21%1’765’703ha
11%930’965ha
18%1’515’048ha
ArgentinaBrazil (2007)Uruguay (2006)Rest
Latin America/Caribbean: Distribution of organic agricultural land by country 2010 (total: 8.4 million hectares)
FiBL-IFOAM survey 2012
www.fibl.org
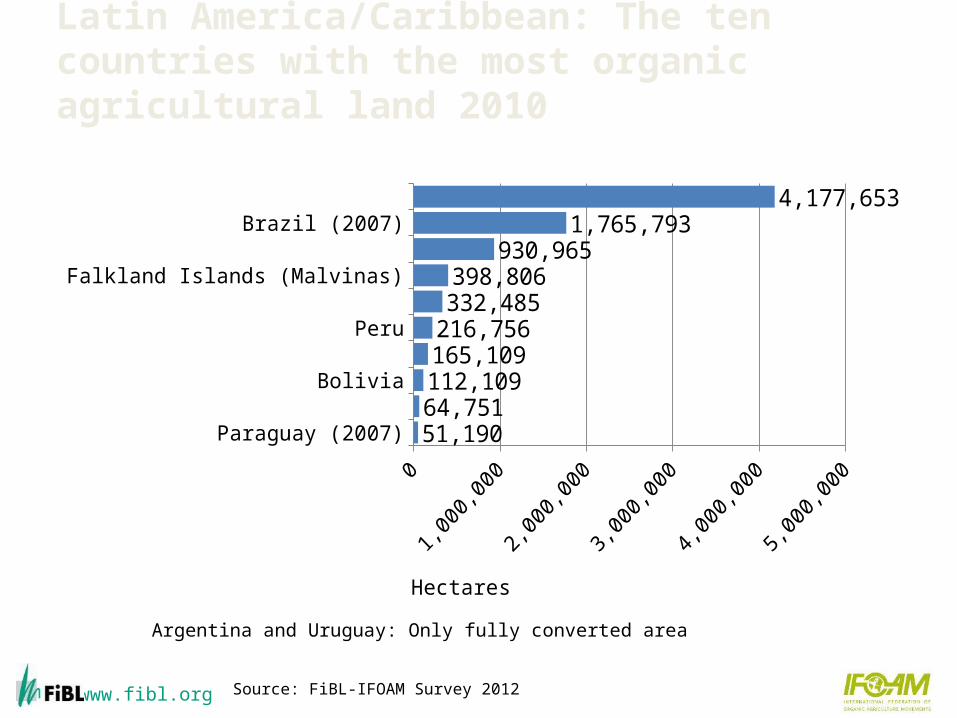
Latin America/Caribbean: The ten countries with the most organic agricultural land 2010
Argentina and Uruguay: Only fully converted area
Source: FiBL-IFOAM Survey 2012
Paraguay (2007)
Ecuador
Bolivia
Dominican Republic
Peru
Mexico (2008)
Falkland Islands (Malvinas)
Uruguay (2006)
Brazil (2007)
Argentina
0 1,000,000 2,000,000 3,000,000 4,000,000 5,000,000
51,19064,751112,109165,109216,756
332,485398,806
930,9651,765,793
4,177,653
Hectares

www.fibl.org
3% 10%
10%
77%
Countries with more than 10% organic landCountries with 5 to 9.9% organic landCountries with 1 to 4.9% organic landCountries with less than 1% organic land
Latin America: Distribution of shares of organic land 2010
FiBL Survey 2012

www.fibl.org
Latin America: The ten countries with the highest shares of organic agricultural land 2010
FiBL Survey 2012
Martinique (France)
Belize
Ecuador
Peru
Mexico
Argentina
Uruguay
French Guiana (France)
Dominican Republic
Falkland Islands (Malvinas)
0% 5% 10% 15% 20% 25% 30% 35% 40%
0.7%
0.8%
0.9%
1.0%
1.5%
3.0%
6.3%
7.8%
8.5%
35.9%
www.fibl.org
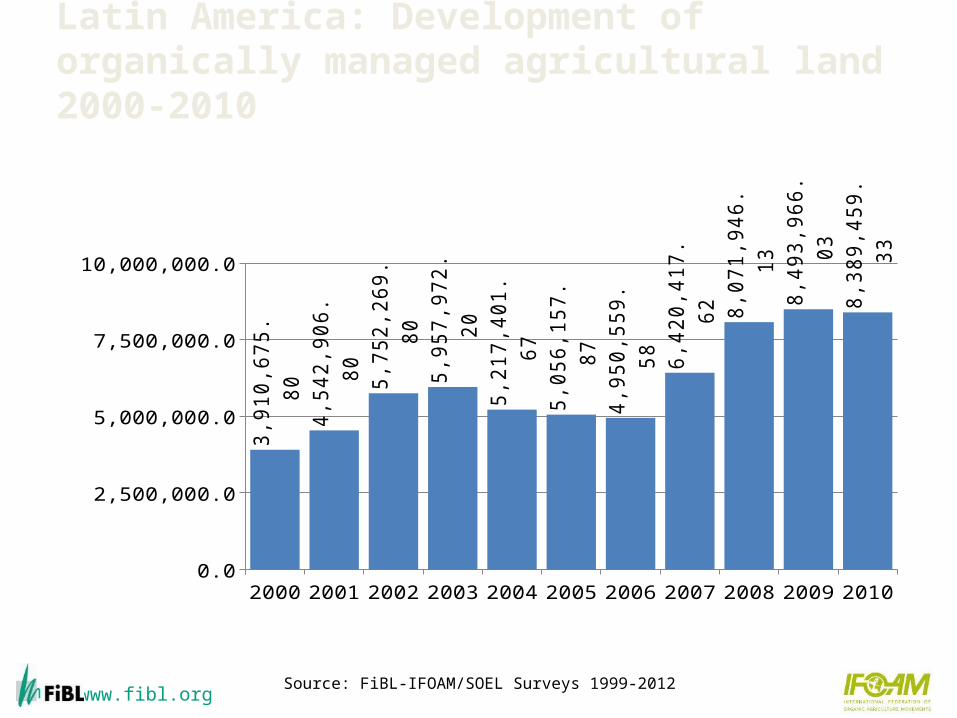
Latin America: Development of organically managed agricultural land 2000-2010
Source: FiBL-IFOAM/SOEL Surveys 1999-2012
2000 2001 2002 2003 2004 2005 2006 2007 2008 2009 20100.0
2,500,000.0
5,000,000.0
7,500,000.0
10,000,000.03,
910,
675.
80
4,54
2,90
6.80
5,75
2,26
9.80
5,95
7,97
2.20
5,21
7,40
1.67
5,05
6,15
7.87
4,95
0,55
9.58
6,42
0,41
7.62
8,07
1,94
6.13
8,49
3,96
6.03
8,38
9,45
9.33
www.fibl.org
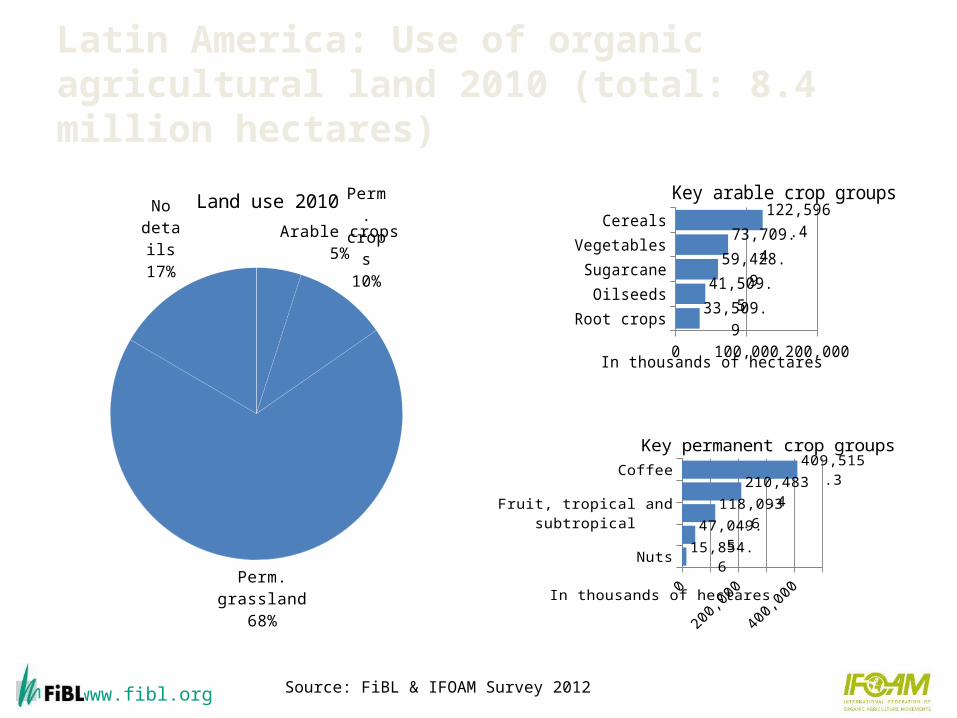
Latin America: Use of organic agricultural land 2010 (total: 8.4 million hectares)
Source: FiBL & IFOAM Survey 2012
Arable crops5% Perm.
crops10%
Perm. grassland68%
No details
17%
Land use 2010
Root crops
Oilseeds
Sugarcane
Vegetables
Cereals
0 100,000 200,000
33,509.9
41,509.5
59,428.9
73,709.4
122,596.4
Key arable crop groups
In thousands of hectares
Nuts
Coconut
Fruit, tropical and subtropical
Cocoa
Coffee
15,854.6
47,049.5
118,093.6
210,483.4
409,515.3
Key permanent crop groups
In thousands of hectares
www.fibl.org
Articles about Latin America and the Caribbean in the 2012 Edition of "The World of Organic Agriculture"
› Organic Farming in Latin America and the Caribbean
Patricia Flores Escudero
› Peru: The Market for Organic Products
F. Javier Martinez
› All in Willer/Kilcher (Eds.) 2012: The World of Organic
Agriculture. Statistics and Emerging Trends 2012. IFOAM
and FiBL, Bonn and Frick

www.fibl.org
North America: Organic agricultural land by country 2010
Source: USDA and COG 2012

www.fibl.org
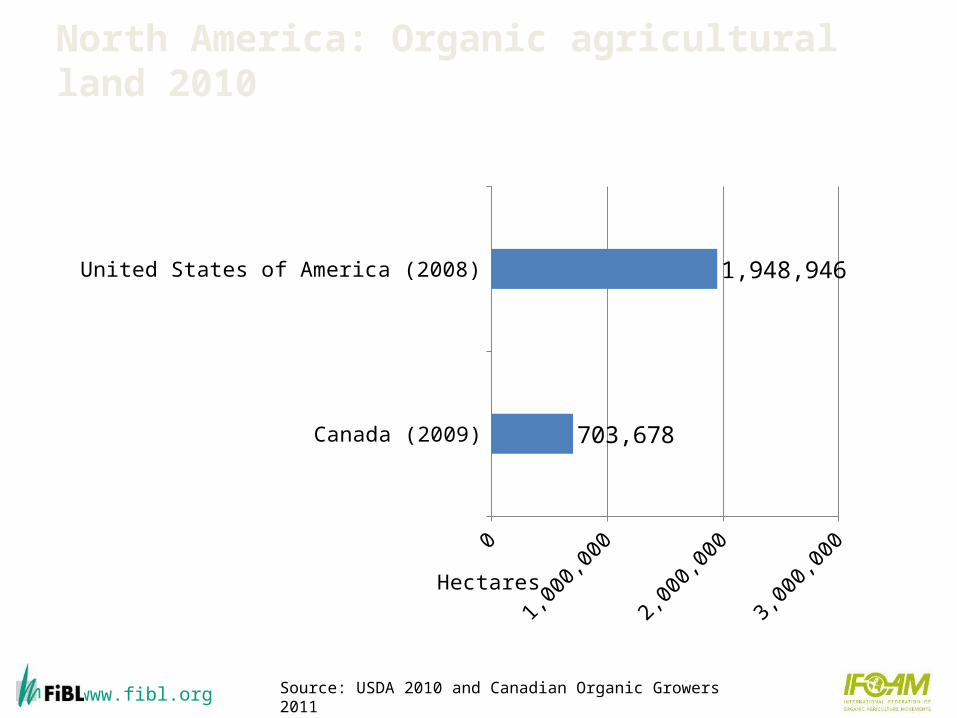
Organic Agriculture in North America: Key figures 2010
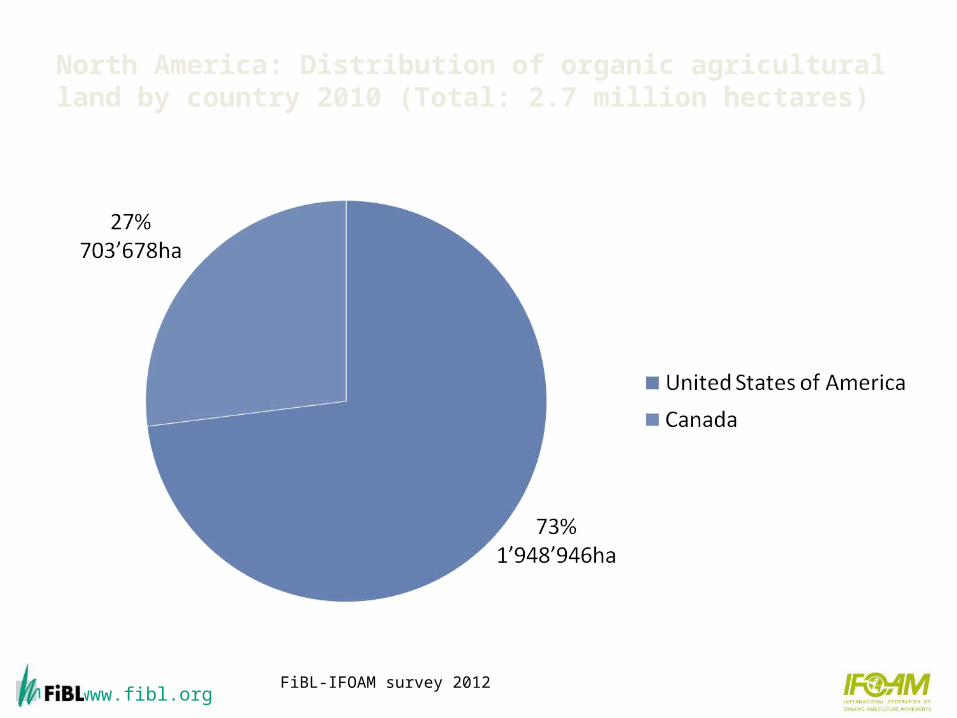
› In North America, almost 2.7 million hectares are managed organically, of
these nearly two million in the United States and 0.7 million in Canada.
› This represents approximately 0.7 percent of the total agricultural area in the
region and 7 percent of the world’s organic agricultural land.
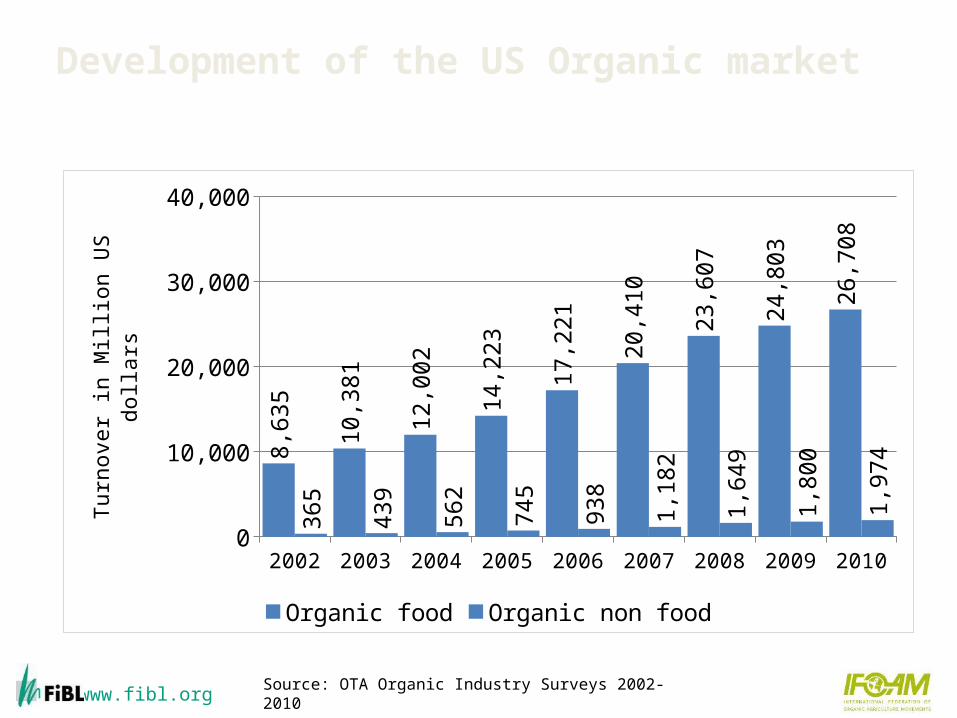
› Organic product sales in 2010 grew by 7.8 percent overall, to reach 28.7 billion
US dollars.
› Of that figure, 26.7 billion US dollars represented organic food or 4 percent of
the food market. The remaining 2 billion were sales of organic non-foods. In
Canada, organic food sales were 2.6 billion Canadian dollars.
› Projections for 2011 and beyond indicate higher growth rates for organic sales
in North America.
www.fibl.org
North America: Organic agricultural land 2010
Source: USDA 2010 and Canadian Organic Growers 2011
Canada (2009)
United States of America (2008)
0 1,000,000 2,000,000 3,000,000
703,678
1,948,946
Hectares
www.fibl.org
North America: Distribution of organic agricultural land by country 2010 (Total: 2.7 million hectares)
FiBL-IFOAM survey 2012

www.fibl.org
North America: Shares of organic agricultural land 2010
Source: Canadian Organic Growers 2011 and USDA 2010
United States of America
Canada
0.0% 0.2% 0.4% 0.6% 0.8% 1.0% 1.2%
0.6%
1.0%
www.fibl.org
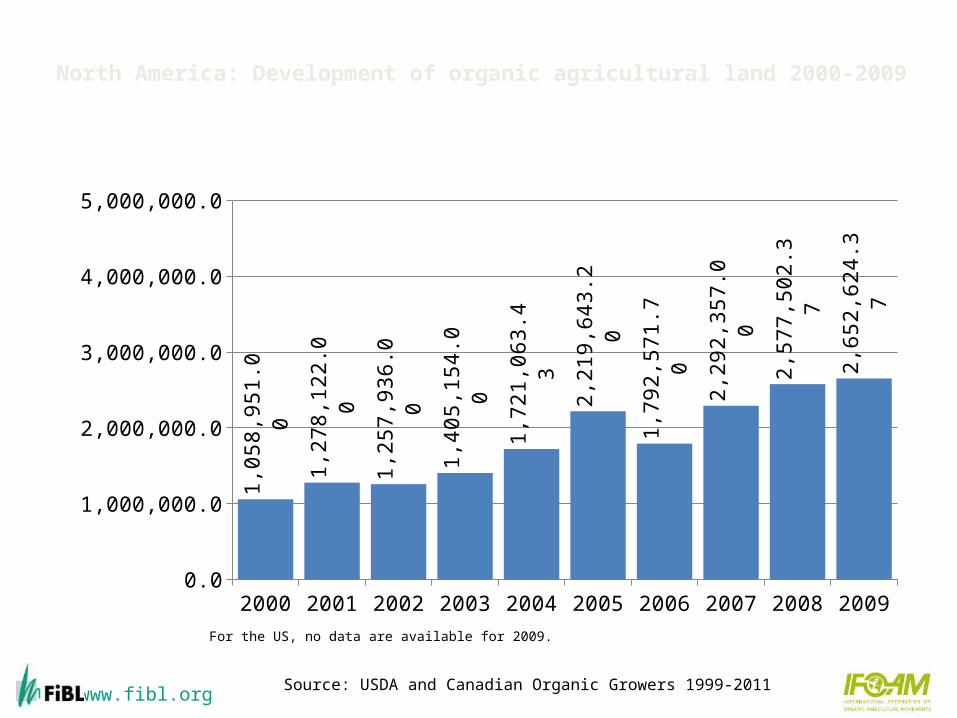
North America: Development of organic agricultural land 2000-2009
Source: USDA and Canadian Organic Growers 1999-2011
For the US, no data are available for 2009.
2000 2001 2002 2003 2004 2005 2006 2007 2008 20090.0
1,000,000.0
2,000,000.0
3,000,000.0
4,000,000.0
5,000,000.01,
058,
951.
00
1,27
8,12
2.00
1,25
7,93
6.00
1,40
5,15
4.00
1,72
1,06
3.43
2,21
9,64
3.20
1,79
2,57
1.70
2,29
2,35
7.00
2,57
7,50
2.37
2,65
2,62
4.37

www.fibl.org
North America: Use of organic agricultural land 2010* (total: 2.65 million hectares)
Source: FiBL-IFOAM Survey 2012 *US data from 2008, Canada data from 2009
Arable crops51%
Perm. crops3%
Perm. grassland
45%
Other agr. land1%
No details0%
Land use 2010
Protein crops
Vegetables
Oilseeds
Green fodder
Cereals
39,409.5
65,263.5
169,385.4
445,488.6
574,611.1
Key arable crop groups
In thousands of hectares
Citrus fruit
Fruit, temperate
Fruit/nuts/berries
Nuts
Grapes
0 10,000 20,000
5,692.0
8,023.0
8,400.5
9,533.2
11,577.5
Key permanent crop groups
In thousands of hectares
www.fibl.org
Development of the US Organic market
2002 2003 2004 2005 2006 2007 2008 2009 20100
10,000
20,000
30,000
40,0008,
635
10,3
81
12,0
02
14,2
23
17,2
21 20,4
10 23,6
07
24,8
03
26,7
08
365
439
562
745
938
1,18
2
1,64
9
1,80
0
1,97
4
Organic food Organic non food
Turn
over
in M
illio
n US
dol
lars
Source: OTA Organic Industry Surveys 2002-2010

www.fibl.org
Articles about North America in the 2012 Edition of "The World of Organic Agriculture"
› North American Overview
Barbara Fitch Haumann
› United States: Country Report
Barbara Fitch Haumann
› Canada: Country Report
Matthew Holmes and Anne Macey
› All in Willer/Kilcher (Eds.) 2012: The World of Organic
Agriculture. Statistics and Emerging Trends 2012. IFOAM
and FiBL, Bonn and Frick
www.fibl.org
Oceania: Organic agricultural land by country 2010
FiBL-IFOAM Survey 2012
www.fibl.org
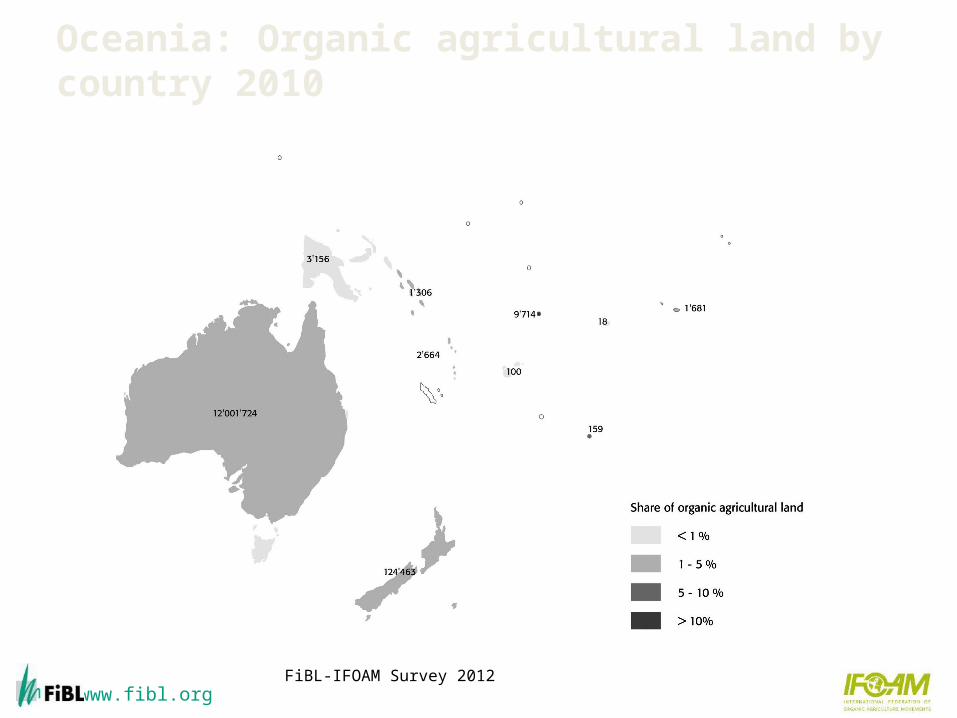
Organic agriculture in Oceania: Key figures 2010
› This region includes Australia, New Zealand, and island states like Fiji, Papua
New Guinea, Tonga, and Vanuatu.
› Altogether, there are 8'483 producers, managing 12.1 million hectares.
› This constitutes 2.9 percent of the agricultural land in the area and 33 percent
of the world’s organic land.
› Ninety-nine percent of the organic land in the region is in Australia (12 million
hectares, 97 percent of which is extensive grazing land), followed by New
Zealand (124’463 hectares), and Samoa (9’714 hectares).
› The highest shares of all agricultural land are in Samoa (7.9 percent),
followed French Polynesia (3.8 percent), Niue (3.2 percent), and Australia (2.9
percent).
63
www.fibl.org
Organic agriculture in Oceania: Key figures 2010
› Growth in the organic industry in Australia, New Zealand and the Pacific Islands
has been strongly influenced by rapidly growing overseas demand; domestic
markets are, however, also growing. In Australia it was at 947 million Australian
dollars in 2009 and in New Zealand at 350 million New Zealand dollars.
› The biggest change in the Australian domestic market over 2009 was that the
Australian Standard for Organic and Biodynamic Products was adopted and
published by Standards Australia.
› The year 2010 marked a milestone for the Pacific Region:
The International Organic Accreditation Service (www.ioas.org) assessed the
Pacific Organic Standard (POS) and found it to be equivalent to the standards
requirements of the European Union’s organic regulations.

www.fibl.org
Oceania: Organic agricultural land 2010
Cook Islands
Niue
French Polynesia
Papua New Guinea
New Zealand (2009)
0 5,000,000 10,000,000 15,000,000
18
100
159
1,306
1,681
2,664
3,156
9,714
124,463
12,001,724
Hectares
Source: FiBL-IFOAM Survey 2012, based on data from governments, the private sector and certifiers.
www.fibl.org
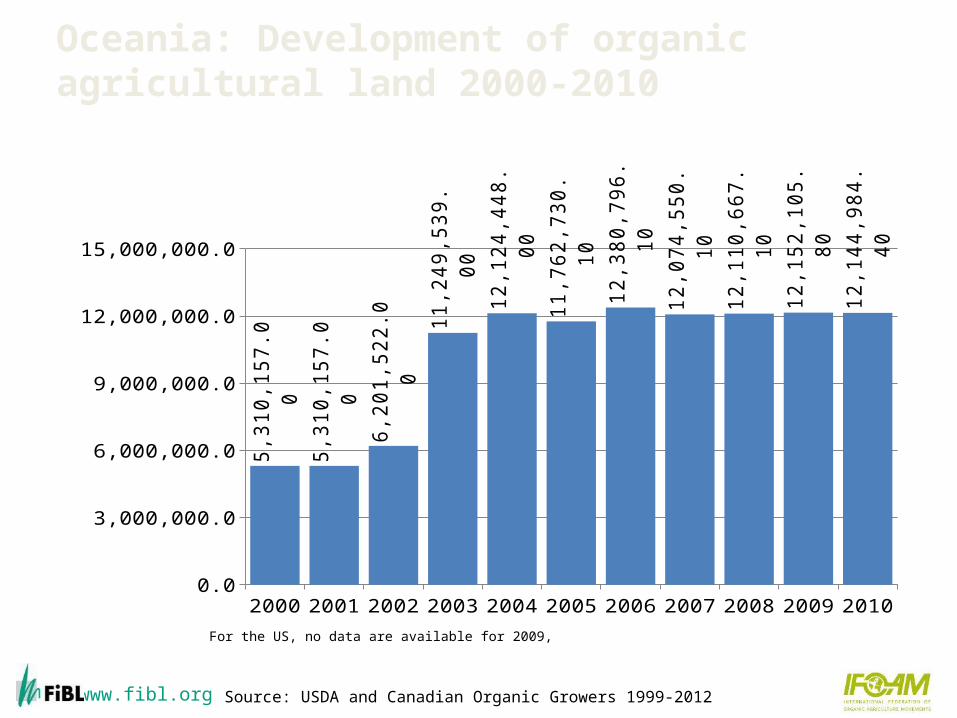
Oceania: Development of organic agricultural land 2000-2010
Source: USDA and Canadian Organic Growers 1999-2012
For the US, no data are available for 2009,
2000 2001 2002 2003 2004 2005 2006 2007 2008 2009 20100.0
3,000,000.0
6,000,000.0
9,000,000.0
12,000,000.0
15,000,000.05,
310,
157.
00
5,31
0,15
7.00
6,20
1,52
2.00
11,2
49,5
39.0
0
12,1
24,4
48.0
0
11,7
62,7
30.1
0
12,3
80,7
96.1
0
12,0
74,5
50.1
0
12,1
10,6
67.1
0
12,1
52,1
05.8
0
12,1
44,9
84.4
0

www.fibl.org
Oceania: Shares of organic agricultural land 2010
Source: FiBL-IFOAM Survey 2012, based on data from governments, the private organic sector and certifiers.
Fiji
Papua New Guinea
Cook Islands
New Zealand
Vanuatu
Solomon Islands
Australia
Niue
French Polynesia
Samoa
0% 1% 2% 3% 4% 5% 6% 7% 8% 9%
0.0%
0.3%
0.6%
1.1%
1.4%
1.6%
2.9%
3.2%
3.8%
7.9%
www.fibl.org
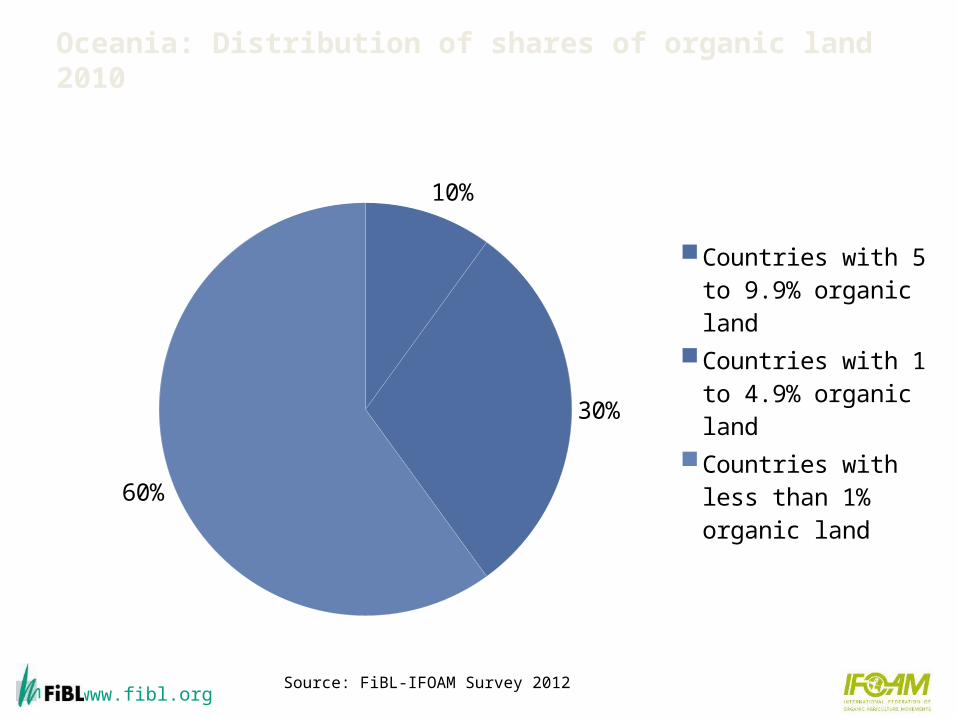
10%
30%
60%
Countries with 5 to 9.9% organic landCountries with 1 to 4.9% organic landCountries with less than 1% organic land
Oceania: Distribution of shares of organic land 2010
Source: FiBL-IFOAM Survey 2012
www.fibl.org
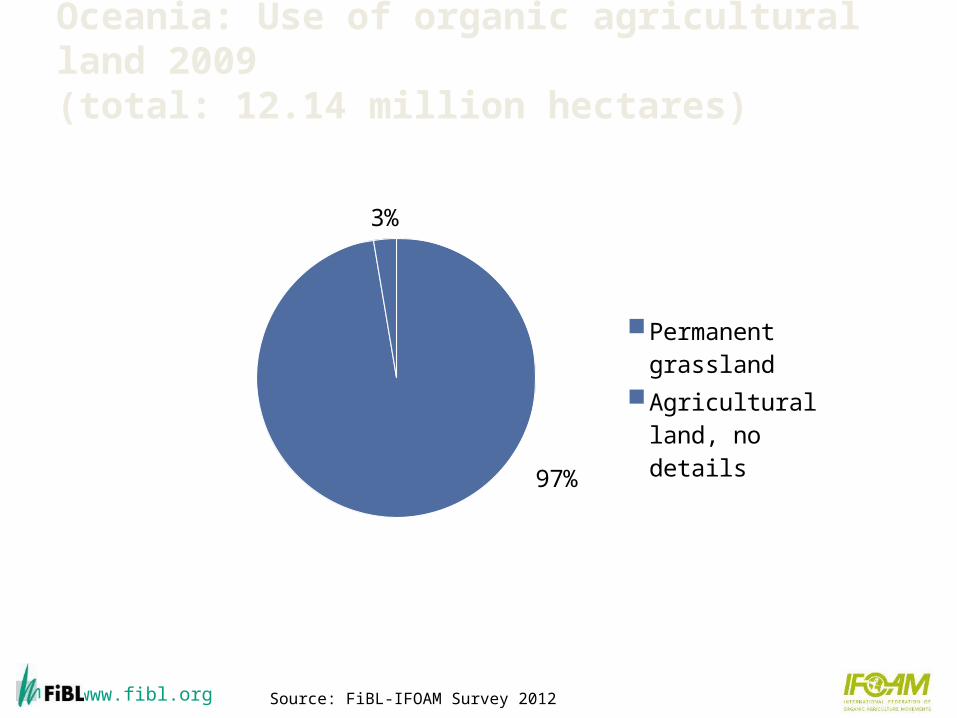
Oceania: Use of organic agricultural land 2009 (total: 12.14 million hectares)
97%
3%
Permanent grass-landAgricultural land, no details
Source: FiBL-IFOAM Survey 2012
www.fibl.org
Articles about Oceania in the 2012 Edition of "The World of Organic Agriculture"
› Organic Farming in Australia
Els Wynen and Alexandra Mitchell
› The Pacific Islands
Karen Mapusua
› All in Willer/Kilcher (Eds.) 2012: The World of Organic
Agriculture. Statistics and Emerging Trends 2012. FiBL
and IFOAM, Bonn and Frick