Embed Size (px)
Citation preview
Key Performance Indicators in Data Warehouses 1
Manfred A. Jeusfeld1 , Samsethy Thoun2
1 University of Skövde, IIT, Box 408, Portalen, 54128 Skövde, [email protected]
2 Pannasastra University, 313, Phnom Penh, [email protected]
Abstract. Key performance indicators are a widely used tool to manage anytype of processes including manufacturing, logistics, and business processes.We present an approach to map informal specifications of key performanceindicators to prototypical data warehouse designs that support the calculation ofthe KPIs via aggregate queries. We argue that the derivation of the keyperformance indicators shall start from a process definition that includesscheduling and resource information.
Keywords: key performance indicator, data warehouse, business process
1 Introduction
Key performance indicators (KPI) evaluate the success of an organization or of aparticular activity in which it engages (source: Wikipedia). They are used tocontinuously monitor those activities [1] in order to understand and control them.Deming [2] pioneered this field by statistically correlating independent processparameters to dependent performance indicators known as statistical process control(SPC). In SPC, the process parameters are kept in certain ranges such that thedependent variables such as KPIs or the product quality also remains in certainpredictable ranges. These ideas were later also applied to software engineering [3],and to business process management [1]. Typical examples of KPIs are number ofdefects of a product, customer satisfaction with a service, the profit margin of aproduct, the percentage of deliveries before the promised delivery time, the machineutilization in a factory, and so forth. All these examples relate in some respect to anactivity or to sets of activities. Moreover, they involve the interaction of multipleobjects or subjects such as customers, employees, or machines.
In this paper, we investigate the relation of KPIs, data warehouses, and businessprocess management. Specifically, we propose a guideline on deriving a prototypicaldata warehouse design from annotated KPI definitions, which themselves are derivedfrom business process model fragments. This yields a top-down data warehousedesign that strictly supports the calculation of the KPIs via aggregate queries.
1 Part of the research was carried out while the second author was carrying out his masterthesis project in the Erasmus IMMIT program at Tilburg University, The Netherlands.
A data warehouse consists of multi-dimensional facts representing measurableobservations about subjects in time and space. The subjects, time and space areforming the dimensions, and the measures are representing the observations about theparticipating subjects. A data warehouse is essentially a large collection ofmeasurements covering a certain part of the reality. In practically all instances, themeasurements are about processes. If it were not, it would only provide a staticaccount of objects in the reality. The key problem of this paper is how to design thedata warehouse from annotated KPI definitions such that the KPIs can be calculatedby aggregate queries on the data warehouse.
Another angle to KPIs is their summarizing nature. A KPI is not based on a singlearbitrary observation but it aggregates a large number of observations about the sameentities (or activities) to be statistically meaningful. The concept of an observation isthe atomic building block of KPIs. Once the common properties of observations areset, one can start to collect such observations systematically and create the KPI on topof them. Different types of observations lead to different KPIs. So, given thedefinition of a KPI, what is the type of observations belonging to this KPI? KPIs canalso be formed as expressions over other more simple KPIs. For example, theproductivity of a process can be measured the division of a KPI on the output of theprocess divided by a KPI on the resources used for producing the output. Such KPIsare called derived KPIs. Since their computation is simple once the part KPIs arecomputed, we shall focus on simple KPIs that are not defined in terms of other KPIsbut that are defined in terms of sets of atomic observations of the same type.
2 Related Work
Key performance indicators are a technique to quantify the performance of anorganization or of its processes to achieve business objectives. In this chapter we viewKPIs as used in conceptual modeling, in particular business process modeling, and indata warehousing.
2.1 Key performance indicators in conceptual modeling
Wetzstein et al. [1] investigate the definition of KPIs in the context of businessprocess models, in particular from a service-oriented architecture perspective. SimpleKPIs (called process performance metrics, PPMs) are the basis of more sophisticated,context-specific KPIs such as determining whether a customer has received thepromised quality of service QoS (e.g. response time) can depend on the customerclass and further parameters that we can view as dimensions of the KPI measurement.In their view a KPI is based on PPMs, a QoS definition, and a decision tree thatdetermines whether a PPM measurement fulfills the QoS definition.
Strategic business modeling based on the Business Intelligence Model BIM [4]extends the goal modeling language i* by metrics linked to i* goals on the one sideand tasks on the other side. The goals are monitored by the metrics and the tasks arethe measures to achieve the goals. The metric interval is decomposed intoperformance regions (target, threshold/acceptable, worst value). The approachreminds of balance scorecards but extends it to the rich goal modeling language i*.
In software engineering, KPIs were introduced to manage the softwaredevelopment process [22], in particular in combination with the capability andmaturity model CMMI [23]. Measurements such as the defect density in source codeare used to control the software development process. Oivo and Basili´s goal-question-metric (GQM) approach [24] provides an informal guideline on whichmetrics need to be monitored in order to assess that a certain goal (like improving thesoftware quality) is reached. A quality goal is decomposed in a set of qualityquestions, which is itself decomposed into a set of quality metrics. The metrics arecomparable to KPIs. Hence, the GQM approach allows to group KPIs by the goals ofstakeholders. An agreement on goals allows to focus only on those KPIs that areneeded to assess to which extent the goals have been reached. The GQM approachhighlights that metrics (and thus KPIs) should not be mixed up with goals.Nevertheless, quality goals are often formulated in terms of KPIs such as the averagecycle time of a certain process must be below a certain threshold.

Statistical process control (SPC) [25] was introduced by Deming [2] and othersinto the manufacturing domain as a tool to monitor the production and productquality. Specifically, it measures parameters and establishes statistical correlationsbetween the parameters (called variables in statistics). The correlations betweenvariables are translated into a set of equations for predicting values for dependentvariables from independent variables. The idea is to control the independent variables(such as the quality of input materials) at early stages of the production process inorder to guarantee that the dependent variables (such as product quality parameters)are within a desired interval. The variables in SPC are comparable to KPIs.
2.2 Data Warehouse Design and KPIs
A central issue in data warehousing is to design appropriate multi-dimensional datamodels to support querying, exploring, reporting, and analysis as required byorganizational decision making. DW design has received considerable researchattention. However, there are different methodological approaches proposed by theliterature. Some approaches are data-driven in the sense that they aim at deriving factsand dimensions from the structures of operational sources that are usually representedas Entity Relationship Diagrams (ERD) or Unified Modeling Language (UML)diagrams. The outcome of this approach is a set of candidate facts or even dataschemas, among which only relevant ones are selected to include in DW systems. Forinstance, Golfarelli et al. [5] proposed the DW design approach based on E/R scheme.Golfarelli and Rizzi [6] also developed a data-driven method for DW design based onDimensional Fact Model.
Song, Khare, and Dai [7] developed the SAMSTAR method that is a semi-automatedapproach to generating star schema from operational source ERD. Although, theauthors mentioned that the SAMSTAR method was both data-driven and goal-driven,this method is primarily data-driven because it derives star schema based on thestructures and semantic of operational sources. Zepeda, Celma, and Zatarain [8]proposed a conceptual design approach consisting of two stages. The first stage is togenerate multidimensional data structures from UML-based enterprise schema. Thesecond stage is to use user requirements to select relevant schema. Moreover, thealgorithm for automatic conceptual schema development and evaluation based onMultidimensional Entity Relationship Model (M/ER) was invented by Phipps andDavis [9]. Similarly, Moody and Kortink [10] proposed a methodology for designingDW schema based on enterprise models.
On the other hand, a goal-driven approach gives more relevance to user requirementsin designing DW. Prakash and Gosain [11] present a requirement-driven datawarehouse development based on the goal-decision-information model. In addition,Giorgini, Rizzi, and Garzetti [12] propose a goal-oriented requirement analysis forDW design in which the organizational goals are made explicit and decomposed intosub-goals and then the relationships among sub-goals and actors are identified andanalyzed. Their method starts with identification of corporate goals (i.e., userrequirements) and actors involved. The actor can be either a responsible persons orresources that are needed to accomplish the goal.
We focus on the conceptual design phase to provide a blueprint for lower level logicaldesign that is consistent with the KPI definitions from which we start. Tryfona,Busborg, and Christiansen [13] developed the starER model for conceptual design ofData Warehouses and argued that DW design should be exposed to higher level sothat it becomes more understandable, and easier to identify conceptually what areingredients are actually needed in the DW. In addition, it is advisable not to usecomputer metaphors such as ‘table’ or ‘field’
Jones and Song [14] developed Dimensional Design Pattern (DDP) that assistsdesigners to effectively determine commonly used DW dimensions. In this sense, theDDP framework consist of six classes of dimension domain, from which DWdesigner can choose specific dimension and attributes during the mapping process.
Moreover, an important issue in designing DW schema is additivity of facts. A fact isadditive relative to a dimension if it is summarizable along that dimension. Theimportance of summarizability is discussed by Shoshani [15]. Horner, Song, and Chen[16] present a taxonomy of summary constraints that can be used for this purpose.
The other issue in designing DW schema is the choice between the various types ofmultidimensional data models, among which star schema and snowflake schema aremost common in data warehouses. However, the most data warehouses use starschema for two important reasons. First, it is the most efficient design because lessjoint operations are required due to denormalized tables. Second, the star schema issupported by most query optimizers for creating an access plan that use efficient starjoin operations [17].
A study of data warehouse in connection with KPIs can be found in the triple-drivendata modeling methodology presented by Guo et al [18]. This methodology consistsof four major stages: (1) goal driven stage, (2) data driven stage, (3) user driven stage,and (4) combination stage. During the first stage, business goals and KPIs areidentified according to business subject area. The second stage is to obtain a dataschema that supports the KPIs from the operational data sources. The third stage is tointerview users in order to identify important business questions. The fourth stage isto check if the business KPIs can be calculated and questions can be answered by theobtained data schema. As indicated by its second stage, this methodology is primarilydata-driven because the operational sources impose total constraints on thecomputation of KPIs. Moreover, the first stage is where KPIs have to be identifiedand the attributes needed to support these KPIs have to be determined. However, thismethodology does not specify how to determine those required attributes as part ofthe DW data models. In other words, the practical steps to analyze the KPI structuraldefinition are not provided. In addition, the generation of star schema is based on thedata-driven method that was developed by Moody and Kortink [10].
Vaisman and Zimány [21] propose a classification of KPIs along severaldimensions. First KPIs are classified wrt. to the time span of observations (past,
present, future). Second, they distinguish KPIs on inputs needed for a business resultsfrom KPIs about the business result and performance. Further, there are operationalvs. strategic KPIs and qualitative (obtained by surveys etc.) vs. quantitative. Theymultidimensional expressions (MDX) to relate a KPI value to a KPI goal (expressedas thresholds or intervals).
In the sequel, we develop an informal guideline on how to create a data warehouseschema out of patterns found in business process models. The multi-dimensionalcharacter of the KPIs is excerpted from the products serving as inputs and outputs ofthe processes, the resources used in the processes, and time and location information.We also shall review the role of plans and schedules (compare to targets in BIM) informulating KPIs.
3 Data Warehouses for Structuring Observations
A data warehouse manages multi-dimensional facts, where each fact constitutes anobservation about the domain of interest, e.g. an enterprise. The structure of anobservation is a tuple
(d1, d2 ,…, dk, m)
where di are dimension entities represented by their identifier and m is ameasurement value, typically a number. The measurement value attribute isfunctionally dependent from the combination of dimension entities. As an exampleassume that we have the dimensions car, location, and time and the measurementattribute ‘speed’ for representing car speed observations. Then, the observation factswould look like
(‘Marys car’,‘Skövde’,2013-09-28T10:31:19,385)
(‘Johns car’,‘Barcelona’,2013-03-12T21:07:47,145)
As functional expressions, these observations can be represented as equations
speed(‘Marys car’,‘Skövde’,2013-09-28T10:31:19)=385
speed(‘Johns car’,‘Barcelona’,2013-03-12T21:07:47)=145
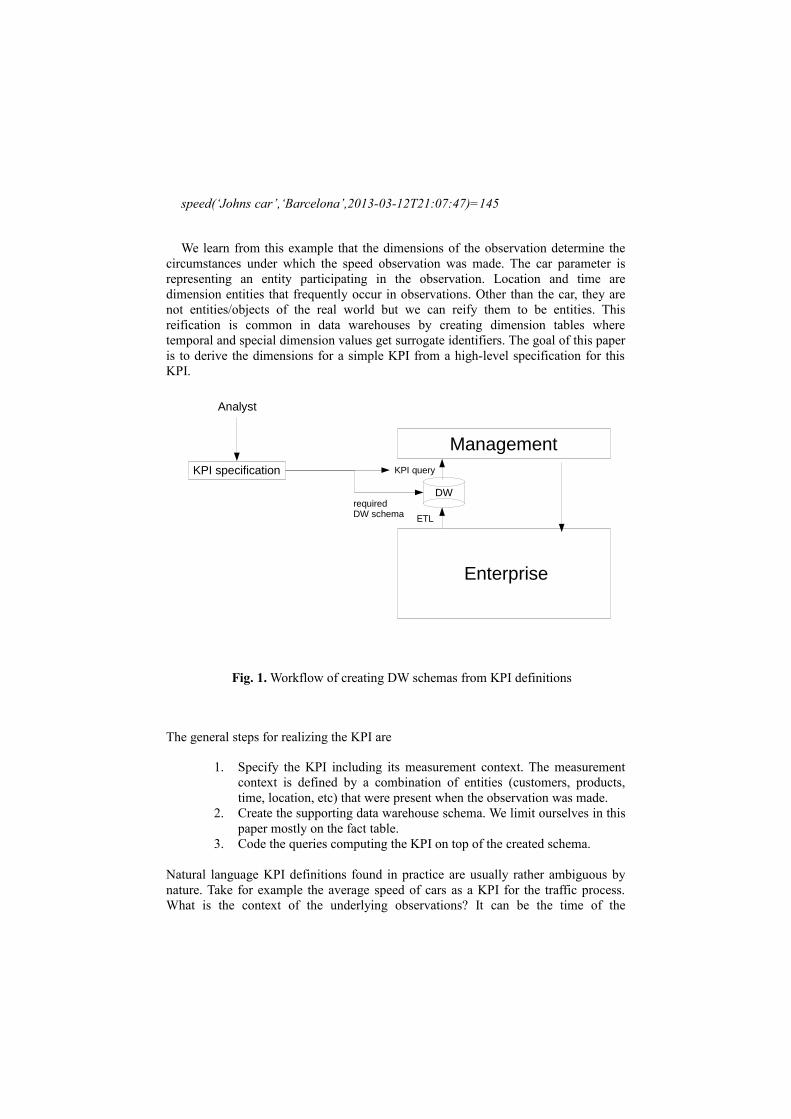
We learn from this example that the dimensions of the observation determine thecircumstances under which the speed observation was made. The car parameter isrepresenting an entity participating in the observation. Location and time aredimension entities that frequently occur in observations. Other than the car, they arenot entities/objects of the real world but we can reify them to be entities. Thisreification is common in data warehouses by creating dimension tables wheretemporal and special dimension values get surrogate identifiers. The goal of this paperis to derive the dimensions for a simple KPI from a high-level specification for thisKPI.
Fig. 1. Workflow of creating DW schemas from KPI definitions
The general steps for realizing the KPI are
1. Specify the KPI including its measurement context. The measurementcontext is defined by a combination of entities (customers, products,time, location, etc) that were present when the observation was made.
2. Create the supporting data warehouse schema. We limit ourselves in thispaper mostly on the fact table.
3. Code the queries computing the KPI on top of the created schema.
Natural language KPI definitions found in practice are usually rather ambiguous bynature. Take for example the average speed of cars as a KPI for the traffic process.What is the context of the underlying observations? It can be the time of the
Enterprise
Management
DW
KPI query
ETL
KPI specification
requiredDW schema
Analyst
measurement, the location, and the car involved in the measurement. However, itcould also include the car driver. Some of the relevant context may be difficult todetermine such as the car driver. This can limit the utility of the KPI for decisionmaking or for understanding the process underlying the observations.
3.1 The process nature of observations
An observation is a statement made by agent (the observation) about an object in thereality, possibly involving other objects. Lenz and Shoshani [19] differentiate flowand stock observations. A flow observation is about recording a state change of theobject recorded wrt. some time interval, a stock observation is a record about theobject’s state. As a third category, they list value-per-unit observations, such as theprice of a product. Assume we would only record stock observations. If there are nochanges, then the observations of an object would also not change. This is like listingthe specific weights of elementary substances. If there are changes, then the states ofobjects vary over time and shall yield different observations. The reasons for changesare processes taking place in the reality. These processes can be natural like theradioactive decay or they are man-made, such as production processes. Consider theexample of an oil refinery that stores oil in large tanks. Each tank has a fill level.There are two processes that can change the fill level: adding oil to the tank andremoving oil. These processes are embedded in more complex processes taking placeat the oil refinery. Flow observations about the oil tank record how much the state ofan object has changed between two points of time. For example, how many liters ofoil have been added and how many have been removed in the last month. If the stateis known at the start of the time period, then the state at the end of the time period canbe calculated by applying the additions and subtractions of the flow observations. Thethird observation type, value-per-unit break down stock or flow observations to smallunits, such as the oil price per liter. Assume that the oil refinery buys quantities of oilon the market at different prices and then stores the oil in the tank. Then each liter ofoil stored in a tank virtually carries its unit price with it. The total value of the oil inthe tank is then the sum of all oil liter unit prices of oil liters stored in the tank.
The lesson learned from this argumentation is that state changes require thepresence of processes. If the processes are natural, then human influence on them islimited. For example, the water cycle on earth is driven by the sun and leads tovarying levels of water in the river systems. Still, it makes perfect sense to recordobservations about the water cycle in order to predict the water levels of certain riversat certain locations, e.g., to prepare for flooding. An organization with man-madeprocesses has an interest in managing the processes to achieve its goals, e.g. toincrease the profit or to raise customer satisfaction. The management includeschanging the parameters of process steps (e.g. their scheduling), adapting theresources (e.g. the machines used in production steps), changing the inputs of process
steps (e.g. replacing a part by another part), or changing the process itself (e.g.,reordering the process steps or removing unnecessary activities).
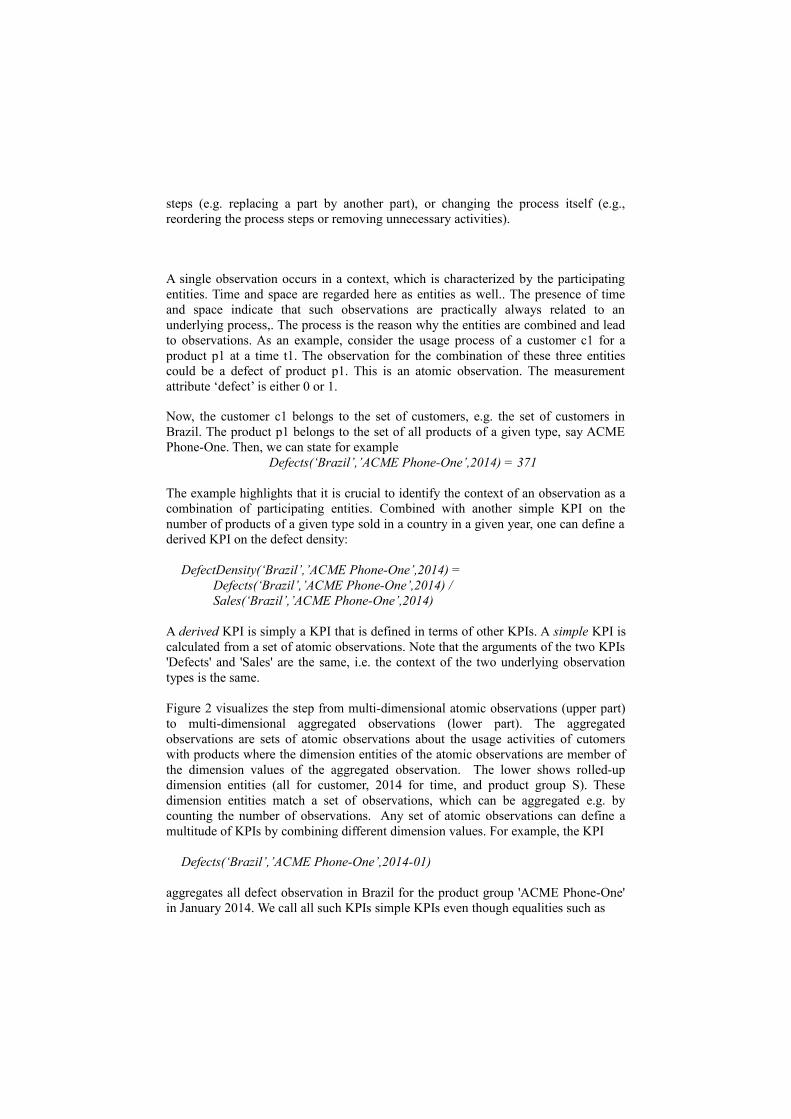
A single observation occurs in a context, which is characterized by the participatingentities. Time and space are regarded here as entities as well.. The presence of timeand space indicate that such observations are practically always related to anunderlying process,. The process is the reason why the entities are combined and leadto observations. As an example, consider the usage process of a customer c1 for aproduct p1 at a time t1. The observation for the combination of these three entitiescould be a defect of product p1. This is an atomic observation. The measurementattribute ‘defect’ is either 0 or 1.
Now, the customer c1 belongs to the set of customers, e.g. the set of customers inBrazil. The product p1 belongs to the set of all products of a given type, say ACMEPhone-One. Then, we can state for example
Defects(‘Brazil’,’ACME Phone-One’,2014) = 371
The example highlights that it is crucial to identify the context of an observation as acombination of participating entities. Combined with another simple KPI on thenumber of products of a given type sold in a country in a given year, one can define aderived KPI on the defect density:
DefectDensity(‘Brazil’,’ACME Phone-One’,2014) =Defects(‘Brazil’,’ACME Phone-One’,2014) /Sales(‘Brazil’,’ACME Phone-One’,2014)
A derived KPI is simply a KPI that is defined in terms of other KPIs. A simple KPI iscalculated from a set of atomic observations. Note that the arguments of the two KPIs'Defects' and 'Sales' are the same, i.e. the context of the two underlying observationtypes is the same.
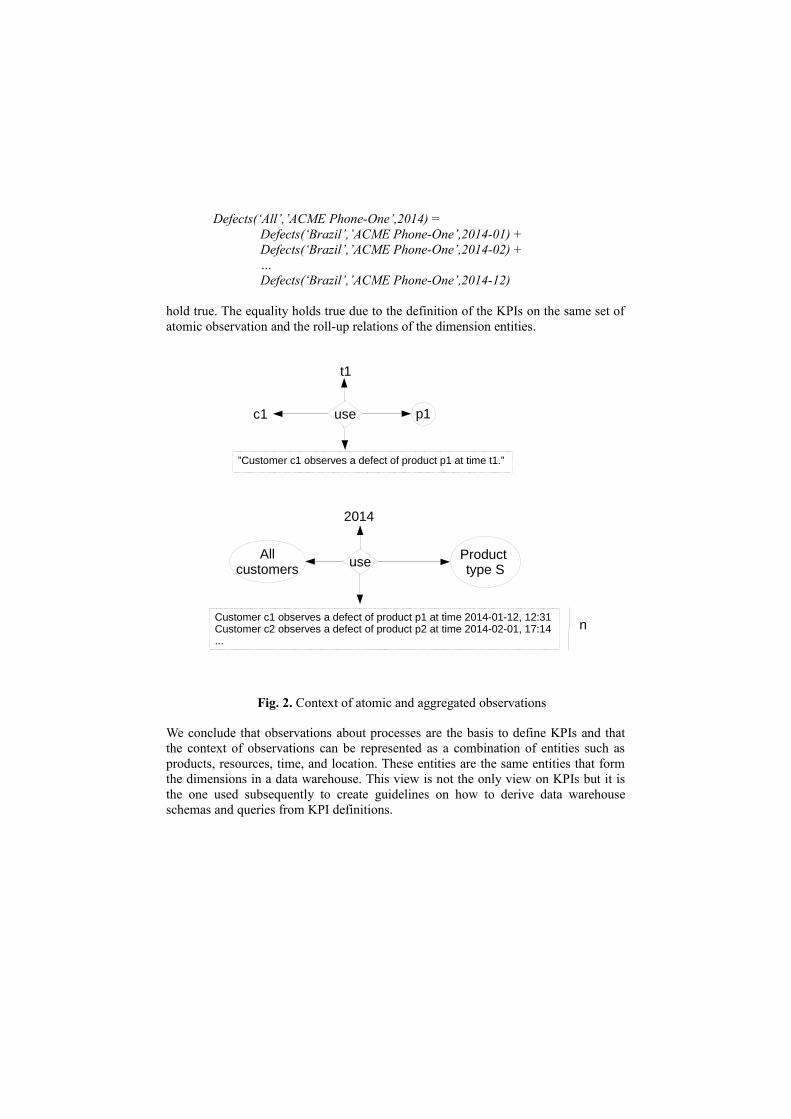
Figure 2 visualizes the step from multi-dimensional atomic observations (upper part)to multi-dimensional aggregated observations (lower part). The aggregatedobservations are sets of atomic observations about the usage activities of cutomerswith products where the dimension entities of the atomic observations are member ofthe dimension values of the aggregated observation. The lower shows rolled-updimension entities (all for customer, 2014 for time, and product group S). Thesedimension entities match a set of observations, which can be aggregated e.g. bycounting the number of observations. Any set of atomic observations can define amultitude of KPIs by combining different dimension values. For example, the KPI
Defects(‘Brazil’,’ACME Phone-One’,2014-01)
aggregates all defect observation in Brazil for the product group 'ACME Phone-One'in January 2014. We call all such KPIs simple KPIs even though equalities such as
Defects(‘All’,’ACME Phone-One’,2014) =Defects(‘Brazil’,’ACME Phone-One’,2014-01) +Defects(‘Brazil’,’ACME Phone-One’,2014-02) +…Defects(‘Brazil’,’ACME Phone-One’,2014-12)
hold true. The equality holds true due to the definition of the KPIs on the same set ofatomic observation and the roll-up relations of the dimension entities.
Fig. 2. Context of atomic and aggregated observations
We conclude that observations about processes are the basis to define KPIs and thatthe context of observations can be represented as a combination of entities such asproducts, resources, time, and location. These entities are the same entities that formthe dimensions in a data warehouse. This view is not the only view on KPIs but it isthe one used subsequently to create guidelines on how to derive data warehouseschemas and queries from KPI definitions.
t1
c1
”Customer c1 observes a defect of product p1 at time t1.”
use
Product type S
Allcustomers
2014
Customer c1 observes a defect of product p1 at time 2014-01-12, 12:31 Customer c2 observes a defect of product p2 at time 2014-02-01, 17:14...
use
n
p1
4 From KPI definitions to Data Warehouse Schemas
As motivated before, any KPI is based on observations about underlying processes.We focus on simple KPIs here, i.e. KPIs that are based on a single type of observationdenoted as
O(e1,e2,…,m)where ei are the entities participating in the observation and m is the value of the
observation, usually a number. Hence, an observation is a synonym to a fact in a datawarehouse where all dimension values are taken from the lowest rollup level. We alsouse the functional representation
O(e1,e2,…)=m
when appropriate. Since the majority of KPIs are process-oriented, we use processmodels to relate them to elements of process models. Specifically, we use the Petri netnotation [20] extended by resource and input/output elements to represent processmodel patterns. Petri nets are the formal basis for process modeling languages such asBPMN. They provide a clear token passage semantics of the process execution, whichis necessary to define performance indicators such as cycle time.
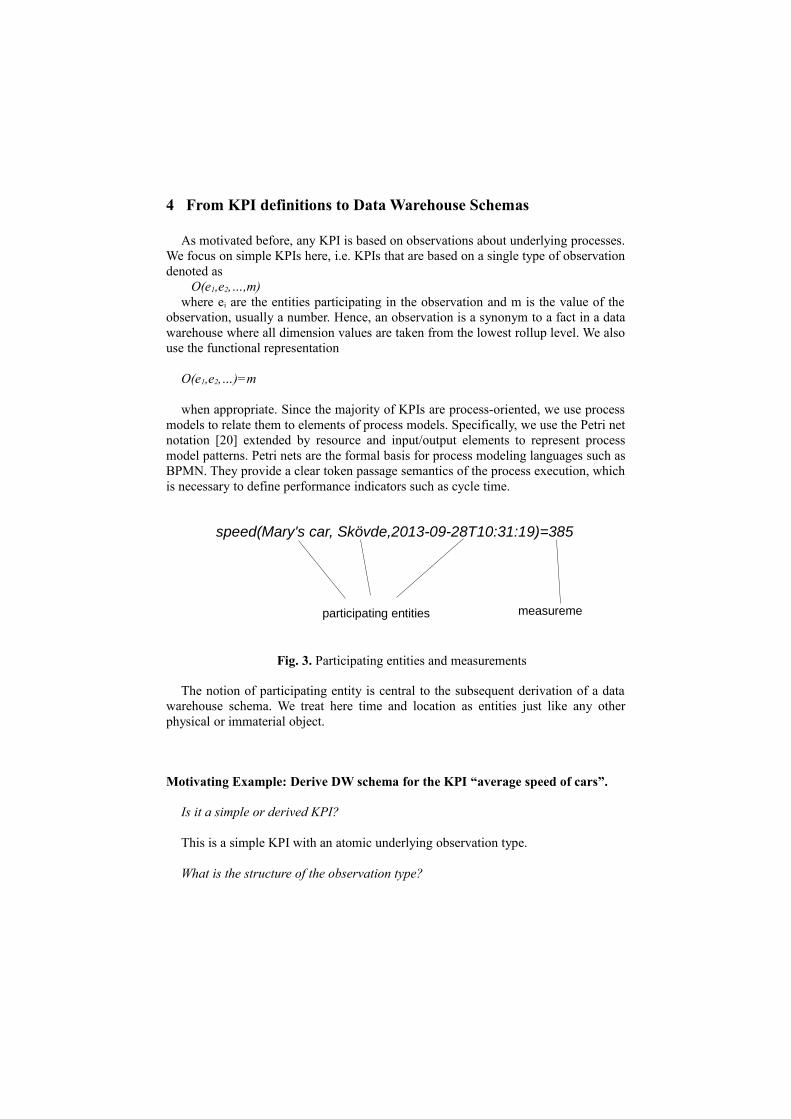
Fig. 3. Participating entities and measurements
The notion of participating entity is central to the subsequent derivation of a datawarehouse schema. We treat here time and location as entities just like any otherphysical or immaterial object.
Motivating Example: Derive DW schema for the KPI “average speed of cars”.
Is it a simple or derived KPI?
This is a simple KPI with an atomic underlying observation type.
What is the structure of the observation type?
speed(Mary's car, Skövde,2013-09-28T10:31:19)=385
participating entities measurement
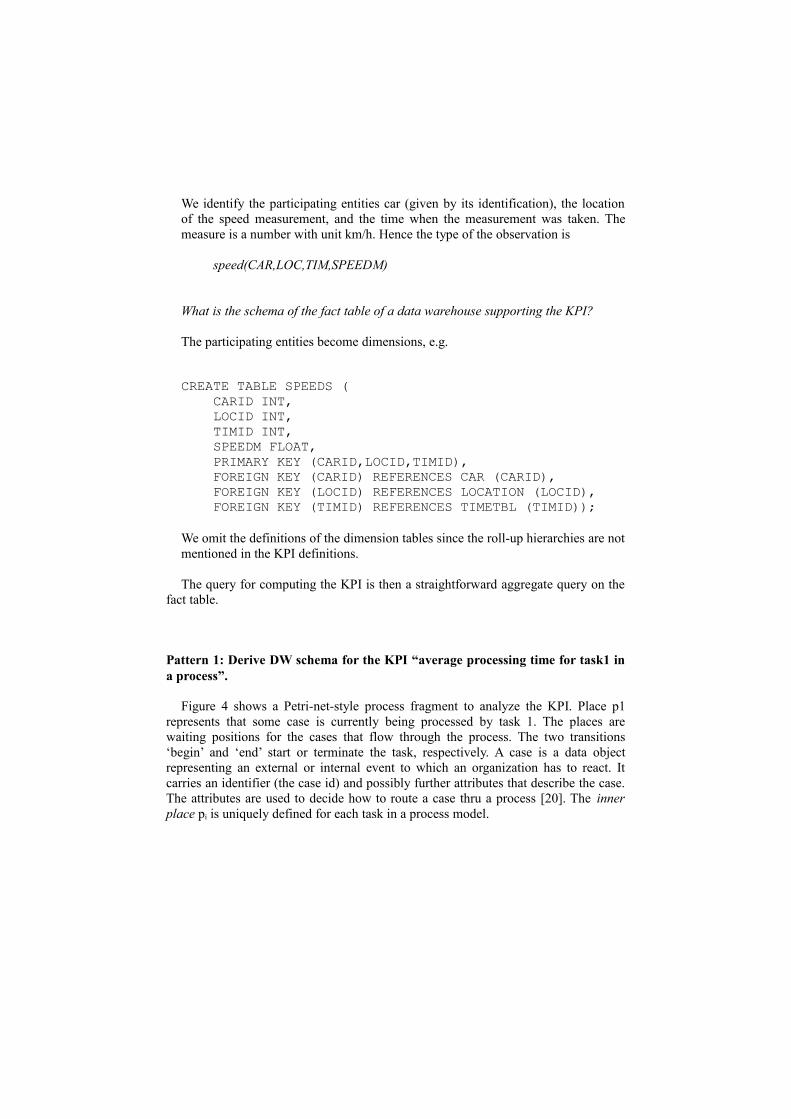
We identify the participating entities car (given by its identification), the locationof the speed measurement, and the time when the measurement was taken. Themeasure is a number with unit km/h. Hence the type of the observation is
speed(CAR,LOC,TIM,SPEEDM)
What is the schema of the fact table of a data warehouse supporting the KPI?
The participating entities become dimensions, e.g.
CREATE TABLE SPEEDS (CARID INT,LOCID INT,TIMID INT,SPEEDM FLOAT,PRIMARY KEY (CARID,LOCID,TIMID),
FOREIGN KEY (CARID) REFERENCES CAR (CARID),FOREIGN KEY (LOCID) REFERENCES LOCATION (LOCID),FOREIGN KEY (TIMID) REFERENCES TIMETBL (TIMID));
We omit the definitions of the dimension tables since the roll-up hierarchies are notmentioned in the KPI definitions.
The query for computing the KPI is then a straightforward aggregate query on thefact table.
Pattern 1: Derive DW schema for the KPI “average processing time for task1 ina process”.
Figure 4 shows a Petri-net-style process fragment to analyze the KPI. Place p1represents that some case is currently being processed by task 1. The places arewaiting positions for the cases that flow through the process. The two transitions‘begin’ and ‘end’ start or terminate the task, respectively. A case is a data objectrepresenting an external or internal event to which an organization has to react. Itcarries an identifier (the case id) and possibly further attributes that describe the case.The attributes are used to decide how to route a case thru a process [20]. The innerplace pi is uniquely defined for each task in a process model.
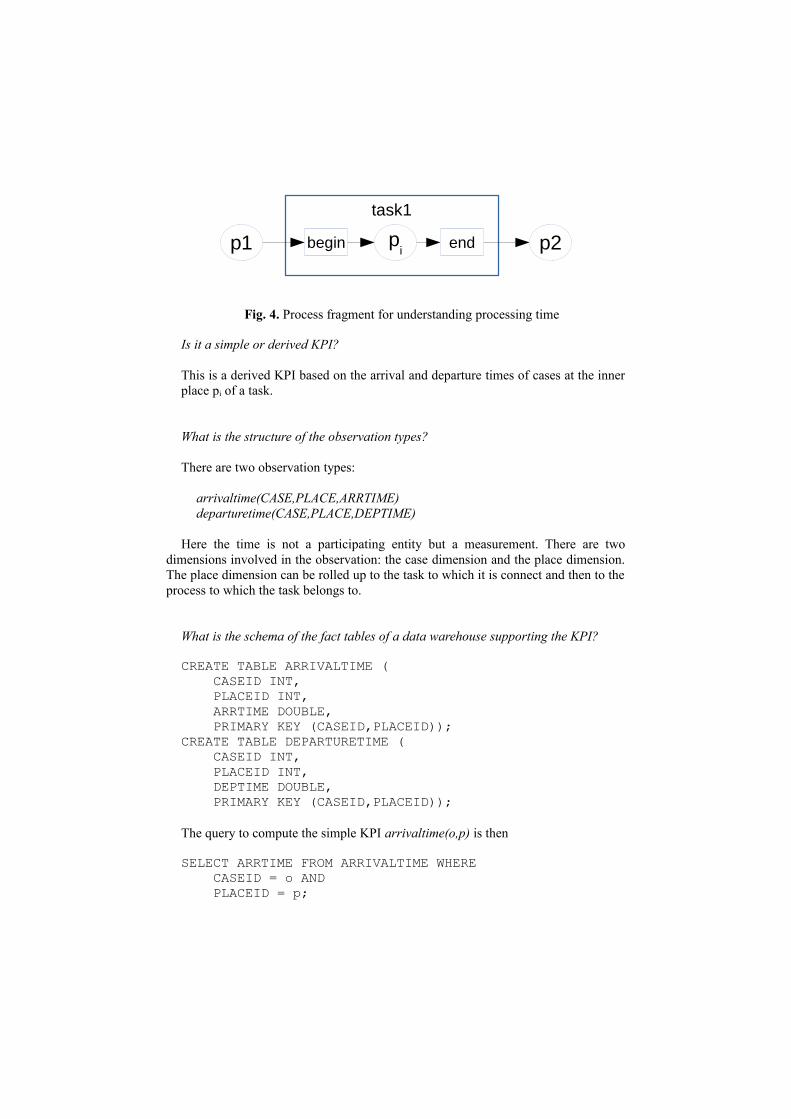
Fig. 4. Process fragment for understanding processing time
Is it a simple or derived KPI?
This is a derived KPI based on the arrival and departure times of cases at the innerplace pi of a task.
What is the structure of the observation types?
There are two observation types:
arrivaltime(CASE,PLACE,ARRTIME)departuretime(CASE,PLACE,DEPTIME)
Here the time is not a participating entity but a measurement. There are twodimensions involved in the observation: the case dimension and the place dimension.The place dimension can be rolled up to the task to which it is connect and then to theprocess to which the task belongs to.
What is the schema of the fact tables of a data warehouse supporting the KPI?
CREATE TABLE ARRIVALTIME (CASEID INT,PLACEID INT,ARRTIME DOUBLE,PRIMARY KEY (CASEID,PLACEID));
CREATE TABLE DEPARTURETIME (CASEID INT,PLACEID INT,DEPTIME DOUBLE,PRIMARY KEY (CASEID,PLACEID));
The query to compute the simple KPI arrivaltime(o,p) is then
SELECT ARRTIME FROM ARRIVALTIME WHERECASEID = o ANDPLACEID = p;
task1
pi
begin endp1 p2

The two fact tables can also be merged into a single one with two measurementattributes. Foreign key references and the definitions of the dimension tables areomitted. The query to compute the KPI aggregates the average of the difference of thedeparture time of the inner place p1 of a given task. We leave the query coding to thereader. The Petri net view on the process allows to determine what events need to berecorded by a process execution system. For pattern 1, the system has to record thetime when a case is picked up by a task (arrival time at p i) and when the task finishesa case (departure time at pi).
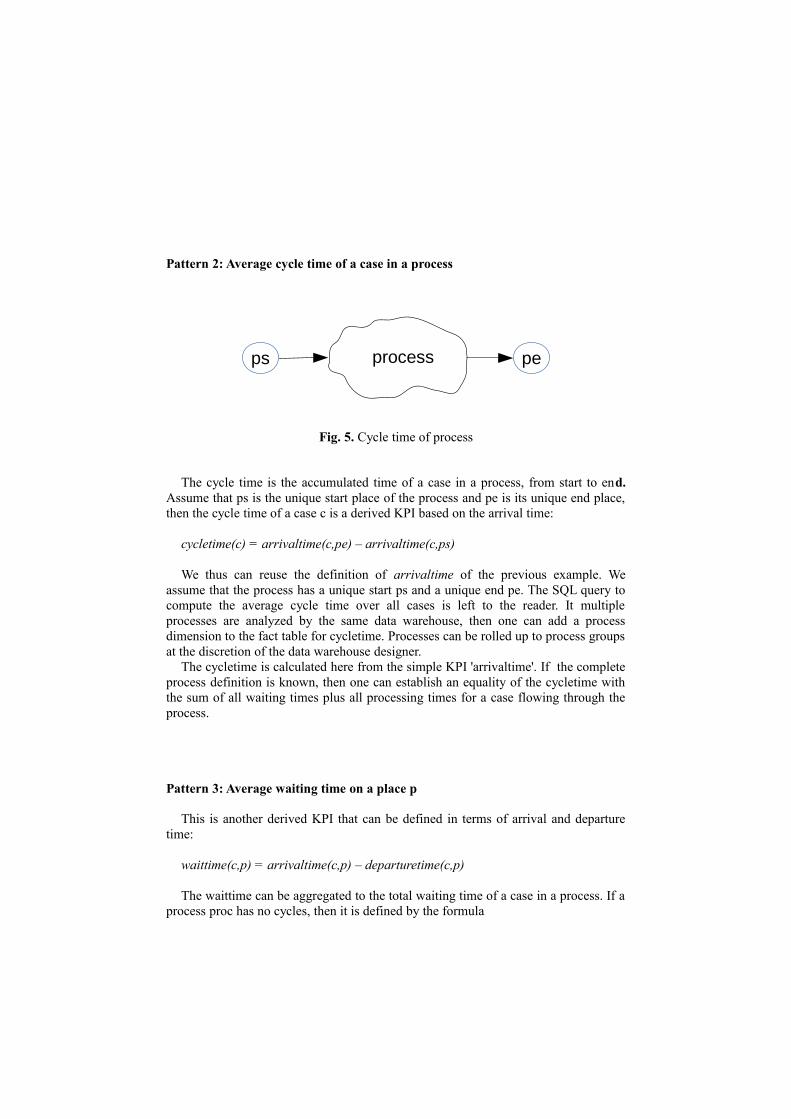
Pattern 2: Average cycle time of a case in a process
Fig. 5. Cycle time of process
The cycle time is the accumulated time of a case in a process, from start to end.Assume that ps is the unique start place of the process and pe is its unique end place,then the cycle time of a case c is a derived KPI based on the arrival time:
cycletime(c) = arrivaltime(c,pe) – arrivaltime(c,ps)
We thus can reuse the definition of arrivaltime of the previous example. Weassume that the process has a unique start ps and a unique end pe. The SQL query tocompute the average cycle time over all cases is left to the reader. It multipleprocesses are analyzed by the same data warehouse, then one can add a processdimension to the fact table for cycletime. Processes can be rolled up to process groupsat the discretion of the data warehouse designer.
The cycletime is calculated here from the simple KPI 'arrivaltime'. If the completeprocess definition is known, then one can establish an equality of the cycletime withthe sum of all waiting times plus all processing times for a case flowing through theprocess.
Pattern 3: Average waiting time on a place p
This is another derived KPI that can be defined in terms of arrival and departuretime:
waittime(c,p) = arrivaltime(c,p) – departuretime(c,p)
The waittime can be aggregated to the total waiting time of a case in a process. If aprocess proc has no cycles, then it is defined by the formula
ps peprocess
procwaittime(proc) =sum{arrivaltime(c,p)-departuretime(c,p)| c in CASE, p.process=proc}
If the process has cycles, then cases can visit the same place multiple times. Then,our original definitions for arrival and departure time cannot be used anymore. Tosolve the problem, we add an additional participating entity ‘visit’ that contains theidentifier of the visit of a case on a place:
CREATE TABLE ARRIVALTIME (VISITID INT AUTOINCREMENT,CASEID INT,PLACEID INT,ARRTIME DOUBLE,PRIMARY KEY (VISITID,CASEID,PLACEID));
The fact table for departure time is updated accordingly. Then, the process waitingtime can be defined as
procwaittime(proc) =sum{arrivaltime(v,c,p)-departuretime(v,c,p)| c in CASE,
p.process=proc,v in INT}
We leave the SQL coding for calculating the KPI to the reader.
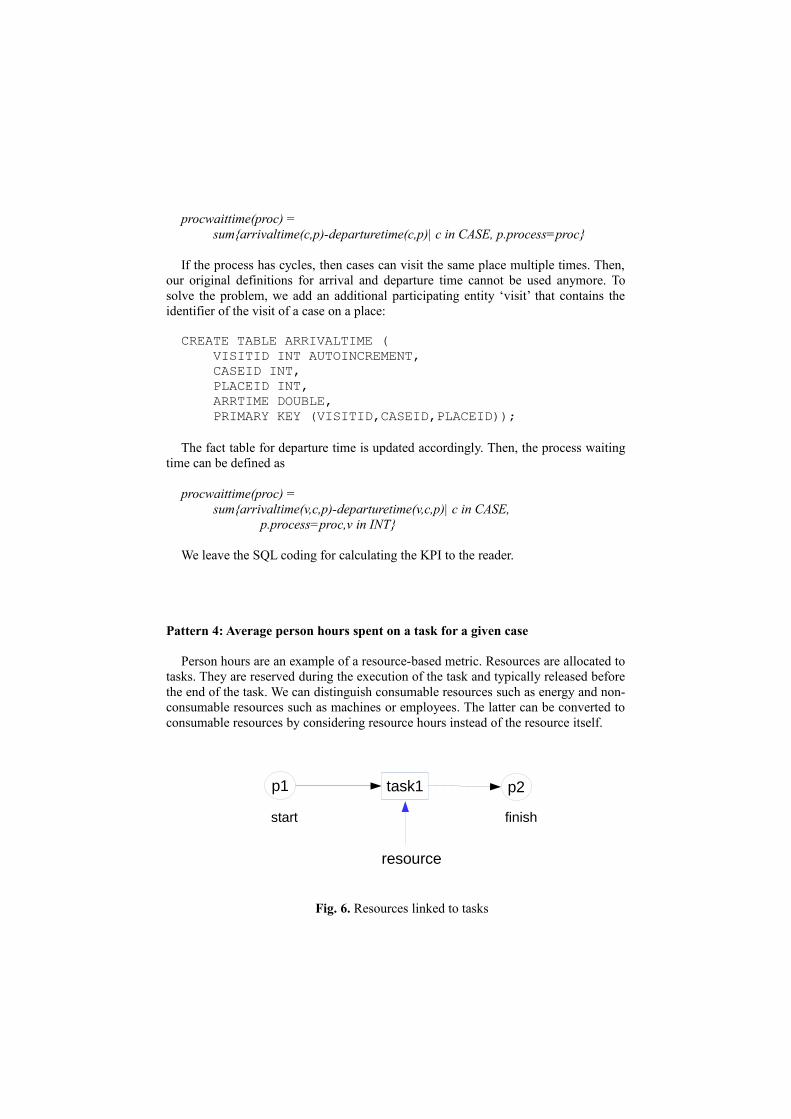
Pattern 4: Average person hours spent on a task for a given case
Person hours are an example of a resource-based metric. Resources are allocated totasks. They are reserved during the execution of the task and typically released beforethe end of the task. We can distinguish consumable resources such as energy and non-consumable resources such as machines or employees. The latter can be converted toconsumable resources by considering resource hours instead of the resource itself.
Fig. 6. Resources linked to tasks
p1 task1 p2
start finish
resource
Figure 6 links a resource to a task in a SADT-like style as also used by Fenton andPfleeger for software processes [22]. In an SADT (structured analysis and designtechnique) diagram, a task has inputs, outputs, resources used for the task and controlinformation (e.g. a time schedule). The resource consumption can be observed byidentifying the current case, the task to be performed, the identifier of the resource.The measurement is the consumption of the resource, e.g. person hours. Hence theobservation type is
personhours(CASE,TASK,RESOURCE,RHOURS)
The following fact table implements the observation type:
CREATE TABLE PERSONHOURS (CASEID INT,TASKID INT,RESOURCEID INT,RHOURS DOUBLE,PRIMARY KEY (CASEID,TASKID,RESOURCEID));
The query to compute the resource consumption per task and resource is then asfollows:
SELECT TASKID,RESOURCEID,AVG(RHOURS) FROM PERSONHOURSGROUP BY (TASKID,RSOURCEID);
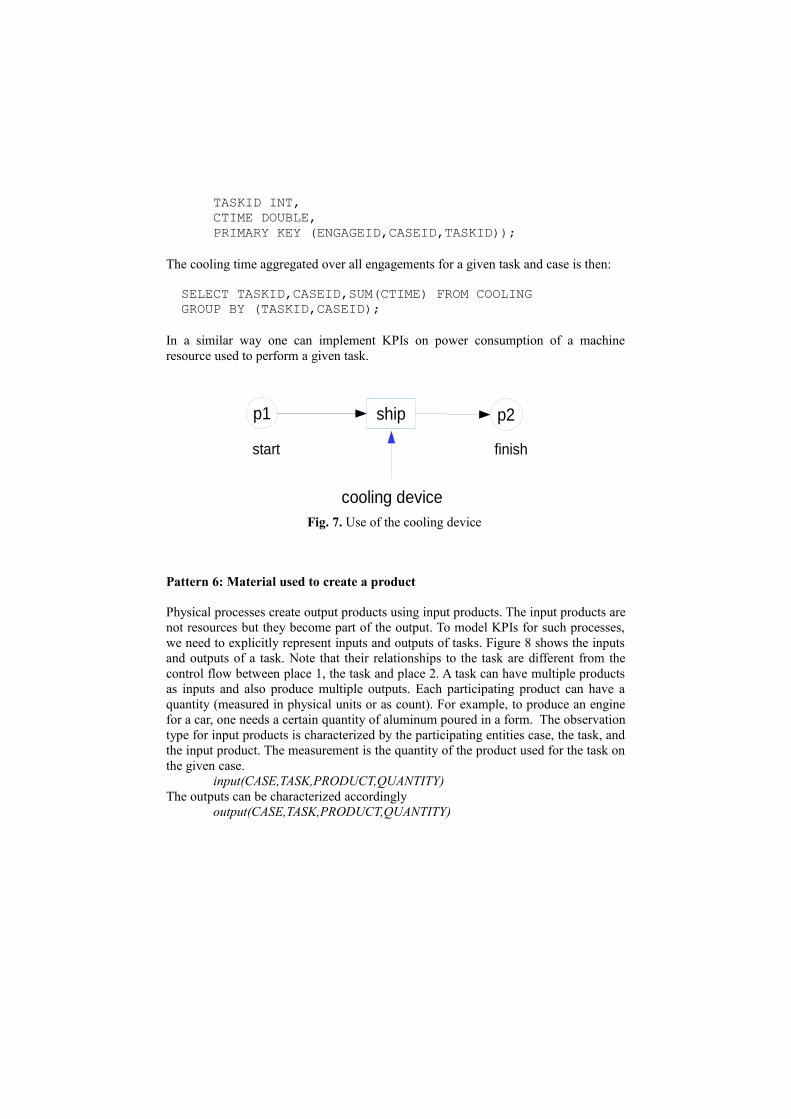
Pattern 5: Percentage of the truck shipment time where the truck cooling deviceis active
This KPI is derived from the process time of the truck shipment and the aggregatedcooling times of the cooling device resource. The first KPI is discussed in example 2.Hence, we only need to handle the use of the cooling device.
cooling(ENGAGE,CASE,TASK,CTIME)
The cooling device can be engaged multiple times during a shipment. The observationhas as participating entities the engagement id, the case, the task (ship) and asmeasurement the time of the engagement.
CREATE TABLE COOLING (ENGAGEID INT AUTOINCREMENT,CASEID INT,
TASKID INT,CTIME DOUBLE,PRIMARY KEY (ENGAGEID,CASEID,TASKID));
The cooling time aggregated over all engagements for a given task and case is then:
SELECT TASKID,CASEID,SUM(CTIME) FROM COOLINGGROUP BY (TASKID,CASEID);
In a similar way one can implement KPIs on power consumption of a machineresource used to perform a given task.
Fig. 7. Use of the cooling device
Pattern 6: Material used to create a product
Physical processes create output products using input products. The input products arenot resources but they become part of the output. To model KPIs for such processes,we need to explicitly represent inputs and outputs of tasks. Figure 8 shows the inputsand outputs of a task. Note that their relationships to the task are different from thecontrol flow between place 1, the task and place 2. A task can have multiple productsas inputs and also produce multiple outputs. Each participating product can have aquantity (measured in physical units or as count). For example, to produce an enginefor a car, one needs a certain quantity of aluminum poured in a form. The observationtype for input products is characterized by the participating entities case, the task, andthe input product. The measurement is the quantity of the product used for the task onthe given case.
input(CASE,TASK,PRODUCT,QUANTITY)The outputs can be characterized accordingly
output(CASE,TASK,PRODUCT,QUANTITY)
p1 ship p2
start finish
cooling device
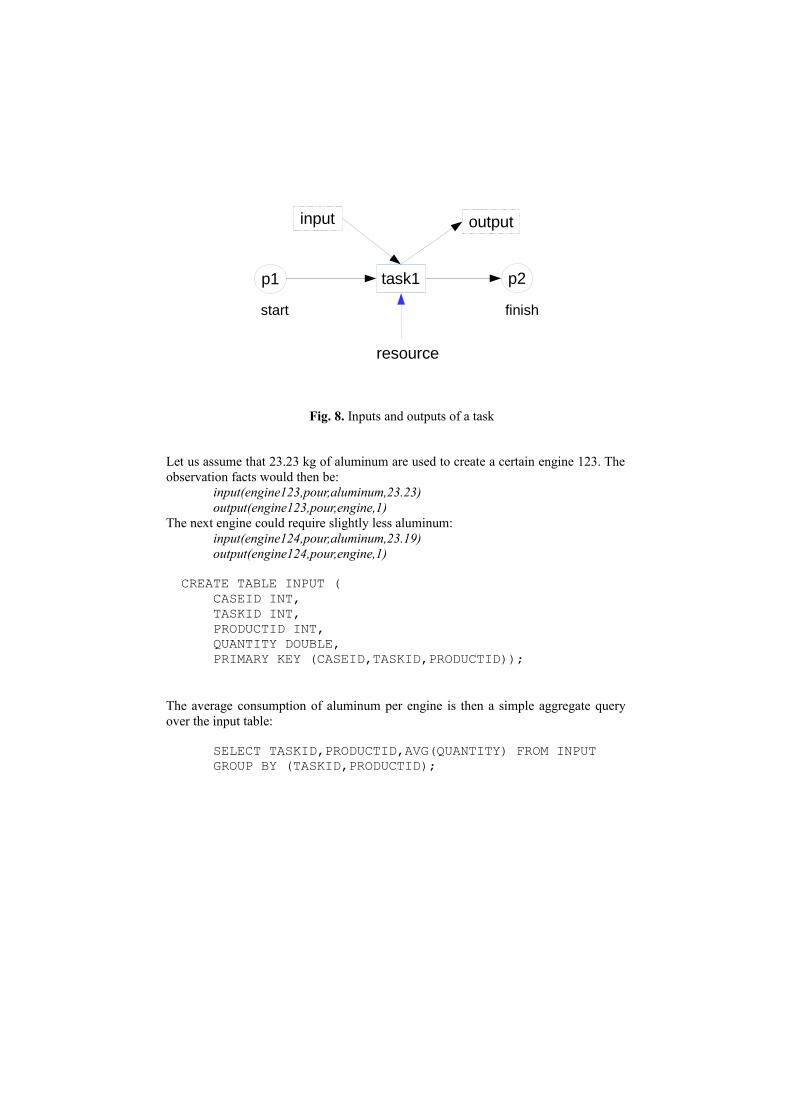
Fig. 8. Inputs and outputs of a task
Let us assume that 23.23 kg of aluminum are used to create a certain engine 123. Theobservation facts would then be:
input(engine123,pour,aluminum,23.23)output(engine123,pour,engine,1)
The next engine could require slightly less aluminum:input(engine124,pour,aluminum,23.19)output(engine124,pour,engine,1)
CREATE TABLE INPUT (CASEID INT,TASKID INT,PRODUCTID INT,QUANTITY DOUBLE,PRIMARY KEY (CASEID,TASKID,PRODUCTID));
The average consumption of aluminum per engine is then a simple aggregate queryover the input table:
SELECT TASKID,PRODUCTID,AVG(QUANTITY) FROM INPUTGROUP BY (TASKID,PRODUCTID);
p1 task1 p2
start finish
resource
input output
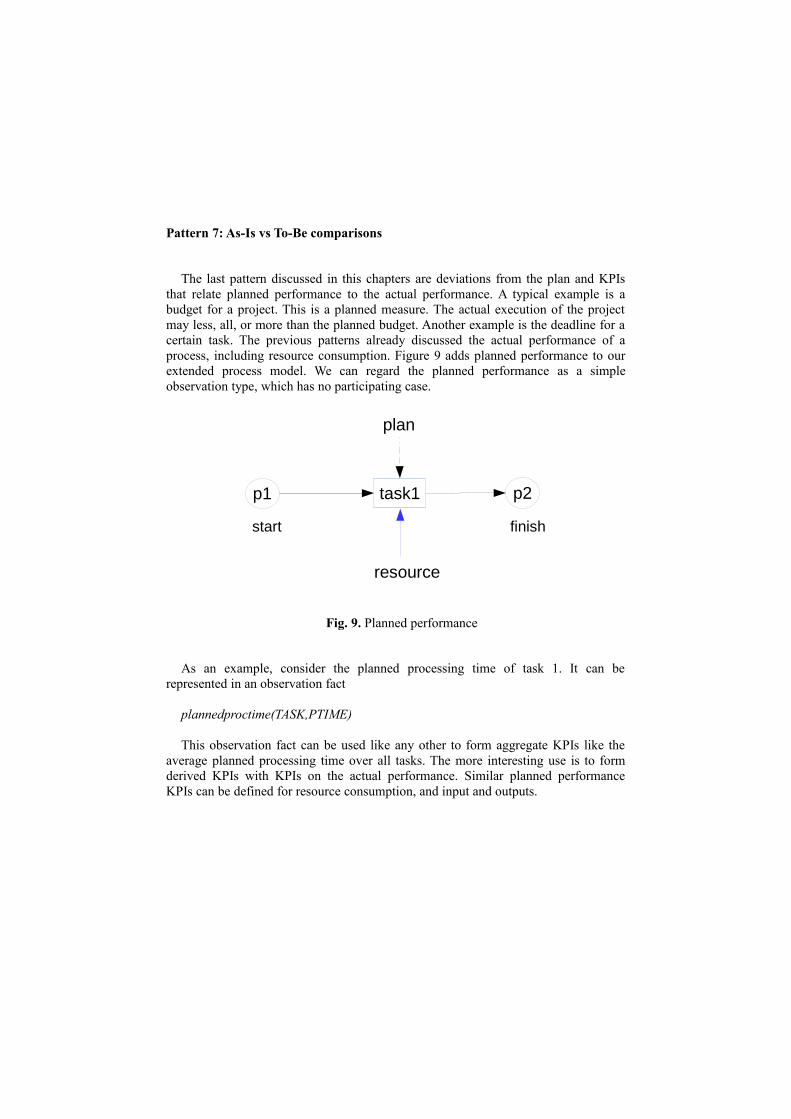
Pattern 7: As-Is vs To-Be comparisons
The last pattern discussed in this chapters are deviations from the plan and KPIsthat relate planned performance to the actual performance. A typical example is abudget for a project. This is a planned measure. The actual execution of the projectmay less, all, or more than the planned budget. Another example is the deadline for acertain task. The previous patterns already discussed the actual performance of aprocess, including resource consumption. Figure 9 adds planned performance to ourextended process model. We can regard the planned performance as a simpleobservation type, which has no participating case.
Fig. 9. Planned performance
As an example, consider the planned processing time of task 1. It can berepresented in an observation fact
plannedproctime(TASK,PTIME)
This observation fact can be used like any other to form aggregate KPIs like theaverage planned processing time over all tasks. The more interesting use is to formderived KPIs with KPIs on the actual performance. Similar planned performanceKPIs can be defined for resource consumption, and input and outputs.
p1 task1 p2
start finish
resource
plan
5 Conclusions
This paper discussed how to map a KPI definition to a data warehouse schema and thequery calculating the KPI. Rather than developing a method to automatically generatethe schema and queries, we elaborated on patterns for process performance KPIs. Thepatterns included processing time, waiting time, resource consumption, material use,and the comparison of planned versus actual performance. An extended processmodel that includes places, tasks, resources, inputs/outputs, and plans wasincorporated to derive the observation types underlying the KPIs. Simple KPIs have asingle observation type associated to them. Derived KPIs are computed as expressionsover simple KPIs.
The patterns can be used to support the top-down design of a data warehouse froma set of process-related KPIs that shall be computed by it. The starting points are thenatural language KPI definition and a process model fragment that visualizes thecontext in which the observations belonging to the KPI are collected. The notion ofPetri-net places allowed for a straight-forward definition of time-based KPIs by justusing arrival and departure times of cases at and from places. The pattern on resourceconsumption allows dealing with a whole group of KPIs such as person hours spenton a task.
The input/output pattern allows to measure physical material flow. These patternscan also be combined with the other patterns, e.g. to measure how many person hoursare needed to produce a certain number of products. Finally, planned performance isrealized by a simplified observation type that has no case identifiers.
We argue that practically all KPIs are process-related because any change of a staterequires some activity leading to the state change. Some KPIs are about 'stock'observations (c.f. Lenz and Shoshani [19]), e.g. observing the number of cars on acertain street segment. The observation is related to the ongoing travel processes ofthe car drivers, which are not made explicit in an information system about the trafficstatus. The observation times are independent of the underlying travel processes.: twoconsecutive observations could be about the very same state. If the process is notexplicit, then it cannot be controlled so easily. 'Flow' observations are directly linkedto a process task, since they make an explicit statement on a state change. In thetraffic example, each time that a car enters or leaves the street segment, anobservation would be recorded. This type of observation allows to control the traffic,e.g. by using traffic lights for the street segment that is set to red when too many carsare in the segment. In this paper, we thus focussed on flow observations.
Future work is needed to understand how to define a KPI in a formal languagesuch that a supporting data warehouse schema can be automatically generated fromthe KPI definition. Another open question is whether the discussed 7 patterns cover aconsiderable portion of KPIs actually used in practice. The KPI Library(http://kpilibrary.com) contains more than a thousand KPIs in high level naturallanguage that can be used to answer this question. We did not discuss how dimensiontables can be created and populated. Most rollup hierarchies are domain-specific withthe exception of time.
Finally, it would be interesting to investigate rules for the correct definitions ofderived KPIs in terms of constraints on the use of parameters for the participatingentities of the observation facts. For example, it does not make (much) sense tocompare the arrival times and departure times of places belonging to differentprocesses.
KPIs can also be regarded as statistical variables, possibly depending on eachother. The long-term collection of KPIs can be used to calculate their correlation andthus to form a theory on estimating dependent KPIs from independent ones. Thispaper was meant to encourage the systematic collection of many process KPIs suchthat theories for predicting them can be developed´and validated using methods fromSPC [25].
References
1. Wetzstein, B., Leitner, P., Rosenberg, F., Brandic, I., Dustdar, S., Leymann, F.: Monitoringand Analyzing Influential Factors of Business Process Performance. In: Proceedings 2009IEEE International Enterprise Distributed Object Computing Conference, Auckland, NZ,Sep. 1-4, 2009, 141-150 (2009)
2. Deming, W.E.: On Probability as a basis for action. The American Statistician 29(4), 146-152, (1975)
3. CMMI Guidebook Acquirer Team: Understanding and Leveraging a Supplier's CMMIEfforts: A Guidebook for Acquirers, CMU/SEI-2007-TR-004. Software EngineeringInstitute. http://resources.sei.cmu.edu/library/asset-view.cfm?assetID=8315, March 2007.
4. Horkoff, J., Barone, D., Jiang, L., Yu, E.S.K., Amyot, D., Borgida, A., Mylopoulos, J.:Strategic Business Modeling: Representation and Reasoning. SoSym 13(3), 1015-1041(2014)
5. Golfarelli, M., Maio, D., Rizzi, S.: Conceptual Design of Data Warehouses from E/RSchema. In: Proceedings of the 31th Annual Hawaii International Conference on SystemSciences-Volume 7, 334-243 (1998)
6. Golfarelli, Rizzi, S.: Data Warehouse Design – Modern Principles and Methodologies.McGrawHill (2009)
7. Song, I.-Y., Khare, R., Dai, B.: SAMSTAR: a semi-automated lexical method for generatingstar schemas from an entity-relationship diagram. Proceedings ACM 10 th Workshop on DataWarehousing and OLAP, Lisbon, Portugal, Nov. 9, 2007, 9-16 (2007)
8. Zepeda, L., Celma, M., Zatarain, R.: A methodological framework for conceptual datawarehouse design. Proceedings of the 43nd Annual Southeast Regional Conference, 2005,Kennesaw, Georgia, Alabama, USA, March 18-20, 2005, Volume 1, 256-259 (2005)
9. Phipps, D., Davis, K. C.: Automating Data Warehouse Conceptual Schema Design andEvaluation. In: Proceedings of the 4th International Workshop on Design and Managementof Data Warehouses (DMDW), Toronto, Canada, CEUR-WS.org/Vol-58, 23-32 (2002)
10.Moody, D., Kortink, M.A.R.: From Enterprise Models to Dimensional Models: AMethodology for Data Warehouse and Data Mart Design. Proceedings of the Intl. Workshopon DMDW 2000, Stockholm, Sweden, June 5-6, 2000, CEUR-WS.org/Vol-28 (2000)
11. Prakash, N., Gosain, A.: Requirements Driven Data Warehouse Development. Short PaperProceedings CAiSE 2003, Klagenfurt, Austria, June 16-20, 2003, CEUR-WS.org/Vol-74(2003)
12. Giorgini, P., Rizzi, S., Garzetti, M.: Goal-oriented requirement analysis for data warehousedesign. Proceedings ACM 8th International Workshop on Data Warehousing and OLAP,Bremen, Germany, November 4-5, 2005, 47-56 (2005)
13.Tryfona,N. , Busborg, F. , Christiansen, J.G.B.: StarER: a conceptual model for datawarehouse design. Proceedings of the 2nd ACM International Workshop on Datawarehousing and OLAP, Kansas City, Missouri, USA, November 2-6, 1999, 3-8 (1999)
14. Jones, M. E., Song, I.-Y.: Dimensional Modeling: Identification, Classification, andApplying Patterns. Proceedings 8th ACM International Workshop on Data Warehousing andOLAP (DOLAP), Bremen, Germany, 29-38 (2005)
15.Shoshani, A.: OLAP and statistical databases: Similarities and differences. Proceedings ofthe 16th ACM SIGACT-SIGMOD-SIGART Symposium on Principles of Database Systems.ACM Press, New York, NY, USA, 185-196 (1997)
16.Horner, J. , Song, I.Y. , Chen,P.P.: An analysis of additivity in OLAP systems. Proceedingsof the 7th ACM international workshop on Data warehousing and OLAP, November 12-13,2004, Washington, DC, USA (2004)
17.Martyn,T: Reconsidering Multi-Dimensional schemas, ACM SIGMOD Record 33(1), 83-88(2004)
18.Guo,Y., Tang, S., Tong, Y., Yang, D: Triple-driven data modeling methodology in datawarehousing: a case study. Proceedings of the 9th ACM International Workshop on DataWarehousing and OLAP, November 10, 2006, Arlington, Virginia, USA (2006)
19. Lenz, H.J., Shoshani, A.: Summarizability in OLAP and statistical databases. ProceedingsSSDBM 1997, http://dx.doi.org/10.1109/SSDM.1997.621175.
20. van der Aalst, W.M.P., van Hee, K.M.: Workflow Management – Models, Methods, andSystems. MIT Press (2002).
21. Vaisman, A.., Zimány, E..: Data Warehouse Systems – Design and Implementation.Springer (2014).
22. Fenton, N.E., Pfleeger, S.L.: Software Metrics - A Practical and Rigorous Approach.Thomson, 1996.
23 Software Engineering Institute: CMMI for Development - Version 1.3. Technical ReportCMU/SEO-2010-TR-033, Carnegie-Mellon University, November 2010.
24. Oivo, M., Basili, V.R.: Representing Software Engineering Models - The TAME GoalOriented Approach. IEEE Trans. Software Eng., 18, 10, 886-898,http://dx.doi.org/10.1109/32.163605.
25. Oakland, J.S.: Statistical Process Control. Sixth Edition. Routledge, 2008.