Embed Size (px)
Citation preview

AnnuAl RepoRt 2009
Key FiguRes
Amounts in DKK million (unless otherwise stated) 2009 2008 2007 2006 2005 *
Revenue 69,004 68,829 63,922 55,772 31,741 operating profit before other items 3,874 4,061 3,835 3,234 1,932 operating margin before other items, % 5.6 5.9 6.0 5.8 6.1 eBitDA 1) 4,145 4,622 4,484 3,764 1,979 Adjusted eBitDA 1), 2) 4,742 4,930 4,680 3,979 2,383 operating profit 3) 3,277 3,753 3,639 3,019 1,528 net finance costs (2,308) (2,731) (3,017) (2,351) (1,721)profit before goodwill impairment/amortisation of brands and customer contracts 385 494 376 226 (410)net profit/(loss) for the year 4) (1,629) (631) (442) (809) (945)
Additions to property, plant and equipment, gross 954 964 938 907 576 Cash flow from operating activities 3,732 4,334 3,713 3,195 2,109 investments in intangible assets, property, plant and equipment, net (897) (718) (715) (843) (372)
total assets 54,354 53,605 55,348 52,253 46,456 goodwill 27,434 27,259 27,593 26,178 22,995 Carrying amount of net debt 1) 30,630 29,385 29,245 26,271 22,741 total equity 4) 2,213 3,533 5,518 5,980 6,774
Financial ratios 1)
interest coverage 2.1 1.8 1.6 1.7 1.4 Cash conversion, % 96 103 99 102 145 employees on full-time, % 71 69 68 66 61 number of employees at 31 December 485,800 472,800 438,100 391,400 310,800
Growthorganic growth, % 0.6 5.3 6.0 5.5 - Acquisitions, net, % 2 6 9 15 - total revenue, % 3 8 15 20 - Currency adjustments, % (3) (3) (0) 0 -
Other Financial Measures 5)
pro Forma Adjusted eBitDA 4,773 5,064 4,866 4,203 pro Forma net Debt 31,261 29,978 29,981 27,714 pro Forma net Debt / pro Forma eBitDA 6.55x 5.92x 6.16x 6.59x
note: except for the key figures that can be directly derived from the consolidated financial statements on pages 49-118 of this report, the key figures and ratios above are not measures
of financial performance under Danish gAAp or iFRs. the group includes these financial measures because it believes that they are appropriate measures of the group’s financial perform-
ance. other companies, including those in iss’s industry, may calculate similarly titled financial measures differently.
* iss Holding A/s was founded on 11 March 2005, while the activities of iss were acquired on 9 May 2005. Consequently, the 2005 figures do not represent full year figures and it is therefore
not possible to conduct a proper comparison with the 2005 figures.
the applied accounting principles are described in note 1, significant accounting policies in the consolidated financial statements.
1) see page 135 for definitions.2) Adjusted eBitDA, as calculated by the group, represents operating profit before other items plus Depreciation and amortisation. By using operating profit before other items for the
calculation of adjusted eBitDA instead of operating profit, the group excludes from the calculation of adjusted eBitDA integration costs relating to acquisitions and those items recorded
under other income and expenses, net, in which the group includes income and expenses that it believes do not form part of the group’s normal ordinary operations, such as gains and
losses arising from divestments, the winding up of operations, disposals of property, restructuring and certain acquisition related costs. some of the items that the group records under
the line item other income and expenses, net, are recurring and some are non-recurring in nature.3) excluding goodwill impairment and write-down and Amortisation of brands and customer contratcs.4) including minority interests.5) the pro Forma adjusted financial information is for informational purposes only. see page 137, Capital structure, for further information on other Financial Measures.
Key figures
Revenue DKK 69.0 billion (euR 9.3 billion)operating profit before other items DKK 3.9 billion (euR 0.5 billion)employees 485,800
ContaCt information
group Communications Kaspar Bach Habersaat, Head of group Communicationstel: +45 38 17 00 00
iss Holding A/sBredgade 30DK-1260 Copenhagen KDenmarktel: +45 38 17 00 00Fax: +45 38 17 00 [email protected]
CVR 28 50 47 99
eDiteD By: group Finance and group Communications,iss A/s
Design: iss A/s and Datagraf A/s
pRoDuCtion & pRint: Datagraf A/s, Denmark, March 2010.
Datagraf is environmentally certified after Ds/en iso 14001:2004 and eMAs and FsC certified.
Ferenc jóbA
ISS HOLDInG A/S · breDGADe 30 · DK-1260 cOPenHAGen K · DenMArKWWW.ISSWOrLD.cOM · [email protected] · TeL: +45 38 17 00 00 · FAX: +45 38 17 00 11
An
nu
Al R
epo
Rt 20
09

iss oPerates in more tHan 50 Countries in euroPe, asia, PaCifiC, nortH ameriCa anD Latin ameriCa
ArgentinaAustraliaAustriaBelgium
Bosnia and HerzegovinaBrazilBrunei
BulgariaCanadaChileChina 1)
CroatiaCzech RepublicDenmarkestonia
FinlandFrance germanygreece
greenlandHungaryicelandindia
indonesiairelandisraelitaly
Japanlatvialithuanialuxembourg
MalaysiaMexiconetherlandsnew Zealand
norwayphilippines polandportugal
RomaniaRussiasingaporeslovakia
sloveniasouth Africaspainsweden
switzerlandtaiwanthailandturkey
united KingdomuruguayusA
1) including Hong Kong
iss is among the world’s largest private employers, the vast majority of its more than 485,000 employ-ees are in the front-line delivery of services.
through a network of local operations, iss offers Facility services on an international scale, leverag-ing knowledge and experience between countries for the benefit of its customers. it is iss’s ambi-tion to develop partnerships with its customers, enabling them to focus attention and resources on their core business by outsourcing a broad range of support services to iss.
Facility Servicesiss’s core business is to manage and deliver Facility services, covering a range of services within Clean-ing, support services, property services, Catering, security and Facility Management.
the services are delivered as single services, Multi services or as an integrated Facility services (iFs) so- lution with on-site management through a single point of contact with the customer.
Organisationiss’s head office is located in Copenhagen, Den-mark. iss maintains a decentralised organisational structure under which its country operations are separately organised and act with a significant amount of autonomy, assisted by a strong regional management structure providing strategic direc-tion, managerial support and financial control. this structure makes the organisation more responsive to market conditions while at the same time foster-ing an entrepreneurial culture within iss.
Ownershipiss equity A/s, a company indirectly owned by funds advised by eQt partners and goldman sachs Capital partners, is the owner and single share-holder of iss Holding A/s.
ManagementDecisions regarding iss’s strategy and financing are the responsibility of the Board of Directors and executive group Management. ole Andersen is Chairman of the Board and Jørgen lindegaard is group Chief executive officer.
Historyiss has operated in the service industry for more than a hundred years. the iss group was founded as a small Danish security company in 1901 and be-gan offering cleaning services in 1934. selected key milestones of the group’s history are listed oppo-site.
Visioniss has a strong position in the global Facility ser- vices market. to maintain this position, iss contin-ues to focus on following the iss vision:
iss At A glAnCe
1901 iss was founded in Copenhagen, Denmark as a small
security company with 20 night watchmen named
Kjøbenhavn-Frederiksberg nattevagt (Copenhagen-Fred-
eriksberg night Watch)
1934 iss entered the cleaning business with the establishment
of Det Danske Rengørings selskab A/s (the Danish
Cleaning Company) as an independent subsidiary of
the security company
1946 the first geographical expansion outside Denmark:
swedish subsidiary established
1968 the company adopted the iss name
1973 overseas expansion started
1975 group revenue reached DKK 1 billion
1977 iss shares listed on the Copenhagen stock exchange
1989 the total number of employees in the group reached
100,000
1997 strategy “aim2002“ was launched. this strategy focused
on Multi services – selling a number of services to the
same customer
1999 iss acquired Abilis, the second largest european provider
of cleaning and specialised services, in a DKK 3.6 billion
acquisition, the group’s largest ever. Abilis had about
50,000 employees and annual revenues of DKK 5.2 billion
in 1998. the total number of employees in the group
reached 200,000
2000 A new five-year strategy “create2005“ was launched,
introducing the Facility services concept
2003 iss’s first major pan-european integrated Facility services
contract signed
2005 A new strategy was introduced aiming at a continuous
transformation of iss towards an integrated Facility
services company. iss A/s was acquired by funds advised
by eQt partners and goldman sachs Capital partners, and
de-listed from the Copenhagen stock exchange. the total
number of employees in the group reached 300,000
2006 group revenue passed DKK 50 billion. iss made the
second-largest acquisition in company history, when
acquiring the outstanding 51% of the shares in tempo
services ltd. in Australia
2007 group revenue passed DKK 60 billion. iss entered the us
market through the acquisition of sanitors inc. the total
number of employees in the group reached 400,000
2008 introduction of iss’s strategy plan “the iss Way”, which
focuses on further aligning the business model and
strengthening knowledge-sharing abilities. iss’s largest
ever international integrated Facility services contract
was signed
CLEANING 52%
CATERING 9%
PROPERTY SERVICES 21%
SUPPORT SERVICES 7%
SECURITY 7%
FACILITY MANAGEMENT 4%
iss is one of tHe WorLD’s Largest CommerCiaL ProViDers of faCiLity serViCes, oPerating
in oVer 50 Countries in euroPe, asia, PaCifiC, nortH ameriCa anD Latin ameriCa. iss Has a
DiVerse Customer Base tHat is estimateD to inCLuDe more tHan 200,000 PuBLiC anD PriVate
seCtor Customers.
lead Facility services globally by leading Facility services locally
ISS MILeSTOneS
reVenue By serViCe 2009

AnnuAl RepoRt 2009
ISS HoldIng A/S
Cover page: A World of services in Indonesiaour staff in action serving some of our more than 2,700 customers in Indonesia. With over 47,000 employees, ISS Indonesia is now the largest ISS organisa-tion. It is also one of the most successful ISS organisations with a compound-ed annual organic growth rate above 50% since 2000. this is why Indonesia is among the growth locomotives in ISS and we expect continued growth and success from our colleagues in Asia.

EstEfania alvarEz
ARgentInAour history with IBM in Argentina dates back to 1984. our first contract was a service agreement for two technicians, however, our relationship has evolved over the years, and today we provide a full IFS contract to IBM in Argentina. After 24 years of an uninterrupted partnership, we have 290 full-time, on-site ISS employees on nine different IBM sites in Argentina, cover-ing more than 110,000 square meters and attending to the requirements of more than 6,000 IBM employees.

annual report 2009 · 3
ContentS
Key FIguReS Cover
ISS At A glAnCe Cover
letteR to ouR StAKeHoldeRS 5
MAnAgeMent'S ReVIeW 7
CountRy oVeRVIeW 17
FInAnCIAl ReVIeW 20
StRAtegy – tHe ISS WAy 27
CoRpoRAte goVeRnAnCe 36
BoARd oF dIReCtoRS 42
exeCutIVe MAnAgeMent 43
gRoup MAnAgeMent 44
MAnAgeMent StAteMent 46
Independent AudItoR'S RepoRt 47
ConSolIdAted FInAnCIAl StAteMentS 49
pARent CoMpAny FInAnCIAl StAteMentS 119
deFInItIonS 135
CApItAl StRuCtuRe 137
CountRy AddReSSeS 142
ISS gRoup & SeRVICeS 144

netHeRlAndSdelta lloyd groep is a dutch insurance company and financial services pro-vider. the first IFS contract ISS won in the netherlands was with delta lloyd groep in 2004 and the cooperation still benefits both parties today. 250 ISS employees deliver Catering (including fine dining), Cleaning, Security, Support Services, property Support, and pest Control to 5,500 delta lloyd employees in ten locations in the netherlands.
constanza dE lourdEs rojas

annual report 2009 · 5
letteR to ouR StAKeHoldeRS
the financial instability and global recession in 2009 affec- ted our customers and consequently ISS. However, operating in such conditions has confirmed the robustness of our stra- tegy and business model. ISS demonstrated its resilience and ended 2009 with a solid financial performance, successful refinancing and a stronger business that is ready for new growth. our strategy the ISS Way has outlined a sustainable path for the future in which ISS is the leading global Facility Services provider.
the ISS business model, based on our clear customer focus and local management, generated solid performances in most of the more than 50 ISS countries around the globe and is being further strengthened through implementation of the ISS Way strategy.
After years of building our business platform through acqui- sitions, the ISS Way focuses on extracting the full value from our existing platform. Key words in our strategy are there-fore: focus, alignment, excellence centres, best practices and knowledge sharing.
ISS's strategy strengthens sales by clearly defining custom-er segments, services and geographies, and by specifying how best to compete through concentrating resources and consolidating market positions. For example, in 2009, ISS’s Corporate Client organisation signed two new international IFS contracts with edS and Shell. Winning these contracts confirms the group's successful pursuit of its vision to be the leading global Facility Services provider.
Considering the economic turmoil, ISS performed well against its key operational objectives. total group revenue reached dKK 69 billion, up 3% excluding foreign exchange adjustments. the operating margin before other items amounted to 5.6% and in Q3 and Q4 was restored to the levels realised in the same periods in 2008. organic growth was 0.6% with four of the seven regions recording posi-tive organic growth in 2009. We have reduced the number of debtor days by more than one day and achieved a solid cash conversion rate of 96%, which underlines that ISS has a strong and stable cash generation.
the decline in operating margin was recorded mainly in countries most exposed to industrial segments (e.g. auto-motive and manufacturing), particularly in France, germany, Belgium and Spain. Consequently, corrective actions to im-prove our operating performance have been initiated, and in 2009, ISS implemented a fixed cost reduction programme across the entire group.
We achieved an important milestone in July 2009 when we refinanced euR 500 million of the 2010 eMtns by issuing new Senior notes due in 2014. A receivables backed securiti-sation programme has also been launched to refinance the remaining 2010 eMtns.
despite customers downsizing existing contracts, our port- folio-based business continued its satisfactory organic growth due to a satisfactory customer retention rate and cross selling of services. this confirms the strategic direction in the ISS Way strategy, which is focused mainly on delivery of recurring services, i.e. portfolio-based services. our non-portfolio-based business was particularly hard hit, including project work in the construction business, where economic unrest caused customer demand to drop significantly.
ISS is one of the world’s ten largest private employers, with in excess of 485,000 employees in more than 50 countries, ser- ving an estimated 200,000 public and private-sector custom- ers. Implementing an ambitious strategy such as the ISS Way and developing a people business of ISS’s size requires strong management. In 2009, we therefore developed new leadership principles that put customers first and help us re-alise our employees' full potential. We express our gratitude to all our employees for their dedicated work, which is the main reason for our successful performance.
the future composition of the executive group Manage-ment will change as Jørgen lindegaard, will step down as group Ceo at the end of March 2010 and join the Board of directors. the Board wishes to thank Jørgen for his sig-nificant and valuable contribution to ISS. Jørgen will be suc-ceeded by the current group Coo, Jeff gravenhorst.
yours faithfully,
ole Andersen Jørgen lindegaardChairman group Chief executive officer

uSAISS has serviced the uS Airways Center in phoenix, Arizona since the building's opening in 1992. With over 1 million people in attendance every year, the 20,000 seat arena is home to the nBA phoenix Suns and a variety of sports, entertainment and cultural events. ISS event Services maintains the cleaning, conversion (changeover from one event to another), post-game clean-up as well as the porter services for the entire facility including the luxury suite levels.
robErt pErEz

ManageMent's review | annual report 2009 · 7
businEss highlights of thE yEar
2009 was a year marked by the challenges resulting from the global recession, which proved the robustness of the ISS business model and the strategic course as set out in “the ISS Way” strategy introduced in 2008.
Considering the turbulence in the financial markets and the severe economic challenges in the global economy ex-perienced in 2009, ISS’s performance remained sound. ISS focuses on running the facility services for our chosen seg-ments, thereby enabling our customers to focus on their core business. this entails offering a range of business sup-port services within Cleaning, Support Services, property Services, Catering, Security and Facility Management, which can be delivered as a Single-Service, Multi-Service or an in-tegrated service solution (Integrated Facility Services or IFS). these recurring facility services where ISS employees form an integrated part of our customers' daily operations are in ISS classified as portfolio-based services. In addition, ISS also provides project related and other once-only services, such as event catering, construction-based landscaping and con-sulting work in relation to construction of buildings. these non-recurring services are in ISS classified as non-portfolio-based services.
ISS's focus on portfolio-based services ensured that revenue remained at the level realised in 2008 offsetting the decline in the non-portfolio-based services which were hit hard in 2009. the operating margin before other items (referred to as the operating margin) decreased slightly compared with 2008. 2009 was characterised by a relentless focus on cross selling of services, defending margins and implementing ex-tensive turnaround plans and cost-saving initiatives. these efforts ensured that four of the seven ISS regions delivered
operating margins in 2009 that exceeded the level realised in 2008.
Businesses within ISS which were most exposed to non-port-folio-based services and/or to the industrial segments (e.g. automotive and manufacturing) experienced slowdowns, especially France, germany, Belgium and Spain were among the hardest impacted countries. the ISS Way continues to focus on customer needs and to drive the development and delivery of the needed services, includ-ing Integrated Facility Services. this development is based on knowledge and best practice sharing thereby ensuring ef-ficiencies. the ISS Way encourages targeting customer seg-ments, services and geographies that benefit from ISS's value proposition. It also promotes loyalty to our core values and extracts more value from the business platform by harvest-ing the benefits of standardisation across the organisation. As part of this process certain non-core activities were either divested in 2009 or are planned for divestment in 2010.
In the countries most significantly impacted by the economic slow down, corrective actions were taken to adapt to the conditions and improve operating performance, including implementing turnaround plans for affected service types and adaptating the cost structure. In addition, ISS initiated a group-wide cost reduction initiative targeting fixed costs, which complements the ongoing and country-specific turn- around plans. the impact of the actions was evident in the second half of 2009 and was an important reason for restor-ing the operating margin in Q3 and Q4 to the levels realised in the same periods in 2008.
In 2009, though ISS experienced a decline in its non-port- folio-based business, its portfolio-based business continued to
MAnAgeMent'S ReVIeW
PerformanCe highlights
> Revenue growth in the continuing business was 4% at constant
exchange rates. Adverse foreign exchange adjustments and di-
vestments reduced the growth to 0%
> operating margin before other items was 5.6% in 2009
> Cash conversion was maintained at a high level of 96% in 2009
> number of employees surpassed 485,000, making ISS one of the
world's ten largest private employers

8 · annual report 2009 | ManageMent's review
grow organically, despite some customers downsizing exist-ing contracts. the increase in the portfolio-based business underlines the increasing demand for integrated facility ser- vices on a local, regional and international basis and confirms ISS's strategic choice to focus on portfolio-based services.
In 2009, total group revenue amounted to dKK 69.0 billion, up 3%, excluding foreign exchange adjustments, compared with 2008. the organic growth for the year was 0.6%, down from 5.3% in 2008. Four of the seven regions delivered posi-tive organic growth rates in 2009, with Asia and latin Ameri- ca once again achieving double-digit organic growth rates.
ISS's continued focus on cash flow resulted in a reduction of 1.4 debtor days compared with 2008 and a strong cash con-version of 96%, which underlines that ISS has a strong and stable cash generation.
operating profit before other items amounted to dKK 3,874 million in 2009, representing a decrease of 2%, excluding foreign exchange adjustments, compared with 2008. the operating margin for 2009 amounted to 5.6%, down by 0.3 percentage point compared with last year. While many countries delivered operating margins in line with or above the level realised in 2008, this could not off-set the perform-ance in certain countries in Western europe that were par-ticularly impacted by the economic slowdown.
net loss amounted to a loss of dKK 1,629 million and was negatively impacted by certain non-cash expenses. When adjusted for the effect of the following non-cash items, ISS's adjusted net result amounted to approximately dKK 88 mil-lion. Firstly, the net of tax effect of approximately dKK 1,216 million related to goodwill impairment and write-downs.
Secondly, approximately dKK 391 million, net of tax, arising from amortisation and write-down of customer contracts recognised at the time of the acquisition of ISS A/S in May 2005. Finally, non-cash accounting losses and amortisation related to the 2010 and 2014 eMtns of approximately dKK 110 million, net of tax. Furthermore, the adjusted net result of dKK 88 million includes expenses of dKK 426 million re-lated to restructuring projects, comprising mainly closure of certain parts of business units or divisions as well as changes in the organisational setup and other efficiency improve-ments.
France suffered most in 2009, due mainly to its high expo-sure to the industrial and manufacturing segments as well as a relatively high part of non-portfolio-based business par-ticular within the landscaping business, but also due to the organisational setup of ISS in France, which was not aligned according to the ISS Way strategy. Revenue declined from dKK 9.3 billion in 2008 to dKK 8.9 billion in 2009, while the operating profit before other items dropped by dKK 233 mil-lion or 41%. As a result, the operating margin declined from 6.1% in 2008 to 3.8% in 2009. this implies, that if France had delivered the same operating margin as in 2008, the opera- ting margin for the group would have been 5.9%, or the same level as in 2008. Several actions were taken in 2009 to turn around the operations in France, including the appoint-ment of a new regional management team, a new local man-agement team, a reorganised organisational setup covering several business units as well as head office, and planned di-vestments of non-core business activities. While a turnaround of an operation the size of ISS in France will take time, these initiatives and the devoted attention from both the group and regional management teams during 2009 will help en-suring that ISS in France strengthens its performance.
2009 revenue by regions
NORDIC 24%
WESTERN EUROPE 56%
EASTERN EUROPE 2%
ASIA 6%
LATIN AMERICA 3%
NORTH AMERICA 4%
PACIFIC 5%

ManageMent's review | annual report 2009 · 9
In July 2009, ISS successfully issued euR 525 million of new Senior notes due in 2014 (the “notes”). the notes were issued through ISS Financing plc, a newly formed special purpose vehicle. euR 500 million of the proceeds was used to settle part of the euR 850 million Medium term notes due to ma-ture in September 2010 (the “2010 eMtns”) plus accrued in-terest. the remaining part of the 2010 eMtns is expected to be settled via a receivables-backed securitisation programme that was launched in five countries in 2009 and will continue to be rolled out to additional countries in 2010.
the global Corporate Client organisation followed up on the Hp contract win in 2008 by entering into two new interna-tional IFS contracts with edS, a global It company, and Shell. the contract with edS covers 28 countries in europe, Middle east, Asia, pacific and Africa. the Shell contract covers Facility Management and substantial self-delivery functions in eight countries in Asia and pacific covering up to 33 million square metres. these contract wins confirm ISS’s strategic direction, as a number of global customers perceive ISS as one of the only companies that can deliver services in an integrated way globally. the focus on IFS contracts with large multinational or global clients is fully in line with our corporate vision of being the leading global Facility Services provider.
At the end of the year, ISS had more than 485,000 employees worldwide. therefore, since year-end 2008, a net increase of roughly 13,000 employees joined the company as a result of either organic growth or through acquisitions.
rEgional dEvElopmEnt
the “ISS world” consists of seven regions: nordic, Western europe, eastern europe, Asia, latin America, north America and pacific. the key principle for the regional grouping is that those operations share market conditions and culture to the largest possible extent. the grouping also reflects the differences between developed regions and emerging re-gions.
nordic the nordic region, comprising denmark, Finland, green-land, Iceland, norway and Sweden, is among the most de-veloped. ISS is the leader within the facility services market throughout the region.
In early 2009, the nordic region launched a strategy fo-cused on growing organically through service delivery in individual countries combined with sales of services across the region. A nordic sales organisation was established that going forward will focus mainly on large complex custom-ers within certain segments in the nordic region. the aim is to match customers’ geographical footprints and deliver services across borders. In addition, the strategy focuses on improving efficiency through increased standardisation and harmonisation. during the year, the region has also re-evalu- ated its service capabilities in light of the ISS Way strate-gy and as a result will be considering if further capabilities should be acquired, divested or grown organically.
In 2009, revenue in the nordic region grew organically by 1% with Sweden and Finland contributing most. despite the positive organic growth, revenue decreased by 4% from dKK 17,071 million in 2008 to dKK 16,367 million in 2009
DENMARK 23%
FINLAND 22%
NORWAY 32%
SWEDEN 22%
OTHER 1%
AUSTRIA 4%
BELGIUM 8%
FRANCE 23%
GERMANY 6%
ISRAEL 4%
NETHERLANDS 9%
SPAIN 12%
SWITZERLAND 7%
TURKEY 4%
UNITED KINGDOM 18%
OTHER 5%
2009 revenue nordiC 2009 revenue western euroPe
10 · annual report 2009 | ManageMent's review
due mainly to currency adjustments which reduced revenue for the region by approximately 4%, and stemmed mainly from depreciation of noK and SeK against dKK. Further-more, acquisitions, net, decreased revenue by 1% following the divestment of certain non-core business units.
operating profit before other items in the nordic region increased to dKK 1,219 million from dKK 1,189 million in 2008. the operating margin in the region increased to 7.4% in 2009, compared with 7.0% in 2008. this was due main-ly to operating margin increases in norway, denmark and Finland that were partly offset by slight margin decreases in Sweden and Iceland. this was due primarily to a strong response to the economic downturn, including adaptation of cost structures, an increased focus on customer retention and the divestment of certain non-core business units.
Western Europethe Western european region comprises Austria, Belgium & luxembourg, France, germany, greece, Ireland, Israel, Italy, the netherlands, portugal, Spain, Switzerland, turkey and the united Kingdom.
the markets included in the Western european region are generally characterised as developed markets, and the re-gion has been able to partly offset the economic downturn experienced in certain countries by focusing more clearly on implementing the ISS Way strategy. this includes increased attention to the commercial and sales planning process and fully utilising our strong delivery model to ensure that the operational processes and concepts are in place to support our chosen customer segments.
In 2009, revenue in the Western european region decreased by 2% from dKK 39,337 million in 2008 to dKK 38,632 mil-lion. organic growth was negative by 1%, while currency adjustments reduced revenue for the region by approxi-mately 3%, and stemmed mainly from depreciation of gBp against dKK. Acquisitions, net, increased revenue by ap-proximately 2%. the organic growth rates decreased as a number of countries in the region are exposed to the indu- strial segments (e.g. automotive and manufacturing) which were negatively impacted by the global economic slow down. this resulted in some customers downsizing certain portfolio-based services as well as a significant drop in non-portfolio based services such as projects and once-only jobs within the construction-based industries (e.g. construction of buildings and grounds). the main contributors, France, Spain, Austria and the netherlands, all realised negative or-ganic growth rates. this negative effect was partly offset by turkey, greece and Italy all delivering double-digit organic growth rates.
operating profit before other items in Western europe amounted to dKK 2,056 million in 2009, down from dKK 2,356 million in 2008. the operating margin of 5.3% was 0.7 percentage-point lower compared with 2008. the decline in operating margin was due primarily to France and partly due to germany and Spain. In France the operating margin de-creased from 6.1% in 2008 to 3.8% in 2009, leading to a dKK 233 million decline in operating profit. In France, as well as a number of other countries in the region, ISS is negatively impacted by the global economic slowdown which especial-ly impacted the european industrial segments in particular (e.g. automotive and manufacturing) as well as reduced the demand for non-portfolio-based services. this reduced ISS's revenue and operating profit in countries with significant exposure to these industries. As a consequence of the per-formance gaps, turnaround plans were initiated to increase efficiencies and restore profitability. organisational setups and business processes were changed, headcount reduced to adjust to the lower customer demand and non-core business units were divested. Finally, ISS has continuously adapted the cost structure in the affected countries to suit the changed market conditions. despite the economic downturn, Israel, the netherlands, Switzerland, portugal, Italy and the united Kingdom all realised higher margins than in 2008.
Eastern Europethe eastern european region comprises Croatia, the Czech Republic, estonia, Hungary, poland, Romania, Russia, Slova-kia and Slovenia.
the eastern european region, which has delivered double digit growth rates during previous years, experienced nega-tive organic growth of 2% in 2009 caused by a strong eco-nomic recession climate throughout the region. the major-ity of the decline can be attributed to a substantial decrease in demand for non-portfolio services such as projects and once-only jobs, whereas the portfolio business declined only slightly. In 2009, our focus was on strict contract manage-ment in response to many customers requesting reduced prices and scope of services. the consolidation and transfor-mation of ISS's business platform and services in the eastern european region were also stepped up substantially in line with the ISS Way strategy to ensure a strong basis for future growth.
Revenue in eastern europe decreased by 6% to dKK 1,561 million in 2009. organic growth was negative by 2%, and stemmed mainly from the Czech Republic, Slovakia and Slov-enia. this was partly offset by double digit organic growth rates in Romania and poland. Currency adjustments reduced revenue for the region by approximately 6%, as a result of depreciation of several eastern european currencies com-
ManageMent's review | annual report 2009 · 11
pared with dKK. Acquisitions, net, increased revenue by ap-proximately 2%.
operating profit before other items in eastern europe de-creased by 15% to dKK 106 million in 2009. the operating margin was 6.8% in 2009, 0.6 percentage point lower than in 2008. this was due mainly to operating margin decreases in Slovakia, the Czech Republic, Slovenia and Hungary where ISS has been negatively impacted by the effect of the gene- ral slowdown in the eastern european economies, which has caused demand for non-portfolio services in particular to decline.
asia the Asian region comprises Brunei, China, Hong Kong, In-dia, Indonesia, Japan, Malaysia, the philippines, Singapore, taiwan and thailand.
Asia is the fastest-growing region in the ISS group. Hong Kong and Singapore account for over 50% of the region's revenue. double-digit organic growth in the region secured ISS a stronger market share and targeted acquisitions ex-panded the service offering in these countries. In 2009, six acquisitions were completed, adding competencies within catering, security and pest control services.
Revenue in Asia increased by 31% from dKK 3,147 million in 2008 to dKK 4,120 million in 2009. the increase was driven by organic growth of 15% and acquisition-driven growth of 13% as well as a positive impact of 3% from currency ad-justments. All countries in the region, except the philippines and Malaysia, contributed to the organic growth. Indonesia, Hong Kong, Singapore, taiwan, India and Brunei all deliver- ed double-digit organic growth rates.
operating profit before other items in Asia increased by 47% to dKK 308 million in 2009 compared with dKK 210 million in 2008. the operating margin increased to 7.5% compared with 6.7% in 2008. All countries in the region, with the exception of the philippines, thailand, taiwan and Malaysia generated higher margins than in 2008.
latin americathe latin American region comprises Argentina, Brazil, Chile, Mexico and uruguay.
ISS has a geographical presence in the region, which is well suited for exploiting the growth potential that categorises latin America as one of the world’s emerging markets. the market for complex Multi-Service and IFS solutions in latin America is growing, and ISS continued to focus on consoli-dating and expanding its service mix and especially FM capa-
bilities to drive the request for service delivery through IFS.
Revenue in latin America increased by 10% from dKK 1,890 million in 2008 to dKK 2,077 million in 2009. organic growth was 12% and growth from acquisitions, net, amounted to 5%. All countries in the region delivered double-digit orga- nic growth rates except for Brazil. Currency adjustments de-creased the region's revenue by approximately 7%.
operating profit before other items in latin America in-creased by 20% to dKK 131 million in 2009. the operating margin was 6.3%, compared with 5.8% in 2008. All coun-tries in the region realised higher year-on-year operating margins in 2009.
north americathe north American region comprises the uSA, which ISS entered in 2007, and Canada which ISS entered through a greenfield establishment in 2009 via its uS operations.
outsourcing of facility services is already well accepted by uS corporations. through two acquisitions in the uSA, ISS has achieved good geographical coverage in several of the economical growth areas and is continuing to focus on en-hancing its geographical footprint to grow the business and gain critical mass where it has yet to be achieved. Further-more, IFS sales represent a significant opportunity for ISS, and a dedicated team is now in place to capitalise on the market opportunities.
Revenue in north America increased by 18% to dKK 2,515 million in 2009, with growth from acquisitions contributing 13% that related primarily to the acquisition of BgM Indu- stries in April 2008, which added approximately dKK 510 million in annual revenue. Currency adjustments increased revenue from the region by approximately 5%. organic growth was negative by 1%.
operating profit before other items in north America amounted to dKK 134 million in 2009 compared with dKK 128 million in 2008. the operating margin in 2009 was 5.3% compared with 6.0% in 2008, a decrease caused mainly by lower demand for non-portfolio services.
pacificthe pacific region comprises Australia, which ISS entered in 2002 and new Zealand, which ISS entered in 2005. ISS in Australia delivers more than 90% of the revenue in this region.
2009 was a year of consolidation and alignment with a fo-cus on margin improvement, acquisition integration and re-

12 · annual report 2009 | ManageMent's review
gionalisation projects in the pacific region. In Australia, ISS won a number of important contracts that form a platform for growth in 2010. Furthermore, ISS implemented a region-alisation project to increase service efficiency and create a more customer-oriented operation, as this will ensure that it sells and delivers IFS locally in the states and territories of Australia. In new Zealand, ISS spent 2009 fully integrating the acquired manned guarding and mobile patrolling activi-ties acquired from Chubb in december 2008, and has now secured a nationwide coverage in the security market. Revenue in the pacific region increased by 4% from dKK 3,614 million in 2008 to dKK 3,768 million in 2009. this growth was driven primarily by 6% growth from acquisi-tions. organic growth was 0%, while currency adjustments reduced revenue by approximately 2%.
operating profit before other items in the pacific region amounted to dKK 259 million in 2009 compared with dKK 230 million in 2008. the region's operating margin amount-ed to 6.9% in 2009 compared with 6.4% in 2008, in line with expectations.
businEss dEvElopmEnt in 2009
during 2009, in line with the ISS Way strategy, ISS enhanced its response to customer needs and targeted customer seg-ments that are most receptive to ISS's value propositions. ISS also focused on securing service excellence in suitable services that are most relevant for integration and thereby consistent with ISS's IFS strategy.
cleaningISS’s Cleaning offering encompasses a range of services with- in daily office cleaning, hospital cleaning, food hygiene, in-dustrial cleaning, cleaning in transport systems, dust control, washroom services and specialised cleaning e.g. of windows, communication equipment etc.
In 2009, Cleaning remained ISS’s largest business area, re- presenting 52% of total group revenue, or dKK 36.0 billion compared with 53% in 2008. In line with the strategy to broaden the service platform, Cleaning's relative share of ISS's total revenue was continuously diluted, while the re- venue share from Catering and Security in particular con-tinued to increase. In 2009, Cleaning, which is characterised by recurring portfolio-based services, was impacted by re-ductions in volume on contracts, price pressure and low in-cremental spendings by customers. this negative effect was offset by increased efficiency on contracts and cross-selling of other services to existing customers.
property servicesISS’s property Services offering encompasses building main-tenance, technical maintenance, landscaping, pest control and damage control.
In 2009, revenue from property Services amounted to dKK 14.5 billion, representing 21% of total group revenue com-pared with 23% in 2008. In 2009, property Services which encompasses non-portfolio-based services was negatively impacted by the downturn in the construction-based indus-tries (e.g. building and grounds construction) leading to few-er building installation projects and landscaping projects.
develoPment in revenue by serviCe
20082009
CLEANING 53%
CATERING 8%
PROPERTY SERVICES 23%
SUPPORT SERVICES 6%
SECURITY 6%
FACILITY MANAGEMENT 4%
CLEANING 52%
CATERING 9%
PROPERTY SERVICES 21%
SUPPORT SERVICES 7%
SECURITY 7%
FACILITY MANAGEMENT 4%

ManageMent's review | annual report 2009 · 13
support servicesISS’s Support Services offering encompasses the operation of receptions, internal mail handling, scanning and other office logistics, call centres, manpower supply and outplace-ment services.
In 2009, Support Services accounted for approximately 7% of total group revenue, up 1 percentage point compared with 2008. In absolute figures, revenue in Support Services increased from dKK 4.1 billion in 2008 to dKK 5.0 billion in 2009. In 2009, Support Services was positively impacted by higher demand for outplacement services and cross selling of services to mainly Cleaning customers offset by lower de-mand for manpower supply services.
cateringISS’s Catering offering includes in-house restaurants, cater-ing services e.g. for meetings and events, executive dining and coffee solutions.
Catering accounted for about 9% of total group revenue in 2009, or dKK 6.2 billion, up by dKK 0.5 billion or 1 per-centage point compared with last year. In 2009, Catering was positively impacted by completion of three acquisitions within Catering in Asia which added approximately dKK 0.1 billion in annual revenue as well as the full year effect of ac-quisitions within Catering completed in 2008. Furthermore, cross selling of Catering services to existing customers had a positive effect on revenue in 2009 while revenue from non-portfolio-based services within Catering (e.g. event cater-ing) was negatively impacted by the downturn in the global economy.
security ISS’s Security offering includes primarily manned guarding, access control and patrolling.
Annual revenue amounted to dKK 4.7 billion, equivalent to 7% of total revenue in 2009, 1 percentage point up from 2008. ISS's service offering within Security was strength-ened in 2009 through six acquisitions spanning five coun-tries, which added approximately dKK 0.4 billion in annual revenue.
facility management (fm)ISS’s Facility Management offering includes on-site manage-ment of facility services, change management, space man-agement and consulting.
In 2009, Facility Management generated revenue of dKK 2.6 billion, equivalent to 4% of total revenue, the same relative share as the year before.
acquisitions
Following several years with a high number of acquisitions, ISS has the strategically required representation in services and geographies and therefore slowed down the pace of acquisitions in 2009. Instead, ISS increased its focus on in-tegrating acquired companies and harvesting synergies and decided not to extend or renew its acquisition facilities, which expired in May 2009.
the acquisition activities had three primary objectives in 2009: firstly to expand ISS's presence in emerging markets, secondly to continue building up the Security services plat-form, and thirdly to gain critical mass in the uSA. during 2009, ISS completed 22 acquisitions spanning 15 countries. Five of these acquisitions had annualised revenue of more than dKK 100 million. With the acquisitions, ISS gained an-nualised revenue of approximately dKK 1 billion and more than 14,000 employees.
the acquisitions completed in 2009 were carried out at an average multiple of 5.8x eBItA compared with an average multiple of 7.6x eBItA for acquisitions completed in 2008.
In 2009, ISS completed the following large strategic acquisi-tions:
mettek – turkeyIn January, ISS expanded its business in the turkish market through the acquisition of Mettek, a well recognised Facility Services provider in turkey. Mettek is a bolt-on acquisition that will ensure critical mass within Cleaning and Security for ISS in Istanbul and the surrounding region. the acquisi-tion of Mettek will enable ISS in turkey to further target specific customers and segments, thereby enabling a bet-ter platform for cross-selling and IFS sales. the acquisition added approximately dKK 137 million in annual revenue and 2,178 employees.
central property services – usaIn January, ISS acquired Central property Services (CpS), the largest commercial cleaning company in the pittsburgh, pennsylvania metropolitan area. the acquisition of CpS sup-ports ISS’s strategy in the uSA on three vital dimensions: geography, services and customers. CpS increased ISS’s criti-cal mass in pittsburgh as well as the volume in the Clean-ing and Security service areas. the acquisition also in-creased the volume in the office and education customer segments. the acquisition added approximately dKK 182 million in annual revenue and 917 employees.
14 · annual report 2009 | ManageMent's review
sunparking – indonesiaIn February, ISS expanded its Indonesian operations into the growing security business segment by acquiring Sunparking, the second largest car park management service provider in Indonesia. ISS in Indonesia has achieved a competitive ad-vantage through the acquisition, as ISS is the only facility services provider in the Indonesian market offering car park management services. this enhanced ISS's service platform in Indonesia and improved its scope for winning IFS con-tracts. the acquisition added approximately dKK 109 million in annual revenue and 5,000 employees.
chubb – irelandIn May, ISS acquired the manned guarding activities from the international security provider Chubb in Ireland. to-gether with the existing Security business, the acquired activities provide ISS in Ireland with nationwide coverage within the security segment. Furthermore, acquiring Chubb has significantly increased ISS’s size and presence in Ireland and supports ISS as a national Multi-Service provider. the acquisition added approximately dKK 134 million in annual revenue and 635 employees.
divEstmEnts
From 2004-2009, ISS completed over 450 acquisitions rang-ing from small bolt-on acquisitions to platform-developing acquisitions and entries into new geographies. the vast ma-jority of these acquisitions are already fully integrated and performing as planned, and their positive impact may be further enhanced as they become part of the ISS Way stra- tegy process. As part of this process, the strategic rationale behind selected acquisitions was reviewed in 2009, which has led to the identification and evaluation of certain activi-ties that are either non-core to the ISS Way strategy or lack critical mass.
Some of these activities were either divested in 2009 or are planned for divestment in 2010. this includes the completed divestment of project-based landscaping activities in Swe-den, contact centres in the netherlands and laundry activi-ties in norway and Sweden. In addition, certain non-core activities in France, Spain and norway that are expected to be divested in 2010 have been classified as held for sale at 31 december 2009. the divestments completed in 2009 and the businesses classified as held for sale on 31 december 2009 resulted in non-cash charges recognised in the income state-ment of dKK 983 million before tax, mainly related to write-down of goodwill and customer contracts.
financing
ISS has committed long-term financing in place, part of which will be refinanced in the second half of 2010. In July 2009, ISS successfully issued euR 525 million of new Senior notes due 2014. the notes were issued through ISS Finan- cing plc, a newly formed special purpose vehicle, and are list-ed on the luxembourg Stock exchange. the proceeds from these notes have been lent on to ISS global and were used to settle the completed tender offer for euR 500 million of the 2010 eMtns plus accrued interest. the 2010 eMtns were acquired at nominal value but had a carrying amount lower than their nominal value due to the fair-value adjustment made in connection with ISS Holding A/S’s acquisition of ISS A/S. Consequently, an accounting loss of dKK 59 million was recognised in 2009.
A receivables-backed securitisation programme was launched in five major countries in the second half of 2009 and addi-tional countries are intended for inclusion in the programme in 2010. the proceeds from the securitisation programme will be used to refinance the remaining euR 350 million of the eMtns due in 2010. After the reporting date, the group completed a tender offer for an additional euR 150 million of the outstanding notes, leaving euR 200 million in notes for refinancing before maturity in September 2010.
managEmEnt changEs
on 24 May 2009, Marcus Brennecke joined as a new member of the Board of directors of ISS.
on 9 december 2009, Casper von Koskull joined as a new member of the Board of directors of ISS, replacing Sanjay patel who stepped down from the Board.
subsEquEnt EvEnts
on 22 January 2010, ISS global completed the tender offer for euR 150 million of the outstanding 2010 eMtns plus ac-crued interest. the notes were acquired at a purchase price of euR 1,020 per euR 1,000 principal amount and resulted in an accounting loss of approximately dKK 30 million, which has been recognised in 2010. the accounting loss results pri-marily from the purchase price being above nominal value, and also from the carrying amount being below nominal value due to the fair value adjustment made in connection with ISS Holding A/S's acquisition of ISS A/S.

ManageMent's review | annual report 2009 · 15
on 2 February 2010, ISS announced that Jørgen lindegaard will step down as group Ceo as of 31 March 2010 and that the current group Coo, Jeff gravenhorst, will take over the responsibility as group Ceo on 1 April 2010.
divestments completed subsequent to 31 december 2009 are listed in note 12, Acquisitions and divestements of busi-nesses.
With the exception of the above and the events described in this Annual Report, ISS is not aware of events subsequent to 31 december 2009 that are expected to have a material impact on ISS’s financial position.
outlook
the outlook set out below should be read in conjunction with “Forward-looking statements” (see below) and the de-scription of Risk management on pages 38-39 of this report.
the continued successful implementation of the ISS Way strategy is the foundation for robust and profitable growth in the years to come. the ISS Way is oriented around a number of key strategic priorities, especially focus and align-ment. In 2010, the initiatives include the continued deve- lopment of value propositions tailored to specific customer segments, development of services within which we deliver service excellence and strengthening of our Integrated Faci- lity Service capabilities. Furthermore, we will pursue stand-ardisation, best-practice and knowledge sharing across the organisation, while increasing our focus on group-wide sales driven by a central sales and commercial team that includes
the global Corporate Client organisation. Simultaneously, ISS will maintain its focus on key operational objectives (i) cash flow; (ii) operating margin; and (iii) profitable organic growth.
Some of ISS's customers have been severely affected by the global economic slowdown. during 2009, ISS actively worked with those customers to help them adjust service levels. this has resulted in reduced service levels in a number of contracts and much less non-portfolio work being carried out. As a result, customer retention was satisfactory in 2009, though demand for ISS's services depends to some extent on an improved economic climate.
ISS expects some improvements in the economic climate in its main markets in 2010, which combined with the efforts carried out in 2009, are expected to lead to an increased de-mand for services provided by ISS. Consequently, at the pre-vailing currency rates, ISS expects revenue to grow organi-cally at an increasing pace throughout 2010. during the last two quarters of 2009, ISS also restored profitability to the levels realised in the last two quarters of 2008. Combined with the generally flexible cost base, the extensive restruc-turing initiatives and the group-wide fixed cost-reduction initiative carried out in 2009, ISS expects its operating mar-gin for 2010 to be slightly above the level realised in 2009.
ISS will continue to prioritise cash flow and a healthy ba- lance sheet. We will focus on managing the absolute level of debt supported by significantly less acquisition spending and continued high cash conversion. ISS expects to make only a small number of acquisitions in the short term, prima-rily in the growth regions of Asia and latin America.
forward-looking statements
this report may contain forward-looking statements. Statements herein, other than statements of historical fact, regarding future events
or prospects, are forward-looking statements. the words ‘‘may’’, “will”, “should”, ‘‘expect’’, ‘‘anticipate’’, ‘‘believe’’, ‘‘estimate’’, ‘‘plan’’,
“predict”, ‘‘intend’’ or variations of these words, as well as other statements regarding matters that are not historical fact or regarding
future events or prospects, constitute forward-looking statements. ISS has based these forward-looking statements on its current views
with respect to future events and financial performance. these views involve a number of risks and uncertainties, that could cause actual
results to differ materially from those predicted in the forward-looking statements and from the past performance of ISS. Although ISS
believes that the estimates and projections reflected in the forward-looking statements are reasonable, they may prove materially incor-
rect, and actual results may materially differ, e.g. as the result of risks related to the facility service industry in general or ISS in particular
including those described in this report and other information made available by ISS.
As a result, you should not rely on these forward-looking statements. ISS undertakes no obligation to update or revise any forward-look-
ing statements, whether as a result of new information, future events or otherwise, except to the extent required by law.

jorgE manuEl Emidio EvangElista
maria hElEna jEsus fErrEira silva
josé carlos jorgE dos santos costEira
poRtugAlFertagus is the first private railways operator in portugal and it transports 80,000 passengers daily. Metro transportes do Sul (MtS) is a modern, com-fortable and high-quality Metro that runs in south of tejo River, lisbon. Both companies are part of the Barraqueiro group, a leading portuguese trans-port company. Fertagus and MtS have selected ISS as their facility partner in portugal and ISS delivers an Integrated Facility Services solution including: Cleaning, Washroom Services, landscaping, technical Maintenance, power Sub-Stations (25KV), and pest Control to all Fertagus and MtS stations, trains and headquarters.

country overview | annual report 2009 · 17
CountRy oVeRVIeW2009 2008
dkk million dkk million
countrytotal
revenue
operating profit
before other items
operating margin %
organic growth %
number of employees
at year-endtotal
revenue
operating profit
before other items
operating margin %
organic growth %
number of employees
at year-end
France 8,879 337 3.8 (6) 39,329 9,336 569 6.1 (0) 41,284 united Kingdom 6,948 477 6.9 2 41,881 7,565 511 6.8 9 42,848 norway 5,246 416 7.9 (2) 13,773 5,683 394 6.9 7 13,114 Spain 4,534 244 5.4 (7) 28,775 4,603 287 6.2 6 28,855 denmark 3,731 259 6.9 (0) 9,194 3,702 232 6.3 0 11,073 Finland 3,678 304 8.3 4 11,434 3,517 285 8.1 4 11,842 Sweden 3,536 228 6.4 6 9,491 3,920 257 6.6 6 10,276 netherlands 3,420 128 3.7 (2) 18,511 3,540 103 2.9 (3) 20,175 Australia 3,419 235 6.9 (0) 12,770 3,381 220 6.5 4 13,763 Belgium and luxembourg 3,190 194 6.1 2 10,823 3,094 220 7.1 3 11,192 Switzerland 2,643 226 8.5 2 10,522 2,463 192 7.8 8 10,639 uSA 2,514 134 5.3 (1) 14,943 2,131 128 6.0 6 14,696 germany 2,417 43 1.8 0 11,220 2,406 84 3.5 8 11,968 turkey 1,459 103 7.1 13 21,047 1,221 94 7.7 20 17,799 Israel 1,411 83 5.9 1 11,518 1,454 73 5.0 11 11,723 Austria 1,387 76 5.5 (4) 6,698 1,662 94 5.7 0 7,254 Hong Kong 1,216 100 8.2 12 14,532 968 73 7.5 15 12,897 Brazil 1,069 64 6.0 9 17,588 967 52 5.4 12 16,235 Singapore 858 59 6.9 15 6,786 702 47 6.7 19 6,503 greece 818 52 6.4 12 5,250 712 50 7.0 22 4,942 Ireland 596 24 4.1 8 3,067 471 25 5.2 4 2,649 Indonesia 595 58 9.8 38 47,660 336 33 9.8 38 35,293 portugal 551 43 7.7 (3) 7,260 549 40 7.3 5 8,425 thailand 514 36 6.9 5 25,186 363 25 7.0 11 23,431 Czech Republic 422 29 6.8 (8) 4,518 484 40 8.3 3 6,211 Mexico 403 27 6.7 19 14,155 393 23 5.9 12 12,552 Italy 375 25 6.7 10 1,258 262 17 6.4 6 1,046 new Zealand 349 24 6.9 8 2,284 234 10 4.3 10 3,063 Chile 317 23 7.1 13 9,270 267 19 7.1 29 8,403 Slovakia 293 14 4.9 (8) 4,435 320 23 7.2 (0) 5,082 India 271 23 8.6 18 16,132 194 10 5.2 74 12,634 China 241 11 4.7 7 10,653 211 12 5.6 24 10,526 Argentina 227 13 5.5 15 3,988 217 12 5.4 32 3,549 taiwan 217 15 7.1 19 2,193 181 16 9.0 5 2,041 poland 191 9 4.8 12 2,639 186 9 4.9 17 2,529 Slovenia 153 6 4.0 (9) 1,204 164 9 5.5 13 1,269 Romania 150 29 19.5 26 2,330 137 24 17.4 23 2,734 Hungary 144 5 3.5 6 1,894 141 8 5.4 24 1,882 estonia 130 14 10.7 (5) 1,538 137 8 6.1 9 1,793 greenland 100 7 7.2 (5) 252 106 8 7.1 16 306 philippines 79 (2) (2.9) (16) 2,523 96 3 3.5 15 2,564 Iceland 76 6 7.3 (3) 670 134 10 7.6 14 739 Malaysia 68 4 6.4 (7) 1,961 73 5 7.4 9 2,246 uruguay 62 5 7.8 20 1,151 46 3 7.4 61 1,277 Russia 51 1 2.1 (3) 716 64 3 4.0 36 663 Japan 41 2 5.1 534 44 6 (0) (1.4) - 2 Croatia 27 (1) (2.5) (8) 339 30 (0) (0.7) 21 419 Brunei 20 5 22.7 15 330 17 3 15.3 7 293 South Africa 5 1 19.1 - - - - - - - Canada 1 0 7.0 - 2 - - - - - Faroe Islands - - - - - 9 0 1.0 15 - Regional cost / eliminations (2) (5) (1) (17)
total regions 69,040 4,213 6.1 1 485,737 68,853 4,346 6.3 5 472,699
Corporate functions / eliminations (36) (339) (0.5) - 110 (24) (285) (0.4) - 102
total 69,004 3,874 5.6 1 485,847 68,829 4,061 5.9 5 472,801

fathia mofti belgium
gavin mcdErmott ireland
dErrick murray ireland
HeWlett-pACKARd In 2007, ISS implemented a global Corporate Client organisation in order to win IFS contracts with large multinational or global clients. As a direct result, in March 2008, ISS entered into an international Integrated Facility Services contract with Hp, a leading international technology solutions company. this contract covers more than 45 countries in europe, the Middle east, Asia and Africa and is the largest contract in ISS history as well as a significant milestone in ISS’s pursuit of its corporate vision of being the leading global Facility Services provider.

abdEl karim bouhoudanE belgium
larry soyEgE ireland
mátyás gErE and istuán kovács hungary
maria kErEksné csonka hungary
20 · annual report 2009 | financial review
FInAnCIAl ReVIeW
incomE statEmEnt
revenueRevenue amounted to dKK 69,004 million representing year-on-year revenue growth of 3%, excluding foreign exchange adjustments. Revenue growth was driven by 1% organic growth and 3% growth from acquisitions. this was partly offset by divestments of 1% and adverse currency exchange-rate movements of 3%. Four of seven regions delivered posi-tive organic growth rates, with Asia and latin America once again delivering double-digit organic growth rates.
staff costsStaff costs increased by dKK 625 million, or 1%, from dKK 44,156 million in 2008 to dKK 44,781 million in 2009. this increase was due primarily to an increase in the overall number of employees as a result of acquisitions and organic growth that were partly offset by currency exchange-rate movements. Staff costs as a percentage of revenue increased from 64.2% in 2008 to 64.9% in 2009.
cost of sales Cost of sales decreased by dKK 90 million, or 1%, from dKK 6,134 million in 2008 to dKK 6,044 million in 2009. Cost of sales as a percentage of revenue amounted to 8.8% in 2009, a slight decrease compared with 8.9% in 2008.
other operating expensesother operating expenses decreased by dKK 172 million, or 1%, from dKK 13,609 million in 2008 to dKK 13,437 million in 2009. other operating expenses as a percentage of revenue totalled 19.5%, down slightly compared with 19.8% in 2008.
depreciation and amortisationdepreciation and amortisation excluding amortisation of brands and customer contract portfolios and related cus-tomer relationships (customer contracts) decreased by dKK 1 million, from dKK 869 million in 2008 to dKK 868 million in 2009, which as a percentage of revenue was unchanged at 1.3% compared with 2008.
operating profit before other items operating profit before other items amounted to dKK 3,874 million in 2009 representing a decrease of 2%, excluding foreign exchange adjustments, compared with 2008. Includ-ing the negative effect from foreign exchange adjustments, operating profit before other items decreased by dKK 187
million, or 5%, from dKK 4,061 million in 2008 to dKK 3,874 million in 2009. operating profit before other items as a per-centage of revenue, i.e. the operating margin before other items, was 5.6% in 2009 compared with 5.9% in 2008. this was due mainly to lower earnings in France, germany and Spain. Corporate overhead costs increased from 0.4% of re- venue in 2008 to 0.5% in 2009.
other income and expenses, netOther income and expenses, net, represented a net expense of dKK 551 million in 2009 compared with a net expense of dKK 242 million in 2008. this related primarily to restructur-ing projects amounting to dKK 426 million in France, ger-many, Spain, Australia, Belgium, Finland, the united King-dom and denmark, as well as write-down attributable to businesses classified as held for sale on 31 december 2009 totalling dKK 159 million. the restructuring projects com-prised mainly closure of certain parts of business units or divisions as well as changes in the organisational setup and other efficiency improvements. Write-downs attributable to businesses classified as held for sale related mainly to net assets other than intangibles of certain non-core activities in France that are expected to be sold in 2010. other income and expenses included costs related to divestments of non-strategic landscaping activities in norway and Sweden as well as the call centre activities in the netherlands and re-dundancy and severance payments relating to senior man-agement changes. this was partly offset by a gain on divest-ments relating to the sale of non-core laundry activities in Sweden and norway that amounted to dKK 102 million.
other income and expenses, net, in 2008 represented a net expense of dKK 242 million and included losses on divest-ments of non-core activities, including the energy activities in France as well as the non-strategic temporary staffing and landscaping businesses in Austria and subsequent re-structuring of the organisational setups in both France and Austria. Furthermore, other income and expenses included costs related to a restructuring project in the netherlands comprising changes in management teams, organisational setups and business units, a relocation project in norway as well as redundancy and severance payment relating to se- nior management changes.
integration costsIntegration costs decreased by dKK 20 million, or 30%, from dKK 66 million in 2008 to dKK 46 million in 2009. the de-

financial review | annual report 2009 · 21
1) nordic comprises denmark, the Faroe Islands, Finland, greenland, Iceland, norway and Sweden.2) Western europe comprises Austria, Belgium & luxembourg, France, germany, greece, Ireland, Israel, Italy, the netherlands, portugal, South Africa, Spain, Switzerland, turkey and the united Kingdom.3) eastern europe comprises Croatia, the Czech Republic, estonia, Hungary, poland, Romania, Russia, Slovakia and Slovenia.4) Asia comprises Brunei, China, Hong Kong, India, Indonesia, Japan, Malaysia, the philippines, Singapore, taiwan and thailand.5) latin America comprises Argentina, Brazil, Chile, Mexico and uruguay.6) north America comprises Canada and the uSA.7) pacific comprises Australia and new Zealand.
revenueoperating profit
before other itemsoperating margin before
other items
dkk millions dkk millions
2009 2008 Change 2009 2008 Change 2009 2008
nordic 1) 16,367 17,071 (4)% 1,219 1,189 3 % 7.4 % 7.0 % Western europe 2) 38,632 39,337 (2)% 2,056 2,356 (13)% 5.3 % 6.0 % eastern europe 3) 1,561 1,663 (6)% 106 124 (15)% 6.8 % 7.4 % Asia 4) 4,120 3,147 31 % 308 210 47 % 7.5 % 6.7 % latin America 5) 2,077 1,890 10 % 131 109 20 % 6.3 % 5.8 % north America 6) 2,515 2,131 18 % 134 128 5 % 5.3 % 6.0 % pacific 7) 3,768 3,614 4 % 259 230 13 % 6.9 % 6.4 % Corporate / eliminations (36) (24) (339) (285) 19 % (0.5)% (0.4) %
total 69,004 68,829 0 % 3,874 4,061 (5)% 5.6 % 5.9 %
oPerating results
1) See page 135 for a definition of organic growth.
revenue growth 2009
revenue growth, %
organic 1) acq./div., nettotal growth
excl. currency currency total growth
nordic 1 (1) 0 (4) (4)Western europe (1) 2 1 (3) (2)eastern europe (2) 2 0 (6) (6)Asia 15 13 28 3 31 latin America 12 5 17 (7) 10 north America (1) 14 13 5 18 pacific 0 6 6 (2) 4
total 1 2 3 (3) 0

22 · annual report 2009 | financial review
crease in integration costs in 2009 was due to the comple-tion of fewer acquisitions in 2009 compared with previous years. Integration costs in 2009 related primarily to redun-dancy payments and termination of rental obligations with respect to acquired companies in Italy and Spain.
operating profitoperating profit decreased by dKK 476 million, or 13%, from dKK 3,753 million in 2008 to dKK 3,277 million in 2009 and was negatively impacted by a lower operating margin before other items and an increase in other expenses.
share of result from associatesthe share of result from associates increased by dKK 1 mil-lion from a profit of dKK 3 million in 2008 to dKK 4 million in 2009.
net finance costsnet finance costs dropped by dKK 423 million, or 15%, to dKK 2,308 million in 2009 from dKK 2,731 million in 2008. the main reason for the decrease was a net gain on foreign exchange in 2009 compared with a loss on foreign exchange in 2008 as well as lower interest expenses, net in 2009.
In 2009, net finance costs included dKK 2,168 million of net interest expenses, dKK 61 million in net gains on for-eign exchange, dKK 57 million in amortisation of financing fees and a loss of dKK 59 million related to repayment of the 2010 eMtns acquired at nominal value with a carrying amount lower than nominal value due to the market value adjustment made in connection with ISS Holding A/S's ac-quisition of ISS A/S.
profit before tax and goodwill impairment/ amortisation of brands and customer contractsprofit before tax and goodwill impairment/amortisation of brands and customer contracts decreased by dKK 52 million from dKK 1,025 million in 2008 to dKK 973 million in 2009.
income taxesIncome taxes increased from dKK 531 million in 2008 to dKK 588 million in 2009. the effective tax rate was 60.4% in 2009 compared with 51.8% in 2008, calculated as the consolidated tax provision of dKK 588 million divided by the profit before tax and goodwill impairment/amortisation of brands and cus-tomer contracts totalling dKK 973 million. the tax expense in 2009 was adversely impacted by the danish interest limita-tion deductions. due to the limitation to interest deductions, the group is subject to limitations on the deductibility of fi-nancial expenses of approximately dKK 559 million in 2009. the net effect on the tax expense in 2009 is estimated to be dKK 137 million.
In addition, the tax expense in 2009 was adversely impacted by withholding taxes that are non-proportional to the profit before tax. the level of withholding taxes increased in 2009 due mainly to the terminated tax treaties between denmark and respectively France and Spain.
profit before goodwill impairment/amortisation of brands and customer contractsprofit before goodwill impairment/amortisation of brands and customer contracts decreased by dKK 109 million or 22%, from dKK 494 million in 2008 to 385 million in 2009.
goodwill impairment and write-downthe intangibles of the group relate partly to the intangibles in the purchase price allocation following the takeover of ISS on 9 May 2005. At the date of the takeover, the value in use of all individual cash generating units (Cgus) was close to the carrying amount. Consequently, a decline in value in use of an individual Cgu subsequent to the purchase price allocation will trigger impairment. goodwill impairment and write-downs amounted to dKK 1,246 million. Impairment losses of dKK 450 million related to ISS’s business in France, and dKK 100 million related to ISS’s business in germany. the impairment losses resulted from weakening market condi-tions within certain business activities in which ISS operates, especially the industrial segments, combined with an increase in the discount rate applied at the time of recognition of the impairment loss in May 2009. Write-downs totalling dKK 696 million related to the write-down of dKK 248 million as a re-sult of divestment of a number of businesses and the write-down of dKK 448 million on certain businesses classified as held for sale on 31 december 2009. the write-down of com-pleted divestments of dKK 248 million related mainly to the sale of ISS’s non-strategic landscaping business in Sweden of dKK 137 million, the sale of the call centre activities in the netherlands of dKK 69 million and the sale of the pest control activities in the united Kingdom of dKK 42 million. the dKK 448 million write-down on businesses classified as held for sale on 31 december 2009 related mainly to the expected sale of certain non-core activities in France, Spain and norway.
In 2008, goodwill impairment and write-downs amounted to dKK 399 million, of which dKK 250 million related to ISS’s business in germany, and dKK 20 million related to ISS’s business in Italy, which was recognised following impair-ment tests. the remaining dKK 129 million related to divest-ments.
amortisation of brands and customer contracts Amortisation of brands and customer contracts amounted to dKK 1,129 million in 2009, up from dKK 1,008 million in 2008. the increase was a result of a dKK 210 million write-down
financial review | annual report 2009 · 23
on customer contracts that related mainly to classification of non-core activities in France as held for sale. the amortisa-tion related primarily to customer contracts, whereas only a minor part of the amortisation related to local brands. As the useful life of the ISS brand is deemed indefinite, ISS does not amortise the value of the ISS brand.
tax effectthe tax effect of goodwill impairment and write-down and amortisation of brands and customer contracts, which is presented separately in the income statement to show the effective tax percentage before impairment/amortisation of intangibles, was dKK 361 million in 2009 and dKK 282 million in 2008.
net lossnet loss increased from a loss of dKK 631 million in 2008 to a loss of dKK 1,629 million in 2009, and was negatively impacted by a lower operating profit and higher non-cash charges related to goodwill impairment of dKK 550 million and dKK 983 million before tax related to divestments and businesses classified as held for sale. this was partly offset by lower net finance costs. In 2009, a loss of dKK 1,647 mil-lion was attributable to the owners of ISS, whereas a profit of dKK 18 million was attributable to non-controlling inter-ests.
cash floW statEmEnt
cash flow from operating activitiesCash flow from operating activities was a net inflow of dKK 3,732 million in 2009, down dKK 602 million from dKK 4,334 million in 2008. the development was due primarily to a cash outflow of dKK 137 million from working capital compared with a cash inflow of dKK 109 million in 2008 and an increase in cash outflow of dKK 190 million from payments related to other income and expenses, net, as well as the decrease in operating profit before other items of dKK 187 million.
Cash outflow from changes in provisions decreased from dKK 96 million in 2008 to dKK 50 million in 2009. the amount comprised the effect of net changes in provisions charged to the income statement during 2009 and payments made in relation to such provisions.
Income taxes paid, net, amounted to dKK 394 million in 2009 compared with dKK 363 million in 2008.
payments related to other income and expenses, net, amounted to dKK 371 million in 2009, up dKK 190 million compared with 2008. payments of dKK 283 million related
to restructuring projects in France, germany, Spain, Austra- lia, Belgium, denmark, Finland and the united Kingdom.
cash flow from investing activitiesCash flow from investing activities in 2009 was a net cash outflow of dKK 1,832 million, of which dKK 914 million re-lated to acquisitions completed during 2009 and payment of earn-outs and deferred payments on acquisitions completed in previous years. Acquisitions completed in 2009 comprised investments primarily in India, the uSA, Indonesia, Italy and turkey. the cash outflow from acquisitions was partly offset by proceeds from divestments of dKK 22 million that related primarily to the divestment of the landscaping activities in Sweden. Investments in intangible assets and property, plant and equipment, net, (excluding acquisition-related intangi-bles) totalled dKK 897 million in 2009, representing 1.3% of revenue. Investments in financial assets, net, totalled an outflow of dKK 43 million in 2009.
In 2008, the net cash flow from investing activities represent-ed an outflow of dKK 2,543 million due mainly to payments of dKK 2,095 million related to acquisitions and investments in intangible assets and property, plant and equipment, net, (excluding acquisition-related intangibles) of dKK 718 mil-lion.
net cash flow from financing activitiesCash flow from financing activities in 2009 was a net cash out-flow of dKK 1,547 million. this was mainly a result of interest payments of dKK 2,205 million and repayment of borrowings of dKK 5,177 million due primarily to settlement of euR 500 million of the 2010 eMtns in July 2009 as well as amortisa-tion on senior facilities. this was partly offset by drawings on credit facilities of dKK 5,849 million stemming mainly from the issuance of new Senior notes due in 2014 in July 2009, the launch of a securitisation programme in the last quarter of 2009 as well as drawings on the acquisition facility up until 11 May 2009 when the acquisition facility expired.
In 2008, the net cash flow from financing activities amount-ed to a cash outflow of dKK 1,348 million. this was mainly a result of dKK 2,267 million in interest payments that was partly offset by net drawings on credit facilities primarily to fund acquisitions of dKK 941 million.
cash conversionChanges in working capital represented a cash outflow of dKK 137 million that resulted in a cash conversion of 96% in 2009 compared with 103% in 2008.
Cash conversion ratios for individual years may vary. the cash flows from operations for the individual periods depend on

24 · annual report 2009 | financial review
the timing of a number of payments towards the end of the individual months and years. For a definition of cash conver-sion, see page 135.
balancE shEEt
total assetstotal assets amounted to dKK 54,354 million at 31 december 2009, of which dKK 38,272 million represented non-current assets, primarily intangible assets, and dKK 16,082 million represented current assets, primarily trade receivables of dKK 10,130 million.
intangible assetsIntangible assets decreased by DKK 549 million from DKK 36,001 million at 31 december 2008 to dKK 35,452 million at 31 december 2009. Intangible assets comprise primarily goodwill, customer contracts and brands. Intangible assets relate primarily to the acquisition of ISS A/S on 9 May 2005, when a carrying amount of dKK 31,844 million in intangible assets, of which dKK 22,035 million related to goodwill, was recognised in ISS’s balance sheet.
the negative development in the world economy and finan-cial markets during most of 2009, including increased mar-ket fluctuations and volatility, has continued to make the valuation of intangible assets subject to greater uncertain-ties than in recent years.
At 31 december 2009, goodwill amounted to dKK 27,434 million, an increase of dKK 175 million, or 1%, from dKK 27,259 million in 2008. Additions related to acquisitions in 2009 amounted to dKK 595 million while currency adjust-ments increased goodwill by dKK 875 million. goodwill was reduced by impairment and write-down of dKK 1,246 mil-lion that related to ISS’s impairment of dKK 450 million in France and dKK 100 million in germany and write-downs totalling dKK 696 million related to completed divestments and businesses classified as held for sale. the write-down on completed divestments of dKK 248 million mainly related to the sale of ISS’s non-strategic landscaping business in Swe-den of dKK 137 million, the sale of the call centre activities in the netherlands of dKK 69 million and the pest control activities in the united Kingdom of dKK 42 million. the dKK 448 million write-down on businesses classified as held for sale on 31 december 2009 related mainly to the expected sale of certain non-core activities in France, Spain and nor-way.
goodwill is related to acquisitions, including the acquisition of ISS A/S, carried out under varying circumstances and at
different stages of macroeconomic cycles. the goodwill is distributed on most of the countries in which the group op-erates. the acquired companies, to which the goodwill re-lates, comprise a diverse portfolio of service types, customer segments, geographical regions, contract sizes and manage-ment skills. the largest amount of goodwill relates to the group’s operations in France, representing approximately 16% of the total carrying amount of goodwill.
Customer contracts decreased by dKK 798 million to dKK 6,120 million at 31 december 2009, from dKK 6,918 million at 31 december 2008. Amortisation of dKK 910 million and write-downs of dKK 210 million were partly offset by dKK 252 million in positive foreign exchange adjustments.
assets and liabilities held for saleAssets and liabilities held for sale amounted to dKK 614 mil-lion and dKK 379 million, respectively, and include the as-sets and liabilities attributable to certain non-core activities in France, Spain and norway for which a sales process has been initiated. the businesses in norway and Spain were subsequently sold on 26 February 2010.
other non-current assetsNon-current assets other than intangible assets amounted to dKK 2,820 million at 31 december 2009, a slight decrease from dKK 3,010 million at 31 december 2008. the decrease related mainly to property, plant and equipment and was partly offset by an increase in deferred tax assets and other financial assets.
trade receivablestrade receivables increased slightly from dKK 10,097 million at 31 december 2008 to dKK 10,130 million at 31 december 2009. this was a result of an increase in revenue and despite a decrease in debtor days from 46.7 in 2008 to 45.3 in 2009.
cash and cash equivalentsCash and cash equivalents increased from dKK 2,961 million at 31 december 2008 to dKK 3,364 million at 31 december 2009, of which dKK 2,053 million resided at group level with the remainder at country level. the cash position was posi-tively impacted by working capital inflow in Q4 2009. the cash position may fluctuate significantly over the months due to the frequency and timing of cash collection and out-going payments, e.g. salary payments.
other current assetsOther current assets, comprising inventories, contract work in progress, tax receivables, other receivables and securities, amounted to dKK 1,974 million at 31 december 2009 (dKK 1,536 million at 31 december 2008). other receivables in-

financial review | annual report 2009 · 25
creased from dKK 776 million at 31 december 2008 to dKK 1,071 million at 31 december 2009. other receivables com-prised mainly prepayments and receivable sales prices rela- ted to divestments.
total equitytotal equity decreased from dKK 3,533 million at 31 de-cember 2008 to dKK 2,213 million at 31 december 2009, of which dKK 2,190 million was equity attributable to the eq-uity holders of ISS Holding A/S. the total change in equity for the year attributable to the equity holders of ISS was a reduction of dKK 1,308 million.
net income and expenses recognised in equity reduced eq-uity by dKK 1,290 million. this included a net loss of dKK 1,629 million for the year and actuarial losses, net, including the effect of the asset ceiling on defined benefit pension schemes that amounted to dKK 27 million. partly offsetting this was positive currency adjustments of dKK 364 million relating to investments in foreign subsidiaries.
the equity ratio, defined as total equity relative to total as-sets, decreased from 6.6% at 31 december 2008, to 4.1% at 31 december 2009.
long-term debtthe decrease in long-term debt from dKK 31,210 million in 2008 to dKK 28,486 million in 2009 was due primarily to re-classification to short-term debt in accordance with the debt maturity profile.
other long-term liabilitiesother long-term liabilities comprise pensions and similar ob-ligations, deferred tax liabilities and other provisions, and amounted to dKK 3,572 million at 31 december 2009 (dKK 3,729 million at 31 december 2008).
pensions and similar obligations amounted to dKK 837 mil-lion at 31 december 2009, compared with dKK 834 million at 31 december 2008. the majority of the group’s pension plans are defined contribution plans. the group’s contribu-tions to such plans are accrued and expensed on an ongo-ing basis. In certain countries, mainly France, germany, the netherlands, Sweden, Switzerland and the united Kingdom, ISS has defined benefit plans. As mentioned above, actu-
arial losses of dKK 27 million, including the net effect from the asset ceiling, were taken directly to equity. the losses stemmed mainly from the united Kingdom and norway and were partly offset by a gain in France. due to the current market conditions, the determination of the discount rates in the individual countries is subject to uncertainty.
other provisions amounted to dKK 802 million at 31 de-cember 2009, of which dKK 379 million had an estimated maturity of more than one year. Comparative figures at 31 december 2008 were dKK 832 million and dKK 397 million, respectively. the provisions comprise acquisition-related provisions and various obligations incurred in the course of business, e.g. self-insurance obligations, labour-related obli-gations, legal obligations, restructurings, contract closures, etc.
deferred tax liabilities decreased from dKK 2,498 million in 2008 to dKK 2,356 million in 2009, and were attributable mainly to the tax effect related to the amortisation of the brands and customer contracts.
other current liabilitiesother current liabilities, comprising short-term debt, trade payables, tax payables and other provisions, amounted to dKK 8,970 million at 31 december 2009 (dKK 4,672 million at 31 december 2008).
other liabilities amounted to dKK 10,734 million at 31 de-cember 2009 compared with dKK 10,461 million at 31 de-cember 2008. other liabilities consist mainly of accrued wag-es and holiday allowances, tax withholdings, VAt and other payables and accrued expenses.
carrying amount of net debtCarrying amount of net debt amounted to dKK 30,630 mil-lion at 31 december 2009, up dKK 1,245 million from dKK 29,385 million at 31 december 2008. the increase was due primarily to acquisitions in 2009 and payment of earn-outs and deferred payment on acquisitions completed in previ-ous years. At 31 december 2009, long-term debt was dKK 28,486 million, short-term debt amounted to dKK 5,617 million while securities, cash and cash equivalents and re-ceivables from companies within the ISS group totalled dKK 3,473 million.

louanna phillips
mElaniE gallanagh
liz phillips
AuStRAlIAMost of Australia’s mineral wealth is found in its most remote regions. Rio tinto, the world's third-largest mining company, wanted a well maintained and pleasant mining camp and turned to ISS. We were happy to help and now provide cleaning and grounds maintenance for Wickham Village and dampier, while also managing and running a bank, delicatessen, post office, supermarket, bus service and a pub-lic swimming pool in pannawonica township, the most remote of the three sites. With the Rio tinto contract, ISS has proven its ability to en-thusiastically pursue any opportunity – even in the most remote parts of the world.
dampiEr port

strategy – the iss way | annual report 2009 · 27
StRAtegy – tHe ISS WAy
iss – businEss and stratEgy
ISS is one of the world’s largest commercial providers of Fa-cility Services, operating in over 50 countries in europe, Asia, pacific, north America and latin America. ISS has been ope- rating in the service industry for more than 100 years and began offering cleaning services in 1934. Since that time, ISS has significantly expanded its business through acquisitions and organic growth.
ISS’s business model is based on creating value for our cus-tomers by offering a range of business support services within Cleaning, Support Services, property Services, Cater-ing, Security and Facility Management. ISS's Facility Man-agement approach represents a unique offering whereby the service delivery can be integrated into one seamless so-lution.
the ISS Way strategy, launched in 2008, is based on our four cornerstones; customer focus, people management, the IFS strategy and a multi-local approach. Combined with our cor-porate values and leadership principles, these cornerstones provide the foundation on which we pursue our vision to “lead Facility Services globally — by leading Facility Services locally”.
Implementation of the ISS Way is well under way and is ori-ented around a number of key strategic priorities, especially focus and alignment. After a period of platform building through acquisitions, we are focusing on extracting the full value inherent in our business by concentrating our efforts on specific customer segments. Another key priority is to ensure the continued alignment of the organisation to fully support the strategic direction we have set for ISS going forward.
the continued successful implementation of the ISS Way strategy is the foundation for robust and profitable growth in the years to come.
values ultimately, the ISS Way strategy is founded on our four val-ues on which we base our strategic, operational and finan-cial plans and actions.
leadership principles and development As part of the ISS Way strategy, the way we act as leaders has also been scrutinized. In 2009, a set of common inter-national leadership principles was established defining the attitudes and behaviours ISS expects from its leaders. this resulted in the following nine principles:
> Quality – we deliver
We are professionals with a passion
for quality. We deliver on our promises.
> honesty – we resPeCt
our honesty is not negotiable.
We respect our customers, our
colleagues and our company.
Honesty comes first.
> resPonsibility – we Care
Indifference is immoral. We care
about what we do and for whom
we do it.
> entrePreneurshiP – we aCt
Action speaks louder than words.
All our employees have a ‘licence
to act’ and are expected to do so.
corporatE valuEs

28 · annual report 2009 | strategy – the iss way
In ISS we put the customer first In ISS we have passion for performance In ISS we encourage innovation In ISS we treat people with respect In ISS we lead by example In ISS we lead by empowerment In ISS we develop ourselves and others In ISS teamwork is at the heart of our performance ISS is one company with shared values, one brand
and one strategy
these principles, which are currently being integrated in the processes surrounding recruitment, appraisals, development and talent management, are applicable for all ISS leaders. As the principles translate our values into actions and behaviours by describing successful leaders, this initiative will enhance our leadership capabilities on an ongoing basis.
our four cornerstones the ISS Way is built on four cornerstones: customer focus, people management, the IFS strategy, and a multi-local ap-proach.
Customer focus. At ISS, we put customers in focus. We serve our chosen customers locally, regionally and globally with specific value propositions while focusing on identify-ing customer needs and wants. We build enduring partner-ships with customers who value our approach to service.
People management. At ISS, people management is our core competence. We excel in people management in order to deliver excellence in our service offerings. We mitigate risks and volatility transferred from our customers, by apply-ing leadership skills, HR and eHS policies, employee training and labour legislation insight. to obtain these benefits we share knowledge and best practices.
IFS strategy. At ISS, IFS is our strategic aim. We advance our service offering towards IFS by building the ISS House of services and developing our FM capabilities. We self-deliver multiple site-based services as defined by the "ISS House" and we integrate our service deliveries seamlessly in our cus-tomers' organisations.
Multi-local approach. At ISS, we strike a balance between autonomy and alignment. We operate with strong local leadership and autonomy to ensure timely responses to de-mands and requests. We also reflect the overall group fun-damentals and strategic direction to allow us to exploit best practices and leverage our geographical footprint. We are disciplined and use tight financial controls.
our service offeringISS's service offering has been developed to meet customer needs. our fundamental offering is illustrated by the "ISS House", which has five pillars: Cleaning, Support Services, property Services, Catering and Security. the "roof", Faci- lity Management, represents the sixth service and our ca-pabilities within the integration of service deliveries. the ISS House is built on a strong foundation of Service excel-lence, which means that our customers enjoy the benefits of partnering with a service expert – a company that truly understands customer needs and has the services required to support them.
Service concepts are being developed to address the specific needs of customer segments. this entails defining versions of the ISS House that are built on ISS's fundamental com-petencies and presenting an integrated solution customised for a given segment. As an example, the ISS House for the Healthcare segment is illustrated at the right. ISS focuses primarily on delivering portfolio and site-based services, where ISS employees become an integrated part of the clients' daily operations. ISS also offers selected route-based services, such as pest control and washroom services. not all country operations necessarily offer all services within the six service areas, which comprises more than 100 individu-al services. local offerings depend on factors such as custom-er demand, market conditions and access to qualified staff.
If a country does not self-deliver all six service areas, the use of subcontractors ensures one-stop shopping for custom-ers. each country aims at building up services according to market demand. In time, all ISS countries are expected to be able to self-deliver the most significant components of the full ISS House of services.
the delivery modelISS distinguishes between services offered and the way in which these services are delivered. the three delivery mod-els are: Single Service, Multi Services and Integrated Facility Services. In 2009, ISS continued to develop and strengthen its Single-Service excellence concepts and Integrated Facility Services capabilities.
With Single-Service outsourcing, customers buy one service solution from ISS, for instance outsourcing of cleaning, and can then focus more on their core business activities.
With Multi-Service outsourcing, which consists of two or more services but is not a fully integrated solution, customers achieve the same benefits as with Single-Service outsourcing with the benefits of service integration where possible.

strategy – the iss way | annual report 2009 · 29
thE iss housE– for the healthcare segment
hEalthcarE clEaning
• Bed Space Cleaning
• Clinical Cleaning
• Non-Clinical Cleaning
• Decontamination
• Disinfection
• Barrier Cleaning
• Washroom Services
• Dust Control
• Laundry Services
• Window Cleaning
• Pavement & Sidewalk
services (sweeping/
snow removal)
hEalthcarE logistics
• Transportation of
patients
• Transportation of Blood
& Medical Samples
• Transportation of
laboratory test/results
• Shipping & Receivables
(non-core items)
• Moves, Adds & Changes
(internal moves)
• Switchboard (On-site)
• Information Desk
• Printing & Copying
• Beds Management
• Furniture & Equipment
management
• Stationary/Office
supplies
• Document Handling
(on-site))
• Patient Record
management
• Mail Handling
hEalthcarE EquipmEnt
managEmEnt
• Service of Beds
(replacements/repairs)
• Service of Patient Trans-
portation Equipment
(trolleys, Wheelchairs,
hoists etc)
• Service of Medical
Equipment
• Medical Gases
• Nurse Call Systems &
panic alarms
• Pneumatic Tube Systems
• Handyman (Light
reactive maintenance)
• Repairs & Replacements
• Lifts & Escalator Services
• Building Management
• Landscaping & Grounds
maintenance
• Pest Control
• Waste & Recycle
management
• Energy Management
• Water Supply
• Lighting & Power
• Legionella Control &
management
(Water treatment)
• HVAC (incl. Cooling)
patiEnt catEring
• Patient Feeding
• Dietetic Services
• Nutrition Services
• Delivered Meal Solutions
• Beverages incl.
coffee/tea
• Restaurant
• Kiosks & Cafes
• Hospitality Services
• Conference Facilities
• Fruit & Pastry Provisions
• Installation & Service of
vending machines
guarding
• Patient Escorting
• Visitor Escorting
• Manned Guarding
• Mobile Patrols
• Admission Control
– External & Internal
• Keys & Cards
• Cash in Transit
• Staff Protection
• Monitoring (CCTV)
• Alarm Response
• Emergency Evacuation
• Fire & Gas Detection
• Burglary Detection
• Alarm Systems
• Lost Property

30 · annual report 2009 | strategy – the iss way
With Integrated Facility Services solutions, ISS delivers two or more services under one contract with a single point of contact on-site, and ISS takes over all or most of the facility services functions at the customer’s premises. the customer receives both the full potential of Single-Service outsourcing and the advantages of integrating services, including cost efficiencies and a more efficient and flexible service set-up.
the iss value chainthe ISS Value Chain management tool drives the implemen-tation of the ISS Way strategy.
the links of the Value Chain are best illustrated by starting at the end – Business growth. the shared purpose of our existence at ISS is to create shareholder value. this emerges from profitable growth which in turn is driven by satisfied customers who expand their business with ISS and renew their contracts. Customer satisfaction is founded on capable employees who are engaged in their jobs and motivated by being part of a strong team. Capable employees are employ-ees who have been trained in the delivery of clearly defined and operational service concepts. Strong and attractive service concepts are the result of informed decisions made
regarding the business platform, which determines the cus-tomer segments we should serve and services we choose to deliver to these segments. Acquisitions are a useful tool in the continued development of ISS, and will be used selec-tively to improve ISS’s competitiveness, build critical mass and increase service capabilities and capacity where and when appropriate.
the ISS Value Chain is used actively at strategic, tactical and operational levels and forms a central part of the ISS Way of thinking and working. Management at all levels have shared points of reference deeply embedded in the organi-sation that enable them to see their actions from a broader perspective, thus creating a well-founded, valuable and ho-mogenous service culture at ISS.
the iss Way strategyAfter years of successfully building our business platform through acquisitions, the ISS Way is turning our focus to-wards extracting the full potential in our existing platform. the implementation of the ISS Way is well under way and is oriented around a number of key strategic priorities, espe-cially focus and alignment. We are enhancing our response
thE iss valuE chain
BusinessPlatform
ServiceConcept
EmployeeEngagement
ServiceValue
CustomerExperience
BusinessGrowth
AcquisitionGrowth

strategy – the iss way | annual report 2009 · 31
to customer needs and developing value propositions tai-lored to specific customer segments. We are also develop-ing services within which we deliver service excellence and which are most suitable for integration and therefore con-sistent with our IFS strategy.
We are also pursuing standardisation, best practice and knowledge sharing across the organisation. excellence centres and knowledge forums have been established and are contributing to further increasing the efficiency of our service delivery and establishing consistent definitions and alignment of our services. experts from corporate, regional and country levels are working together in various global forums to further align key business processes and proce-dures at ISS. the ongoing implementation of this strategy will allow ISS to continue to enhance its position as a lead-ing local and global Facility Services company, by delivering consistent high quality service.
In 2009, ISS expanded its portfolio of multi-national cus-tomers procuring services in multiple jurisdictions through two major new contract wins while continuing to invest in expanding the global Corporate Clients organisation estab-lished in 2007. the purpose of this organisation is to win contracts with global and regional customers – fully in line with the vision of being the leading global Facility Services provider.
the ISS Way focuses on organic growth and entails a con-solidation phase after a period of high acquisition volume in which ISS has built its broad business platform. ISS has therefore slowed down the pace of acquisitions in 2009 and increased its focus on integrating acquired companies and harvesting synergies.
operational objectivesISS seeks to maintain and enhance operational efficiency by focusing on three well-established and prioritised opera-tional objectives for its local managers: (i) cash flow, (ii) ope- rating margin, and (iii) profitable organic growth.
Cash flow
ISS’s first objective is to continue to maintain a relatively high rate of cash conversion primarily by operating in a man-ner that optimises working capital. through this approach, ISS expects to continue to generate a level of positive cash flow from operations that exceeds its obligations to service its credit facilities.
oPerating margin
ISS’s second objective is to maintain or improve its opera- ting margin. ISS seeks to improve operational efficiency by
increasing its local market positions and operational density, and by implementing companywide best practices.
Profitable organiC growth
ISS’s third objective is to focus on organic growth through customer retention and sale of service solutions to our cus-tomers. ISS will continue to leverage its international market position and service offering in order to increase its local market positions and drive organic growth. ISS continues to work with a wide range of initiatives, including the further development of the Corporate Clients organisation and en-hancing our focus on specific customer segments.
corporatE rEsponsibility
As a global company with over 485,000 employees serving 200,000 customers in more than 50 countries, ISS influences the lives of many people and has an extensive interface with societies around the globe.
More than a century in the service industry has made ISS well aware that our long-term sustainable business success depends on a high level of Corporate Responsibility (CR), as economic, social and environmental issues are inevitably interconnected. therefore CR is an integral part of our values and business strategy and is closely linked to the ISS Value Chain. developing our values into concrete actions is also our response to demand from several stakeholder groups, e.g. existing and potential employees and customers. It is already clear that securing inter-national IFS contracts from the world’s blue-chip corporations requires a consistent CR performance, which is a key factor in winning and retaining contracts in this customer segment.
our ten-year membership of the global Compact has taught us that working with corporate responsibility is not a one-off event. It is a never-ending journey. We have come a long way and are proud of offering people work and training while treating them fairly. By setting high social, environ-mental and ethical standards, we are paving the way for profitable growth while demonstrating leadership within our industry. In the years to come, ISS intends to transform its CR approach from improving our license to operate into value-adding propositions and business opportunities.
this CR chapter is ISS’s compulsory report on Corporate Social Responsibility, as per section 99a of the danish Financial Statements Act, which covers the financial year ended 31 december 2009. In accordance with instructions from the un global Compact to members of the Compact, this report also serves as ISS’s communication on progress in implement-ing the ten principles of the global Compact.

32 · annual report 2009 | strategy – the iss way
our cr policiesConducting business in a responsible and sustainable manner is a core concept that is embedded in the ISS Way strategy.
ISS has made a strong commitment as a signatory and sup-porter of the united nations global Compact since its in-ception in 1999. In line with membership regulations, ISS is committed to complying with the ten global Compact prin-ciples on human rights, labour rights, environmental protec-tion and anti-corruption. ISS’s commitment to act respon-sibly and with integrity is reflected in our Values, Code of Conduct and International HR Standards. In 2009, we added leadership principles and also established a group Business Integrity Committee.
rightsResponsibility is one of the four ISS Values which founds the business of ISS. our Code of Conduct applies to all ISS opera-tions and is featured in the terms of employment of all our employees. the Code states, for example, that ISS respects the united nations’ declaration of Human Rights, that ISS is committed to continuously reducing adverse environmental effects caused by its operations and that ISS is against any form of corruption and bribery and is committed to combat-ing such practices.
As ISS employs more than 485,000 employees, managing people is the heart of our business. Well trained and highly motivated employees are our primary resource. We there-fore aim at being the preferred employer in our industry and care about our employees’ conditions at work. ISS’s employee rights are stated in our Code of Conduct, Inter-national HR Standards and leadership principles. these rights, which observe the declaration of Human Rights, en-sure proper working conditions for our employees, includ-ing training opportunities, and support for introducing and upholding minimum wages, proper health and safety stan- dards, non-discrimination against employees and a ban on
forced, compulsory and child labour. ISS respects freedom of association, the right to collective bargaining and to join and form trade unions as an integrated part of our efforts to ensure long-term business success.
from policies to action ISS communicates and enforces its standards and policies across the group. In an organisation as large as ISS, one culture – one approach – cannot be dictated. each level of our organisation must therefore fully grasp and embody the ISS Values and po- licies and be empowered to take action on this basis.
our commitment to doing business in a responsible manner in line with our policies has been communicated to suppli-ers, major customers and all employees by means of leaf-lets, meetings, management training sessions and employee magazines. When acquiring new companies and entering new markets and joint venture opportunities, we actively promote business conducted in compliance with the ISS Code of Conduct.
All employees are responsible for reporting breaches of the code to their immediate superior or in special circumstancesto the Head of group Human Resources at ISS Head office.
leadershipthe leaders in ISS, ranging from on-site team leaders to man-agement, play an integral role in promoting and driving the implementation of policies to all levels of ISS. Resources are therefore invested in management development and in ISS university, as described in the employee section below. In 2009, ISS took another step forward with the launch of our leadership principles, which serve as a guideline and bench-mark for leaders.
Employees, environment and business integrityFollowing the renewal of the global agreement between union network International (unI) and ISS in 2008, ISS and
In ISS we aim to create growth and development for people, the environment and local societies. We believe that economic, social and environmental concerns go hand in hand – therefore our value chain is closely linked to corporate responsibility. We continuously support the un global Compact and its ten principles.- ISS group Ceo, Jørgen lindegaard
strategy – the iss way | annual report 2009 · 33
unI created the global unI-ISS Foundation in April 2009. the purpose of the foundation is to monitor and improve employment standards within the service industry globally. the foundation ensures that the annual ISS donation of euR 100,000 is invested in projects within the industry and coun-tries in which ISS operates. the agreement and collaboration since 2008 has prompted unI to name ISS as an employer that treats its workers well and is setting a good example for other global employers.
ISS puts great effort into training employees to enhance their skills and encourage upward staff mobility. In the ma-jority of country operations, ISS plays an active role in em-ploying vulnerable groups such as immigrants, ethnic minor-ities, long-term unemployed individuals and other groups for whom it is difficult to gain access to the labour market.
the corporate environmental policy provides a group-wide framework for running ISS in a sustainable way. In most countries, the environmental policies and systems are al-ready in place. By the end of 2009, ISS had developed and made Cleaning excellence available to customers in coun-tries representing 80% of our Cleaning volume. the Clean-ing excellence method is gentler on the environment and ergonomically better for our employees than conventional cleaning. Case studies show that Cleaning excellence results in significantly reduced water consumption and in less use of cleaning substances. Furthermore, ISS globally focuses on sustainable sourcing that leads to reduced Co2 emissions. For instance approximately 85% of the entire ISS car fleet is diesel-fuelled. Another initiative in 2009 involved broaden-ing the use of environmentally friendly cleaning products and expanding our agreements with producers of sustain-able paper, tissues etc.
to support and ensure compliance with ISS’s business integ-rity policies, local operations have appointed ombudsmen over the last few years. ISS has established a group Busi-ness Integrity Committee consisting of our group CFo, Head of group legal, and Head of group Human Resources to strengthen the enforcement of our policies. the Committee is responsible for investigating reports of possible violations of the Code of Conduct throughout the group. going forwardISS’s commitment to doing business responsibly and imple-menting our initiatives will continue steadily in the years ahead. to keep ISS’s CR approach focused, manageable and tangible, an analysis together with external consultants was conducted during 2009 to identify key CR focus areas and establish how ISS can further prioritise its CR efforts.
In 2009, ISS decided to establish a Sustainability Steering group to strengthen its CR organisation. the steering group will be headed by the group CFo and work under the super-vision of its executive Sponsor, the group Ceo. the Steering group will coordinate and formulate our CR approach and prioritise CR issues. A key goal for the steering group is to use the analysis on key focus areas and other materials to develop a comprehensive sustainability report for ISS on a global basis.
EmployEEs
In 2009, the number of ISS employees increased by rough-ly 13,000, an increase of 3% compared with 2008. A large number of these additional employees joined both as a re-sult of ISS expanding in the Asian region and through other acquisitions. At the end of 2009, ISS had more than 485,000 employees in europe, Asia, pacific, latin America and north America.
human resourcesthe ISS Human Resources vision “to be the preferred em-ployer in our industry” supports the group strategy by fo-cusing on: upgrading leadership and management capabili-ties, enhancing customers’ service experience, integrating acquired businesses, and ensuring competitiveness through cost efficiencies.
the Human Resources strategy is implemented through “ISS International HR Standards”, which is the framework for local HR initiatives. the processes cover:
Recruitment Employee appraisals and reviews Motivation and loyalty Employee relations Training and development Talent management Managing sickness and absenteeism Reporting and monitoring HR Support for M&A and contract integration Health and safety Remuneration, benefits and incentives Succession planning
trainingtraining remains the cornerstone of the Human Resources strategy. Resources are invested in staff and management development – ranging from basic skills training through middle management programmes to full corporate MBAs.

34 · annual report 2009 | strategy – the iss way
the philosophy is to offer tailored training at all functional levels to enhance employee skills and encourage upward staff mobility. Much attention is devoted to developing the first management layer e.g. team leaders, supervisors and contract managers, who are responsible for their immedi-ate staff and customer interface. Most training is conducted at ISS academies and training facilities in national and local operations.
As in previous years, the ISS university programme portfolio consisted of internal and external seminars designed in co-operation with suppliers such as IMd, Henley Management College and InSeAd. the use of internal trainers intensified with the roll-out of the Business process Framework, which is an initiative to review and improve our processes. the IFS Academy conducted centralised training in Calculation for planners and the ISS Facility Management System introduc-tion.
the management induction programme, ISS Advantage, continues for executives throughout the group. during 2009, approximately 600 senior managers and specialists from the entire group attended a total of 41 workshops and programmes at ISS university. this will be further de-veloped by adding two additional mandatory management programmes within strategy and leadership.
health and safetyWe operate on client premises in a number of challenging environments such as the transport sector, major hospitals, corporate canteens and public parks and gardens. We pro-mote the fact that all employees are responsible for their own safety and the safety of others who may be affected by their work activities. our efforts are concentrated on ensur-ing the right working environment and giving our employ-ees the training and equipment necessary to perform their work safely.
We aim for continuous improvement in our health and safety performance and plan to embrace this area as part of overall business operations. At global and regional levels, ISS will further develop its approach to health and safety by establishing central health and safety functions and align-ing reporting systems. this will enable regional and global benchmarking and will challenge current local minimum re-quirements.
Employee loyaltythe service industry in general has high levels of employee turnover, as part of the industry is often considered suit-able for short-term or secondary employment. ISS pursues a range of strategies to retain its employees by offering more
full-time and daytime work, multi-task jobs, teamwork, skills development, career opportunities, leisure activities, etc. In 2009, the share of full-time employees (working 25 hours or more a week) rose to 71%. this indicator is important, as, on average, full-time employees develop stronger ties with ISS. the distribution of employee seniority (in years) pro-vides another perspective for employee loyalty within ISS. In 2009, approximately 65% of the group’s employees had been with ISS for more than one year.
Equal opportunitiesISS rewards its people solely on the basis of merit. When re-cruiting, developing and promoting, ISS focuses on the indi-vidual capabilities and qualifications of a candidate and not on the person’s gender, age, ethnic origin, religion, political views, etc.
thanks to its corporate culture, and aided by language courses and adapted training materials, ISS is an employer of choice for many immigrants and ethnic minorities. In all re-gions but especially in countries such as Belgium, denmark, France, norway, Sweden and the united Kingdom, ISS is among the largest employers of ethnic minorities. Similarly ISS in Australia has implemented its Indigenous training and employment Strategy and programme to actively engage in realising its commitment for equitable indigenous re- presentation and sustained indigenous participation across its national workforce. the associated outcome-driven em-ployment and retention commitment contributes directly to the Australian Federal government’s undertaking to halve within a decade the 24% gap between indigenous and non-indigenous employment and workforce participation rates.
Employee relationsemployee and trade union relations are a natural part of a people-centred business such as ISS. the corporate policy of involvement and dialogue is applied locally in the country operations. established in 1995, the european Works Coun-cil (eWC) is a forum for dialogue between ISS executives and ISS employee representatives from across europe. In June 2009, the eWC and ISS signed a new eWC agreement for the next four years. the eWC agenda for the meetings includes information and consultation on matters relating to the ISS group in europe, in particular concerning the structure, fi-nancial situation, development of the group, the current situation and probable trends of employment. discussions also involve the introduction of new working methods and processes, training and health & safety issues, provided that such issues may affect the interest of the employees of the ISS group in more than one country in europe.

astrid abrahamsE
tim van dEr ham
tHe netHeRlAndSIn March 2009, the Ministry of Finance building in the Hague in the nether-lands was officially re-opened by HRH Queen Beatrix after extensive refur-bishment. ISS was involved as a partner in the ppp project from the very start and has a 25-year contract with the Ministry of Finance to deliver Catering, Cleaning, Support Services and property Services. 120 ISS employees, led by Facility Manager Astrid Abrahamse, work hard every day to make life easier and more pleasant for the approximately 1,700 employees at the Ministry of Finance.

36 · annual report 2009 | corporate governance
CoRpoRAte goVeRnAnCe
the Board of directors regularly considers the group’s cor-porate governance in relation to the group’s activities, busi-ness environment and statutory requirements. good corpo-rate governance at ISS is implemented in a dynamic process that involves the Board of directors and the Company con-tinuously assessing the need for adjustments for the benefit of ISS’s stakeholders and the group itself.
Corporate governance policies and procedures at ISS take into account the danish Companies Act, the danish Financial State-ments Act, IFRS, the Action plan for Corporate Social Respon-sibility (CSR), the danish Venture Capital and private equity Association’s guidelines for responsible ownership and good corporate governance as well as good corporate governance practices for companies of ISS’s size and global reach.
Corporate Responsibility (CR) reporting is included in the “Strategy” chapter.
shareholdersISS is a limited liability company incorporated and operating under danish law. the company’s share capital is indirectly owned by funds advised by eQt partners (eQt) and gold-man Sachs Capital partners (gS Capital partners). eQt and gS Capital partners are together referred to as the principal Shareholders and hold 54% and 44% of the share capital respectively. the remaining approximately 2% of the share capital is held by certain members of the Board of directors, the executive group Management and a number of senior officers of ISS through director and management invest-ment programmes.
eQt is a leading private equity group with operations in northern and eastern europe, Asia and the uSA. eQt has raised approximately euR 13 billion in twelve funds. In to-tal, eQt funds have invested approximately euR 7 billion in more than 70 companies. eQt partners, acting as exclusive investment advisor to eQt, is headquartered in Stockholm and maintains offices in Copenhagen, Helsinki, oslo, Frank-furt, Munich, Zurich, Warsaw, london, new york, Shanghai and Hong Kong.
gS Capital partners is the private equity vehicle through which the principal Investment Area (pIA) of goldman Sachs group, Inc. conducts its privately negotiated corporate equity investment activities. Since 1986, pIA has raised 15 investment funds (including mezzanine and senior secured loan funds) through three corporate investment vehicles, aggregating over uSd 80 billion of capital (including actual leverage). gS Capital partners is a global private equity group focused on large, sophisticated business opportunities in which value can be created by leveraging the resources of goldman Sachs.
the principal Shareholders have entered into a sharehold-ers’ agreement covering all entities through which eQt and gS Capital partners hold their interest in ISS.
the boardISS has a two-tier governance structure consisting of:
> the Board of directors (the Board), and> the executive group Management (the egM).
1) As described in note 36 to the consolidated financial statements, certain members of the Board, the egM members and a number of senior officers of the group have invested, directly or indirectly,
in shares and warrants in FS Invest S.à r.l. (FS Invest), ISS’s ultimate parent Company. the total number of shares held by these directors and officers is below 2% of the total share capital.
note: FS Invest is the ultimate parent company for which Consolidated Financial Statements are prepared. the Consolidated Financial Statements can be obtained from FS Invest, 2 rue de Fosse, l-1536
luxembourg.
Eqt 54% fs invEst s.à r.l (luxEmbourg) 1)
fs invEst ii s.à r.l (luxEmbourg)
iss Equity a/s
iss holding a/s
iss a/s
iss global a/s
opErating subsidiariEs
goldman sachs capital partnErs 44%

corporate governance | annual report 2009 · 37
the Board supervises the Company’s activities, its manage-ment and organisation. the egM is responsible for ISS’s day-to-day operations. the two bodies are separate and have no overlapping members.
the Board functions in accordance with the rules set out in the danish Companies Act, the shareholders’ agreement, the articles of association and rules of procedure, which provide guidelines for the Board’s work in general. Board resolutions are generally passed with a simple majority, and in the event of a tie, the Chairman casts the deciding vote. However, under the shareholders’ agreement, certain ac-tions require special approval by the principal Shareholders.
the Board convenes at least six times a year. extraordinary meetings are convened whenever specific matters need at-tention between scheduled meetings. twelve Board meetings were held in 2009. the Board receives a monthly financial and operational reporting package and is briefed about important matters in the periods between Board meetings. the Board approves the strategy plan, the annual budget and large or strategic acquisitions based on recommendations from the Acquisition Committee (see “Board Committees” below). the Board annually performs a self-assessment to assess the com-petencies of the Board, the effectiveness of its work and how the Board ensures that good corporate governance is in place.
According to the shareholders’ agreement, eQt and gS Cap-ital partners are entitled to nominate three Board members and a deputy member each, and eQt has the right to nomi-nate the Chairman of the Board after consultation with gS Capital partners.
More details on the Board members are available on page 42 of this report and in note 36 to the consolidated financial statements. Remuneration to the Board of directors of the group is disclosed in note 4 to the Consolidated Financial Statements.
board committeesthe Board has established four committees that all report to the Board.
the Remuneration Committee decides the remuneration packages and incentive schemes for the group Ceo, and provides input for other egM members and certain senior officers, as well as compensation levels and bonus systems in general. the committee consists of at least three members of the Board (currently ole Andersen, peter Korsholm and Steven Sher), and the group Ceo participates in its meet-ings. ole Andersen is chairman of the committee. the com-mittee held one meeting in 2009.
the Audit Committee evaluates ISS’s external financial re-porting, and monitors and challenges ISS’s main accounting policies and estimates, as well as systems of internal controls and risk management. Its duties also include considering the relationship with ISS’s external auditor and reviewing the audit process. the committee consists of at least three mem-bers of the Board (currently leif Östling, John Murray Allan, Christoph Sander and Steven Sher), and meetings are also attended by the group CFo, the Head of group Controlling, Head of group Internal Audit and the group general Coun-sel. leif Östling is chairman of the committee, which held four meetings in 2009.
the Acquisition Committee considers ISS’s procedures for acquisitions and divestments, reviews the acquisition and divestment pipeline, approves certain acquisitions and di-vestments in accordance with adopted procedures, and evaluates selected effected acquisitions. the committee consists of at least three members of the Board (currently Christoph Sander, peter Korsholm and Steven Sher), and meetings are also attended by the group Coo, group CFo, Head of group Strategy and Business development and Head of group M&A. Christoph Sander is chairman of the committee, which held six meetings in 2009.
the Financing Committee considers ISS’s capital structure, financing of future investments and hedging policies. the committee consists of at least two members of the Board (currently peter Korsholm and Steven Sher), and the group CFo and Head of group treasury participate in its meetings. the committee held eight meetings in 2009.
group managementthe executive group Management of ISS (the “egM”) con-sists of group Ceo Jørgen lindegaard, group Coo Jeff gravenhorst and group CFo Jakob Stausholm. the primary tasks of the egM are to carry out day-to-day management of the group, develop new strategic initiatives, develop group policies, monitor group performance and evaluate acquisi-tions and divestments.
the group Management (the “gM”) comprises the egM and the following Corporate Senior officers: Regional Ceos luis Andrade, troels Bjerg, Jean-Manuel Bullukian, Jacob götzsche, Hans John oiestad, david openshaw and Mar-tin gaarn thomsen, Head of group Human Resources Helle Havgaard, Head of group Strategy and Business develop-ment todd o’neill, Head of group M&A Jens ebbe olesen, group general Counsel Bjørn Raasteen, Head of Corporate Clients Magnus Åkerberg, Head of group treasury Barbara plucnar Jensen, Head of group Controlling peter Harder thomsen and Head of group It Henrik trepka. the mem-

38 · annual report 2009 | corporate governance
bers of the gM have been appointed by the egM to carry out day-to-day management within their functional areas, including providing strategic direction, managerial support and financial control.
two functional boards, the operational Board and Finan-cial Board, were established in 2009 to ensure develop-ment, alignment and roll-out of key initiatives within the Boards’ responsibility areas. the operational Board is head-ed by the group Coo, and includes the group Ceo, the Regional Ceos, Head of Corporate Clients and Head of excel-lence Centres. the Financial Board is headed by the group CFo and includes the Head of group Controlling, Head of group treasury, Head of group It, Head of group Internal Audit, Head of group Risk Management, Head of group tax and Regional CFos. the primary tasks of the two Boards are to develop and execute new strategic initiatives, develop and implement group policies, monitor group performance, re-view operational and financial matters, coordinate and eval-uate acquisitions and divestments and provide the egM with input for decision making. the members of the gM are remunerated with a combina-tion of a fixed salary and, for most members, a bonus that is capped at 60% of their fixed salary. the employment con-tracts of the gM members are subject to termination periods of between 12 and 18 months. directorships in companies in the ISS group held by members of the gM are not remuner-ated separately.
no member of the gM is permitted to hold directorships in companies outside the ISS group unless specific consent is granted. Remuneration received in respect of such external directorships is retained by the member, and ISS assumes no liability for such directorships.
country managementIn each of the countries in which ISS operates, country man-agement teams are appointed to manage the business in accordance with ISS group policies and procedures and lo-cal legislation and practice. ISS delegates substantial auton-omy and considerable powers to the country management teams including management of operations in their relevant markets, financial reporting, local tax and compliance with lo-cal legislation and practices. the country management teams for each relevant country are described on the ISS website at www.issworld.com.
management participation programmethe principal Shareholders have established a Manage-ment participation programme, under which the egM and a number of senior officers of the group can invest. the pro-
gramme is structured as a combination of direct and indi-rect investments in a mix of shares and warrants in FS Invest based on market values until the principal Investors’ exit. At the introduction of the programme in 2006, warrants in FS Invest were granted free of charge with a vesting schedule (based on value of shares and time) of which 329,404 were outstanding as of 31 december 2009.
Further, non-executive members of the Board (except re- presentatives of the principal Shareholders) can participate in a directors' participation programme and a Co-investment Scheme, under which they have invested in a mix of shares and warrants in FS Invest based on market values until the principal Investors’ exit.
As of 31 december 2009, the net investments were as follows:
group persons
investmentmeasured at cost
(dkk million)
Board of directors 4 23.7
executive group Management 3 20.8
Corporate officers 33 57.8
Country Management 120 118.1
risk management ISS continuously seeks to identify and evaluate risk factors that may have an adverse effect on the ISS group’s activities, financial performance, financial position and future growth. For a detailed, non-exhaustive list of the risk factors to which the group is subject, reference is made to the Senior notes offering Memorandum dated 16 July 2009 (pages 19-34) available from the group’s website at www.issworld.com.
overall, operational and financial risks are managed in accordance with policies adopted by the Board. In addi-tion, detailed plans and business procedures for a number of functions are described in manuals and guidelines. the policies for operational and financial risk management and ISS group standards are documented and distributed to the operating companies. ISS’s group Internal Audit, group Risk Management and group treasury departments supervise compliance with these standards.
oPerational risk management
operational risk management focuses principally on proce-dures for claims management, entering into contracts, oc-cupational safety, environmental aspects and safeguarding of physical assets. operational risk is assessed based on the activities of each operating company, historic and current claims events, and the markets in which the companies ope-

corporate governance | annual report 2009 · 39
rate. operational risk is monitored and mitigated in accord-ance with ISS group standards for risk management, risk financing and good operational practice. operational risk financing is based on insurance and own funding, primarily through local and global insurance programmes including a captive (global Insurance A/S), all managed centrally in ISS.
ISS considers that the group is not subject to material opera-tional risks except for risks common in the ordinary course of business in the service industry.
operational responsibility is delegated to the operating companies under the supervision of regional management.
finanCial risk management
Financial risk management focuses primarily on interest- rate risk, liquidity risk, currency risk and credit risk. the ISS group’s financial risk management is described in note 33 to the Consolidated Financial Statements.
main elements of the group's internal control environmentoverall Control enviroment
the Board and the egM acknowledge their responsibility for the group's internal control and risk management systems related to preparation of the Consolidated Financial State-ments including compliance with applicable laws and other regulation. the Audit Committee monitors and challenges the egM in its assessment of material risks and the internal controls and risk management systems that are put in place to manage the identified material risks. the Audit Commit-tee reports to the Board.
the group's internal control and risk management systems are developed to mitigate rather than eliminate risks identi-fied in relation to the financial reporting process and thus assist in ensuring that the Consolidated Financial Statements provide a true and fair view of the financial performance and financial position of the group without material errors. A material risk is considered to be a risk that may cause a material error in the Consolidated Financial Statements of the group. Internal control procedures at group level have been established to assess the group’s internal control envi-ronment and to manage identified risks.
ISS considers internal controls to be an essential manage-ment tool. Accordingly, care is taken to ensure that a sound framework of controls is in place for safeguarding the busi-ness, the company’s assets and the shareholder investments as well as the financial reporting. However, such controls are designed to manage rather than eliminate the risks and can
provide only reasonable and not absolute assurance against material misstatements or losses.
the aim of the established control environment is to provide the Board and the egM with reasonable assurance that:> management reporting is reliable and in compliance with
internal policies and procedures and gives a true and fair view of the financial performance and financial position
> material risks are identified and minimised> internal controls are in place to support the quality and
efficiency of the business processes and to safeguard the group’s business and assets
> ISS’s business is conducted in compliance with applicable legislation, regulation and ISS policies
risk assessment
Risks related to the Consolidated Financial Statements are annually identified and assessed based on a materiality test including a risk assessment of the impact of quantitative and qualitative factors. the evaluation of the risks includes an assessment of the likelihood that an error will occur and whether such an error may be material.
the risk of errors is relatively higher for accounting areas that requires management judgement and/or are transac-tions that are generated through complex accounting proc-esses. Accounting areas which requires management judge-ment are described in note 2 to the Consolidated Financial Statements in the section “Critical Accounting estimates and Judgements”.
on an ongoing basis the Audit Committee discusses:> material and relevant new accounting pronouncements
and implementation of such> evaluation of the overall effectiveness of the internal con-
trols for financial reporting> accounting for material legal and tax issues and signifi-
cant accounting estimates.
Control aCtivities
In order to sustain a sound control environment, specific control activities are designed to obtain the desired assur-ance. these measures must ensure that all relevant aspects of a specific area are covered, and that the combination of control activities monitors all relevant aspects of the busi-ness. the control activities are based on the risk assessment made by egM. the purpose of the control activities is to en-sure that material errors in the financial reporting are pre-vented, detected and corrected.
the group has implemented a formalised financial report-ing process that includes:

40 · annual report 2009 | corporate governance
> reporting of financial performance and financial position – all countries must report a full income statement, ba- lance sheet, cash flow statement, portfolio analysis etc. on a monthly basis. Any significant variance from budgets must be explained
> reporting of cash flow forecasts – all countries must report the daily cash flow forecast for a rolling three-month pe-riod. Subsequently, actual figures are continuously moni-tored by ISS’s group treasury department for deviations from the forecasted figures
> budgets and financial plans – all countries must prepare budgets and plans for the following financial year in a pre-defined process and format. Regional management teams review the proposed budgets and plans with the countries
> business reviews – monthly meetings between regional management and country management with a focus on the current performance and state of the business
> full-year forecasts – all countries must update and report their full-year estimates twice a year
> strategy reviews – annual meetings with country mana- gers at which the strategy is discussed, and priorities and plans for the coming year are agreed
> acquisitions and divestments – all acquisition and divest-ment proposals must be presented in a predefined acqui- sition or divestment report and valuation model for ap-proval. Board or Acquisition Committee approval is re-quired for large or strategic acquisitions and divestments
information and rePorting systems
All countries use a standardised financial reporting tool. due to the decentralised structure, various eRp platforms exist within the group. However, the number of different eRp platforms is continuously being reduced.
Information and communication systems to ensure account-ing and internal control compliance have been established, including an Accounting Manual, Reporting Instructions, Budgeting Manual and other relevant guidelines.
monitoring
every month the group’s subsidiaries report financial in-formation and comments on financial developments to the group Finance function. this information is used to prepare Consolidated Financial Statements and reports submitted to the Board and egM. Financial reporting from the subsidiar-ies is controlled on a monthly basis (see control activities).
the country management teams are responsible for ensur-ing that the control environment in each operating country is sufficient to avoid material error in the country's financial performance and financial position reported for consolida-
tion purposes. the regional management teams provide governance of the country operations. In order to ensure that adequate internal control procedures are maintained locally, group Internal Audit visits the country organisations regularly. the group's internal auditors visits take place ac-cording to a plan for the year approved by the Audit Com-mittee and in accordance with the control procedures and standards defined in ISS’s control manual. the findings and conclusions of the visits, which include recommendations on how to improve the control environment, are presented in reports addressed to country and regional managements, representatives of egM and the external auditor. the group's internal auditors perform follow-up reviews to ensure that the recommendations are implemented. the results of the mate-rial internal audit visits are presented to the Audit Commit-tee, and the Audit Committee assesses the results reported and uses this assessment in their assessment of the general control environment and performance and financial posi-tion when reviewing the Internal Audit plan for the coming year.
auditorthe Board nominates the external auditor for election pur-suant to the shareholder’s agreement. the nomination fol-lows an assessment of the competencies, objectivity and in-dependence of the external auditor and the effectiveness of the audit process.
An independent business relationship with the ISS group’s external auditor is essential for the control environment. As part of the safeguards to ensure independence, the external auditor may not be used for certain non-audit services for ISS including, but not limited to, preparation of accounting records and financial statements and recruitment for senior management positions.
the company collaborates with its external auditor at coun-try level and at group level in relation to procedures and internal controls by exchanging internal audit reports and audit reports and by generally sharing relevant knowledge.
All Board members receive the external auditor’s long-form audit reports in connection with the audit of the annual consolidated financial statements and any other long-form audit reports. Auditor reports are discussed in detail in the Audit Committee.
the Board reviews the Annual Report at a Board meeting at-tended by the external auditor. the findings of the external auditor and any major issues arising during the course of the audit are discussed and key accounting principles and audit judgements are reviewed.

corporate governance | annual report 2009 · 41
sacha rossinElli
SWItZeRlAndISS Switzerland offers the full house of Integrated Facility Services and with around 10,000 employees, is one of the largest employers in the country. Sacha Rossinelli maintains the technical installations at uBS in Suglio, Switzer-land. uBS, a global player in the banking industry, is one of ISS Switzerland’s key customers and has nearly 400 branches across the country.

42 · annual report 2009 | board of directors
board of direCtors of iss holding a/s
ole andersen
(1956)
Chairman
Member of the Board since
27 May 2005.
Jointly nominated by eQt and
gS Capital partners.
leif Östling
(1945)
Vice-Chairman
Member of the Board
since 26 october 2005.
Jointly nominated by eQt
and gS Capital partners.
president and Ceo of Scania AB.
john murray allan
(1948)
Member of the Board
since 20 June 2008.
Jointly nominated by eQt
and gS Capital partners.
marcus brennecke
(1961)
Member of the Board
since 27 May 2009.
nominated by eQt.
Senior partner and Head
of the Munich office of
eQt partners.
peter korsholm
(1971)
Member of the Board
since 16 April 2008.
nominated by eQt.
partner and Head of the
Copenhagen office of
eQt partners.
casper von koskull
(1960)
Member of the Board
since 9 december 2009.
nominated by gS Capital
partners. Managing director
of goldman Sachs
International in london.
christoph sander
(1962)
Member of the Board
since 6 April 2006.
Jointly nominated by eQt and
gS Capital partners.
steven sher
(1970)
Member of the Board
since 12 december 2007.
nominated by gS Capital partners.
Managing director for the
principal Investment Area of
goldman Sachs International.
BoARd oF dIReCtoRS
iss boards
the membership of ISS Holding’s Board of directors is identical to that of the Board of directors of ISS equity A/S and ISS A/S (except for elected employee representatives of ISS A/S.)
2 3
76
1
8
42
7
5
1
3
6
5
4
8

executive ManageMent | annual report 2009 · 43
jørgen lindegaard
(1948)
group Chief executive officer.
Head of executive
group Management.
With ISS since 2006.
jakob stausholm
(1968)
group Chief Financial officer.
With ISS since 2008.
jeff gravenhorst
(1962)
group Chief operating officer.
With ISS since 2002.
exeCutive grouP management of iss holding a/s
exeCutIVe MAnAgeMent

44 · annual report 2009 | group ManageMent
Jakob stausholmJeff gravenhorst
Barbara plucnar Jensen (1971)
Head of group treasury
peter Harder thomsen (1971)
Head of group Controlling
Henrik trepka (1963)
Head of group It
luis Andrade (1960)
Regional Ceo
troels Bjerg (1963)
Regional Ceo
Jean-Manuel Bullukian (1964)
Regional Ceo
Jacob götzsche (1967)
Regional Ceo
Hans John oiestad (1955)
Regional Ceo
david openshaw (1949)
Regional Ceo
Martin gaarn thomsen (1970)
Regional Ceo
JØrgen lindegaard
Helle Havgaard (1959)
Head of group Human Resources
Jens ebbe olesen (1962)
Head of group M&A
todd o'neill (1966)
Head of group Strategy and
Business development
Bjørn Raasteen (1964)
group general Counsel
Magnus Åkerberg (1963)
Head of Corporate Clients
gRoup MAnAgeMent
89
7111
13
2
3
10 125
1
2
3
4
5
6
7
8
9
10
12
13
14
15
11
414
15
6

annual report 2009 · 45 45 · annual report 2008
CHIleChile is the largest copper producer in the world. Codelco is the largest mining operator in the world. ISS provides security services to Codelco north division at Minera gaby in the extreme north of Chile in Atacama, one of the driest deserts in the world. the ISS staff work at 3,000 meters above sea level in temperatures ranging from -4ºC to +30ºC during the same day.

46 · annual report 2009 | ManageMent stateMent
MAnAgeMent StAteMent
copEnhagEn, 11 march 2010
the Board of directors and the executive group Manage-ment have today discussed and approved the Annual Report 2009 of ISS Holding A/S. the Annual Report 2009 has been prepared in accordance with International Financial Report-ing Standards (IFRS) as adopted by the eu and additional danish disclosure requirements for annual reports.
In our opinion, the Consolidated Financial Statements and parent Company Financial Statements give a true and fair view of the group’s and the parent Company’s assets, liabili-ties and financial position at 31 december 2009 and of the
ExEcutivE group managEmEnt
ole andersenChairman
leif Östling Vice-Chairman
john murray allan
marcus brennecke peter korsholm casper von koskull
jørgen lindegaardgroup Chief executive officer
jeff gravenhorst group Chief operating officer
jakob stausholm group Chief Financial officer
board of dirEctors
results of the group’s and the parent Company’s operations and cash flows for the financial year 2009. Furthermore, in our opinion the Management’s review gives a fair review of the development and performance of the group’s and the parent Company’s activities and of the group’s and the par-ent Company’s financial position taken as a whole, together with a description of the most significant risks and uncer-tainties that the group and parent Company may face. In addition, the section Capital Structure pages 137-140 gives a fair review of the development of the group’s capital struc-ture.
christoph sander steven sher

independent auditor's report | annual report 2009 · 47
Independent AudItoR'S RepoRt
to the shareholders of iss holding a/sWe have audited the Consolidated Financial Statements and parent Company Financial Statements of ISS Holding A/S for the financial year 1 January - 31 december 2009 (pages 49-133). the Consolidated Financial Statements and parent Company Financial Statements comprise the Income State-ment, Cash Flow Statement, Statement of Financial position, Statement of Comprehensive Income, Statement of Changes in equity and notes to the Financial Statements for the group as well as for the parent company. the Consolidated Financial Statements and parent Company Financial Statements have been prepared in accordance with the International Financial Reporting Standards (IFRS) as adopted by the eu and addi-tional danish disclosure requirements.
In addition to our audit, we have read the Management’s review, pages 7-44 and issued a statement in this regard.
management’s responsibilityManagement is responsible for the preparation and fair presentation of the Consolidated Financial Statements and parent Company Financial Statements in accordance with the International Financial Reporting Standards (IFRS) as adop- ted by the eu and additional danish disclosure requirements for Consolidated Financial Statements and parent Company Financial Statements. this responsibility includes: designing, implementing and maintaining internal control relevant to the preparation and fair presentation of the Consolidated Financial Statements and parent Company Financial State-ments that are free from material misstatement, whether due to fraud or error; selecting and using appropriate ac-counting policies; and making accounting estimates that are reasonable in the circumstances. Further, it is the responsi-bility of Management to prepare and issue a Management’s review that gives a fair review of the development in the group’s and the parent Company’s activities and financial matters, the results for the year and the group’s and the parent Company’s financial position as well as information about material risks and uncertainties affecting the group and the parent Company.
auditor’s responsibilityour responsibility is to express an opinion on the Consoli-dated Financial Statements and parent Company Financial Statements based on our audit. We conducted our audit in accordance with danish and International Standards on Au-diting. those standards require that we comply with ethi-cal requirements, and plan and perform the audit to obtain reasonable assurance regarding whether the Consolidated Financial Statements and parent Company Financial State-ments are free from material misstatement.
An audit involves performing procedures to obtain audit evidence on the amounts and disclosures in the Consoli-dated Financial Statements and parent Company Financial Statements. the procedures selected depend on the audi-tor’s judgement, including the assessment of the risks of material misstatement of the Consolidated Financial State-ments and parent Company Financial Statements, whether due to fraud or error. In making those risk assessments, the auditors consider internal control relevant to the Company’s preparation and fair presentation of the Consolidated Finan-cial Statements and parent Company Financial Statements in order to design audit procedures that are appropriate in the circumstances, but not for the purpose of expressing an opinion on the effectiveness of the Company’s internal con-trol. An audit also includes evaluating the appropriateness of accounting policies used and the reasonableness of ac-counting estimates made by management, as well as evalu-ating the overall presentation of the Consolidated Financial Statements and parent Company Financial Statements.
We believe that the audit evidence we have obtained is suffi-cient and appropriate to provide a basis for our audit opinion.
our audit did not result in any qualification.
opinionIn our opinion, the Consolidated Financial Statements and par-ent Company Financial Statements give a true and fair view of the group’s and the parent Company’s assets, liabilities and fi-nancial position at 31 december 2009 and of the results of the group’s and the parent Company’s operations and cash flows for the financial year then ended in accordance with the In-ternational Financial Reporting Standards (IFRS) as adopted by the eu and additional danish disclosure requirements.
statement on the management’s reviewpursuant to the danish Financial Statements Act, we have read the Management’s review, pages 7-44 in the annual report. We have not performed any additional procedures in addition to the audit of the Consolidated Financial State-ments and parent Company Financial Statements. on this basis, it is our opinion that the information given in the Man-agement’s review is consistent with the Consolidated Finan-cial Statements and parent Company Financial Statements.
KpMg Statsautoriseret RevisionspartnerselskabCopenhagen, 11 March 2010
jesper ridder olsen claus kronbakState Authorised State Authorisedpublic Accountant public Accountant

48 · annual report 2009 | consolidated financial stateMents48 · annual report 2008
FInlAndteliaSonera offers both landline and mobile communications services to business as well as residential customers and employs nearly 27,000 peo-ple. teliaSonera operates in the nordic and Baltic countries, the emerging markets of eurasia, including Russia and turkey, and in Spain. ISS provides teliaSonera Finland with catering, janitorial services, maintenance of out-door areas, maintenance of technical production facilities as well as techni-cal management. Siri Väatäinen works at teliaSonera’s staff restaurant, which serves about 300 meals every day.
siri vÄatÄinEn

consolidated financial stateMents | annual report 2009 · 49
Consolidated inCome statement
1 January – 31 december. Amounts in dKK million
note 2009 2008
3 revenue 69,004 68,829
4, 5 Staff costs (44,781) (44,156)20 Cost of sales (6,044) (6,134)6 other operating expenses (13,437) (13,609)
14, 16 depreciation and amortisation 1) (868) (869)
operating profit before other items 2) 3,874 4,061
7 other income and expenses, net (551) (242)Integration costs (46) (66)
3 operating profit 1) 3,277 3,753
17 Share of result from associates 4 3 8 net finance costs (2,308) (2,731)
profit before tax and goodwill impairment/amortisation of brands and customer contracts 973 1,025
9 Income taxes 3) (588) (531)
profit before goodwill impairment/amortisation of brands and customer contracts 385 494
10, 14, 15 goodwill impairment and write-down (1,246) (399)14 Amortisation of brands and customer contracts 4) (1,129) (1,008)
9, 18 Income tax effect 5) 361 282
net profit/(loss) for the year (1,629) (631)
attributable to:
owners of ISS Holding (1,647) (641)non-controlling interests 18 10
net profit/(loss) for the year (1,629) (631)
1) excluding goodwill impairment and write-down and Amortisation of brands and customer contracts.2) other items comprise other income and expenses, net, Integration costs, goodwill impairment and write-down and Amortisation of brands and customer contracts.3) excluding tax effect of goodwill impairment and write-down and Amortisation of brands and customer contracts.4) Includes customer contract portfolios and related customer relationships.5) Income tax effect of goodwill impairment and write-down and Amortisation of brands and customer contracts.
ConSolIdAted FInAnCIAl StAteMentS

50 · annual report 2009 | consolidated financial stateMents
Consolidated statement of ComPrehensive inCome
1 January – 31 december. Amounts in dKK million
note 2009 2008
net profit/(loss) for the year (1,629) (631)
other comprehensive incomeForeign exchange adj. of subsidiaries and non-controlling interests 364 (792)
35 Fair value adjustment of hedges, net (327) (266)35 Fair value adjustment of hedges, net, transferred to net finance costs 325 (147)29 Actuarial gains/(losses) (45) (182)29 Impact from asset ceiling 18 25 5 Share-based payments 3 5 9 tax regarding other comprehensive income 1 36
other comprehensive income 339 (1,321)
total comprehensive income for the year (1,290) (1,952)
attributable to:
owners of ISS Holding (1,308) (1,961)non-controlling interests 18 9
(1,290) (1,952)

consolidated financial stateMents | annual report 2009 · 51
Consolidated statement of Cash flows
1 January – 31 december. Amounts in dKK million
note 2009 2008
operating profit before other items 3,874 4,061 14, 16 depreciation and amortisation 868 869
11 Changes in working capital (137) 109 Changes in other provisions, pensions and similar obligations (50) (96)payments related to other income and expenses, net (371) (181)payments related to integration costs (58) (65)
23 Income taxes paid, net (394) (363)
cash flow from operating activities 3,732 4,334
12 Acquisition of businesses (914) (2,095)12 divestment of businesses 22 272 13 Investments in intangible assets and property, plant and equipment, net (897) (718)13 Investments in financial assets, net (43) (2)
cash flow from investing activities (1,832) (2,543)
proceeds from borrowings 5,849 2,251 Repayment of borrowings (5,177) (1,310)Interest paid, net (2,205) (2,267)non-controlling interests (14) (22)
cash flow from financing activities (1,547) (1,348)
total cash flow 353 443
Cash and cash equivalents at 1 January 2,961 2,581 total cash flow 353 443 Foreign exchange adjustments 50 (63)
25 cash and cash equivalents at 31 december 3,364 2,961

52 · annual report 2009 | consolidated financial stateMents
Consolidated statement of finanCial Position
At 31 december. Amounts in dKK million
note 2009 2008
assets
14, 15 Intangible assets 35,452 36,001 16 property, plant and equipment 2,004 2,276 17 Investments in associates 21 24 18 deferred tax assets 514 472 19 other financial assets 281 238
total non-current assets 38,272 39,011
20 Inventories 303 264 21 trade receivables 10,130 10,097 22 Contract work in progress 195 182 23 tax receivables 308 228 24 other receivables 1,071 776 25 Securities 97 86 25 Cash and cash equivalents 3,364 2,961 26 Assets held for sale 614 -
total current assets 16,082 14,594
total assets 54,354 53,605
Equity and liabilities
total equity attributable to owners of ISS Holding 2,190 3,498 non-controlling interests 23 35
27 total equity 2,213 3,533
28 long-term debt 28,486 31,210 29 pensions and similar obligations 837 834 18 deferred tax liabilities 2,356 2,498 30 other provisions 379 397
total long-term liabilities 32,058 34,939
28 Short-term debt 5,617 1,279 trade payables 2,624 2,835
23 tax payables 306 123 31 other liabilities 10,734 10,461 30 other provisions 423 435 26 liabilities related to assets held for sale 379 -
total current liabilities 20,083 15,133
total liabilities 52,141 50,072
total equity and liabilities 54,354 53,605

consolidated financial stateMents | annual report 2009 · 53
Consolidated statement of Changes in eQuity
At 31 december. Amounts in dKK million
attributable to owners of iss holding
2009share
capitalretained earnings
translation reserve
hedging reserve total
non-controlling
intereststotal
equity
Equity at 1 january 100 4,729 (1,047) (284) 3,498 35 3,533
total comprehensive income for the year - (1,668) 364 (4) (1,308) 18 (1,290)Impact from acquired and divested companies, net - - - - - (16) (16)dividends paid - - - - - (14) (14)
total changes in equity - (1,668) 364 (4) (1,308) (12) (1,320)
Equity at 31 december 100 3,061 (683) (288) 2,190 23 2,213
2008
Equity at 1 january 100 5,486 (256) 129 5,459 59 5,518
total comprehensive income for the year - (757) (791) (413) (1,961) 9 (1,952)Impact from acquired and divested companies, net - - - - - (11) (11)dividends paid - - - - - (22) (22)
total changes in equity - (757) (791) (413) (1,961) (24) (1,985)
Equity at 31 december 100 4,729 (1,047) (284) 3,498 35 3,533
translation reservethe translation reserve comprises all foreign currency differences arising from the translation of the financial statements of foreign subsidiaries/joint ventures and investments in associates as well as from the translation of long-term balances which are considered part of the investment in subsidiaries/joint ventures, loans in foreign currency and derivatives hedging net investments in foreign subsidiaries/joint ventures.
hedging reserve the hedging reserve comprises the effective portion of the cumulative net change after tax in fair value of cash flow hedging instruments when the hedged transactions have not yet occurred.
dividendsno dividends have been proposed or declared before the Annual Report was issued.

54 · annual report 2009 | consolidated financial stateMents
notes to the Consolidated finanCial statements
note page
accounting policies1 Significant accounting policies 552 Critical accounting estimates and judgements 65
income statement3 Segment reporting 684 Staff costs 725 Share-based payments 736 Fees to auditors 747 other income and expenses, net 748 net finance costs 759 Income taxes 76
10 goodwill impairment and write-down 77
statement of cash flows11 Changes in working capital 7712 Acquisition and divestment of businesses 7813 Investments in non-current assets 83
statement of financial position14 Intangible assets 8415 Impairment tests 8516 property, plant and equipment 8817 Investments in associates 8818 deferred tax 8919 other financial assets 9120 Inventories 9121 trade receivables 9122 Contract work in progress 9223 tax receivables and tax payables 9324 other receivables 9325 Securities, cash and cash equivalents 9426 Assets and liabilities held for sale 9427 Share capital 9528 Borrowings 9529 pensions and similar obligations 9730 other provisions 10131 other liabilities 102
other32 Contingent liabilities 10233 Financial risk management 10434 Financial assets and liabilities 10735 derivatives 10936 Related parties 11137 Interests in joint ventures 11338 Subsequent events 11339 Subsidiaries, associates, joint ventures and Spes 114

consolidated financial stateMents | annual report 2009 · 55
notes to the Consolidated finanCial statements
the consolidated financial statements of ISS Holding A/S as of and for the year ended 31 december 2009 comprise ISS Holding A/S and its subsidiaries (together referred to as “the group”), jointly control-led entities and associates.
statement of ComPlianCethe consolidated financial statements have been prepared in ac-cordance with International Financial Reporting Standards (IFRS) as adopted by the eu and additional danish disclosure requirements (class C large size) and the statutory order on the adoption of IFRS issued pursuant to the danish Financial Statements Act.
In addition, the consolidated financial statements have been pre-pared in compliance with the IFRSs issued by the IASB.
basis of PreParationthe consolidated financial statements are presented in danish kro-ner (dKK) (rounded to nearest dKK million), which is ISS Holding A/S’s functional currency.
the consolidated financial statements have been prepared on the historical cost basis except for the following assets and liabilities, which are measured at fair value: derivatives, financial instruments designated as fair value through the income statement and financial assets classified as available-for-sale.
non-current assets and disposal groups classified as held for sale are measured at the lower of the carrying amount before the changed classification and fair value less costs to sell.
the accounting policies set out below have been applied consistently to all periods presented in these consolidated financial statements except for the changes as explained below in “Changes in account-ing policies”.
Changes in aCCounting PoliCiesWith effect from 1 January 2009 the group has implemented:
> IAS 1 (revised 2007) “presentation of Financial Statements”; > IAS 23 (revised 2007) “Borrowing Costs”; > IFRS 2 “Share-based payment: Vesting Conditions and Cancella-
tions”;> Amendments to IAS 32 and IAS 1: “puttable Financial Instruments
and obligations Arising on liquidation”;> Amendments to IFRS 1 and IAS 27: “Cost of an investment in a
Subsidiary, Jointly Controlled entity or Associate”;> Amendment to IFRS 7: “Improving disclosures about Financial In-
struments”;> parts of “Improvements to IFRSs May 2008”.
In 2009, IFRIC 15 "Agreement for the Construction of Real estate" and IFRIC 16 "Hedges of net Investments in a Foreign operation" have been approved with different effective dates in the eu than the
corresponding effective dates under IASB. Consequently, the group has early adopted these with effect from 1 January 2009 so that the implementation follows the effective dates under IASB.
the adoption of these Standards and Interpretations did not affect the recognition and measurement. the new Standards and Interpre-tations only resulted in changes to the presentation and disclosure in the notes. Comparative figures have been adjusted accordingly.
IAS 1 "presentation of Financial Statements" introduces the term to-tal comprehensive income, which represents changes in equity dur-ing a period other than those changes resulting from transactions with owners in their capacity as owners. total comprehensive income may be presented in either a single statement of comprehensive income (effectively combining both the income statement and all non-owner changes in equity in a single statement), or in an income statement and a separate statement of comprehensive income. the group has chosen the latter of the two alternatives. Furthermore, changes in equity resulting from transactions with owners must be presented in a separate statement.
IAS 23 “Borrowing Costs” requires capitalisation of borrowing costs directly attributable to the acquisition, construction or production of a qualifying asset as part of the cost of that asset. the group does not have any qualifying assets and consequently the adoption of IAS 23 did not impact the group’s consolidated financial statements.
basis of Consolidationthe consolidated financial statements comprise the parent company ISS Holding A/S and subsidiaries in which ISS Holding A/S has control of financial and operating policies in order to obtain a return or other benefits from its activities. Control is presumed to exist when ISS Holding A/S owns, directly or indirectly, more than 50% of the voting rights of an entity or otherwise has a controlling interest.
special purpose entities (spEs) the group has established a number of Spes with the purpose of raising external funding to the group. the group does not have any direct or indirect shareholdings in these entities. An Spe is consolidated if, based on an evaluation of the substance of its relationship with the group and the Spe’s risk and rewards, the group concludes that it controls the Spe. Spes con-trolled by the group were established under terms that impose strict limitations on the decision-making powers of the Spes’ management and that result in the group receiving the majority of the benefits related to the Spes’ operations and net assets, being exposed to the majority of risks incident to the Spes’ activities, and retaining the majority of the residual or ownership risks related to the Spes or their assets.
associates entities in which the group has a significant influence, but which it does not control, are considered associates. Significant influence is presumed to exist when the group owns directly or indi-rectly more than 20% of the voting rights but less than 50%. When
1. signifiCant aCCounting PoliCies
continues
56 · annual report 2009 | consolidated financial stateMents
1. signifiCant aCCounting PoliCies (Continued)
notes to the Consolidated finanCial statements
assessing whether ISS Holding A/S has control or significant influ-ence, potential voting rights that are exercisable at the reporting date are taken into account. Investments in associates are accounted for using the equity method.
joint ventures the group's interests in jointly controlled entities are regarded as joint ventures and are consolidated proportionally, and the individual accounting entries are recognised in proportion to the ownership share.
A group chart is included on page 114.
the consolidated financial statements have been prepared as a con-solidation of the financial statements of ISS Holding A/S, subsidiaries, Spes and proportionally consolidated entities prepared according to the group's accounting policies. on consolidation, intra-group in-come and expenses, shareholdings, intra-group balances and divi-dends and realised and unrealised gains and losses on intra-group transactions are eliminated. unrealised gains on transactions with associates and proportionally consolidated entities are eliminated in proportion to the group's ownership share of the entity. unrealised losses are eliminated in the same way as unrealised gains, but only to the extent that impairment has not taken place.
Investments in subsidiaries and proportionally consolidated entities are set off against the proportionate share of the subsidiaries’ fair value of identifiable net assets, including recognised contingent li-abilities, at the acquisition date. the accounting items for subsidiaries are included in full in the con-solidated financial statements. the non-controlling interest’s share of the net profit/loss for the year and of the equity of subsidiaries, which are not wholly owned are included in the group’s net profit/loss and equity respectively, but is disclosed separately.
business combinations Acquired businesses or entities formed dur-ing the year are recognised in the consolidated financial statements from the date of acquisition or formation. Businesses which are divested or wound up are recognised in the consolidated income statement until the date of divestment or winding-up. Comparative figures are not restated for businesses acquired, divested or wound up.
In acquisitions where the group obtains control of the acquired busi-ness the purchase method is used. the identifiable assets, liabilities and contingent liabilities of acquired businesses are recognised in the statement of financial position at fair value at the acquisition date. Identifiable intangible assets are recognised if separable or if they arise from contractual or other legal rights, provided that the fair value can be measured reliably. deferred tax related to fair value adjustments is recognised.
on initial recognition non-controlling interests are recognised in
the consolidated financial statements at the proportionate share of identifiable assets, liabilities and contingent liabilities of the ac-quired business.
the acquisition date is the date when the group effectively obtains control of the acquired business.
Any excess of the cost of acquisition over the fair value of identi-fiable assets, liabilities and contingent liabilities acquired is recog-nised as goodwill under intangible assets. goodwill is not amortised but tested for impairment annually. the first impairment test is per-formed no later than at the end of the acquisition year. upon acqui-sition, goodwill is allocated to the cash-generating units, which sub-sequently form the basis for the impairment test. goodwill and fair value adjustments in connection with the acquisition of a foreign en-tity with a functional currency other than the presentation currency used in the group are treated as assets and liabilities belonging to the foreign entity and translated into the foreign entity’s functional currency at the exchange rate at the transaction date. negative dif-ferences (negative goodwill) are recognised in the income statement at the acquisition date.
the cost of a business combination comprises the fair value of the consideration agreed upon and costs directly attributable to the ac-quisition. If parts of the consideration are conditional upon future events, these parts are included in the cost to the extent that the events are probable and the consideration can be measured reli-ably.
If uncertainties regarding measurement of acquired identifiable as-sets, liabilities and contingent liabilities exist at the acquisition date, initial recognition will take place on the basis of provisionally de-termined fair values. If identifiable assets, liabilities and contingent liabilities are subsequently determined to have a different fair value at the acquisition date from that first assumed, goodwill is adjusted up until 12 months after the acquisition. the effect of the adjust-ments is recognised in the opening balance of equity and the com-parative figures are restated accordingly. Subsequently, goodwill is only adjusted as a result of changes in estimates of contingent con-siderations, except in cases of material error. However, subsequent realisation of the acquired entity’s deferred tax assets not recognised at the acquisition date will require recognition of the tax benefit in the income statement and simultaneous write-down of the carrying amount of goodwill to the amount which would have been recog-nised if the deferred tax asset had been recognised as an identifiable asset at the acquisition date.
gains or losses on the divestment or winding-up of subsidiaries, as-sociates or joint ventures are measured as the difference between the sales or winding-up amount adjusted for directly related divest-ment or winding-up costs and the carrying amount of the net assets at the time of disposal or winding-up including any carrying amount of goodwill. Accumulated exchange rate adjustments on divested

consolidated financial stateMents | annual report 2009 · 57
or wound up subsidiaries, associates or joint ventures recognised in equity are included in the income statement under net finance costs at the time of divestment or winding-up.
foreign currency For each of the reporting entities in the group, a functional currency is determined. the functional currency is the primary currency used for the reporting entity’s operations. transac-tions denominated in currencies other than the functional currency are considered transactions denominated in foreign currencies.
on initial recognition, transactions denominated in foreign currencies are translated to the functional currency at the exchange rates at the transaction date. Foreign exchange differences arising between the exchange rates at the transaction date and at the date of payment are recognised in the income statement under net finance costs.
Receivables, payables and other monetary items denominated in for-eign currencies are translated at the exchange rates at the reporting date. the difference between the exchange rates at the reporting date and at the date at which the receivable or payable arose or the exchange rate in the latest annual report is recognised in the income statement under net finance costs.
on recognition in the consolidated financial statements of entities with a functional currency other than the presentation currency of ISS Holding A/S (dKK), the income statements and statements of cash flows are translated at the exchange rates at the transaction date and the statements of financial position are translated at the ex-change rates at the reporting date. An average exchange rate for the month is used as the exchange rate at the transaction date to the extent that this does not significantly deviate from the exchange rate at the transaction date. Foreign exchange differences arising on translation of the opening balance of equity of foreign entities at the exchange rates at the reporting date and on translation of the income statements from the exchange rates at the transaction date to the exchange rates at the reporting date are recognised directly in equity under a separate translation reserve.
Foreign exchange adjustment of balances with foreign entities which are considered part of the investment in the entity is recog-nised in the consolidated financial statements directly in equity. For-eign exchange gains and losses on the part of loans and derivative financial instruments which are designated as hedges of investments in foreign entities with a functional currency different from ISS Holding A/S’s and which effectively hedge against corresponding for-eign exchange gains and losses on the investment in the entity are also recognised directly in a separate translation reserve in equity.
on recognition in the consolidated financial statements of associates with a functional currency other than the presentation currency of ISS Holding A/S, the share of profit/loss for the year is translated at average exchange rates and the share of equity, including goodwill, is translated at the exchange rates at the reporting date. Foreign
exchange differences arising on the translation of the share of the opening balance of equity of foreign associates at the exchange rates at the reporting date, and on translation of the share of profit/loss for the year from average exchange rates to the exchange rates at the reporting date, are recognised directly in a separate transla-tion reserve in equity.
on complete or partial disposal of a foreign entity or on repayment of balances which constitute part of the net investment in the for-eign entity, the share of the cumulative amount of the exchange dif-ferences recognised directly in equity relating to that foreign entity is recognised in the income statement under net finance costs at the time of divestment or winding-up.
inCome statementpresentation the income statement is presented in accordance with the "nature of expense" method. goodwill impairment and write-down and Amortisation of brands and customer contracts as well as the Income tax effect hereof are presented in separate line items after operating profit. this income statement presentation is consid-ered to reflect the group's profitability most appropriately.
revenue from rendering services is recognised in the income state-ment in proportion to the stage of completion of the transaction at the reporting date. Revenue is recognised when the amount of revenue can be measured reliably, the recovery of the consideration is probable, the stage of completion can be measured reliably and the costs incurred for the transaction and the costs to complete the transaction can be measured reliably.
In assessing whether revenue should be reported on a gross or a net basis (i.e. net of related costs), the group considers whether it: (i) is the primary obligor in the arrangement; (ii) has the general inventory risk; (iii) has latitude in establishing price; (iv) changes the product or performs part of the service; (v) has discretion in supplier selection; (vi) is involved in the determination of product or service specifications; (vii) has physical loss inventory risk; or (viii) carries the credit risk. If these assumptions are fulfilled revenue is reported on a gross basis.
Contract revenue is recognised in the income statement in propor-tion to the stage of completion of the contract when the outcome of the contract can be estimated reliably. Contract revenue includes the initial amount agreed in the contract plus any variations in the contract work, claims and incentive payments, to the extent that it is probable that they will result in revenue and can be measured reli-ably. Contract expenses are recognised as incurred unless they create an asset related to future contract activity. When the outcome of a contract can not be measured reliably, contract revenue is recog-nised only to the extent of contract costs incurred that are likely to be recoverable. An expected loss on a contract is recognised immedi-ately in the income statement.
Revenue is measured at fair value of the consideration received less
1. signifiCant aCCounting PoliCies (Continued)
notes to the Consolidated finanCial statements
continuescontinues

58 · annual report 2009 | consolidated financial stateMents
VAt and duties as well as price and quantity discounts.
government grants mainly comprise wage subventions and invest-ment grants.
grants that compensate the group for expenses incurred are recog-nised directly in the income statement on a systematic basis in the same periods in which the expenses are incurred.
grants for acquisition of assets are recognised in the statement of financial position as a reduction of the cost of the asset and trans-ferred to the income statement on a systematic basis over the useful life of the asset.
staff costs comprises salaries and wages, pensions, social security ex-penses and other employee related expenses.
cost of sales comprises material consumption related to the recog-nised revenue, e.g. chemicals, cloths, uniforms etc.
other operating expenses includes expenses related to the opera-tion of service equipment and other non-current assets, external assistance as well as other selling, distribution and administrative expenses, including expenses related to marketing, transportation, operating leases, subcontractors, audit, legal assistance, realised losses and loss provisions on receivables etc.
depreciation and amortisation includes depreciation and amortisa-tion of intangible and tangible assets excluding goodwill impairment and write-down and Amortisation of brands and customer contracts, which are presented in separate line items after profit before good-will impairment/amortisation of brands and customer contracts.
other income and expenses, net consists of income and expenses, both recurring and non-recurring, that the group does not consider to be part of normal ordinary operations, such as gains and losses arising from divestments, remeasurement of disposal groups clas-sified as held for sale, the winding-up of operations, disposals of property, restructurings and certain acquisition related costs, etc.
integration costs include costs regarding the acquiring group com-pany and the acquired business that are a consequence of the inte-gration. Integration costs include costs of compensating employees for termination of their employment, closing facilities, and termina-tion of subscriptions and agreements.
share of result from associates comprises the share of the associates’ result after tax and non-controlling interests. Share of result from associates is recognised in the income statement after elimination of the proportionate share of unrealised intra-group profits/losses.
net finance costs comprises interest income and expense, gains and losses on securities, foreign exchange gains and losses, amortisation of financial assets and liabilities, including finance lease and unwind-
ing of discount. Additionally realised and unrealised gains and losses on fair value hedges (currency swaps) and derivatives which are not designated as hedging arrangements are included.
income taxes consists of current tax and changes in deferred tax. the tax expense relating to the profit/loss for the year is recognised in the income statement and the tax expense relating to items recog-nised directly in equity is recognised directly in equity.
ISS Holding A/S is jointly taxed with all danish resident subsidiar-ies. the danish income tax payable is allocated between the jointly taxed danish companies based on their proportion of taxable in-come (full absorption including reimbursement of tax deficits). the jointly taxed companies are included in the danish tax on account scheme. Additions, deductions and allowances are recognised under net finance costs.
goodwill impairment and write-down includes impairment losses arising from impairment tests as well as write-down of goodwill in connection with divestments and classification of disposal groups as held for sale.
amortisation of brands and customer contracts includes amortisa-tion of acquired brands and acquired customer contract portfolios and related customer relationships, impairment losses arising from impairment tests and write-down in connection with divestments and classification of disposal groups as held for sale.
income tax effect of goodwill impairment and write-down and amortisation of brands and customer contracts is presented in a sep-arate line item in connection with these two line items.
statement of Cash flowsthe statement of cash flows shows the group's cash flows from op-erating, investing and financing activities for the year, the change in its cash position during the year as well as the group's cash position at the beginning and the end of the year.
the liquidity effect of acquisition and divestment of businesses is shown separately under Cash flow from investing activities. the statement of cash flows includes cash flows from acquired businesses from the date of acquisition and cash flows from divested businesses until the date of divestment.
cash flow from operating activities is calculated using the indirect method and comprises operating profit before other items adjusted for non-cash items, changes in working capital and provisions and payments regarding income taxes, other income and expenses and integration costs.
cash flow from investing activities comprises payments in connec-tion with acquisition and divestment of businesses and the purchase and sale of intangible assets, property, plant and equipment and other non-current assets as well as acquisition and disposal of securi-
notes to the Consolidated finanCial statements
1. signifiCant aCCounting PoliCies (Continued)
continues

consolidated financial stateMents | annual report 2009 · 59
ties not recognised as cash and cash equivalents.
Acquisition of assets by means of finance leases are treated as non-cash transactions.
cash flow from financing activities comprises proceeds from and re-payment of loans, dividends, proceeds from share issues, purchase and sale of treasury shares, cash flow related to derivatives hedging net investments and dividends to non-controlling interests. Further-more, interest paid and received is included in cash flow from financ-ing activities as this better reflects the distinction between operating and financing activities following the acquisition of ISS A/S by ISS Holding A/S.
Cash flows relating to assets held under finance leases are recog-nised as payment of interest and repayment of debt.
cash and cash equivalents comprises cash and marketable securities, with maturity of less than three months that are readily convertible to known amounts of cash and that are subject to an insignificant risk of changes in value.
Cash flows in currencies other than the functional currency are trans-lated using average exchange rates unless these deviate significantly from the exchange rate at the transaction date.
statement of finanCial Positiongoodwill is initially recognised in the statement of financial position at cost as described under “Business combinations”. Subsequently, goodwill is measured at cost less accumulated impairment losses and write-downs. goodwill is not amortised, but tested for impairment annually and whenever there is an indication that goodwill may be impaired.
the carrying amount of goodwill is allocated to the group’s cash-generating units at the acquisition date. Identification of cash-gen-erating units is based on the management structure and internal financial control, i.e. generally equal to country level.
An impairment loss is recognised whenever the carrying amount of a cash-generating unit exceeds its recoverable amount. the recover-able amount is calculated as the higher of net selling price and value in use. In assessing value in use the estimated future cash flows are discounted to their present value.
brands Acquisition related brands are recognised at fair value at the date of acquisition. Subsequently, acquired brands with indefi-nite useful lives are measured at historical cost less any accumulat-ed impairment losses while acquired brands with finite useful lives are measured at historical cost less accumulated amortisation and any accumulated impairment losses. Amortisation is provided on a straight-line basis over the expected useful life of the brand, which is usually in the range 2-5 years.
A deferred tax liability is calculated at the local tax rate on the dif-ference between the carrying amount and the tax value. the ini-tial recognition of this deferred tax liability increases the amount of goodwill.
the value of brands is allocated to cash generating units and tested for impairment as part of the annual impairment test of goodwill.
customer contract portfolios and related customer relationships ("customer contracts") Acquisition related customer contracts are recognised at fair value at the date of acquisition and subsequently carried at cost less accumulated amortisation and any accumulated impairment losses. the value is amortised based on the churn rate of the acquired portfolio using the declining balance method. this churn rate is calculated on a contract by contract basis and has his-torically averaged approximately 12% to 13% annually. In certain cases the value of customer contracts is amortised on a straight line basis based on the legal duration of the acquired contract.
A deferred tax liability is calculated at the local tax rate on the dif-ference between the carrying amount and the tax value. the ini-tial recognition of this deferred tax liability increases the amount of goodwill.
the value of customer contracts is allocated to cash generating units and tested for impairment as part of the annual impairment test of goodwill.
software and other intangible assets are measured at cost less ac-cumulated amortisation and write-downs.
When measuring the value of software developed for internal use, external costs to consultants and software as well as internal direct and indirect costs related to the development are capitalised. other development costs for which it cannot be rendered probable that future economic benefits will flow to the group are recognised in the income statement as and when incurred.
Amortisation is provided on a straight-line basis over the expected useful lives of the assets. the amortisation methods and useful lives are reassessed annually. When changing the amortisation period due to a change in the useful life, the effect on the amortisation is recog-nised prospectively as a change in accounting estimates.
software and other intangible assets Expected useful lifeSoftware Max. of 5-10 yearsother intangible assets Max. of 5-10 years
property, plant and equipment is measured at cost less accumulated depreciation and write-down.
Cost of assets comprises the purchase price and any costs directly attributable to bringing the asset to the location and condition nec-essary for it to operate in the manner intended. the net present
notes to the Consolidated finanCial statements
1. signifiCant aCCounting PoliCies (Continued)
continues

60 · annual report 2009 | consolidated financial stateMents
notes to the Consolidated finanCial statements
1. signifiCant aCCounting PoliCies (Continued)
value of estimated liabilities related to dismantling and removing the asset and restoring the site on which the asset is located is added to the cost of the asset to the extent that this cost is recognised as a provision.
the cost of assets held under finance leases is stated at the lower of fair value of the asset and the net present value of future minimum lease payments. When calculating the net present value, the interest rate implicit in the lease or an approximated rate is applied as the discount rate.
Subsequent costs of replacing part of an item are recognised as an asset if it is probable that the future economic benefits embodied by the item will flow to the group. the remaining carrying amount of the replaced item is de-recognised in the statement of financial position and transferred to the income statement. All other costs for common repairs and maintenance are recognised in the income statement as and when incurred.
property, plant and equipment, including assets held under finance leases are depreciated on a straight-line basis over the expected use-ful lives of the assets. the expected useful lives are as follows:
tangible assets Expected useful lifeBuildings 20-40 yearsleasehold improvements (the lease term) 8-12 yearsplant and equipment 3-10 years
land is not depreciated.
depreciation is calculated over the depreciable amount, which is the cost of an asset less its residual value. the residual value is deter-mined at the acquisition date and reassessed annually. If the residual value exceeds the carrying amount depreciation is discontinued.
When changing the depreciation period or the residual value, the effect on the depreciation is recognised prospectively as a change in accounting estimates.
gains and losses arising on the disposal or retirement of non-current assets are measured as the difference between the selling price less direct sales costs and the net carrying amount, and are recognised in the income statement under other operating expenses in the year of sale, except gains and losses arising on disposals of property, which are recognised under other income and expenses, net.
investments in associates are recognised in accordance with the eq-uity method and measured at the proportionate share of the enti-ties’ net asset values calculated in accordance with the group’s ac-counting policies minus or plus the proportionate share of unrealised intra-group profits and losses plus the carrying amount of goodwill.
Investments in associates with a negative net asset value are measured at zero. If the group has a legal or constructive obligation to cover a
deficit in the associate, the deficit is recognised under provisions.
Receivables from associates are measured at amortised cost. A provi-sion is made for doubtful debt.
other financial assets Costs related to tenders for public offers for ppp (public private partnership)/pFI (private Finance Initiative) con-tracts are recognised in the income statement as incurred. If the group is awarded status as preferred bidder, directly attributable costs and investments from that date, if any, are recognised under other financial assets. For ppp/pFI contracts awarded, the costs are amortised over the term of the contract. If the group is not awarded the contract, all costs are recognised in the income statement.
impairment of non-current assets goodwill and brands with an in-definite useful life are subject to annual impairment tests, initially before the end of the acquisition year.
the carrying amount of goodwill is tested for impairment together with the other non-current assets in the cash-generating unit to which goodwill is allocated and written down to the recoverable amount through the income statement if the carrying amount is higher. the recoverable amount is generally calculated as the present value of the expected future cash flows (value in use) from the cash-generating unit to which goodwill is allocated. Impairment of good-will is recognised in a separate line item in the income statement.
deferred tax assets are subject to impairment tests annually and recognised only to the extent that it is probable that they will be utilised.
the carrying amount of other non-current assets is tested annually for indications of impairment. If such an indication exists, the recov-erable amount of the asset is determined. the recoverable amount is the higher of the fair value of the asset less anticipated costs of disposal and its value in use. the value in use is calculated as the present value of expected future cash flows from the asset or the cash-generating unit to which the asset belongs.
An impairment loss is recognised if the carrying amount of an asset or its cash-generating unit exceeds its estimated recoverable amount. Impairment losses are recognised in the income statement.
An impairment loss in respect of goodwill is not reversed. In respect of other assets, impairment losses are only reversed if there has been a change in the estimates used to determine the recoverable amount. An impairment loss is reversed only to the extent that the asset’s carrying amount does not exceed the carrying amount that would have been determined, net of depreciation and amortisation, if no impairment loss had been recognised.
inventories are measured at the lower of cost under the FIFo princi-ple and net realisable value.
continues

consolidated financial stateMents | annual report 2009 · 61
notes to the Consolidated finanCial statements
1. signifiCant aCCounting PoliCies (Continued)
Finished goods and work in progress are measured at the lower of cost plus attributable overheads and net realisable value. the cost of raw materials and supplies includes the purchase price plus costs directly related to the purchase.
net realisable value is the estimated selling price less costs of com-pletion and selling costs and is determined taking into account mar-ketability, obsolescence and development in expected sales price.
receivables are measured at amortised cost less a provision for doubtful debt. A provision for doubtful debt is recognised when objective evidence indicates that a receivable or a portfolio of re-ceivables is impaired. objective evidence of impairment can include default or delinquency of a debtor, restructuring of an amount due to the group on terms that would not otherwise be considered or indications that a debtor will enter bankruptcy.
the group considers evidence of impairment at both a specific re-ceivable and portfolio level. All individually significant receivables are assessed for specific impairment. Receivables, that are found not to be specifically impaired, are collectively assessed for impairment on portfolio level by grouping together receivables with similar risk characteristics.
In assessing collective impairment the group uses historical trends of the probability of default, timing of recoveries and the amount of loss incurred, adjusted for management’s judgement as to whether current economic and credit conditions are such that the actual losses are likely to be greater or less than suggested by historical trends.
provision for doubtful debt is calculated as the difference between the carrying amount of the receivables and the realisable value, in-cluding the expected net realisable value of any collateral received. provisions and realised losses during the year are recognised under other operating expenses.
contract work in progress is measured at the contract revenue of the work completed less progress billings and anticipated losses.
the contract revenue is calculated based on the stage of completion at the reporting date and the total contract revenue to be received for each individual contract. the stage of completion is determined on the basis of an assessment of the work performed, which is meas-ured as the proportion of contract costs incurred for work performed on each individual contract relative to the total estimated contract costs.
When it is probable that the total contract costs will exceed the total contract revenue, the anticipated loss on the contract is immediately recognised as an expense and a provision.
When the outcome of a contract cannot be determined reliably, the realisable value is measured as the contract costs incurred that are likely to be recovered.
Where the realisable value of work performed exceeds progress bill-ings and anticipated losses, the excess is recognised under Contract work in progress. If progress billings and anticipated losses exceed the realisable value of a construction contract, the deficit is recog-nised under other liabilities.
prepayments from customers are recognised under other liabilities.
Costs relating to sales work and securing contracts are recognised in the income statement as incurred.
securities that are designated as fair value through the income state-ment are measured at fair value at the reporting date, with any re-sulting gains or losses recognised in the income statement.
Equitytranslation reserve the translation reserve comprises all foreign ex-change differences arising from the translation of financial state-ments of foreign subsidiaries/joint ventures and investments in as-sociates as well as from the translation of long-term balances which are considered part of the investment in subsidiaries/joint ventures, loans in foreign currency and derivatives hedging net investments in foreign subsidiaries/joint ventures.
on complete or partial disposal of net investments in foreign sub-sidiaries, joint ventures and associates, the foreign exchange adjust-ments are recognised in the income statement.
hedging reserve the hedging reserve comprises the effective portion of the cumulative net change after tax in the fair value of cash flow hedging instruments which fulfil the criteria for hedging of future cash flows, when the hedged transactions have not yet occurred.
treasury shares proceeds related to the acquisition or disposal of treasury shares are recognised directly in equity.
dividends proposed are recognised as a liability at the date when they are adopted at the Annual general Meeting (declaration date).
Interim dividends are recognised as a liability at the date when the decision to pay interim dividend is made.
retirement benefit obligations and similar obligations the group has entered into retirement benefit schemes and similar arrangements with the majority of the group’s employees.
Contributions to defined contribution plans are recognised in the income statement in the period to which they relate. Any contribu-tions outstanding are recognised in the statement of financial posi-tion as other liabilities.
For defined benefit plans an annual actuarial calculation (the pro-jected unit Credit Method) is made of the present value of future benefits payable under the plan. the present value is determined
continues

62 · annual report 2009 | consolidated financial stateMents
notes to the Consolidated finanCial statements
1. signifiCant aCCounting PoliCies (Continued)
on the basis of assumptions about the future development in vari-ables such as salary levels, interest rates, inflation and mortality. the present value is determined only for benefits earned by employees from their employment with the group. the actuarial present value less the fair value of any plan assets is recognised in the statement of financial position under pensions and similar obligations.
pension costs for the year are recognised in the income statement on the basis of actuarial estimates and financial expectations at the beginning of the year. differences between the expected develop-ment in pension assets and liabilities and the realised amounts at the end of the year are designated actuarial gains or losses and are recognised directly in equity.
If changes in benefits relating to services rendered by employees in previous years result in changes in the actuarial present value, the changes are recognised as historical costs. Historical costs are recog-nised immediately if employees have already earned the changed benefits. If employees have not earned the benefits, the historical costs are recognised in the income statement over the period in which the changed benefits are earned by the employees.
If a pension plan constitutes a net asset, the asset is only recognised to the extent that it represents future refunds from the plan, or it will lead to reductions in future contributions to the plan.
Interest on defined benefit plans and the expected return on plan assets are recognised under Staff costs.
other long-term employee benefits are recognised similarly based on an actuarial calculation. All actuarial gains and losses are recog-nised in the income statement immediately under Staff costs. other long-term employee benefits comprise jubilee benefits, long-service or sabbatical leave etc.
share-based payments the value of services received in exchange for granted warrants is measured at the fair value of the these war-rants.
the fair value of equity-settled programmes is measured at grant date and recognised in the income statement under other income and expenses, net over the vesting period with a corresponding in-crease in equity.
the fair value of the warrants granted is measured using the Black-Scholes option pricing model based on the terms and conditions on which they were granted. Service and non-market vesting conditions are not taken into account when estimating the fair value, but are considered when estimating the number of warrants expected to vest.
At each reporting date, the group revises the estimate of number of warrants expected to vest. the impact of this revision, if any, is rec-ognised in the income statement, and a corresponding adjustment is
made to equity over the remaining vesting period. Accordingly, total recognition is based on the number of warrants ultimately vested. Adjustments relating to prior years are included in the income state-ment in the year of adjustment.
current tax receivable/payable and deferred tax Current tax payable and receivable is recognised in the statement of financial position as tax computed on the taxable income for the year, adjusted for tax on the taxable income for previous years and for tax paid on account.
deferred tax is measured in accordance with the liability method and comprises all temporary differences between accounting and tax values of assets and liabilities. However, deferred tax is not rec-ognised on temporary differences relating to goodwill which is not deductible for tax purposes and on office premises and other items where temporary differences, apart from business combinations, arose at the time of acquisition without affecting either profit/loss for the year or taxable income. Where alternative taxation rules can be applied to determine the tax base, deferred tax is measured ac-cording to management’s intended use of the asset or settlement of the liability, respectively.
deferred tax assets, including the tax base of tax losses carried for-ward, are recognised under non-current assets at the expected value of their utilisation: either as a set-off against tax on future income or as a set-off against deferred tax liabilities in the same legal tax entity and jurisdiction.
deferred tax assets and liabilities are offset if the group has a legal right to offset current tax assets and tax liabilities or intends to settle current tax assets and tax liabilities on a net basis or to realise the assets and settle the liabilities simultaneously.
deferred tax is adjusted for elimination of unrealised intra-group profits and losses.
deferred tax is measured according to the taxation rules and tax rates in the respective countries applicable at the reporting date when the deferred tax is expected to be realised as current tax. the change in deferred tax as a result of changes in tax rates is recog-nised in the income statement.
other provisions comprise obligations concerning legal cases, self- insurance, acquisition and integration costs, contingent liabilities re-lated to acquisitions, dismantling costs and various other operational issues. provisions are recognised if the group, as a result of a past event has a present legal or constructive obligation that can be esti-mated reliably, and it is probable that an outflow of economic bene-fits will be required to settle the obligation. the amount recognised as a provision is management’s best estimate of the amount required to settle the obligation.
When measuring provisions, the costs required to settle the obliga-tion are discounted if this significantly impacts the measurement of
continues

consolidated financial stateMents | annual report 2009 · 63
notes to the Consolidated finanCial statements
1. signifiCant aCCounting PoliCies (Continued)
the liability. the entity’s average borrowing rate is used as discount rate. the unwinding of discount is recognised under net finance costs.
Restructuring costs are recognised under other provisions when a detailed, formal restructuring plan is announced to the affected par-ties on or before the reporting date. on acquisition of businesses, restructuring provisions in the acquiree are only included in good-will when the acquiree has a restructuring liability at the acquisition date.
A provision for onerous contracts is recognised when the expected benefits to be derived by the group from a contract are lower than the unavoidable costs of meeting the obligations under the contract.
When the group has a legal obligation to dismantle or remove an asset or restore a site or rented facilities when vacated, a provision is recognised corresponding to the present value of expected future costs. the present value of the obligation is included in the cost of the relevant tangible asset and depreciated accordingly.
financial liabilities are recognised at the date of borrowing at the amount of proceeds received less related transaction costs paid. Sub-sequently, financial liabilities are measured at amortised cost using the effective interest method. Any difference between the proceeds initially received and the nominal value is recognised in the income statement under net finance costs over the term of the loan.
Financial liabilities also include the capitalised residual obligation on finance leases, which are measured at amortised cost.
leasing For accounting purposes lease obligations are divided into finance leases and operating leases.
A finance lease is a lease that transfers substantially all risks and re-wards incident to ownership to the lessee. other leases are classified as operating leases.
the accounting treatment of assets held under a finance lease and the related obligation are described under property, plant and equip-ment and Financial liabilities, respectively.
payments made under operating leases are recognised on a straight-line basis over the term of the lease.
derivative financial instruments are recognised in the statement of financial position on the transaction date and measured at fair value. positive and negative fair values of derivative financial instru-ments are included in other receivables and payables, respectively. positive and negative values are only offset when the group has the legal right and the intention to settle several financial instruments net. Fair values of derivative financial instruments are calculated on the basis of current market data and according to generally accepted valuation methods.
Changes in the fair value of derivative financial instruments des-ignated as and qualifying for recognition as a fair value hedge of re cognised assets and liabilities are recognised in the income state-ment together with changes in the value of the hedged asset or lia-bility as far as the hedged portion is concerned. Hedging of future cash flows in accordance with a firm commitment, except for foreign currency hedges, is treated as a fair value hedge of a recognised as-set or liability.
Changes in the portion of the fair value of derivative financial instru-ments designated as and qualifying as a cash flow hedge, and which effectively hedges changes in the value of the hedged item, are re-cognised in equity in a separate hedging reserve until the hedged transaction is realised. At this time, gains or losses concerning such hedging transactions are transferred from equity and recognised un-der the same line item as the hedged item.
For derivative financial instruments that do not qualify for hedge accounting, changes in fair value are recognised in the income state-ment under net finance costs.
assets held for sale comprises non-current assets and disposal groups held for sale. A disposal group is defined as a group of assets to be disposed of by sale or otherwise together as a group in a single trans-action. liabilities relating to assets held for sale are those directly as-sociated with the assets that will be transferred in the transaction. Assets are classified as held for sale when the carrying amount of the assets are expected to primarily be recovered through a sale within 12 months in accordance with a formal plan rather than through continuing use.
Immediately before classification as held for sale, the assets or dis-posal groups are remeasured in accordance with the group's ac-counting policies. Assets held for sale are subsequently recognised at the lower of the carrying amount and fair value less costs to sell. Assets held for sale are not amortised or depreciated.
Impairment losses on initial classification as held for sale, and sub-sequent gains and losses on remeasurement are recognised in the income statement. gains and losses are disclosed in the notes.
Assets held for sale and related liabilities are presented in separate lines in the statement of financial position and the main elements are specified in the notes to the consolidated financial statements.
presentation of discontinued operations discontinued operations comprises a component of the group's business that represent a separate major line of business or geographical area of which the operations and cash flows can be clearly distinguished, i.e. as a mini-mum a cash-generating unit. Classification as discontinued opera-tion occurs upon disposal or when the operation meets the criteria to be classified as held for sale. the profit or loss is separated in the income statement, assets and related liabilities are separated in the statement of financial position, and the cash flows from operating,
continues

64 · annual report 2009 | consolidated financial stateMents
notes to the Consolidated finanCial statements
1. signifiCant aCCounting PoliCies (Continued)
investing and financing activities are disclosed in the notes to the consolidated financial statements. When an operation is classified as discontinued operation, the comparative income statement is re-presented as if the operation had been discontinued from the begin-ning of the comparative period.
segment rePortingthe group's reportable segments have been identified based on the group's internal management reporting. operations are managed based on a geographical structure in which countries are grouped into 7 regions representing the group's reportable segments. the regions have been identified based on a key principle of grouping countries that share market conditions and cultures.
the accounting policies of the reportable segments are the same as the group's accounting policies described above. Segment revenue, costs, assets and liabilities comprise items that can be directly re-ferred to the individual segments. unallocated items mainly consist of revenue, costs, assets and liabilities relating to the group's Corpo-rate functions as well as net finance costs and Income taxes.
For IFRS 8 purposes, segment profit has been identified as operating profit (before goodwill impairment and write-down and Amortisa-tion of brands and customer contracts). Segment assets and segment liabilities have been identified as total assets and total liabilities, respectively.
When presenting geographical information segment revenue and non-current assets are based on the geographical location of the in-dividual subsidiary from which the sales transaction originates.
new standards and interPretations not yet imPlementedIASB has published the following new standards, amendments to existing standards and interpretations that are not yet mandatory for the preparation of the consolidated financial statements of the group for the year ended 31 december 2009:
> IFRS 3 (revised) “Business Combinations”;> Amendments to IAS 27 “Consolidated and Separate Financial
Statements”;> Amendments to IAS 32 “Financial Instruments: presentation”;> Amendments to IAS 39 “Financial Instruments: Recognition and
Measurement”;> Amendments to IFRIC 9 “Reassessment of embedded deriva-
tives”;> IFRIC 17 “distributions of non-cash Assets to owners”; > IFRIC 18 “transfers of Assets from Customers”;> parts of "Improvements to IFRSs May 2008".
In addition the following standards are published by IASB, but not yet adopted by the eu:
> Amendments to IFRS 1 “First-time Adoption of International Fi-nancial Reporting Standards”;
> Amendments to IFRS 2 “Share-based payment”;> Improvements to IFRS (April 2009);> IFRIC 19 “extinguishing Financial liabilities with equity Instru-
ments”;> Amendments to IFRIC 14 “IAS 19 - the limit on a defined Benefit
Asset, Minimum Funding Requirements and their Interaction”;> Revised IFRS 9 “Financial Instruments (replacement of IAS 39)
project”;> Revised IAS 24 “Related party disclosures”.
the group expects to adopt the new standards and interpretations when they become mandatory. the standards and interpretations that are approved with different effective dates in the eu than the corresponding effective dates under IASB will be early adopted so that the implementation follows the effective dates under IASB.
IFRS 3 (Revised) "Business Combinations" (and the simultaneous amendment of IAS 27) is effective for annual periods beginning on or after 1 July 2009. the standard incorporates a number of chang-es of which the following are expected to be most relevant to the group's operations:
> Contingent consideration will be measured at fair value at the acquisition date, with subsequent changes therein recognised in the income statement
> Acquisition costs, other than share and debt issue costs, will be expensed as incurred.
the group does not expect to apply the possibility of recognising goodwill related to any non-controlling interest of acquired busi-nesses. However, the possibility will be evaluated case by case on basis of the circumstances in the individual business combinations.
IFRS 3 (Revised) becomes mandatory for the group's 2010 consoli-dated financial statements and will be applied prospectively, and will therefore have no impact on prior periods in the group's 2010 con-solidated financial statements.
Apart from IFRS 3 (Revised) "Business Combinations" (and the simul-taneous amendment of IAS 27), none of the standards and interpre-tations are expected to have a material impact on the consolidated financial statements of the group.

consolidated financial stateMents | annual report 2009 · 65
notes to the Consolidated finanCial statements
2. CritiCal aCCounting estimates and Judgements
the preparation of the consolidated financial statements of the group requires management to make judgements, accounting es-timates and assumptions that affect the application of accounting policies and the reported amounts of the group’s assets and liabili-ties, income and expenses.
the most significant accounting estimates and judgements are pre-sented below.
estimation unCertaintydetermination of the carrying amount of certain assets and liabilities requires estimates and assumptions concerning future events.
the estimates and assumptions are based on historical experience and other factors which management assesses to be reliable, but which by their nature are associated with uncertainty and unpredict-ability. these assumptions may prove incomplete or incorrect, and unexpected events or circumstances may arise. Further, the group is exposed to a number of risks and uncertainties as a result of its operating, investing and financing activities. these risks may lead to actual results differing from estimates, both positively and nega-tively. Specific risks for the group are discussed in the Management Review (on page 7) and in the notes.
Assumptions about the future and estimation uncertainty on the re-porting date are described in the notes where there is a significant risk of changes that could result in material adjustments to the carry-ing amount of assets or liabilities within the next financial year.
the international financial markets showed extraordinary fluctua-tions in both 2008 and 2009, including fluctuations in interest and currency exchange rates and with a derived effect on the general economic situation. Consequently, estimates and assessments have been given special attention to ensure that one-off effects which are not expected to exist in the long term do not affect estimates and assessed factors including discount rates and expectations to the future.
Management believes the following are the areas involving signifi-cant accounting estimates in the preparation of the consolidated fi-nancial statements of the group:
business combinations When acquiring businesses the purchase method is applied for recognition of assets, liabilities and contingent liabilities of the acquiree. the most significant assets acquired gen-erally comprise goodwill, brands, customer contract portfolios and related customer relationships and trade receivables.
generally there are uncertainties related to the identification of as-sets, liabilities and contingent liabilities as well as to the measure-ment of their fair value at the acquisition date. As no active market exists for the majority of acquired assets, liabilities and contingent liabilities, in particular in respect of acquired intangible assets, man-
agement makes estimates of the fair value. determination of assets, liabilities and contingent liabilities may be subject to subsequent ad-justment within 12 months.
the unallocated purchase price (positive amounts) is recognised as goodwill, which is allocated to the group’s cash-generating units. Management makes estimates of cash-generating units and the al-location of goodwill.
Considering the uncertainties associated with the determination of the cash flows of acquired cash-generating units, it is the assessment of management that the allocation made is based on documented estimates. the difference between the carrying amounts in the ac-quired entities and the fair value of identifiable assets and liabilities is specified in note 12, Acquisition and divestment of businesses.
brands In business combinations, the fair value of the brands ac-quired and their expected useful lives are assessed based on the brands' market position, expected long-term developments in the relevant markets and the brands' profitability.
generally, the group’s strategy is based on the ISS brand, which means that all acquired brands are either immediately converted to the ISS brand or co-branded with the ISS brand for a longer or short-er period of time. Whether the conversion is effected immediately or implemented over a period of time depends on the assessment of the fair value of the acquired brand, i.e. whether the acquired brand is expected to separately generate future economic benefits.
When an acquired brand is assessed to separately generate future economic benefits, measurement of the fair value is based on a dis-counted cash flow model using the after-tax royalty payments (the royalty relief method). Cash flows are discounted on an after tax basis using the local Weighted Average Cost of Capital (WACC) plus a risk premium for the assumed risk inherent in the brand.
the net present value of the cash flow is increased with an estimated portion of the tax amortisation benefit applicable for a potential buyer based on the local tax amortisation opportunity available for brand names when bought as a trade and asset purchase. the tax amortisation benefit is discounted. this increased value of the brand equals the fair value at the date of acquisition.
customer contracts In business combinations the fair value of cus-tomer contracts is based on an evaluation of the conditions relating to the acquired contract portfolio and related customer relationships in terms of local market conditions, terms and conditions of the un-derlying contracts and historical experience relating to churn rates.
Measurement is based on a discounted cash flow model based on key assumptions about the estimated split of the acquired revenue in business segments and the related churn rates and profitability of the revenue at the time of the acquisition. A contributory asset
continues

66 · annual report 2009 | consolidated financial stateMents
notes to the Consolidated finanCial statements
2. CritiCal aCCounting estimates and Judgements (Continued)
charge as a cost or return requirement for assets supporting the in-tangible asset has been included in the model. Cash flows are dis-counted on an after tax basis using the local Weighted Average Cost of Capital (WACC) plus a risk premium for the assumed risk inherent in customer contracts.
the net present value of the cash flow is increased with an estimated portion of the tax amortisation benefit applicable for a potential buyer based on the local tax amortisation opportunity available for customer contracts when bought as a trade and asset purchase. the tax amortisation benefit is discounted. this increased value of cus-tomer contracts equals the fair value at the date of acquisition.
impairment test goodwill, brands and customer contracts are tested for impairment at least annually or whenever there is an indication that the intangibles may be impaired. In performing the impairment test management makes an assessment of whether the cash gener-ating unit to which the intangibles relate will be able to generate positive net cash flows sufficient to support the value of intangibles and other net assets of the entity.
the recoverable amount of each cash-generating unit is determined on the basis of its value-in-use. the value-in-use is established using certain key assumptions. the key assumptions are revenue growth, operating margin (before other items) and discount rate.
Value-in-use cash flow projections are based on financial budgets approved by management covering the following financial year. the operating margin is based on past performance and expectations for the future market development. the assumptions applied in the short to medium term are based on management’s expectations re-garding the development in growth and operating margin. the ter-minal growth rates do not exceed the expected long-term average growth rate including inflation for the business in which the cash-generating units operate.
uncertainties reflecting historical performance and possible varia-tions in the amount or timing of the future cash flow are reflected in the discount rate.
In determining the country specific discount rates, which are calcu-lated net of tax, a target ratio of 60/40 between the market value of debt and enterprise value is used. A country specific risk premium has been added to the discount rates to reflect the specific risk as-sociated with each cash-generating unit.
the group’s impairment tests are presented in note 15, Impairment tests.
defined benefit plans and similar obligations When calculating the net present value of the retirement benefit obligation a number of significant actuarial assumptions are made, including discount rates,
expected return on plan assets, expected increases in future wages, salary and retirement benefits. All the assumptions are assessed at the reporting date. the range and weighted average for these as-sumptions are disclosed in note 29, pensions and similar obligations. the value of the group’s defined benefit plans and other long-term employee benefits are based on valuations from external actuaries.
In certain countries, the group participates in multi-employer pen-sion schemes, which by their nature are defined benefit plans. the funds, however, are currently not able to provide the necessary information in order for the group to account for the schemes as such. the pension schemes are therefore accounted for as defined contribution plans. there is a risk that the plans are not sufficiently funded. However, information on surplus or deficit in the schemes is not available.
provisions and contingencies Management assesses provisions, con-tingent assets and liabilities and the likely outcome of pending or probable lawsuits etc. on an ongoing basis. the outcome depends on future events that are by nature uncertain. In assessing the likely outcome of lawsuits and tax disputes etc., management bases its as-sessment on external legal assistance and established precedents.
provisions are disclosed in note 30, other provisions and contingent liabilities are disclosed in note 32, Contingent liabilities.
deferred tax assets the recognition of deferred tax assets regard-ing tax losses carried forward is supported by expected future prof-itability in the foreseeable future. deferred tax assets relating to tax losses carried forward are only recognised to the extent that it is more likely than not that future taxable profit will be available against which the unused tax losses can be utilised in the foreseeable future taking into account any restrictions in utilisation in the local tax legislation. this judgement is made on the reporting date based on budgets and estimates.
the group’s tax assets are presented in note 18, deferred tax.
receivables are measured at amortised cost less a provision for doubtful debt. provisions for doubtful debt are based on manage-ment’s assessment of the customer’s ability to make the required payments. Management performs analysis of impairment at both specific receivable and portfolio level.
All individually significant receivables are assessed for specific im-pairment. Receivables, that are found not to be specifically impaired, are collectively assessed for impairment on portfolio level by group-ing together receivables with similar risk characteristics.
In assessing collective impairment the group uses historical trends of the probability of default, timing of recoveries and the amount of
continues

consolidated financial stateMents | annual report 2009 · 67
notes to the Consolidated finanCial statements
2. CritiCal aCCounting estimates and Judgements (Continued)
loss incurred, adjusted for management’s judgement as to whether current economic and credit conditions are such that the actual losses are likely to be greater or less than suggested by historical trends.
Receivables are disclosed in note 21, trade receivables.
assets held for sale mainly comprises disposal groups and is meas-ured at the lower of the carrying amount and fair value less costs to sell. Consequently, management makes estimates of the fair value of the disposal group. depending on the nature of the disposal group's activity, assets and liabilities, the estimated fair value may be associ-ated with uncertainty and possibly adjusted subsequently. Manage-ment considers impairment both on initial classification as held for sale and subsequently. the estimation uncertainty relating to impair-ment is described above.
Assets held for sale are disclosed in note 26, Assets and liabilities held for sale.
divestments When divesting businesses management makes esti-mates of the final sales price. Additionally, management assesses the appropriate level of provisions to cover claims from purchasers or other parties in connection with divestments and representation and warranties given in relation to divestments.
Judgement in relation to aPPliCation of aCCounting PoliCiesIn applying the group’s accounting policies, management makes judgements which may significantly influence the amounts recog-nised in the consolidated financial statements.
on business combinations and establishing new entities assessment is made in order to classify the acquired business as a subsidiary, joint venture or associate. the assessment is made on basis of the agree-ment entered into on the acquisition of ownership interest or voting rights in the entity etc.
the classification is significant, as the recognition of proportionally consolidated joint ventures impacts the consolidated financial state-ments differently than full consolidation of subsidiaries or recogni-tion of associates recognised according to the equity method.
revenue is primarily generated by rendering of services or from con-struction contracts. Management makes judgements to distinguish between revenue generated from rendering of service and revenue from construction contracts for the purpose of classification of rev-enue either in accordance with IAS 18 “Revenue” or IAS 11 “Con-struction Contracts".
the classification is significant, as the recognition of revenue and related receivables in accordance with the above standards impacts the consolidated financial statements differently.
other income and expenses, net the use of other income and ex-penses, net entails management judgement in the separation from the normal ordinary operations of the group. When using other in-come and expenses, net it is crucial that these constitute items that can not be attributed directly to the group’s ordinary operating ac-tivities. other income and expenses, net, comprises both recurring and non-recurring items.
Management carefully evaluates each item to ensure the correct distinction between the group’s ordinary operating activities and other income and expenses, net.
integration costs include costs regarding the acquiring ISS company and the acquired business that are of no value for the continuing business and are an unavoidable consequence of the integration. the use of Integration costs entails management judgement in the separation of these costs as direct costs arising from the integration, which are those that are both necessary and required to perform the integration and not associated with the ongoing activities in the group.
Management carefully evaluates each item to ensure the correct distinction between the group’s ordinary operating activities and Integration costs.
leases the group has entered into a number of leases and for each lease agreement an assessment is made as to whether the lease is a finance lease or an operating lease. the group primarily enters into operating lease agreements. operating leases consist of leases and rentals of properties, vehicles (primarily cars), production equipment and other equipment.
financial instruments When entering into financial instruments, management assesses whether the instrument is an effective hedge of recognised assets and liabilities and expected future cash flows. the hedge effectiveness of recognised hedge instruments is assessed on a monthly basis and any ineffectiveness is recognised in the in-come statement.
assets held for sale non-current assets and disposal groups are clas-sified as held for sale when the carrying amount of the assets or disposal groups are expected to primarily be recovered through a sale within 12 months in accordance with a formal plan rather than through continuing use.
Management makes judgement to make the correct classification. the classification is significant as the classification as held for sale changes the measurement basis of the non-current assets and dis-posal groups as well as the presentation in the statement of financial position.

68 · annual report 2009 | consolidated financial stateMents
notes to the Consolidated finanCial statements
3. segment rePorting
reportable segmentsISS is a global facility services company, that operates in more than 50 countries and delivers a wide range of services within the areas Clean-ing, Support Services, property Services, Catering, Security and Facility Management.
operations are managed based on a geographical structure in which countries are grouped into 7 regions. the regions have been identified based on a key principle of grouping countries that share market conditions and cultures.
the segment reporting is prepared in a manner consistent with the group's internal management and reporting structure. Segment revenue, costs, assets and liabilities comprise items that can be directly referred to the individual segments.
DKK million nordicWestern
EuropeEastern Europe asia
latin america
north america pacific
total reportable segments
2009income statementrevenue 1) 16,367 38,632 1,561 4,120 2,077 2,515 3,768 69,040
depreciation and amortisation 2) (237) (444) (23) (58) (23) (15) (35) (835)
operating profit before other items 3) 1,219 2,056 106 308 131 134 259 4,213
other income and expenses, net 52 (567) (2) (4) - - (20) (541)Integration costs (4) (31) (1) (5) (1) (2) (2) (46)
operating profit 2) 1,267 1,458 103 299 130 132 237 3,626
goodwill impairment and write-down (235) (1,011) - - - - - (1,246)Amortisation of brands and customer contracts (226) (715) (28) (53) (17) (46) (44) (1,129)
statement of financial positiontotal assets 14,151 30,833 1,318 3,107 1,309 1,544 2,942 55,204
Additions excluding acquisitions/divestments 319 526 17 88 41 12 58 1,061 Additions from acquisitions/divestments (196) 295 3 336 (10) 84 45 557
additions to non-current assets 4) 123 821 20 424 31 96 103 1,618
total liabilities 9,550 20,432 728 1,588 1,099 1,108 2,311 36,816
1) Segment revenue comprises total revenue of each segment. due to the nature of the business internal revenue is insignificant and is therefore not disclosed. 2) excluding goodwill impairment and write-down and Amortisation of brands and customer contracts.3) other items comprise other income and expenses, net, Integration costs, goodwill impairment and write-down and Amortisation of brands and customer contracts.4) Additions to non-current assets comprise additions to Intangible assets and property, plant and equipment.
continues
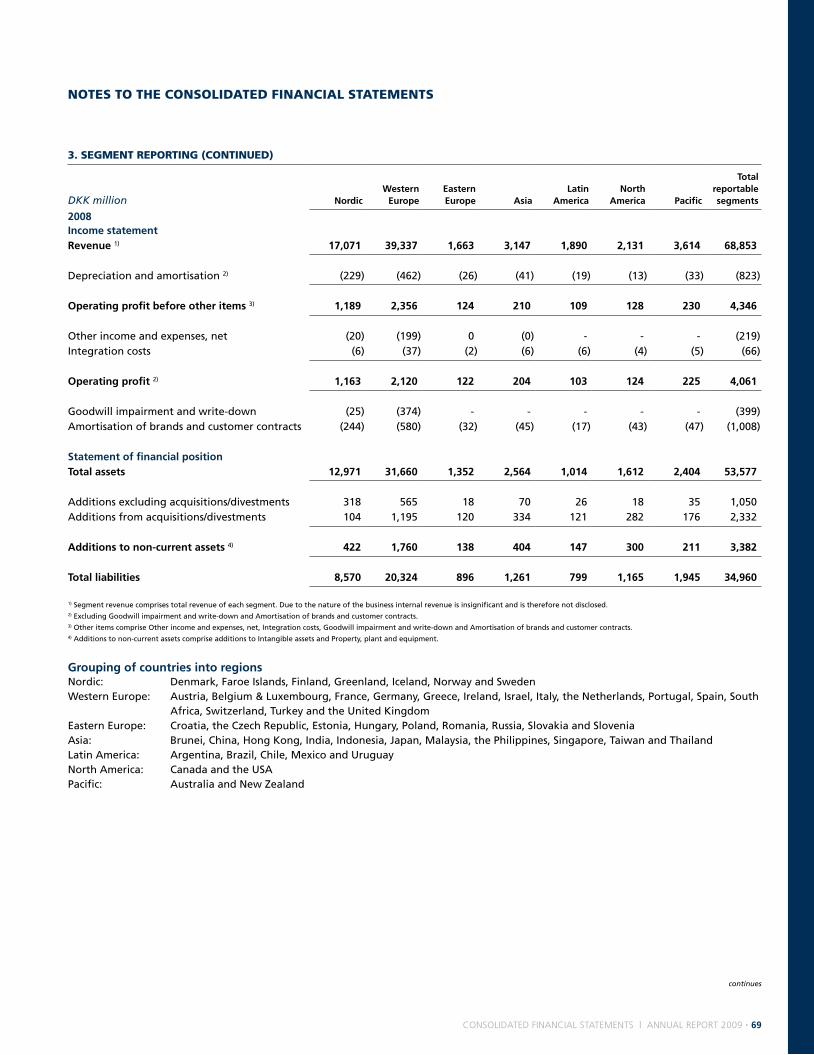
consolidated financial stateMents | annual report 2009 · 69
notes to the Consolidated finanCial statements
continues
3. segment rePorting (Continued)
DKK million nordicWestern
EuropeEastern Europe asia
latin america
northamerica pacific
total reportable segments
2008income statementrevenue 1) 17,071 39,337 1,663 3,147 1,890 2,131 3,614 68,853
depreciation and amortisation 2) (229) (462) (26) (41) (19) (13) (33) (823)
operating profit before other items 3) 1,189 2,356 124 210 109 128 230 4,346
other income and expenses, net (20) (199) 0 (0) - - - (219)Integration costs (6) (37) (2) (6) (6) (4) (5) (66)
operating profit 2) 1,163 2,120 122 204 103 124 225 4,061
goodwill impairment and write-down (25) (374) - - - - - (399)Amortisation of brands and customer contracts (244) (580) (32) (45) (17) (43) (47) (1,008)
statement of financial positiontotal assets 12,971 31,660 1,352 2,564 1,014 1,612 2,404 53,577
Additions excluding acquisitions/divestments 318 565 18 70 26 18 35 1,050 Additions from acquisitions/divestments 104 1,195 120 334 121 282 176 2,332
additions to non-current assets 4) 422 1,760 138 404 147 300 211 3,382
total liabilities 8,570 20,324 896 1,261 799 1,165 1,945 34,960
1) Segment revenue comprises total revenue of each segment. due to the nature of the business internal revenue is insignificant and is therefore not disclosed. 2) excluding goodwill impairment and write-down and Amortisation of brands and customer contracts.3) other items comprise other income and expenses, net, Integration costs, goodwill impairment and write-down and Amortisation of brands and customer contracts.4) Additions to non-current assets comprise additions to Intangible assets and property, plant and equipment.
grouping of countries into regionsnordic:Western europe:
eastern europe:Asia:latin America:north America:pacific:
denmark, Faroe Islands, Finland, greenland, Iceland, norway and SwedenAustria, Belgium & luxembourg, France, germany, greece, Ireland, Israel, Italy, the netherlands, portugal, Spain, South Africa, Switzerland, turkey and the united KingdomCroatia, the Czech Republic, estonia, Hungary, poland, Romania, Russia, Slovakia and SloveniaBrunei, China, Hong Kong, India, Indonesia, Japan, Malaysia, the philippines, Singapore, taiwan and thailandArgentina, Brazil, Chile, Mexico and uruguayCanada and the uSAAustralia and new Zealand

70 · annual report 2009 | consolidated financial stateMents
notes to the Consolidated finanCial statements
3. segment rePorting (Continued)
products and servicesthe group's revenue relates to the following service types:
DKK million 2009 2008
Cleaning 36,050 36,528 Support Services 4,981 4,146 property Services 14,503 15,410 Catering 6,201 5,727 Security 4,672 4,344 Facility Management 2,597 2,674
total revenue 69,004 68,829
geographical informationRevenue and non-current assets (excluding deferred tax assets) is specified below for each of the group's significant countries 1):
2009 2008
DKK million revenue
non- current assets revenue
non- current assets
France 8,879 5,493 9,336 6,904 united Kingdom 6,948 3,074 7,565 2,972 norway 5,246 2,977 5,683 2,686 Spain 4,534 2,058 4,603 2,198 denmark (country of domicile) 3,731 2,396 3,702 2,491Finland 3,678 3,298 3,517 3,373Sweden 3,536 1,814 3,920 1,907netherlands 3,420 2,289 3,540 2,431other countries 2) 29,032 14,359 26,963 13,577
total 69,004 37,758 68,829 38,539
1) In this context significant countries are defined as countries representing 5% or more of the group's revenue. 2) Including unallocated items and eliminations.
major customersno customer comprises more than 10% of the group's external revenue.
continues

consolidated financial stateMents | annual report 2009 · 71
notes to the Consolidated finanCial statements
3. segment rePorting (Continued)
reconciliationsDKK million 2009 2008
revenueRevenue for reportable segments 69,040 68,853 elimination of internal revenue (36) (24)
revenue according to the income statement 69,004 68,829
operating profitoperating profit for reportable segments 3,626 4,061 elimination of internal profit 0 0 unallocated corporate costs (339) (285)unallocated other income and expenses, net (10) (23)
operating profit according to the income statement 3,277 3,753
unallocated:Share of result from associates 4 3 net finance costs (2,308) (2,731)
profit before tax and goodwill impairment/amortisation of brands and customer contracts according to the income statement 973 1,025
total assetstotal assets for reportable segments 55,204 53,577 elimination of internal assets 1) (30,536) (19,846) unallocated assets 29,686 19,874
total assets according to the statement of financial position 54,354 53,605
additions to non-current assets 2)
Additions to non-current assets for reportable segments 1,618 3,382 unallocated additions to non-current assets 33 51
total additions to non-current assets according to the statement of financial position 1,651 3,433
total liabilitiestotal liabilities for reportable segments 36,816 34,960 elimination of internal liabilities 1) (30,111) (19,447)unallocated liabilities 45,436 34,559
total liabilities according to the statement of financial position 52,141 50,072
1) eliminations mainly relate to intra-group balances.2) Additions to non-current assets comprise additions to Intangible assets and property, plant and equipment.

72 · annual report 2009 | consolidated financial stateMents
notes to the Consolidated finanCial statements
4. staff Costs
DKK million 2009 2008
Wages and salaries 35,111 34,188 pension costs, defined benefit plans 150 126 pension costs, defined contribution plans 1,573 1,492 Social charges and other costs 7,947 8,350
staff costs 44,781 44,156
average number of employees 482,531 455,947
remuneration to the board of directors, the Executive group management and corporate senior officers
2009 2008
DKK thousandboard of directors
Executive group
management
corporate senior
officersboard of directors
Executive group
management
corporate senior
officers
Salaries (including benefits) and fees 1,969 20,027 37,036 1,856 18,102 26,413Bonus - 5,703 7,409 - 5,148 8,713 Severance payments 1) - - 7,091 - - 11,965 Share-based payments 1) - 233 2,021 - 1,976 2,805
1,969 25,963 53,557 1,856 25,226 49,896
the Board of directors received remuneration for duties performed in ISS Holding A/S and other companies within the ISS group. the remuneration is a fixed annual amount. the Board of directors does not participate in the warrant programme described in note 5, Share-based payments. However, the members have been offered to invest in a mix of shares and warrants as part of the directors participation programme described in note 36, Related parties.
the members of the executive group Management and Corporate Senior officers received remuneration for duties performed in ISS Holding A/S and other companies within the ISS group. the remuneration consists of a combination of a fixed salary and, for most of these, a bonus, which in 2009 is capped at 60% of their fixed salary. Furthermore, the executive group Management and certain Corporate Senior offic-ers participate in the warrant programme as well as the Management participation programme described in note 5, Share-based payments.
Corporate Senior officers comprises members of group Management, other than members of the executive group Management. Members of group Management have authority and responsibility for planning, implementing and controlling the group's activities and are together with the Board of directors considered as the group's key management personnel.
the members of the executive group Management and Corporate Senior officers are, in the event of termination, entitled to severance payment of between 12 and 18 months salary including benefits.
Remuneration to the Board of directors, the executive group Management and Corporate Senior officers is paid by ISS A/S.
1) Included in other income and expenses, net.

consolidated financial stateMents | annual report 2009 · 73
notes to the Consolidated finanCial statements
5. share-based Payments
management participation programmeFunds advised by eQt partners and goldman Sachs Capital partners (the “principal Shareholders”) have established a Management partici-pation programme, under which the executive group Management and a number of senior officers 1) of the group have been offered to invest. the programme is structured as a combination of direct and indirect investments in a mix of shares and warrants of FS Invest S.a r.l ("FS Invest"), ISS Holding A/S's ultimate parent. As part of the initial programme - in addition to the investments - warrants in FS Invest were granted free of charge to the executive group Management and a number of Corporate officers 2) of the group.
the direct and indirect investments in FS Invest were made on market terms and hence are not share-based payments within the scope of IFRS 2 Share-based payment. Further details of the programme and these investments are provided in note 36, Related parties. the warrants granted to the executive group Management and a number of Corporate officers of the group are within the scope of IFRS 2.
Warrants granted as part of the management participation programmethe warrants were granted in July 2006 as a one-time grant and were issued in two series, A and B, both expiring on 1 June 2014. the es-timated FS Invest share price at the time of the grant was dKK 1,019 per share. the warrants entitle the holder to subscribe for FS Invest shares at an exercise price of dKK 2,039 and dKK 2,549 per share for warrants in series A and series B, respectively, in a proportion which is determined by the exercise restrictions mentioned below. the warrants are exercisable for a period of 30 business days prior to and ending on 1 June 2014. the warrants are non-transferable.
the fair value of the warrants was estimated to dKK 25 million at the time of grant measured using the Black-Scholes option pricing model based on the assumptions at the time of grant and exercise restrictions.
the warrants are accounted for as equity-settled transactions. the fair value at grant date of these warrants will be expensed in the income statement over the vesting period from July 2006 to June 2014. In 2009, dKK 3 million were recognised under other income and expenses, net in respect of warrants granted (2008: dKK 5 million).
the warrants are subject to exercise restrictions depending on the share price at the time of exercise. At a share price of 6,114 or more at the time of exercise, 90% of the warrants vested can be exercised. the proportion of exercisable warrants decreases in intervals down to 10% at a share price of 2,039. At share prices below 2,039, no warrants are exercisable.
Warrants outstanding at 31 december 2009 and movements during 2008 and 2009 were:
Executive group management corporate officers 2) total
Number of warrants series a series b total series a series b total series a series bseries a
and b
outstanding at 1 January 2008 - 125,424 125,424 29,852 376,736 406,588 29,852 502,160 532,012 Warrants settled during 2008 - (67,536) (67,536) - (67,536) (67,536) - (135,072) (135,072)
outstanding at 31 december 2008 - 57,888 57,888 29,852 309,200 339,052 29,852 367,088 396,940 Warrants settled during 2009 - - - - (67,536) (67,536) - (67,536) (67,536)
outstanding at 31 december 2009 - 57,888 57,888 29,852 241,664 271,516 29,852 299,552 329,404
Warrants settled relates to cash settlement by FS Invest of warrants in connection with termination of employment.
1) Senior officers of the group comprises Corporate Senior officers (members of group Management other than members of the executive group Management) and other Corporate officers as well as
certain members of Country Management of each country.2) Corporate officers of the group comprises Corporate Senior officers (members of group Management other than members of the executive group Management) and other Corporate officers.

74 · annual report 2009 | consolidated financial stateMents
notes to the Consolidated finanCial statements
6. fees to auditors
DKK million 2009 2008
kpmgAudit fees 40 42 other assurance services 7 5 tax and VAt advisory services 10 13 other services 10 16
total kpmg 67 76
Audit fees comprised audit of the consolidated and local financial statements. other services mainly comprised work related to acquisitions such as financial and tax due diligence etc.
7. other inCome and exPenses, net
DKK million 2009 2008
gain on divestments 102 6 gain on sale of properties 8 0 other 6 19
other income 116 25
Restructuring projects (426) (131)Redundancy and severance payments relating to senior management changes (44) (21)loss on divestments (19) (43)Write-down regarding businesses classified as held for sale (159) - Close-down and subsequent surveillance of landfill site in France - (28)Adjustment to accounting estimate in Belgium - (17)Consolidation projects in the united Kingdom - (4)other (19) (23)
other expenses (667) (267)
other income and expenses, net (551) (242)
other incomeGain on divestments in 2009 related to the sale of the non-core laundry activities in Sweden and norway.
other expensesRestructuring projects in 2009 related to costs for projects in France, germany, Spain, Australia, Belgium, Finland, the united Kingdom and denmark. In France a re-organisation of the organisational setup covering several business units as well as head office was initiated amounting to dKK 212 mil-lion. In germany a re-organisation of a business unit including close-down of two divisions and efficiency improvements was initiated amounting to dKK 84 million. In Spain a close-down of certain project-based activities within the Building Maintenance division was completed amounting to dKK 27 million. In Australia a consolidation of office locations within new South Wales was initiated. In Finland and the united Kingdom close-down of certain project-based activities across certain business units were completed, and in Belgium a margin improvement project covering primarily head office was completed. In denmark a merger of the route-based back office organisation into the site-based organisation was completed.
Restructuring projects in 2008 related to costs for projects in the netherlands, norway, France, Austria and various other countries. In the nether-lands a re-organisation of the organisational setup covering four business units as well as head office was initiated amounting to dKK 70 million. In norway the office relocation project initiated in 2007 to consolidate several office locations in norway continued amounting to dKK 16 million. In France, Austria and norway re-organisations of the organisational setup following the divestments of various activities was carried out amounting to dKK 31 million.
generally, restructuring projects include primarily redundancy payments, termination of leaseholds and relocation costs. continues

consolidated financial stateMents | annual report 2009 · 75
notes to the Consolidated finanCial statements
7. other inCome and exPenses, net (Continued)
Loss on divestments in 2009 primarily related to the non-strategic landscaping activities in norway and Sweden as well as the call centre ac-tivities in the netherlands. In 2008, losses mainly related to the remaining part of the non-core energy activities in France and non-strategic landscaping activities in Austria.
Write-down regarding businesses classified as held for sale mainly related to write-down of net assets (excluding goodwill, brands, customer contracts and the related tax effect) of certain non-core activities in France, which are expected to be sold and consequently have been clas-sified as held for sale at 31 december 2009.
Close-down and subsequent surveillance of landfill site in France in 2008 related to additional costs regarding closure and subsequent supervi-sion for 30 years of a landfill site, which was managed by ISS France and closed in 2008. the additional costs are mainly a result of changed expectations and administrative requirements for handling of landfill sites as well as an unfavourable climatic and geological evolution.
Adjustment to accounting estimate in Belgium in 2008 related to adjustment of prior years estimate regarding work in progress.
8. net finanCe Costs
DKK million 2009 2008
Interest income etc. 81 153 Interest income from companies within the ISS group 0 0 Amortisation of gain from settlement of interest rate swaps 14 27 Foreign exchange gain 128 62
financial income 223 242
Interest expenses etc. 1) (2,245) (2,465)Interest expenses to companies within the ISS group (4) (3)Amortisation of fair value adjustment of bond loans (99) (125)Amortisation of financing fees (57) (63)Foreign exchange loss (67) (317)loss related to partial redemption of eMtns (59) -
financial expenses (2,531) (2,973)
net finance costs (2,308) (2,731)
1) In all material aspects related to long-term debt.
amortisation of gain from settlement of interest rate swapsthe interest rate swaps hedging ISS global's Medium term notes (eMtns) were partially settled in June 2005 and the remaining part was settled in June 2006 resulting in a net gain to be recognised in the consolidated income statement over the remaining term of the eMtns. A part of the gain is referred to the partially redeemed eMtns and was recognised in the income statement in connection with the partial redemption in July 2009. the remaining unrecognised net gain of dKK 1 million at 31 december 2009 (dKK 28 million at 31 december 2008) will be recognised in the income statement in the financial years 2010 - 2014 corresponding to the remaining term of the eMtns, see note 28, Borrowings.
loss related to partial redemption of EmtnsIn July 2009, the eMtns due in 2010 were partially refinanced, when euR 500 million of the outstanding euR 850 million were redeemed. the notes were acquired at nominal value, however, due to the fair value adjustment of the eMtns in connection with ISS Holding A/S's acquisi-tion of ISS A/S in 2005 the carrying amount was lower than the redemption value resulting in a loss of dKK 59 million.

76 · annual report 2009 | consolidated financial stateMents
9. inCome taxes
DKK million 2009 2008
Current tax regarding profit before impairment/amortisation of intangibles 1) 542 361deferred tax regarding profit before impairment/amortisation of intangibles 1) 23 203
tax on profit before impairment/amortisation of intangibles 1) 565 564Adjustments relating to prior years, net 23 (33)
income taxes 588 531tax effect of impairment/amortisation of intangibles 1) (361) (282)
total tax recognised in the income statement 227 249
income tax recognised in other comprehensive income
DKK million 2009 2008
before tax tax net of tax before tax tax net of tax
Foreign exchange adjustment of subsidiaries and non-controlling interests 364 - 364 (792) - (792)Fair value adjustment of hedges, net (327) 82 (245) (266) 66 (200)Fair value adjustment of hedges, net, transferred to net finance costs 325 (81) 244 (147) 37 (110)limitation to interest deduction in denmark - (3) (3) - (103) (103)Actuarial gains/(losses) (45) 4 (41) (182) 37 (145)Impact from asset ceiling 18 - 18 25 - 25 Share-based payments 3 (1) 2 5 (1) 4
total income tax recognised in other comprehensive income 338 1 339 (1,357) 36 (1,321)
computation of effective tax rate 2009 2008
Statutory income tax rate in denmark 25.0 % 25.0 %Foreign tax rate differential, net (1.5)% 1.9 %
23.5 % 26.9 %non-tax deductible expenses less non-taxable income 5.4 % 3.8 %
Adjustments relating to prior years, net 2.3 % (3.2)%Change of valuation of net tax assets 9.6 % 9.7 %effect of changes in tax rates (0.2)% (0.8)%other taxes 2) 5.7 % 5.3 %limitation to interest deduction in denmark 14.1 % 10.1 %
Effective tax rate (excluding effect from impairment/amortisation of intangibles) 1) 60.4 % 51.8 %
1) In this context intangibles comprise the value of goodwill, brands and customer contracts.2) other taxes mainly comprise withholding tax.
notes to the Consolidated finanCial statements
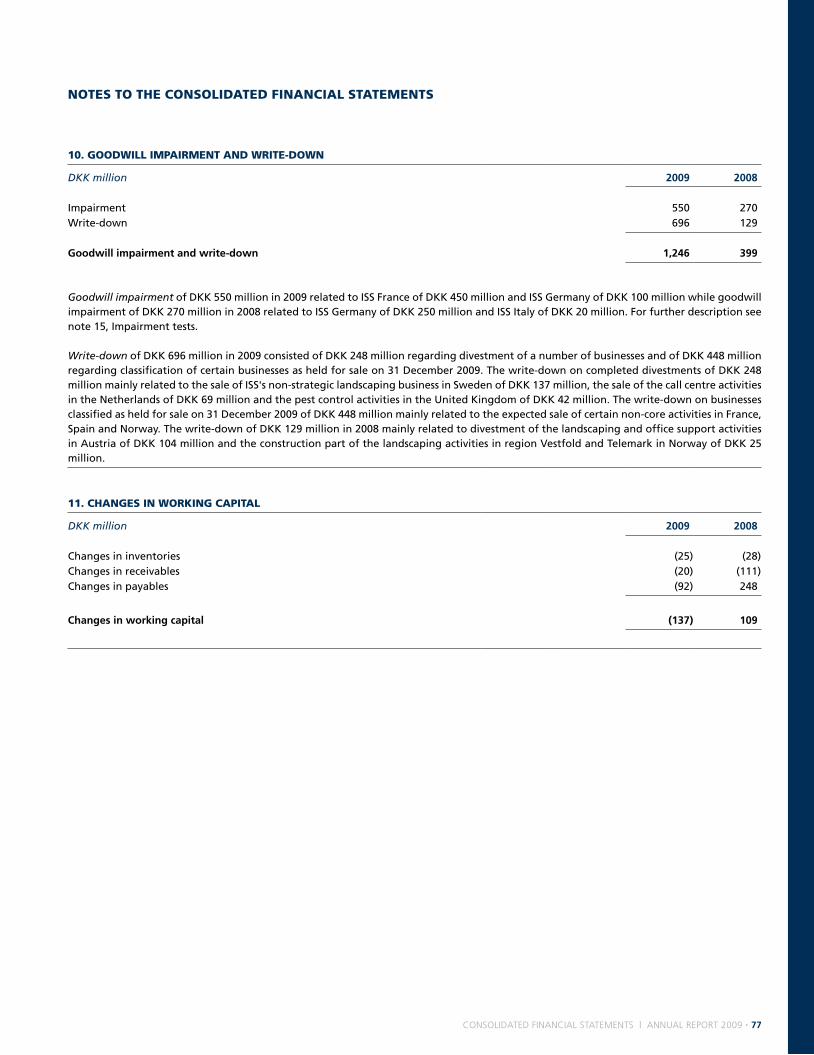
consolidated financial stateMents | annual report 2009 · 77
notes to the Consolidated finanCial statements
10. goodwill imPairment and write-down
DKK million 2009 2008
Impairment 550 270 Write-down 696 129
goodwill impairment and write-down 1,246 399
Goodwill impairment of dKK 550 million in 2009 related to ISS France of dKK 450 million and ISS germany of dKK 100 million while goodwill impairment of dKK 270 million in 2008 related to ISS germany of dKK 250 million and ISS Italy of dKK 20 million. For further description see note 15, Impairment tests.
Write-down of dKK 696 million in 2009 consisted of dKK 248 million regarding divestment of a number of businesses and of dKK 448 million regarding classification of certain businesses as held for sale on 31 december 2009. the write-down on completed divestments of dKK 248 million mainly related to the sale of ISS's non-strategic landscaping business in Sweden of dKK 137 million, the sale of the call centre activities in the netherlands of dKK 69 million and the pest control activities in the united Kingdom of dKK 42 million. the write-down on businesses classified as held for sale on 31 december 2009 of dKK 448 million mainly related to the expected sale of certain non-core activities in France, Spain and norway. the write-down of dKK 129 million in 2008 mainly related to divestment of the landscaping and office support activities in Austria of dKK 104 million and the construction part of the landscaping activities in region Vestfold and telemark in norway of dKK 25 million.
11. Changes in working CaPital
DKK million 2009 2008
Changes in inventories (25) (28)Changes in receivables (20) (111)Changes in payables (92) 248
changes in working capital (137) 109

78 · annual report 2009 | consolidated financial stateMents
notes to the Consolidated finanCial statements
12. aCQuisition and divestment of businesses
acquisition of businesses aquisitions in 2009the group made 22 acquisitions during 2009 (66 during 2008). the total purchase price amounted to dKK 680 million (dKK 2,139 million in 2008). the total annual revenue of the acquired businesses (approximate figures extracted from unaudited financial information) is estimated at dKK 997 million (dKK 3,887 million in 2008) based on expectations at the time of acquisition.
the acquisitions (including adjustments to acquisitions in prior years) had the following effect on the group's assets and liabilities on the acquisition date:
total acquisitions
fair value adj.
DKK million2009
pre- acquisition
carrying amounts
current year
acquisitions
prior year
acquisitions
recognised values on
acquisition
Customer contracts 0 165 - 165 other non-current assets 18 5 9 32 trade receivables 124 (2) (15) 107 other current assets 33 1 0 34 other provisions (1) (8) (20) (29)pensions, deferred tax liabilities and non-controlling interests 7 (36) (4) (33)long-term debt (2) (1) - (3)Short-term debt (16) - (2) (18)other current liabilities (113) (10) (15) (138)
net identifiable assets and liabilities 50 114 (47) 117
goodwill 66 589 Acquisition costs, net of tax 2 (26)
purchase price 21 680
Cash and cash equivalents in acquired businesses (15)
cash purchase price 665
Changes in deferred payments and earn-outs 223 Changes in prepaid purchase price (3)Acquisition costs paid, net of tax 29
total payments regarding acquisition of businesses 914
In 2009, no acquisitions accounted for more than 2% of the group's revenue on an individual basis. Consequently, all acquisitions are deemed individually immaterial and are therefore shown in aggregate.
opening balances are recognised in accordance with IFRS 3. At 31 december 2009, certain opening balances have only been provisionally determined. Consequently, fair value adjustments may be recognised against goodwill within 12 months of the acquisition date.
the purchase price of prior years' acquisitions increased by dKK 21 million, mainly due to revised estimates relating to earn-outs for the acquisitions of Inbuilt in Singapore of dKK 74 million and Sardunya in turkey of dKK 36 million, offset mainly by Carlos Rocha in Spain of dKK 21 million, loghis logistica in Brazil of dKK 13 million, Ryvola in the Czech Republic of dKK 10 million, Hunt/ondes in Belgium of dKK 8 mil-lion and gastronomia in Spain of dKK 7 million. Furthermore, net assets of prior years' acquisitions were reduced by dKK 47 million relating to various acquisitions. Accordingly, goodwill has been adjusted.
continues

consolidated financial stateMents | annual report 2009 · 79
12. aCQuisition and divestment of businesses (Continued)
acquisition of businesses (continued)Acquisition costs mainly comprise fees to lawyers, auditors and consultants (paid in relation to the acquisition).
the goodwill recognised on acquisition is attributable mainly to; i) assembled workforce, ii) technical expertise and technological know how, iii) training expertise and training and recruitment programmes and iv) platform for growth. As the group is a service company that acquires businesses in order to apply the ISS model and generate value by restructuring and refining the acquired business, the main impact from acquisitions derives from synergies, the value of human resources and the creation of platforms for growth.
the 22 acquisitions 1) made by the group during 2009 are listed below:
company country service type
consolidated in the income
statement percentage
interestannual
revenue 2)
number of employees 2)
Industriservice danmark A/S denmark Cleaning January 100% 7 13Vaasan lVI-Huolto Finland property January 100% 14 13Mettek Hizmet turkey Cleaning, Support, Security January 100% 137 2,178Central property Services uSA Cleaning, Security January Activities 182 917Aplytec Spain property January 100% 13 24Soumala Finland Cleaning February 100% 19 105Agria-Ved Hungary Cleaning, Security February 100% 7 25Karmak Italy Cleaning February 100% 100 412eCo Servis Bosnia Cleaning February 100% 6 89Sunparking Indonesia Security February Activities 109 5,000Cleansweep Australia property March 100% 11 24paprika Corporate Services India Catering March Activities 5 149Andrawina Indonesia Catering March Activities 68 1,130grossjung germany property April 100% 4 6Barassa Switzerland property May Activities 9 7godrej HiCare India property May 100% 61 722Securiguard denmark Security May Activities 24 60Chubb Security Ireland Security May 100% 134 635Adelaide Sweeping Services Australia property May Activities 5 8Shielas Corporate Catering India Catering June Activities 5 100WHF property & Mine Maintenance Australia property August Activities 40 45Best Indonesia Security november Activities 37 2,872
total 997 14,534
1) Includes all acquisitions completed prior to 1 January 2010. 2) Approximate figures based on information available at the time of acquisition extracted from unaudited financial information.
notes to the Consolidated finanCial statements
continues

80 · annual report 2009 | consolidated financial stateMents
notes to the Consolidated finanCial statements
continues
12. aCQuisition and divestment of businesses (Continued)
acquisition of businesses (continued) aquisitions in 2008the acquisitions made in 2008 (including adjustments to acquisitions in prior years) had the following effect on the group's assets and liabili-ties on the acquisition date:
total acquisitions
fair value adj.
DKK million2008
pre- acquisition
carrying amounts
current year
acquisitions
prior year
acquisitions
recognised values on
acquisition
goodwill 7 (7) - - Customer contracts - 677 1 678 other non-current assets 158 21 (1) 178 trade receivables 626 (20) 4 610 other current assets 248 (27) (0) 221 other provisions (15) (108) (9) (132)pensions, deferred tax liabilities and non-controlling interests (3) (163) 4 (162)long-term debt (23) (1) 1 (23)Short-term debt (193) (4) (3) (200)other current liabilities (498) (52) (1) (551)
net identifiable assets and liabilities 307 316 (4) 619
goodwill 134 1,588 Acquisition costs, net of tax (1) (68)
purchase price 129 2,139
Cash and cash equivalents in acquired businesses (118)
cash purchase price 2,021
Changes in deferred payments and earn-outs 24 Changes in prepaid purchase price (11)Acquisition costs paid, net of tax 61
total payments regarding acquisition of businesses 2,095
In 2008, no acquisitions accounted for more than 2% of the group's revenue on an individual basis. Consequently, all acquisitions are deemed individually immaterial and are therefore shown in aggregate.
the purchase price of prior years' acquisitions increased by dKK 129 million, mainly due to revised estimates relating to earn-outs for the ac-quisitions of Carlos Rocha in Spain of dKK 80 million, Ryvola in the Czech Republic of dKK 12 million and CMC in turkey of dKK 10 million.
Acquisition costs mainly comprise fees to lawyers, auditors and consultants (paid in relation to the acquisition).
the goodwill recognised on acquisition is attributable mainly to; i) assembled workforce, ii) technical expertise and technological know how, iii) training expertise and training and recruitment programmes and iv) platform for growth. As the group is a service company that acquires businesses in order to apply the ISS model and generate value by restructuring and refining the acquired business, the main impact from acquisitions derives from synergies, the value of human resources and the creation of platforms for growth.

consolidated financial stateMents | annual report 2009 · 81
notes to the Consolidated finanCial statements
continues
12. aCQuisition and divestment of businesses (Continued)
divestment of businessesthe group made 8 divestments during 2009 (12 during 2008). the total sales price amounted to dKK 240 million (dKK 316 million in 2008). the total annual revenue of the divested businesses (approximate figures extracted from unaudited financial information) is estimated at dKK 640 million (dKK 1,281 million in 2008) based on expectations at the time of divestment.
the divestments had the following effect on the group's assets and liabilities (carrying amounts) on the divestment date:
DKK million 2009 2008
goodwill (34) (15)Customer contracts (44) (6)other non-current assets (63) (10)trade receivables (51) (43)other current assets (11) (20)Assets held for sale 1) - (619)other provisions 0 3 pensions, deferred tax liabilities and non-controlling interests 8 12 long-term debt 5 -Short-term debt 2 1 other current liabilities 45 19 liabilities related to assets held for sale 1) - 351
net identifiable assets and liabilities (143) (327)
loss/(gain) on divestment of businesses, net (83) 37 divestment costs, net of tax (14) (26)
sales price (240) (316)
Cash and cash equivalents in divested businesses 5 12
cash sales price (235) (304)
Changes in receivable sales price 200 1 divestment costs paid, net of tax 13 31
net proceeds regarding divestment of businesses (22) (272)
1) the amount in 2008 related to ISS energie in France which at 31 december 2007 was recognised as held for sale and subsequently divested in January 2008.
the 8 divestments 2) made by the group during 2009 are listed below:
company/activity country service type
Excluded from the income statement
percentage interest
annual revenue 3)
number of employees 3)
Asker norway property January Activities 31 40Base Care ltd. new Zealand property June Activities 2 5landscaping Sweden property July Activities 328 325Shun tak Hong Kong Cleaning August 50% 13 162pest Control Services united Kingdom property october Activities 22 70Contact Centres netherlands Support october 100% 117 650laundry Services norway/Sweden Cleaning december Activities 100 120FS South Italy Cleaning december Activities 27 177
total 640 1,549
2) Includes all divestments completed prior to 1 January 2010.3) Approximate figures based on information available at the time of divestment extracted from unaudited financial information.

82 · annual report 2009 | consolidated financial stateMents
notes to the Consolidated finanCial statements
continues
12. aCQuisition and divestment of businesses (Continued)
pro forma revenue and operating profit before other itemsAssuming all acquisitions and divestments in the year were included as of 1 January the effect on revenue and operating profit before other items is estimated as follows:
DKK million 2009 2008
pro forma revenueRevenue recognised in the income statement 69,004 68,829 Acquisitions 184 1,641
Revenue adjusted for acquisitions 69,188 70,470 divestments (403) (230)
pro forma revenue 68,785 70,240
pro forma operating profit before other itemsoperating profit before other items recognised in the income statement 3,874 4,061 Acquisitions 19 113
operating profit before other items adjusted for acquisitions 3,893 4,174 divestments (5) (0)
pro forma operating profit before other items 3,888 4,174
applied assumptions the adjustment of revenue and operating profit before other items is based on estimates made by local ISS management in the respective jurisdictions in which such acquisitions and divestments occurred at the time of such acquisition and divestment or actual results where avail-able. Synergies from acquisitions are not included for periods in which such acquisitions were not controlled by the group. the estimates are based on unaudited financial information.
these adjustments and the computation of total revenue and operating profit before other items calculated on a pro forma basis based on such adjustments are presented for informational purposes only. this information does not represent the results the group would have achieved had the acquisitions and divestments during the year occurred on 1 January. In addition, the information should not be used as the basis for or prediction of any annualised calculation.
the acquiree's profit or loss since the acquisition date the amount of the acquiree's profit or loss since the acquisition date included in the income statement for the year is not disclosed, since such disclosure is impracticable, as acquired companies are typically merged with (or activities transferred to) existing companies shortly after completion of the acquisition.

consolidated financial stateMents | annual report 2009 · 83
12. aCQuisition and divestment of businesses (Continued)
acquisitions and divestments subsequent to 31 december 2009the 2 divestments made by the group in the period 1 January to 28 February 2010 are listed below. on 31 december 2009 the businesses were classified as held for sale. no Aquisitions were completed in the period.
company/activity country sevice type
Excluded from the income statement
percentage interest
annual revenue 1)
number of employees 1)
Industriservice norway property March 100% 163 254Refrigeration Spain property March Activities 156 163
divestments 319 434
In accordance with usual group procedures, divestment balances are prepared during the first months following the divestment. Conse-quently, the final divestment balances are not available for divestments completed from 1 January to 28 February 2010.1) Approximate figures based on unaudited financial information available at the time of divestment.
notes to the Consolidated finanCial statements
13. investments in non-Current assets
DKK million 2009 2008
purchase of intangible assets and property, plant and equipment (1,007) (938)Sale of intangible assets and property, plant and equipment 110 220
investments in intangible assets and property, plant and equipment, net 1) (897) (718)
purchase of financial assets (15) (4)Sale of financial assets 6 8 Changes in financial receivables (34) (6)
investments in financial assets, net (43) (2)
1) excluding goodwill, brands and customer contracts as well as additions related to assets under finance leases.

84 · annual report 2009 | consolidated financial stateMents
notes to the Consolidated finanCial statements
14. intangible assets
DKK million goodwill brandscustomer contracts
software and other intan-gible assets total
2009Cost at 1 January 27,783 1,540 10,596 447 40,366 Foreign exchange adjustments 875 44 376 15 1,310 Adjustment relating to prior years - - - 121 121 Additions 595 - - 139 734 Additions from acquired companies, net (34) - 78 (5) 39 disposals (702) - (370) (7) (1,079)transfer to Assets held for sale (15) - (89) (12) (116)
cost at 31 december 28,502 1,584 10,591 698 41,375
Impairment, write-down and amortisation at 1 January (524) (14) (3,678) (149) (4,365)Foreign exchange adjustments 0 1 (124) 0 (123)Adjustment relating to prior years - - - (121) (121)Amortisation - (4) (910) (107) (1,021)Amortisation from acquired companies, net - - 46 2 48 Impairment (550) - - - (550)Write-down 1) (696) - (210) - (906)disposals 702 - 370 - 1,072 transfer to Assets held for sale - - 35 8 43
impairment, write-down and amortisation at 31 december (1,068) (17) (4,471) (367) (5,923)
carrying amount at 31 december 27,434 1,567 6,120 331 35,452
2008Cost at 1 January 27,847 1,637 10,608 341 40,433 Foreign exchange adjustments (1,435) (97) (624) (21) (2,177)Additions 1,515 - - 137 1,652 Additions from acquired companies, net (15) - 634 27 646 disposals (129) - (22) (52) (203)transfer from property, plant and equipment - - - 15 15
cost at 31 december 27,783 1,540 10,596 447 40,366
Impairment, write-down and amortisation at 1 January (254) (11) (2,915) (103) (3,283)Foreign exchange adjustments - 1 210 4 215 Amortisation - (4) (998) (91) (1,093)Amortisation from acquired companies, net - - 3 - 3 Impairment (270) - - - (270)Write-down (129) - - - (129)disposals 129 - 22 43 194 transfer from property, plant and equipment - - - (2) (2)
impairment, write-down and amortisation at 31 december (524) (14) (3,678) (149) (4,365)
carrying amount at 31 december 27,259 1,526 6,918 298 36,001
the carrying amount of Brands is primarily related to the ISS brand, which is considered to have an indefinite useful life since there is no fore-seeable limit to the period over which the brand is expected to generate net cash inflows. Factors that played a significant role in determining that the ISS brand has an indefinite useful life are: i) the ISS brand has existed for decades, ii) the group's strategy is based on the ISS brand, iii) all acquired brands are converted to or co-branded with the ISS brand and iv) the ISS brand is used in the business to business and public segments with low maintenance costs attached.
1) Write-down of customer contracts was mainly related to a write-down of dKK 179 million related to non-core activities in France which were classified as held for sale on 31 december 2009. Write-down
of goodwill is described in note 10, goodwill impairment and write-down.

consolidated financial stateMents | annual report 2009 · 85
notes to the Consolidated finanCial statements
15. imPairment tests
impairment test procedurethe group performs impairment tests on intangibles 1) annually and whenever there is an indication that intangibles may be impaired. the group's intangibles primarily relate to the purchase price allocation following the take-over of ISS A/S as at 9 May 2005. A part of the group’s intangibles relates to acquisitions carried out after the take-over of ISS A/S as at 9 May 2005. Companies acquired after the take-over comprise a diverse portfolio of service types, customer segments, geographical regions, contract sizes and management skills.
Impairment tests are carried out per country as this represents the lowest level of cash-generating units (Cgu) to which the carrying amount of intangibles can be allocated and monitored with any reasonable certainty. this level of allocation and monitoring of intangibles should be seen in the light of the group's strategy to integrate acquired companies as quickly as possible in order to benefit from synergies.
Acquired companies are typically organisationally integrated and merged with (or activities transferred to) existing group companies shortly after the completion of the acquisition. Furthermore, synergies and other effects resulting from cooperation with existing group companies in their geographical or business area normally influence the financial performance of an acquired company. Consequently, after a short period of time, it is generally not possible to track and measure the value of intangibles of the individual acquired companies (or activities) with any reasonable certainty.
Estimates used to measure recoverable amountthe recoverable amount of each Cgu is determined on the basis of its value-in-use. the value-in-use is established using certain key assump-tions as described below. the key assumptions are revenue growth, operating margin (before other items) and discount rates.
Value-in-use cash flow projections are based on financial budgets approved by management covering the following financial year. the op-erating margin (before other items) is based on past performance and expectations for the future market development. the assumptions applied in the short to medium term are based on management's expectations regarding the development in growth and operating margin (before other items). the terminal growth rates do not exceed the expected long-term average growth rate including inflation for the busi-ness in which the Cgu's operate.
uncertainties reflecting historical performance and possible variations in the amount or timing of the future cash flow is reflected in the discount rate.
In determining the country specific discount rates, which are calculated net of tax, a target ratio of 60/40 between the market value of debt and enterprise value is used. A country specific risk premium has been added to the discount rates to reflect the specific risk associated with each Cgu.
As a company based in europe, the group assumes the long-term market equity risk premium to be 4.5%. When performing impairment tests for individual Cgu's, the risk premium applied may be higher than the group's. When doing acquisitions the group typically applies a hurdle rate, which is significantly higher than the calculated cost of capital.
impairment test resultsthe carrying amount of intangibles and the key assumptions 2) used in the impairment testing as per 31 december 2009 are presented below for each Cgu representing more than 3% of the carrying amount of intangibles or where the recoverable amount is close to the carrying amount of intangibles. no impairment losses were identified as per 31 december 2009.
the impairment tests as per 31 May 2009 resulted in recognition of impairment losses of dKK 550 million, of which dKK 450 million related to ISS France and dKK 100 million related to ISS germany. the impairment losses resulted from declining market conditions within certain business activities in which ISS operates, especially the industrial segments, as well as a slight increase in the discount rate applied for ISS germany. the impairment tests for ISS France and ISS germany as per 31 May 2009 were based on business plans prepared by local manage-ment. As per 31 december 2009 the business plans have been evaluated and updated as part of the annual impairment testing. no additional impairment losses were identified.
1) In this context intangibles cover the value of goodwill, brands and customer contracts resulting from the acquisition of companies.2) the key assumptions applied in the impairment tests are used for accounting purposes and should not be considered a forward-looking statement within the meaning of the uS private Securities litigation
Act of 1995 and similar laws in other countries regarding expectations to the future development.
continues
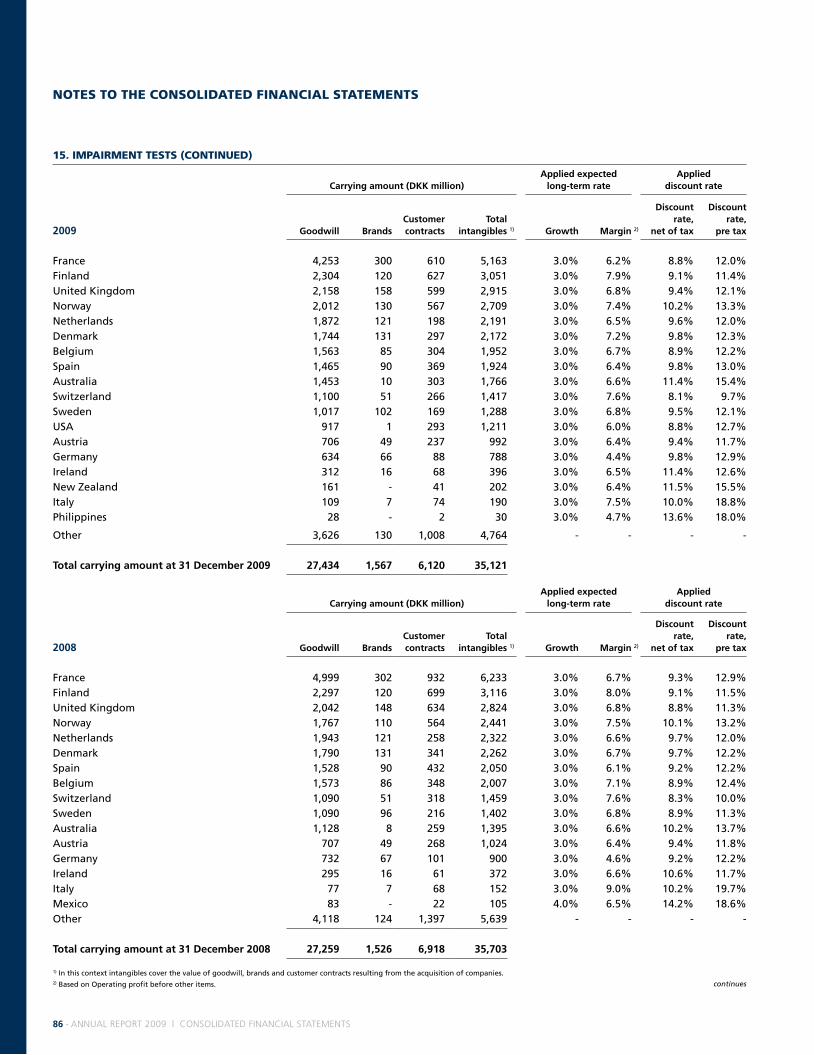
86 · annual report 2009 | consolidated financial stateMents
notes to the Consolidated finanCial statements
15. imPairment tests (Continued)
carrying amount (dkk million)applied expected
long-term rateapplied
discount rate
2009 goodwill brandscustomer contracts
total intangibles 1) growth margin 2)
discount rate,
net of tax
discount rate,
pre tax
France 4,253 300 610 5,163 3.0% 6.2% 8.8% 12.0%Finland 2,304 120 627 3,051 3.0% 7.9% 9.1% 11.4%united Kingdom 2,158 158 599 2,915 3.0% 6.8% 9.4% 12.1%norway 2,012 130 567 2,709 3.0% 7.4% 10.2% 13.3%netherlands 1,872 121 198 2,191 3.0% 6.5% 9.6% 12.0%denmark 1,744 131 297 2,172 3.0% 7.2% 9.8% 12.3%Belgium 1,563 85 304 1,952 3.0% 6.7% 8.9% 12.2%Spain 1,465 90 369 1,924 3.0% 6.4% 9.8% 13.0%Australia 1,453 10 303 1,766 3.0% 6.6% 11.4% 15.4%Switzerland 1,100 51 266 1,417 3.0% 7.6% 8.1% 9.7%Sweden 1,017 102 169 1,288 3.0% 6.8% 9.5% 12.1%uSA 917 1 293 1,211 3.0% 6.0% 8.8% 12.7%Austria 706 49 237 992 3.0% 6.4% 9.4% 11.7%germany 634 66 88 788 3.0% 4.4% 9.8% 12.9%Ireland 312 16 68 396 3.0% 6.5% 11.4% 12.6%new Zealand 161 - 41 202 3.0% 6.4% 11.5% 15.5%Italy 109 7 74 190 3.0% 7.5% 10.0% 18.8%philippines 28 - 2 30 3.0% 4.7% 13.6% 18.0%
other 3,626 130 1,008 4,764 - - - -
total carrying amount at 31 december 2009 27,434 1,567 6,120 35,121
carrying amount (dkk million)applied expected
long-term rateapplied
discount rate
2008 goodwill brandscustomer contracts
total intangibles 1) growth margin 2)
discount rate,
net of tax
discount rate,
pre tax
France 4,999 302 932 6,233 3.0% 6.7% 9.3% 12.9%Finland 2,297 120 699 3,116 3.0% 8.0% 9.1% 11.5%united Kingdom 2,042 148 634 2,824 3.0% 6.8% 8.8% 11.3%norway 1,767 110 564 2,441 3.0% 7.5% 10.1% 13.2%netherlands 1,943 121 258 2,322 3.0% 6.6% 9.7% 12.0%denmark 1,790 131 341 2,262 3.0% 6.7% 9.7% 12.2%Spain 1,528 90 432 2,050 3.0% 6.1% 9.2% 12.2%Belgium 1,573 86 348 2,007 3.0% 7.1% 8.9% 12.4%Switzerland 1,090 51 318 1,459 3.0% 7.6% 8.3% 10.0%Sweden 1,090 96 216 1,402 3.0% 6.8% 8.9% 11.3%Australia 1,128 8 259 1,395 3.0% 6.6% 10.2% 13.7%Austria 707 49 268 1,024 3.0% 6.4% 9.4% 11.8%germany 732 67 101 900 3.0% 4.6% 9.2% 12.2%Ireland 295 16 61 372 3.0% 6.6% 10.6% 11.7%Italy 77 7 68 152 3.0% 9.0% 10.2% 19.7%Mexico 83 - 22 105 4.0% 6.5% 14.2% 18.6%other 4,118 124 1,397 5,639 - - - -
total carrying amount at 31 december 2008 27,259 1,526 6,918 35,703
1) In this context intangibles cover the value of goodwill, brands and customer contracts resulting from the acquisition of companies.2) Based on operating profit before other items. continues

consolidated financial stateMents | annual report 2009 · 87
notes to the Consolidated finanCial statements
15. imPairment tests (Continued)
sensitivity analysis A sensitivity analysis on the key assumptions in the impairment testing is presented below. the allowed change represents the percentage points by which the value assigned to the key assumption as applied in the expected long-term rate can change, all other things being equal, before the unit's recoverable amount equals its carrying amount.
growth margin 1) discount rate, net of tax
2009
applied expected
long-term rate
allowed decrease
applied expected
long-term rate
allowed decrease applied rate
allowed increase
France 3.0% 0.0% 6.2% 0.0% 8.8% 0.0%Finland 3.0% 1.7% 7.9% 1.8% 9.1% 1.8%united Kingdom 3.0% >3.0% 6.8% >3.0% 9.4% >3.0%norway 3.0% >3.0% 7.4% 2.8% 10.2% >3.0%netherlands 3.0% 2.2% 6.5% 1.7% 9.6% 1.6%denmark 3.0% 1.8% 7.2% 1.6% 9.8% 1.8%Belgium 3.0% 1.3% 6.7% 1.2% 8.9% 1.0%Spain 3.0% 0.4% 6.4% 0.4% 9.8% 0.3%Australia 3.0% 1.5% 6.6% 1.1% 11.4% 1.5%Switzerland 3.0% >3.0% 7.6% >3.0% 8.1% >3.0%Sweden 3.0% >3.0% 6.8% >3.0% 9.5% >3.0%uSA 3.0% 0.7% 6.0% 0.7% 8.8% 0.8%Austria 3.0% 0.4% 6.4% 0.4% 9.4% 0.3%germany 3.0% 0.0% 4.4% 0.0% 9.8% 0.0%Ireland 3.0% 0.9% 6.5% 0.7% 11.4% 0.6%new Zealand 3.0% 0.8% 6.4% 0.6% 11.5% 0.6%Italy 3.0% 0.6% 7.5% 0.6% 10.0% 0.5%philippines 3.0% 0.1% 4.7% 0.0% 13.6% 0.1%
growth margin 1) discount rate, net of tax
2008
applied expected
long-term rate
allowed decrease
applied expected
long-term rate
allowed decrease applied rate
allowed increase
France 3.0% 0.8% 6.7% 0.8% 9.3% 0.6%Finland 3.0% 1.3% 8.0% 1.5% 9.1% 1.4%united Kingdom 3.0% >3.0% 6.8% >3.0% 8.8% >3.0%norway 3.0% >3.0% 7.5% 2.9% 10.1% >3.0%netherlands 3.0% 1.5% 6.6% 1.3% 9.7% 1.1%denmark 3.0% 1.0% 6.7% 0.9% 9.7% 1.0%Spain 3.0% 1.4% 6.1% 1.1% 9.2% 1.4%Belgium 3.0% 1.2% 7.1% 1.2% 8.9% 1.3%Switzerland 3.0% >3.0% 7.6% >3.0% 8.3% >3.0%Sweden 3.0% >3.0% 6.8% >3.0% 8.9% >3.0%Australia 3.0% 2.0% 6.6% 1.5% 10.2% 2.1%Austria 3.0% 0.4% 6.4% 0.4% 9.4% 0.5%germany 3.0% 0.0% 4.6% 0.0% 9.2% 0.0%Ireland 3.0% 0.7% 6.6% 0.6% 10.6% 0.4%Italy 3.0% 0.2% 9.0% 0.2% 10.2% 0.1%Mexico 4.0% 0.5% 6.5% 0.3% 14.2% 0.4%
1) Based on operating profit before other items.

88 · annual report 2009 | consolidated financial stateMents
17. investments in assoCiates
DKK million 2009 2008
Cost at 1 January 21 24 Foreign exchange adjustments 1 (3)disposals (0) (0)transfer to Assets held for sale (6) -
cost at 31 december 16 21
Revaluation at 1 January 3 4 Foreign exchange adjustments 1 (0)net result for the year 4 3 dividends received (5) (4)disposals (0) (0)transfer to Assets held for sale 2 -
revaluation at 31 december 5 3
carrying amount at 31 december 21 24
notes to the Consolidated finanCial statements
16. ProPerty, Plant and eQuiPment
2009 2008
DKK millionland and buildings
plant and equipment total
land and buildings
plant and equipment total
Cost at 1 January 285 3,339 3,624 266 3,141 3,407 Foreign exchange adjustments 6 183 189 (8) (183) (191)Adjustment relating to prior years 25 1,332 1,357 - - - Additions 1) 68 886 954 65 899 964 Additions from acquired companies, net (6) (70) (76) 8 163 171 disposals (11) (258) (269) (38) (674) (712)transfers 2) (206) (319) (525) (8) (7) (15)
cost at 31 december 161 5,093 5,254 285 3,339 3,624
depreciation at 1 January (47) (1,301) (1,348) (63) (1,121) (1,184)Foreign exchange adjustments (2) (123) (125) 2 127 129 Adjustment relating to prior years (25) (1,332) (1,357) - - - depreciation (14) (753) (767) (18) (766) (784)Write-downs (92) (67) (159) - - - depreciation from acquired companies, net 2 28 30 (1) (99) (100)disposals 3 166 169 31 558 589 transfers 2) 119 188 307 2 0 2
depreciation at 31 december (56) (3,194) (3,250) (47) (1,301) (1,348)
carrying amount at 31 december 105 1,899 2,004 238 2,038 2,276
hereof assets held under finance leases - 177 177 - 182 182
land and buildings with a carrying amount of dKK 0 million (dKK 5 million in 2008) have been provided as collateral for mortgage debt of dKK 0 million (dKK 0 million in 2008). Additionally, a minor part of land and buildings and plant and equipment in certain countries has been provided as security for the borrowings under the senior facilities, see note 32, Contingent liabilities.
1) In 2009, additions included assets held under finance leases of dKK 114 million (2008: dKK 155 million).2) In 2009, dKK 218 million, net was transferred to Assets held for sale. In 2008, dKK 13 million, net was transferred to Intangible assets.
continues
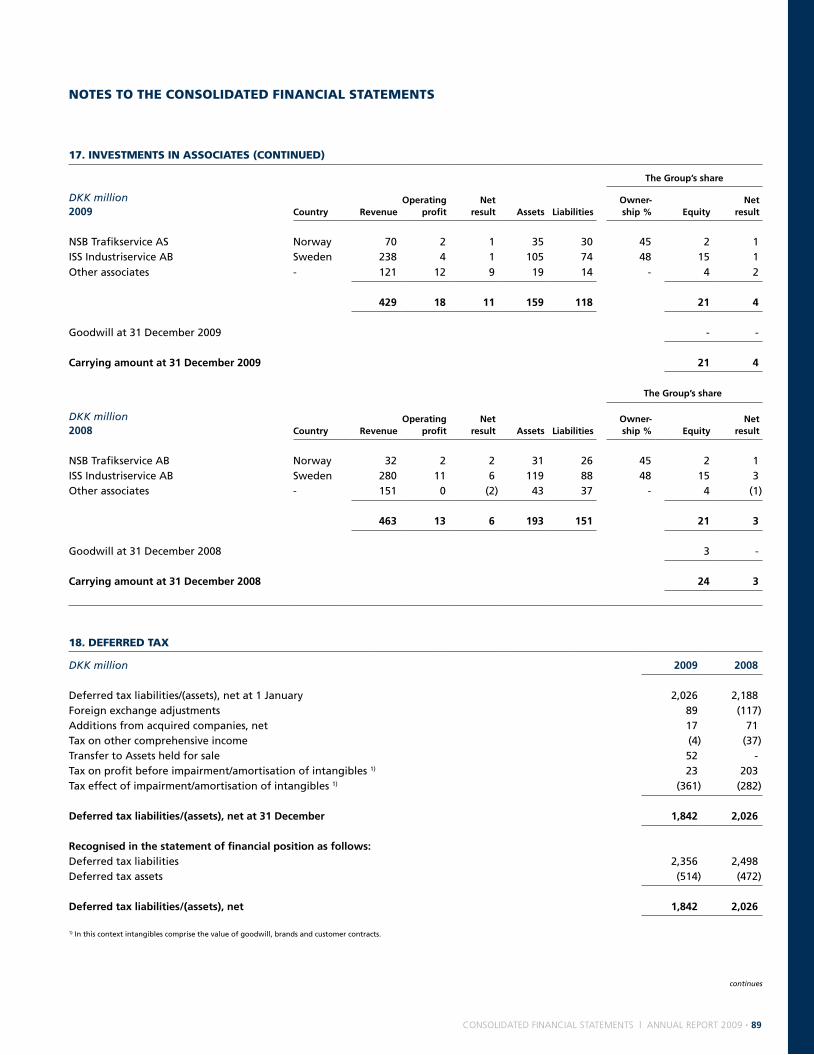
consolidated financial stateMents | annual report 2009 · 89
notes to the Consolidated finanCial statements
17. investments in assoCiates (Continued)
the group’s share
DKK million2009 country revenue
operating profit
net result assets liabilities
owner- ship % Equity
net result
nSB trafikservice AS norway 70 2 1 35 30 45 2 1 ISS Industriservice AB Sweden 238 4 1 105 74 48 15 1 other associates - 121 12 9 19 14 - 4 2
429 18 11 159 118 21 4
goodwill at 31 december 2009 - -
carrying amount at 31 december 2009 21 4
the group’s share
DKK million 2008 country revenue
operating profit
net result assets liabilities
owner- ship % Equity
net result
nSB trafikservice AB norway 32 2 2 31 26 45 2 1 ISS Industriservice AB Sweden 280 11 6 119 88 48 15 3 other associates - 151 0 (2) 43 37 - 4 (1)
463 13 6 193 151 21 3
goodwill at 31 december 2008 3 -
carrying amount at 31 december 2008 24 3
continues
18. deferred tax
DKK million 2009 2008
deferred tax liabilities/(assets), net at 1 January 2,026 2,188 Foreign exchange adjustments 89 (117)Additions from acquired companies, net 17 71 tax on other comprehensive income (4) (37)transfer to Assets held for sale 52 - tax on profit before impairment/amortisation of intangibles 1) 23 203 tax effect of impairment/amortisation of intangibles 1) (361) (282)
deferred tax liabilities/(assets), net at 31 december 1,842 2,026
recognised in the statement of financial position as follows:deferred tax liabilities 2,356 2,498 deferred tax assets (514) (472)
deferred tax liabilities/(assets), net 1,842 2,026
1) In this context intangibles comprise the value of goodwill, brands and customer contracts.

90 · annual report 2009 | consolidated financial stateMents
unrecognised tax assetsthe group had unrecognised deferred tax assets regarding tax losses carried forward in the following countries:
2009 2008
DKK million total recog-
nised unrecog-
nised total recog-
nised unrecog-
nised
germany 297 57 240 254 58 196 denmark 113 111 2 196 195 1 France 61 61 - 8 - 8Brazil 51 4 47 39 2 37Belgium 30 19 11 22 17 5Israel 15 3 12 10 3 7 Austria 9 - 9 2 - 2uSA 8 8 - 22 19 3 Argentina 4 2 2 3 - 3 Hong Kong 3 1 2 2 1 1greece 2 1 1 1 - 1new Zealand 1 1 - 3 - 3Italy 1 - 1 2 - 2
total 327 269
the unrecognised tax losses can be carried forward indefinitely in the individual countries except for the uSA (20 years) and Argentina, greece and Italy (5 years). deferred tax assets relating to tax losses carried forward are only recognised to the extent that it is more likely than not that future taxable profit will be available against which the unused tax losses can be utilised in the foreseeable future taking into account any restrictions in utilisation in the local tax legislation.
notes to the Consolidated finanCial statements
18. deferred tax (Continued)
deferred tax specification2009 2008
DKK milliondeferred tax
assetsdeferred tax
liabilitiesdeferred tax
assetsdeferred tax
liabilities
tax losses carried forward 422 - 443 - goodwill 59 301 47 265 Brands - 443 - 433 Customer contracts - 1,608 - 1,860 property, plant and equipment 122 179 86 118 other provisions 114 - 153 - Issued bonds - 5 - 56 tax losses in foreign subsidiaries under danish joint taxation - 23 - 23Set-off within legal tax units and jurisdictions (203) (203) (257) (257)
deferred tax 514 2,356 472 2,498
the recognition of deferred tax assets regarding tax losses carried forward is supported by expected future profitability in the foreseeable future.
A deferred tax liability associated with investments in subsidiaries, joint ventures and associates has not been recognised, because the group is able to control the timing of the reversal of the temporary differences and does not expect the temporary differences to reverse in the foreseeable future.

consolidated financial stateMents | annual report 2009 · 91
notes to the Consolidated finanCial statements
19. other finanCial assets
DKK million 2009 2008
Costs related to ppp (public private partnerships)/pFI (private Finance Initiative) contracts 7 34 Regulatory long-term loans 54 47 deposits 157 102 other 63 55
other financial assets 281 238
Regulatory long-term loans are measured at amortised cost with any resulting adjustment being recognised in the income statement.
20. inventories
DKK million 2009 2008
Raw materials and supplies 136 102 Work in progress 0 15 Finished goods 167 147
inventories 303 264
inventories expensed 6,044 6,134
21. trade reCeivables
DKK million 2009 2008
trade receivables (gross) 10,371 10,325 provision for doubtful debts (241) (228)
trade receivables 10,130 10,097
the ageing of trade receivables at 31 december was:not past due 8,018 7,793 past due 1 to 60 days 1,600 1,814 past due 61 to 180 days 402 407 past due 181 to 360 days 89 66 More than 360 days 21 17
trade receivables 10,130 10,097
the group's exposure to credit risk and losses related to individual customers is disclosed in note 33, Financial risk management.
continues
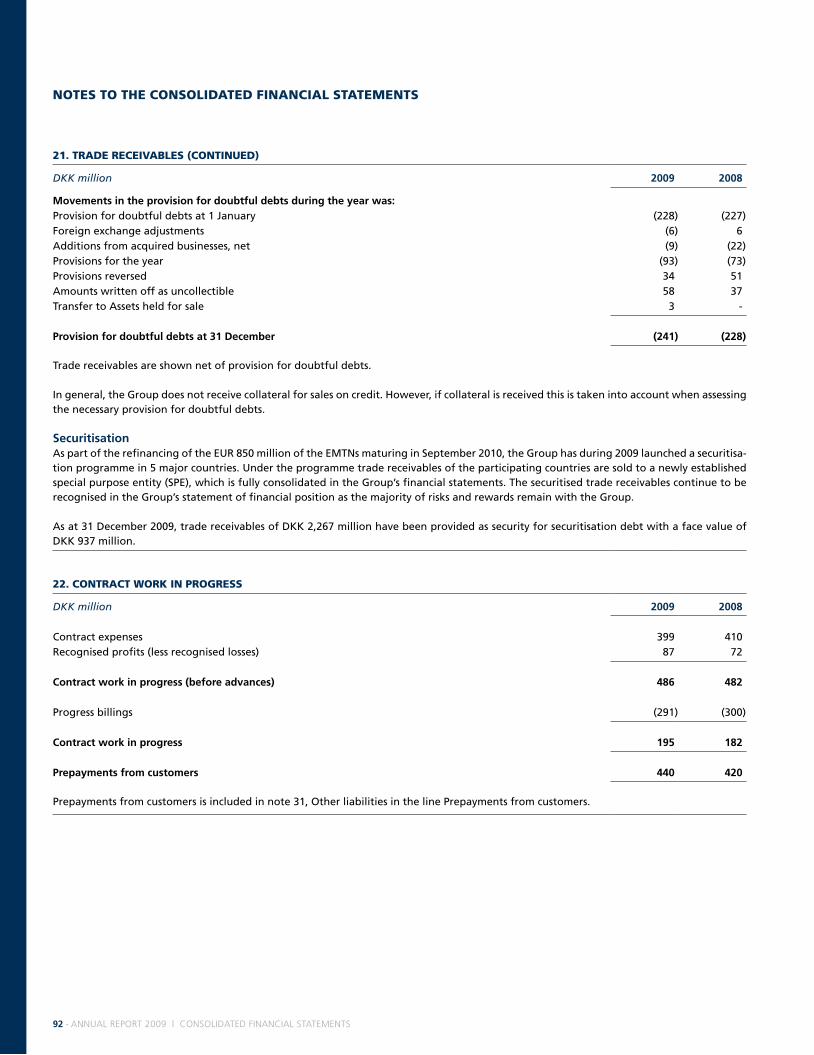
92 · annual report 2009 | consolidated financial stateMents
22. ContraCt work in Progress
DKK million 2009 2008
Contract expenses 399 410 Recognised profits (less recognised losses) 87 72
contract work in progress (before advances) 486 482
progress billings (291) (300)
contract work in progress 195 182
prepayments from customers 440 420
prepayments from customers is included in note 31, other liabilities in the line prepayments from customers.
21. trade reCeivables (Continued)
DKK million 2009 2008
movements in the provision for doubtful debts during the year was:provision for doubtful debts at 1 January (228) (227)Foreign exchange adjustments (6) 6 Additions from acquired businesses, net (9) (22)provisions for the year (93) (73)provisions reversed 34 51 Amounts written off as uncollectible 58 37 transfer to Assets held for sale 3 -
provision for doubtful debts at 31 december (241) (228)
trade receivables are shown net of provision for doubtful debts.
In general, the group does not receive collateral for sales on credit. However, if collateral is received this is taken into account when assessing the necessary provision for doubtful debts.
securitisationAs part of the refinancing of the euR 850 million of the eMtns maturing in September 2010, the group has during 2009 launched a securitisa-tion programme in 5 major countries. under the programme trade receivables of the participating countries are sold to a newly established special purpose entity (Spe), which is fully consolidated in the group’s financial statements. the securitised trade receivables continue to be recognised in the group’s statement of financial position as the majority of risks and rewards remain with the group.
As at 31 december 2009, trade receivables of dKK 2,267 million have been provided as security for securitisation debt with a face value of dKK 937 million.
notes to the Consolidated finanCial statements

consolidated financial stateMents | annual report 2009 · 93
notes to the Consolidated finanCial statements
24. other reCeivables
DKK million 2009 2008
Receivables from companies within the ISS group 12 57 prepayments 525 468 Receivable sales price from divestments 210 2 Currency swaps - 3other 324 246
other receivables 1,071 776
Receivables from companies within the ISS group are related to a joint taxation scheme with danish group companies. the effective interest rate regarding receivables from companies within the ISS group was 6.2% (2008: 6.3%).
prepayments comprise various prepaid expenses such as rent, leasing and insurance as well as accrued interest expenses.
According to the Senior Facility Agreement the use of proceeds from divestments is subject to restrictions. Consequently, divestment proceeds may only be used for acquisition of businesses or repayment of borrowings. It is management's intention to use the proceeds from the receiv-able sales price of dKK 210 million for acquisition of businesses.
23. tax reCeivables and tax Payables
DKK million 2009 2008
tax (receivables)/payables, net at 1 January (105) (126)Foreign exchange adjustments (58) 32 Additions from acquired companies, net 2 5 Adjustment relating to prior years, net 23 (33)tax on profit before impairment/amortisation of intangibles 1) 542 361 tax on other comprehensive income 3 1Joint taxation contribution (15) 18 tax paid, net (394) (363)
tax (receivables)/payables, net at 31 december (2) (105)
recognised in the statement of financial position as follows:tax payables 306 123 tax receivables (308) (228)
tax (receivables)/payables, net (2) (105)
1) In this context intangibles comprise the value of goodwill, brands and customer contracts.

94 · annual report 2009 | consolidated financial stateMents
26. assets and liabilities held for sale
DKK million 2009 2008
goodwill 15 - other intangibles 58 - property, plant and equipment 218 - Financial assets 8 - deferred tax assets 64 - Inventories 2 -trade and other receivables 249 -
assets held for sale 614 -
deferred tax liabilities 12 - pensions and similar obligations 14 -other provisions 64 - Bank loans 11 - trade payables and other liabilities 278 -
liabilities related to assets held for sale 379 -
In 2009, assets and liabilities held for sale related to certain businesses which comprised non-core activities in France, Spain and norway. In 2008, no assets or liabilities were classified as held for sale.
the assets and liabilities of these activities have been classified as held for sale and are presented separately in the statement of financial position at the lower of the carrying amount at the date of the classification as held for sale and fair value less costs to sell. Assets are not depreciated or amortised from the date when they are classified as held for sale.
According to management's estimates the proceeds on disposal of the activities are expected to be lower than the carrying amount of the relevant assets and liabilities. Accordingly, a write-down of net assets on other income and expenses of dKK 159 million, a write-down on goodwill of dKK 448 million and a write-down of customer contracts of dKK 179 million has been recognised at 31 december 2009. generally estimates on proceeds on disposal are associated with uncertainty and may possible be adjusted subsequently.
notes to the Consolidated finanCial statements
25. seCurities, Cash and Cash eQuivalents
2009 2008
carrying amount
(dkk million)
average effective interest
rate
average duration
(years)
carrying amount
(dkk million)
average effective interest
rate
average duration
(years)
Bonds 97 4.0% 0.9 86 4.0% 1.8
securities 97 86
cash and cash equivalents 3,364 1.0% 2,961 2.7%
Bonds mainly consist of listed danish government bonds.
of the total cash position, dKK 62 million (2008: dKK 61 million) was restricted and dKK 1,080 million was reserved for partial redemption of the remaining 2010 eMtns. After the reporting date the group completed a tender offer for additional euR 150 million of the outstanding notes leaving euR 200 million of notes for refinancing before maturity in September 2010.

consolidated financial stateMents | annual report 2009 · 95
notes to the Consolidated finanCial statements
continues
28. borrowings
DKK million 2009 2008
Issued bonds 7,738 10,174 Bank loans 20,633 20,914 Finance lease obligations 115 122
long-term debt 28,486 31,210
Issued bonds due within one year 2,577 - Bank loans due within one year 835 315 Bank loans and overdrafts 1) 1,126 782 Securitisation debt 2) 892 - Finance lease obligations 93 69 debt to companies within the ISS group 3) 94 113
short-term debt 5,617 1,279
total long-term and short-term debt 34,103 32,489
fair value 34,804 29,981
As part of the strategy to refinance the euR 850 million of the eMtns due 2010, the group issued euR 525 million of new Senior notes due 2014, and additionally a securitisation programme was launched in 5 major countries during 2009. due to the terms of the securitisation debt it has been classified as short-term in the statement of financial position although the securitisation facility is committed for a period of 3 years from September 2009 to September 2012.
during 2009, financing fees amounting to dKK 304 million (2008: dKK 0 million) have been recognised in long-term and short-term debt while accumulated financing fees recognised in long-term and short-term debt on 31 december 2009 amounted to dKK 504 million (2008: dKK 307 million).
In 2009 and 2008, the group had no debt convertible into equity.
1) the effective interest rate was 3.8% (2008: 5.9%).2) the effective interest rate was 3.4%.3) debt to companies within the ISS group included 13 million (2008: dKK 43 million) related to a joint taxation scheme with danish resident subsidiaries. the effective interest rate regarding debt to companies
within the ISS group was 4.9% (2008: 6.7%).
27. share CaPital
DKK million 2009 2008
Share capital at 1 January 100 100
share capital at 31 december 100 100
Number of shares (in thousands of shares)number of shares at 1 January 100,000 100,000
number of shares at 31 december - fully paid 100,000 100,000
At 31 december 2009 a total of 100,000,001 shares with a nominal value of dKK 1 per share were issued and fully paid (2008: 100,000,001 shares). no shares carry special rights. Shares are not freely transferable.

96 · annual report 2009 | consolidated financial stateMents
continues
notes to the Consolidated finanCial statements
terms and maturity of long-term debt 2009 2008
DKK millionWeighted average
interest rateinterest
rateinterestrate risk
year of maturity
facevalue
amount hedged 2)
carrying amount
carrying amount
Issued bonds: eMtns due 2010 4.75% Fixed Fair value 2010 - - - 6,149 eMtns due 2014 4.50% Fixed Fair value 2014 822 - 719 706 Subordinated notes 8.875% Fixed Fair value 2016 3,378 - 3,300 3,291 Senior notes 2014 11% Fixed Fair value 2014 3,907 - 3,718 - Interest rate swaps - - - - - - 1 28
Bank loans: Senior facilities: term facility A libor + 2.00% Floating Cash flow 2012 668 1,022 599 884 term facility B libor + 2.00% Floating Cash flow 2013 13,022 7,885 12,952 12,851 Acquisition facility A libor + 2.25% Floating Cash flow 2012 532 599 532 1,280 Acquisition facility B libor + 2.25% Floating Cash flow 2013 2,125 - 2,125 1,467 Second lien facility euribor + 3.75% Floating Cash flow 2015 4,465 4,018 4,412 4,409 other bank loans - - - - 13 - 13 23
Finance lease obligations - - - - 115 - 115 122
long-term debt 6.13% 1) 29,047 28,486 31,210
1) Weighted average interest rate taking the effect of interest rate hedges into account.2) the amount hedged for term facility A and aquisition facility A relates to the long-term as well as the short-term part of the debt.
28. borrowings (Continued)
maturity profile of long-term debtDKK million2009
carrying amount face value 1-2 years 2-3 years 3-4 years 4-5 years > 5 years
Issued bonds 7,738 8,107 - - - 4,729 3,378
Bank loans and finance lease obligations 20,748 20,940 757 569 15,147 - 4,467
long-term debt 28,486 29,047 757 569 15,147 4,729 7,845
2008carrying amount face value 1-2 years 2-3 years 3-4 years 4-5 years > 5 years
Issued bonds 10,174 10,538 6,332 - - - 4,206 Bank loans and finance lease obligations 21,036 21,252 846 916 614 14,405 4,471
long-term debt 31,210 31,790 7,178 916 614 14,405 8,677
the presentation of the maturity profile of long-term debt is based on undiscounted principal cash flows.

consolidated financial stateMents | annual report 2009 · 97
continues
notes to the Consolidated finanCial statements
29. Pensions and similar obligations
the group contributes to defined contribution plans as well as defined benefit plans. the majority of the pension plans are funded through payments of annual premiums to independent insurance companies responsible for the pension obligation towards the employees (defined contribution plans). In these plans the group has no legal or constructive obligation to pay further contributions irrespective of the funding by these insurance companies. pension costs related to such plans are recognised as expenses when incurred.
In some countries, most significantly, the netherlands, Sweden, Switzerland, France, germany and the united Kingdom, the group has pen-sion schemes where the actuarially determined pension obligations are recognised in the statement of financial position (defined benefit plans). the defined benefit plans are primarily based on years of service, and benefits are generally determined on the basis of salary and rank. the majority of the obligations are funded, but in some countries, mainly Sweden and France, the obligation is unfunded.
the group’s liabilities and pension costs under defined benefit plans may be significantly affected by changes in the discount rate, the ex-pected return on plan assets, the social security rate, the rate of increase in salaries and pension contributions, changes in demographic vari-ables or other events and circumstances.
Furthermore, there is a risk that changes to local legislation will entail that pension plans are reclassified from defined contribution plans to defined benefit plans, requiring the group to recognise a provision.
In certain countries, the group participates in multi-employer pension schemes. the funds are currently not able to provide the necessary information in order for the group to account for the schemes as defined benefit plans. the pension schemes are therefore accounted for as defined contribution plans with pension costs being expensed as incurred and recognised in Staff costs, see note 4, Staff costs. there is a risk that the plans are not sufficiently funded. However, information on surplus or deficit in the schemes is not available.
28. borrowings (Continued)
currency profile of long-term debtthe group's long-term debt is denominated in the following currencies:
2009 2008
dKK 0.0% 0.0%euR 91.4% 91.6%gBp 4.8% 4.1%noK 1.3% 1.4%SeK 0.9% 1.2%uSd 0.0% 0.1%others 1.6% 1.6%
100.0% 100.0%
finance lease obligationsFinance lease obligations are payable as follows:
2009 2008
DKK million
minimum lease
payments interest principal
minimum lease
payments interest principal
Within 1 year 100 (7) 93 79 (10) 69 1-5 years 120 (7) 113 136 (15) 121 After 5 years 2 (0) 2 1 (0) 1
222 (14) 208 216 (25) 191

98 · annual report 2009 | consolidated financial stateMents
continues
notes to the Consolidated finanCial statements
29. Pensions and similar obligations (Continued)
recognised in the statement of financial positionDKK million 2009 2008
present value of funded obligations 3,171 2,860 Fair value of plan assets (2,877) (2,591)
Funded obligations, net 294 269 present value of unfunded obligations 487 478 unrecognised past service costs (3) 1 Accumulated impact from asset ceiling 1 14 transfer to liabilities related to assets held for sale (14) -
Recognised in the statement of financial position for defined benefit obligations 765 762 other long-term employee benefits 72 72
pensions and similar obligations at 31 december 837 834
specification of defined benefit obligations:present value of funded obligations 3,171 2,860 present value of unfunded obligations 487 478
defined benefit obligations at 31 december 3,658 3,338
movement in defined benefit obligations (funded and unfunded):present value of obligations at 1 January 3,338 3,244 Foreign exchange adjustments 48 32 Reclassifications 2 47 Additions from acquired companies, net 8 32 Interest on obligation 153 139 Current service costs 117 149 Benefits paid (315) (96)employee contributions 81 74 Actuarial (gains)/losses 224 (244)Recognised past service costs 11 2 liabilities extinguished on settlements and curtailments (9) (41)
present value of obligations at 31 december 3,658 3,338
movement in fair value of plan assets:Fair value of plan assets at 1 January 2,591 2,617 Foreign exchange adjustments 30 43 Reclassifications 3 53 Additions from acquired companies, net - 14 expected return on plan assets 124 134 Actuarial gains/(losses) 179 (426)Assets distributed on settlements (10) (16)employee contributions 81 74 employer contributions 121 139 Benefits paid (242) (41)
fair value of plan assets at 31 december 2,877 2,591

consolidated financial stateMents | annual report 2009 · 99
notes to the Consolidated finanCial statements
recognised in the income statementDKK million 2009 2008
Current service costs 117 149 Interest on obligation 153 139 expected return on plan assets (124) (134)Recognised past service costs, net 7 2 gains on curtailments and settlements, net (3) (30)
recognised in the income statement as staff costs 150 126
losses on settlements related to restructuring projects 4 -
recognised in the income statement as other expenses 4 -
recognised in the statement of comprehensive incomeCumulative (gains)/losses recognised in the statement of comprehensive income at 1 January 122 (35)Actuarial (gains)/losses during the year 45 182 Impact from asset ceiling (18) (25)
cumulative (gains)/losses recognised in the statement of comprehensive income at 31 december 149 122
hereof accumulated actuarial (gains)/losses 148 103
29. Pensions and similar obligations (Continued)
recognised in the statement of financial position (continued)DKK million 2009 2008
realised return on plan assets:expected return on plan assets 124 134 Actuarial gains/(losses) 179 (426)
realised return on plan assets at 31 december 303 (292)
major categories of plan assets (% of total plan assets):Bonds 58% 60%equities 26% 21%property 6% 10%Cash 1% 1%other 9% 8%
total 100% 100%
the group expects to contribute dKK 181 million to its defined benefit plans in 2010.
continues

100 · annual report 2009 | consolidated financial stateMents
notes to the Consolidated finanCial statements
29. Pensions and similar obligations (Continued)
actuarial assumptionsActuarial calculations and valuations are performed annually for all major defined benefit plans. the actuarial assumptions vary from country to country due to local conditions. the range of actuarial assumptions used is as follows:
2009 2008
discount rates at 31 december 1.7-11.0% 1.8-13.0%expected return on plan assets at 31 december 1.7-8.0% 1.8-8.0%Future salary increases 0.0-10.3% 2.0-10.0%Future pension increases 0.0-4.8% 1.3-5.1%
discount rates are based on the market yield of high quality corporate bonds or government bonds with a maturity approximating to the terms of the defined benefit obligations. In Switzerland, which represents 54% of the gross obligation (2008: 56%), the discount rate was 3.3% (2008: 3.8%) and in the euro countries representing 23% of the gross obligation (2008: 23%) the discount rate was between 5.2% and 5.5% (2008: 5.6%-6.0%).
expected return on plan assets is based on the plan asset portfolio and general expectations to the economic development.
historical informationDKK million 2009 2008 2007 2006 2005
present value of obligations (funded and unfunded) 3,658 3,338 3,244 3,446 2,240 Fair value of plan assets (2,877) (2,591) (2,617) (2,606) (1,441)unrecognised past service costs (3) 1 1 1 2 Asset ceiling 1 14 44 3 - transfer to liabilities related to assets held for sale (14) - - - -
net obligations at 31 december 765 762 672 844 801
Actuarial (gains)/losses on obligations 224 (244) (200) (59) 134 Actuarial gains/(losses) on plan assets 179 (426) (48) (13) 15
actuarial (gains)/losses during the year 45 182 (152) (46) 119
cumulative actuarial (gains)/losses at 31 december 148 103 (79) 73 119

consolidated financial stateMents | annual report 2009 · 101
notes to the Consolidated finanCial statements
30. other Provisions
DKK millionlegal cases
self- insurance
acquisition and inte -
gration costs
contingent liabilities in acquisitions other total
2009other provisions at 1 January 176 166 45 45 400 832 Foreign exchange adjustments 7 6 2 0 9 24 transfers, net 1) (4) 4 1 34 (76) (41)Additions from acquired companies, net 2 - - 14 17 33 provisions for the year (included in goodwill) - - 27 - - 27 provisions for the year (included in the income statement) 95 124 46 - 100 365 provisions reversed (against the income statement) (14) (1) (0) - (42) (57)provisions used during the year (39) (99) (95) - (148) (381)
other provisions at 31 december 223 200 26 93 260 802
Current 126 74 26 - 197 423 non-current 97 126 0 93 63 379
223 200 26 93 260 802 2008other provisions at 1 January 163 167 41 14 268 653 Foreign exchange adjustments (8) (17) (3) - (8) (36)transfers, net 1) 3 8 (1) - 7 17 Additions from acquired companies, net 30 - - 31 61 122 provisions for the year (included in goodwill) - - 68 - - 68 provisions for the year (included in the income statement) 57 103 66 - 179 405 provisions for the year (dismantling costs) - - - - 30 30 provisions reversed (against the income statement) (27) (18) (1) - (38) (84)provisions used during the year (42) (77) (125) - (100) (344)unwinding of discount - - - - 1 1
other provisions at 31 december 176 166 45 45 400 832
Current 89 70 43 13 220 435 non-current 87 96 2 32 180 397
176 166 45 45 400 832
legal casesthe provision comprises various obligations in relation to a number of legal cases mainly in Australia, France and the netherlands. Addition-ally, the provision comprises labour related obligations in Belgium, Brazil, France, Israel, portugal, Spain and turkey.
self-insuranceIn Australia, Ireland, the uSA and the united Kingdom, the group carries an insurance provision on employers' liability. Ireland and the united Kingdom are self-insured up to a yearly limit of dKK 20 million (dKK 18 million in 2008) for employers' liability. the uSA is self-insured up to a limit of dKK 1.3 million per claim (dKK 1.3 million in 2008). Australia is self-insured up to a limit of dKK 2.3 million per claim (dKK 1.8 million in 2008). ISS Corporate has taken out a group third party liability insurance programme. the ISS captive insurance company global Insurance A/S carries part of the risk on the third party liability programme with a maximum annual limit of dKK 52 million (dKK 42 million in 2008).
acquisition and integration coststhe provision includes obligations incurred in the normal course of acquisitions mainly related to transaction costs, redundancy payments and termination of rental of properties. transaction costs are included in goodwill. other costs are included in the income statement.
contingent liabilities in acquisitionsthe provision relates to contingent liabilities assumed in connection with acquisitions and mainly relates to legal cases.
otherthe provision comprises various obligations incurred in the course of business, e.g. provision for restructuring, dismantling costs, operational issues and closure of contracts.
1) In 2009, transfers, net consisted of dKK 64 million transferred to liabilities related to assets held for sale offset by provisions of dKK 23 million transferred from other liabilities and pensions and similar
obligations. In 2008, transfers, net consisted of provisions transferred from other liabilities and pensions and similar obligations.

102 · annual report 2009 | consolidated financial stateMents
notes to the Consolidated finanCial statements
31. other liabilities
DKK million 2009 2008
Accrued wages and holiday allowances 4,332 4,358 tax withholdings, VAt etc. 3,069 2,841 prepayments from customers 440 420 Interest rate swaps 256 254 Currency swaps 31 -other payables and accrued expenses 2,606 2,588
other liabilities 10,734 10,461
32. Contingent liabilities
senior facility agreementISS Holding A/S has executed a share pledge over its shares in ISS A/S as security for the group's senior facilities and a secondary share pledge over such shares as security for the subordinated notes issued by ISS Holding A/S.
ISS A/S, ISS global A/S and certain material subsidiaries of ISS global A/S in Australia, Belgium, denmark, Finland, France, the netherlands, norway, Spain, Sweden, the united Kingdom and the uSA have provided guarantees for ISS global A/S's borrowings under the senior fa-cilities. the guarantees have been backed up by security over bank accounts, trade receivables, intra-group receivables, other receivables, properties, production equipment and intellectual property rights of ISS A/S and these subsidiaries. At 31 december 2009, the aggregate approximate values of assets provided as security for the borrowings under the senior facilities were:
DKK billion 2009 2008
goodwill 3.4 2.7Customer contracts 0.9 0.8Intellectual property rights 1.6 1.5other intangible and tangible assets 0.3 0.3trade receivables 2.4 3.2other receivables 0.2 0.2Bank accounts 1.7 1.8
total 10.5 10.5
In addition, the shares in the material subsidiaries and shares in certain of their subsidiaries as well as shares in certain subsidiaries in Aus-tria, Brazil, the Czech Republic, germany, Hong Kong, Ireland, Israel, portugal, new Zealand, Singapore, Switzerland and turkey have been pledged.
securitisationAs part of the refinancing of the euR 850 million of the eMtns maturing in September 2010, the group has during 2009 launched a securiti-sation programme in 5 major countries. under the securitisation programme securitised trade receivables of the participating countries are provided as security for the securitisation debt. As at 31 december 2009, trade receivables of dKK 2,267 million have been placed as security for securitisation debt.
continues

consolidated financial stateMents | annual report 2009 · 103
notes to the Consolidated finanCial statements
32. Contingent liabilities (Continued)
operating leases operating leases consist of leases and rentals of properties, vehicles (primarily cars) and other equipment. the total expense under operating leases in the income statement amounted to dKK 2,070 million (dKK 1,876 million in 2008). Assuming the current car fleet etc. is maintained, the future minimum lease payments under operating leases are:
DKK million year 1 year 2 year 3 year 4 year 5after
5 years total lease payments
at 31 december 2009 1,399 915 616 375 250 448 4,003at 31 december 2008 1,299 920 649 401 286 395 3,950
Additional future lease payments of dKK 6 million (dKK 7 million in 2008) existed regarding associates at 31 december 2009.
commitment vehicle leaseson 1 January 2008 the group extended the global car fleet lease framework agreement for another three year term to 31 december 2010. the framework agreement contains an option for the group to terminate the fleet of an entire country or the entire fleet under the frame-work agreement with four weeks notice subject to payment of a termination amount. the majority of the underlying agreements have a duration of 3-5 years. the disclosed contingent liability includes the group’s total leasing commitment assuming no early termination of any agreement.
guarantee commitmentsIndemnity and guarantee commitments at 31 december 2009 amounted to dKK 462 million (31 december 2008: dKK 318 million).
performance guaranteesthe group has issued performance guarantee bonds for service contracts with an annual revenue of dKK 1,517 million (31 december 2008: dKK 1,305 million) of which dKK 1,288 million (31 december 2008: dKK 1,112 million) were bank-guaranteed performance bonds. Such per-formance bonds are issued in the ordinary course of business in the service industry.
outsourcing of itthe group has an It outsourcing agreement with Computer Sciences Corporation (CSC) running until 2015. the group's contractual obliga-tions related to the agreement at 31 december 2009 amounted to approximately dKK 41 million (31 december 2008: dKK 60 million).
divestmentsthe group makes provisions for claims from purchasers or other parties in connection with divestments and representations and warranties given in relation to such divestments. Management believes that provisions made at 31 december 2009 are adequate. However, there can be no assurance that one or more major claims arising out of the group's divestment of companies will not adversely affect the group's activities, results of operations and financial position.
legal proceedingsthe group is party to certain legal proceedings. Management believes that these proceedings (which are to a large extent labour cases inci-dental to its business) will not have a material impact on the group's financial position beyond the assets and liabilities already recognised in the statement of financial position at 31 december 2009.
Furthermore, restructuring projects aiming at adjusting capacity to lower activity have been undertaken across different geographies and service areas. labour laws especially in Western europe include restrictions on dismissals and procedural rules to be followed. the procedures applied by ISS could be challenged in certain jurisdictions resulting in liabilities. Management believes that this would not have a material impact on the group's financial position beyond the assets and liabilities already recognised in the statement of financial position at 31 december 2009.

104 · annual report 2009 | consolidated financial stateMents
notes to the Consolidated finanCial statements
33. finanCial risk management
the group is exposed to a number of financial risks as a result of its operating activities, investing activities and financing activities, mainly related to fluctuations in exchange rates and interest rates as well as availability of funding.
the group's financial risks are managed centrally in group treasury based on policies approved by the Board of directors. the group's finan-cial risk management is focused on managing risks arising from the group's operating and financing activities, mainly by use of interest rate instruments and currency instruments. generally, the group seeks to apply hedge accounting in order to manage volatility in the group's results. It is not the group's policy to take speculative positions in the financial markets.
the group has not identified any additional financial risk exposures in 2009. However, the individual risk associated with the exposures identi-fied have changed following the current financial crisis.
market riskMarket risk is the risk that changes in market prices, such as currency and interest rates, will affect the group's result or value of its holdings of financial instruments.
currency risk the service industry is characterised by a relatively low level of transaction risk, since the services are produced and delivered in the same local currency with minimal exposure from imported components.
However, as an international business with the majority of revenue and operating profit originating from foreign entities, the group is ex-posed to risk relating to translation into danish kroner of income statements and net assets of foreign subsidiaries, including intercompany items such as loans, royalties, management fees and interest payments between entities with different functional currencies.
Furthermore, the group has a currency risk to the extent that its interest payments with respect to borrowings are not denominated in the same currencies as the group's revenue.
Additionally, the group is exposed to a currency risk on borrowings denominated in other currencies than danish kroner. the currency profile of the group's long-term debt is shown in note 28, Borrowings.
the group is exposed mainly to the following currencies: euR, CHF, noK, SeK, gBp, Aud and uSd.
the group uses currency swaps to hedge the currency risk related to borrowings and intercompany loans to foreign subsidiaries. the objec-tive of hedging is to enter into positions with an opposite risk profile to reduce the exposure to currency risk. group treasury measures the group's total currency exposure in different currencies on a monthly basis in order to evaluate the need for hedging currency positions. When measuring the currency positions all borrowings and intercompany balances are taken into account.
It is the group's overall policy to fully hedge any foreign exchange exposure against danish kroner or against euro to the extent that the net exposure exceeds dKK 5 million. However, certain currencies are not possible to hedge within a reasonable price range, i.e. BRl and ISK and are therefore not hedged. the exposure against euro is hedged based on an individual assessment.
It is not group policy to hedge the currency exposure on foreign investments. Consequently, no hedging transactions of net investments in foreign subsidiaries were entered into in 2009 and 2008. However, the group may choose to hedge the currency exposure on foreign invest-ments by funding such investments in local currencies.
impact of exchange rates on operating profit before other items and equityIn 2009, the currencies in which the group's revenue was denominated decreased with an average of 2.8% (2008: decreased with 2.6%) rela-tive to danish kroner, decreasing the group's revenue by dKK 1,877 million (2008: a decrease of dKK 1,624 million). Currency movements decreased the group's operating profit before other items by dKK 126 million (2008: a decrease of dKK 107 million). the effect of the transla-tion of net assets in foreign subsidiaries increased equity by dKK 364 million (2008: a decrease of dKK 792 million).
continues

consolidated financial stateMents | annual report 2009 · 105
notes to the Consolidated finanCial statements
continues
33. finanCial risk management (Continued)
A 5% change in foreign exchange rates of the group's main currencies would have impacted revenue, operating profit before other items and equity by the amounts shown below. the analysis is based on the assumption that all other variables remain constant.
2009 2008
Effect in DKK million revenue
operating profit before
other items
net assets in foreign
subsidiaries revenue
operating profit before
other items
net assets in foreign
subsidiaries
euR 1,522 76 385 1,523 90 448 CHF 132 11 64 123 10 59 gBp 347 24 100 378 26 90 noK 262 21 39 284 20 29 SeK 177 11 26 196 13 27 Aud 171 12 27 169 11 19 uSd 126 7 22 211 13 65 other 523 35 142 367 23 82
total 3,260 197 805 3,251 206 819
interest rate risk the group's most significant interest rate risk relates to the interest-bearing debt. the group's loan portfolio primarily consists of bank loans (senior facilities, second lien facility and securitisation debt) and listed bonds (eMtns, subordinated notes and senior notes).
to manage the interest rate risk the group uses fixed-rate bonds and derivatives, such as interest rate swaps. A part of the group's interest payments on the senior facilities and second lien facility have been swapped from floating into fixed rates, see note 28, Borrowings, where a breakdown of the group's long-term debt and applied interest rate swaps is provided.
According to the Senior Facility Agreement at least 50% of the group's total long-term debt and bonds must carry fixed interest rates. At least on a monthly basis group treasury measures the balance between fixed and variable interest rates to ensure compliance with the policy.
the interest rate risk is measured by the duration of the net debt (fixed-rate period). As at 31 december 2009, the duration of net debt was approximately 2.2 years (31 december 2008: 2.0 years). A decrease in interest rates will increase the fair value of the debt with a fixed interest rate, but only part of this increase will be reflected in the income statement and equity as long-term borrowings are measured at amortised cost and therefore not adjusted to fair value. It is estimated that a general increase in relevant interest rates of 1%-point would increase the annual interest expenses, net by dKK 91 million (2008: dKK 60 million), all other things being equal. the estimate is based on net debt adjusted for the effect of hedging instruments as at 31 december 2009.
the group's exposure to floating interest rates is primarily in euR.
liquidity riskliquidity risk is the risk that the group will encounter difficulties in meeting its contractual obligations associated with its financial liabilities due to insufficient liquidity. It is the group's policy that the raising of capital and investment of liquidity is managed centrally. It is therefore the responsibility of group treasury to ensure efficient liquidity management, which mainly comprise ensuring that adequate liquidity is available.
For day-to-day liquidity management cash pools have been established in several local entities. As a result excess liquidity is transferred to ISS global A/S on a frequent basis.
the group's liquid reserves mainly consist of liquid funds and unused credit facilities. As at 31 december 2009, the group's liquid reserves consisted of unrestricted liquid funds of dKK 3,302 million (2008: dKK 2,900 million) of which dKK 1,080 million was reserved for partial redemption of the remaining 2010 eMtns and unused revolving credit facilities of dKK 418 million (2008: dKK 817 million) available for drawing until 30 June 2012. It is the group's policy to maintain an appropriate level of liquid reserve.

106 · annual report 2009 | consolidated financial stateMents
notes to the Consolidated finanCial statements
33. finanCial risk management (Continued)
the bank loans, subordinated notes and senior notes are subject to customary undertakings, covenants (including financial covenants) and other restrictions. Financial covenants comprise the following: i) debt cover ii) Senior debt cover, iii) Cash flow cover, iv) Interest cover and v) limitation on Capex spending. the financial covenants are calculated on a last-twelve-months basis and reported quarterly, except for ii) and v), which are only reported at year-end. In the event of a default under those agreements, the debt incurred including accrued interest could be declared immediately due and payable. In 2009 and 2008, all covenants have been complied with.
For a breakdown of the maturity of the group's long-term debt, see note 28, Borrowings. the maturity of the group's financing facilities (long-term and short-term) is also illustrated in the charts below:
maturity profile of nominal debt (dkk bn) commitment curve (dkk bn)
0
2,000
4,000
6,000
8,000
10,000
12,000
14,000
16,000
Senior EMTNs Senior notes Subordinated notes Second lien Securitisation
2010 2011 2012 2013 2014 2015 2016
Senior EMTNs Senior notes Subordinated notes Second lien Securitisation
2010 2011 2012 2013 2014 2015 20160
5,000
10,000
15,000
20,000
25,000
30,000
35,000
In July 2009, the group issued euR 525 million of new Senior notes due 2014 as part of the strategy to refinance the euR 850 million of eMtns maturing in September 2010. the proceeds were used to settle euR 500 million of the outstanding notes. Furthermore, a securitisation pro-gramme was launched in 5 major countries in the second half of 2009 and additional countries are intended to be included in the programme in 2010. the proceeds from the securitisation programme will be used for refinancing the remaining euR 350 million of the eMtns due 2010. After the reporting date the group completed a tender offer for additional euR 150 million of the outstanding notes leaving euR 200 million of notes for refinancing before maturity in September 2010.
capital managementthe group monitors the capital structure and evaluates the need for adjustments on an ongoing basis. the dividend policy and payment of dividends is made subject to the necessary consolidation of equity and the group's continuing expansion. the group seeks to reduce the financial leverage on a multiple basis in terms of net debt to pro forma adjusted eBItdA 1). At 31 december 2009, the group's net debt to proforma adjusted eBItdA was 6.55x (2008: 5.92x).
ISS Holding A/S (the group's parent) is a holding company, and its primary assets consist of shares in ISS A/S. ISS Holding A/S has no revenue generating operations of its own, and therefore ISS Holding A/S’s cash flow and ability to service its indebtedness, will depend primarily on the operating performance and financial condition of ISS A/S and its operating subsidiaries, and the receipt by ISS Holding A/S of funds from ISS A/S and its subsidiaries in the form of dividends or otherwise.
credit riskCredit risk is the risk of a counterparty failing to meet its contractual obligations and so inflicting a loss on the group. the group's credit risk is mainly related to transactions with financial institutions (liquid funds and derivatives with positive fair value) and service deliveries to customers (trade receivables). It is the group's policy that financial transactions may be entered into only with financial institutions with a high credit rating.
the group is not exposed to significant risks relating to individual customers. the group performs ongoing credit evaluations of the financial condition of the group's counterparties in order to reduce the credit risk exposure. losses on bad debt relating to individual customers have historically been relatively low. It is estimated that the provisions made are sufficient to cover expected losses (see note 21, trade receivables).
1) pro forma information is based on unaudited financial information and for informational purposes only. For further information, see Capital structure on page 137.

consolidated financial stateMents | annual report 2009 · 107
notes to the Consolidated finanCial statements
34. finanCial assets and liabilities
the fair values of financial assets and liabilities, together with the carrying amounts in the statement of financial position, are shown below:
2009 2008
carrying carryingDKK million note amount fair value amount fair value
Securities (fair value option) 25 97 97 86 86
financial assets designated at fair value through profit or loss 97 97 86 86
derivative financial instruments designated as fair value hedge 35 0 0 22 22
financial assets used for hedging 0 0 22 22
trade receivables 21 10,130 10,130 10,097 10,097 other receivables 24 1,071 1,071 776 776 Cash and cash equivalents 25 3,364 3,364 2,961 2,961 other financial assets 19 281 281 238 238
loans and receivables 14,846 14,846 14,072 14,072
derivative financial instruments designated as fair value hedge 35 31 31 19 19
financial liabilities designated at fair value through profit or loss 31 31 19 19
derivative financial instruments designated as cash flow hedge 35 256 256 254 254
financial liabilities used for hedging 256 256 254 254
Issued bonds 28 10,315 10,779 10,489 7,450 Bank loans 28 23,486 23,723 21,696 22,227 Finance lease obligations 28 208 208 191 191 debt to companies within the ISS group 28 94 94 113 113 trade payables 2,624 2,624 2,835 2,835 other liabilities 31 10,478 10,478 10,207 10,207
financial liabilities measured at amortised cost 47,205 47,906 45,531 43,023
continues

108 · annual report 2009 | consolidated financial stateMents
notes to the Consolidated finanCial statements
34. finanCial assets and liabilities (Continued)
methods, assumptions and techniques used to determine fair valuethe methods, assumptions and techniques used in determining the fair values of each category of financial assets and liabilities is disclosed below. the methods are unchanged compared with 2008.
generally, the valuation methods for determining fair value are categorised as follows (fair value hierarchy):
> level 1: Quoted prices (unadjusted) in active markets for identical assets or liabilities> level 2: Inputs other than quoted prices included within level 1 that are observable for the asset or liability, either directly (i.e., as prices)
or indirectly (i.e., derived from prices)> level 3: Inputs for the asset or liability that are not based on observable market data (unobservable inputs).
securitiesSecurities mainly consist of listed danish government bonds measured at fair value through the income statement. the fair value is deter-mined by reference to their quoted prices at the reporting date (level 1).
derivative financial instrumentsderivative financial instruments comprise currency swaps and interest rate swaps.
the fair value of derivative financial instruments is determined on the basis of observable market data using generally accepted methods. the fair value of interest rate swaps is based on market rates for yield curves (level 2). Changes in the fair value are recognised in equity. the fair value of currency swaps is based on the difference between the purchase price and the price at the reporting date (level 1). Changes in the fair value of currency swaps are recognised in the income statement.
other financial liabilitiesother financial liabilities, including issued bonds, bank loans, finance lease obligations, trade payables and other liabilities are measured at amortised cost.
the note disclosure of the fair value of the issued bonds (eMtns, subordinated notes and senior notes) is based on the quoted market price on the luxembourg Stock exchange (level 1). For the remaining part of long-term and short-term debt fair value is equal to the nominal value (level 2).

consolidated financial stateMents | annual report 2009 · 109
35. derivatives
As described in the note 33, Financial risk management, the group uses derivative financial instruments (interest rate swaps and currency swaps) for managing currency and interest risks arising from the group's operating and financing activities.
the accounting treatment of hedge transactions varies according to the nature of the item being hedged and whether the hedge qualifies for hedge accounting according to IFRS. derivatives that qualify for hedge accounting are being accounted for in accordance with the nature of the item being hedged and the applicable hedge model. the group uses two types of hedges: fair value hedges and cash flow hedges.
fair value hedgesthe group uses currency swaps to hedge the exposure to currency risk on the intercompany loans to foreign subsidiaries as well as the cur-rency risk on external borrowings denominated in a currency other than danish kroner. Changes in the fair value of currency swaps used as fair value hedges are recognised in the income statement.
DKK million contractual value fair value
fair value adjustment
recognised in theincome statement maturity
2009CHF 407 0 0 2010euR 3,491 (0) (0) 2010gBp 579 (1) (1) 2010
forward foreign currency, purchases 4,477 (1) (1)
Aud 1,178 (14) (14) 2010CZK 101 (0) (0) 2010IlS 182 (1) (1) 2010Mxn 91 (0) (0) 2010noK 1,304 (3) (3) 2010SeK 369 (4) (4) 2010uSd 994 (5) (5) 2010others 482 (3) (3) 2010
forward foreign currency, sales 4,701 (30) (30)
total fair value hedges at 31 december 2009 9,178 (31) (31)
2008CHF 263 5 5 2009euR 3,842 (2) (2) 2009gBp 435 (13) (13) 2009
forward foreign currency, purchases 4,540 (10) (10)
Aud 977 (1) (1) 2009CZK 151 2 2 2009IlS 205 (3) (3) 2009Mxn 73 4 4 2009noK 1,098 2 2 2009SeK 280 - - 2009uSd 909 6 6 2009others 471 3 3 2009
forward foreign currency, sales 4,164 13 13
total fair value hedges at 31 december 2008 8,704 3 3
notes to the Consolidated finanCial statements
continues

110 · annual report 2009 | consolidated financial stateMents
35. derivatives (Continued)
cash flow hedgesthe group uses interest rate swaps to hedge the exposure to variability in future cash flows due to changes in interest rates on the group's bank loans with a variable interest rate.
Changes in the fair value of interest rate swaps designated as cash flow hedges are recognised in equity in a separate hedging reserve until the hedged transaction is realised. At this time, gains or losses concerning such hedging transactions are transferred from equity and recog-nised in the income statement in the same line as the hedged item.
DKK millioninterest rate instruments 1) contractual value fair value
fair value adjustment
recognised inequity maturity
2009Interest rate swap - 2012 (CHF), payer 172 (2) (2) 2012Interest rate swap - 2010 (CHF), payer 170 (1) (1) 2010Interest rate swap - 2012 (gBp), payer 1,381 (3) (3) 2012Interest rate swap - 2010 (gBp), payer 1,070 (10) (10) 2010Interest rate swap - 2010 (gBp), payer 311 (3) (3) 2010Interest rate swap - 2012 (SeK), payer 393 (4) (4) 2012Interest rate swap - 2010 (SeK), payer 383 (2) (2) 2010Interest rate swap - 2012 (noK), payer 485 (3) (3) 2012Interest rate swap - 2010 (noK), payer 470 (2) (2) 2010Interest rate swap - 2011 (euR), payer 4,018 (34) (34) 2011Interest rate swap - 2010 (euR), payer 4,018 (26) (26) 2010Interest rate swap - 2012 (euR), payer 1,042 (25) (25) 2012Interest rate swap - 2012 (euR), payer 1,042 (24) (24) 2012Interest rate swap - 2011 (euR), payer 599 (13) (13) 2011Interest rate swap - 2012 (euR), payer 1,116 (18) (18) 2012Interest rate swap - 2011 (euR), payer 1,072 (5) (5) 2011Interest rate swap - 2012 (euR), payer 1,116 (18) (18) 2012Interest rate swap - 2012 (euR), payer 744 (12) (12) 2012Interest rate swap - 2011 (euR), payer 372 (2) (2) 2011Interest rate swap - 2010 (euR), payer 3,126 (20) (20) 2010Interest rate swap - 2010 (euR), payer 599 (4) (4) 2010Interest rate swap - 2010 (euR), payer 372 (3) (3) 2010Interest rate swap - 2010 (euR), payer 1,116 (8) (8) 2010Interest rate swap - 2010 (euR), payer 1,861 (14) (14) 2010
total cash flow hedges at 31 december 2009 27,048 (256) (256)
2008Interest rate swap - 2009 (CHF), payer 192 (1) (1) 2009Interest rate swap - 2010 (CHF), payer 169 (2) (2) 2010Interest rate swap - 2009 (gBp), payer 289 (3) (3) 2009Interest rate swap - 2010 (gBp), payer 289 (8) (8) 2010Interest rate swap - 2010 (gBp), payer 994 (38) (38) 2010Interest rate swap - 2009 (SeK), payer 415 (1) (1) 2009Interest rate swap - 2010 (SeK), payer 361 (5) (5) 2010Interest rate swap - 2009 (noK), payer 462 (0) (0) 2009Interest rate swap - 2010 (noK), payer 398 (5) (5) 2010Interest rate swap - 2009 (euR), payer 600 (1) (1) 2009Interest rate swap - 2010 (euR), payer 600 (7) (7) 2010Interest rate swap - 2010 (euR), payer 3,129 (44) (44) 2010Interest rate swap - 2010 (euR), payer 3,353 (69) (69) 2010Interest rate swap - 2010 (euR), payer 4,023 (70) (70) 2010
total cash flow hedges at 31 december 2008 15,274 (254) (254)
1) the swaps convert a major part of the floating rates within the bank loans to fixed interest rates.
notes to the Consolidated finanCial statements

consolidated financial stateMents | annual report 2009 · 111
notes to the Consolidated finanCial statements
36. related Parties
parent and ultimate controlling party the sole shareholder of ISS Holding A/S, ISS equity A/S, has controlling influence in the group. the ultimate controlling company of the group is FS Invest S.à r.l ("FS Invest"), which is 54% owned by funds advised by eQt partners and 44% owned by funds advised by goldman Sachs Capital partners, together the principal Shareholders. there were no significant transactions with the parent company or the ultimate controlling party during the year.
key management personnelmembers of the board of directors, the Executive group management and corporate senior officers Members of the Board of directors, the executive group Management and Corporate Senior officers have authority and responsibility for planning, implementing and controlling the group's activities and are therefore considered as the group's key management personnel. Apart from remuneration, described in note 4, Staff costs and co-investment programmes described below there were no significant transactions during the year with members of the Board of directors, the executive group Management or Corporate Senior officers.
co-investment programmesthe principal Shareholders have established a Management participation programme, under which the executive group Management and a number of senior officers 1) of the group were offered to invest. the programme is structured as a combination of direct and indirect invest-ments in a mix of shares and warrants of FS Invest, ISS Holding A/S's ultimate parent. As of 31 december 2009, the investments amounted to dKK 196.7 million in total for 156 executives and officers. As part of the initial programme - in addition to the investments - the executive group Management and a number of Corporate officers 2) were granted warrants in FS Invest with a vesting schedule (based on value of shares and time). As of 31 december 2009, 329,404 were outstanding, see note 5, Share-based payments.
non-executive members of the Board of directors (except representatives of the principal Shareholders) were offered to participate in a direc-tors participation programme, under which they have invested in a mix of shares and warrants of FS Invest amounting to approximately dKK 9.0 million in total. In addition, they have co-invested with the principal Shareholders for approximately dKK 14.7 million in total.
External directorships and external executive positions of the board of directors at 31 december 2009
board of directors board member Executive position
ole Andersen (Chairman) privathospitalet Hamlet A/S (Chairman), Bang & olufsen a/s and georg Jensen A/S
Senior advisor to eQt partners
leif Östling (Vice-Chairman) Scania AB, AB SKF (Chairman), Svenskt näringsliv (Confederation of Swedish enterprise) and teknik-företagen (the Association of Swedish engineer-ing Industries)(Chairman)
president and Ceo of Scania AB
Christoph Sander none none
Steven Sher Ahlsell Sverige AB, edam Acquisitions B.V., I Co-operatief u.A. and certain holding companies of Ahlsell Sverige AB and endemol B.V.
Managing director, goldman Sachs International, principal Investment Area
peter Korsholm Btx group A/S, CaridianBCt Holding Corp and gambro AB
partner and Head of the Copenhagen office of eQt partners
John Allan national grid plc, dSg International plc (Chair-man), 3i group plc
none
Marcus Brennecke Kabel Baden-Württemberg, CZV, SAg and CBR Senior partner and head of the Munich office of eQt partners
Casper von Koskull none Managing director, goldman Sachs International
1) Senior officers of the group comprises Corporate Senior officers (members of group Management other than members of the executive group Management) and other Corporate officers as well
as certain members of Country Management of each country.2) Corporate officers of the group comprises Corporate Senior officers (members of group Management other than members of the executive group Management) and other Corporate officers.
continues

112 · annual report 2009 | consolidated financial stateMents
notes to the Consolidated finanCial statements
continues
36. related Parties (Continued)
External directorships and external executive positions of the Executive group management
Executive group management board member Executive position
Jørgen lindegaard efsen engineering A/S noneJeff gravenhorst danish Crown noneJakob Stausholm Statoil ASA none
other related party transactionsIn 2009, the group had the following transactions with other related parties, which were all made on market terms:
> the group received/paid interest from/to ISS equity A/S, see note 8, net finance costs.> the group received/paid joint taxation contribution equal to 25% of taxable income from/to ISS equity A/S (the ultimate parent company
in denmark).> the group and goldman Sachs have agreed general terms and conditions for the supply of Facility Services to be applied by local ISS opera-
tions and local goldman Sachs affiliates when contracting with each other. ISS in Switzerland, Russia and the united Kingdom have entered into Facility Services agreements with local goldman Sachs affiliates. the annual revenue from these agreements is estimated at dKK 68 million. Furthermore, the group has local agreement terms with goldman Sachs in France, Ireland, Singapore, Mexico and China. the an-nual revenue from these agreements is estimated at dKK 8 million.
> the group and goldman Sachs have entered into various agreements on provision of financing and banking related services.
associates and joint ventures transactions with associates and joint ventures are limited to transactions related to shared service agreements. there were no significant transactions with associates and joint ventures during the year. All transactions were made on market terms.
otherIn addition to the above and except for intra-group transactions, which have been eliminated in the consolidated accounts, there were no material transactions with other related parties and shareholders during the year.

consolidated financial stateMents | annual report 2009 · 113
notes to the Consolidated finanCial statements
37. interests in Joint ventures
As of 31 december 2009, the group had interests in 10 joint ventures (10 in 2008). the significant joint ventures are specified in note 39, Subsidiaries, associates, joint ventures and Spes. the group's interests in joint ventures are recognised using the proportionate consolidation method. At the reporting date the joint ventures had the following effect on the group's consolidated income statement and statement of financial position:
DKK million 2009 2008
Revenue 332 202 expenses (304) (190)
operating profit before other items 28 12
net profit for the year 20 7
non-current assets 1) 26 16 Current assets 101 76
total assets 127 92
equity 39 22 non-current liabilities 5 2 Current liabilities 83 68
total equity and liabilities 127 92
the group's part of contingent liabilities (operating leases) in joint ventures 16 6
the aggregate investment in joint ventures is as follows: Sri lanka dKK 3.8 million (2008: dKK 4 million), norway dKK 28.2 million (2008: dKK 12.6 million), the netherlands dKK 8.1 million (2008: dKK 3.4 million), Spain dKK 0.6 million (2008: dKK 1.7 million), Israel dKK (1.5) million (2008: dKK (0.3) million) and Hong Kong dKK 0.0 million (2008: dKK 0.4 million).
1) excluding goodwill arising from the acquisition of the joint ventures.
38. subseQuent events
on 22 January 2010, the group completed the tender offer for euR 150 million of the outstanding 2010 eMtns plus accrued interest. the notes were acquired at a purchase price of euR 1,020 per euR 1,000 principal amount and resulted in an accounting loss of approximately dKK 32 million, which has been recognised in the income statement in 2010. the accounting loss results primarily from the purchase price being above nominal value, and additionally from the carrying amount being below nominal value due to the fair value adjustment made in connection with ISS Holding A/S's acquisition of ISS A/S 9 May 2005.
on 2 February 2010, the group announced that Jørgen lindegaard will step down as group Ceo as of 31 March 2010 and that the current group Coo, Jeff gravenhorst, will take over the responsibility as group Ceo on 1 April 2010.
Acquisitions and divestments completed subsequent to 31 december 2009 are listed in note 12, Acquisition and divestment of businesses.
Apart from the above and the events described in the Financial Statements, the group is not aware of events subsequent to 31 december 2009, which are expected to have a material impact on the group's financial position.

114 · annual report 2009 | consolidated financial stateMents
notes to the Consolidated finanCial statements
continues
39. subsidiaries, assoCiates, Joint ventures and sPes
Below the significant subsidiaries, associates, joint ventures and Spes of the group are presented together with a group chart showing the ownership structure from ISS equity A/S and down. together these are referred to as "Companies within the ISS group".
argentina brazilequipo Blanco S.R.l. 100% BJp Manutenção e operação de utilidades ltda. 100%Facility Services S.R.l. 100% ISS Biosystem Saneamento Ambiental ltda. 100%ISS Argentina S.A. 100% ISS Catering Sistemas de Alimentação ltda. 100%SIM S.A. 100% ISS Servisystem do Brasil ltda. 100%top Service S.R.l. 100% ISS Sulamericana Brasil ltda. 100%
loghis logistica Integrada ltda. 100%australia SMV Manutenção Volante ltda. 100%ISS Catering Services pty ltd. 100%ISS Facility Services Australia ltd. 100% brunei ISS Facility Services pty ltd. 100% ISS Facility Services Sdn. Bhd. 100%ISS Franchise Services pty ltd. 100%ISS Health Services pty ltd. 100% bulgariaISS Holdings pty ltd. 100% ISS Facility Services eood 100%ISS Hygiene Services pty ltd. 100%ISS Integrated Services pty ltd. 100% canadaISS property Services pty ltd. 100% ISS Facility Services Inc. 100%ISS Security pty ltd. 100%pacific Invest december 2004 pty ltd. 100% chilepacific Service Solutions pty ltd. 100% eFI ltda. 100%prestige protection Services pty ltd. 100% glanzend ltda. 100%
ISS Chile S.A. 100%austria ISS Facility Services S.A. 100%ISS Austria Holding gmbH 100% ISS office Support ltda. 100%ISS Beta Beteiligungsverwaltung gmbH 100% ISS Servicios generales ltda. 100%ISS Facility Services gmbH 100% ledan ltda. 100%ISS Hotel, SpA & gastro Services gmbH 100% Slim S.A. 100%ISS ground Services gmbH 51%
china and hong kongbelgium Cornerstone Associates ltd. 100%Bd Food Invest S.A. 100% Hung Fat Cleaning transportation Co., ltd. 100%ISS Building Services n.V. 100% ISS Adams Secuforce limited 100%ISS Catering n.V. 100% ISS Allsecure ltd. 100%ISS Industrial Cleaning n.V. 100% ISS Building Consultancy ltd. 100%ISS Industrial Services n.V. 100% ISS China Holdings I ltd. 100%ISS n.V. 100% ISS China Holdings ltd. 100%ISS office Support Services n.V. 100% ISS eastpoint properties ltd. 100%lease plant International n.V. 100% ISS eastpoint property Consultants ltd. 100%national pest Control B.V.B.A. 100% ISS eastpoint property Management ltd. 100%party & dinner n.V. 100% ISS environmental Services (HK) ltd. 100%pest Management Solutions n.V. 100% ISS Facility Services (Beijing) ltd. 100%Synerg'ISS n.V. 100% ISS Facility Services China ltd. 100%
ISS Facility Services ltd. 100%bosnia and herzegovina ISS greater China ltd. 100%eco Servis d.o.o. Sarajevo 100% ISS Hangyang (Beijing) Cleaning Services Co., ltd. 100%ISS Facility Services d.o.o. Banja luka 100% ISS Hong Kong Services ltd. 100%ISS Facility Services d.o.o. Sarajevo 100% ISS Hongrun Facility Services (Shanghai) ltd. 100%
ISS A/S
ISS global A/S
Australia uSAArgentina ...
ISS Holding A/S
ISS equity A/S

consolidated financial stateMents | annual report 2009 · 115
notes to the Consolidated finanCial statements
39. subsidiaries, assoCiates, Joint ventures and sPes (Continued)
china and hong kong (continued) france (continued)ISS Hygiene Services (HK) ltd. 100% Hoguin espaces Verts SAS 100%ISS Mediclean (HK) ltd. 100% Ifopro Sarl 100%ISS pan Asia Security Services ltd. 100% ISS Abilis France SAS 100%ISS Roboclean (HK) Co., ltd. 100% ISS Accueil & Services SAS 100%ISS Servisystem (China) ltd. 100% ISS environnement SAS 100%ISS thomas Cowan Co., ltd. 70% ISS espaces Verts SAS 100%JSl ltd. 100% ISS Facility Service SAS 100%lAWn environmental protection ltd. 100% ISS Holding paris SAS 100%Shanghai ISS Houban Catering Management Co., ltd. 100% ISS Hygiene SAS 100%Silvertech e&M engineering Co., ltd. 100% ISS Hygiene & prevention SAS 100%
ISS logistique et production SAS 100%croatia ISS Sécurité SAS 100%ISS Kadrovske usluge d.o.o. 100% l'Impeccable SAS 100%ISS usluzne djelatnosti d.o.o. 100% logicbuy SAS 100%
Qualitec SAS 100%czech republic Stop FlAM SAS 100%ISS Facility Services s.r.o 100% tRI 72 50% **ISS optimal s.r.o. 100% tRI 17 30% **ISS Sprava Budov s.r.o. 100% Verts paysages & Aménagement SAS 100%
denmark germanyglobal Insurance A/S 100% AA Schädlingsbekämpfung HRS Helmut Riedl gmbH 100%House of Coffee A/S 100% deBeoS gmbH 100%ISS Kloak- & Industriservice A/S 100% grossjung SBK dienstleitungsgesellschaft mbH 100%ISS document A/S 100% ISS damage Control deutschland gmbH 100%ISS Facility Services A/S 100% ISS Facility Services gmbH 100%ISS Finans A/S 100% ISS HWS gmbH & Co. Kg 100%ISS Holding France A/S 100% ISS personalservice gmbH 100%ISS Venture A/S 100% ISS Schädlingsbekämpfung und Hygiene gmbH 100%ISS Security A/S 100% Klaus Harren gmbH 100%personalehuset A/S 100% Vatro gmbH & Co. Kg 86%
Vatro Verwaltungs gmbH 86%EstoniaISS eesti AS 51% greeceISS Haldus oÜ 51% ISS ASpIS Security S.A. 100%ISS Holding oÜ 100% ISS Facility Services S.A. 100%
ISS Human Resources S.A. 100%finlandISS Aviation oy 100% greenlandISS Henkilöstöpalvelut oy 100% ISS grønland A/S 100%ISS palvelut Holding oy 100%ISS palvelut oy 100% hungaryISS proko oy 100% ISS Facility Services Kft. 100%ISS Security oy 100% profi-Komfort Kft. 100%ISS teollisuuspalvelut oy 100%Suomen laatutakuu palvelut oy 100% iceland
ISS Island ehf. 100%franceBSe SAS 100% indiaChannel SAS 100% ISS Catering Services (South) pvt. ltd. 100%CpMS SA 100% ISS Catering Services (West) pvt. ltd. 100%europe Filtration SAS 100% ISS Facility Services India pvt. ltd. 100%europrop SAS 100% ISS Hicare limited 100%extincteurs HaaS SAS 100% ISS Integrated Facility Services pvt. ltd. 100%Force protection SAS 100% ISS Management Services pvt. ltd. 100%FSI SAS 100% ISS pest Control Services pvt. ltd. 100%gIe ISS Services 100% ISS Records Management Solutions pvt. ltd. 100%gRoS environnement SAS 100%
continues

116 · annual report 2009 | consolidated financial stateMents
continues
notes to the Consolidated finanCial statements
39. subsidiaries, assoCiates, Joint ventures and sPes (Continued)
indonesia netherlandsp.t. ISS Catering Services 100% drielanden Bos & landscapsbouw B.V. 100%p.t. ISS Facility Services 100% groene team B.V. 100%p.t. ISS Indonesia 100% ISS Arbo plus B.V. 100%p.t. ISS parking Management 100% ISS Building Maintenance Services B.V. 100%
ISS Catering Services B.V. 100%ireland ISS Cure & Care B.V. 100%ISS Ireland Holding ltd. 100% ISS Food Hygiene B.V. 100%ISS Ireland ltd. 100% ISS Holding nederland B.V. 100%ISS Security ltd. 100% ISS Hygiene Services B.V. 100%
ISS Integrated Facility Services B.V. 100%israel ISS landscaping Services B.V. 100%Catering ltd. 100% ISS nederland B.V. 100%Catering tefen (1991) ltd. 100% ISS Reception Services B.V. 100%glat Chef ltd. 50% * ISS Security Services B.V. 100%ISS Ashmoret ltd. 100% omring thuisservice B.V. 50% *ISS Isreal Comprehensive Services for Business ltd. 100% talentgroep Montaigne Facility Management B.V. 100%ISS Israel Manpower Services ltd. 100%ISS Kfir Surveillance, and Control Solutions ltd. 100% new zealandI.S.S outsourcing ltd. 100% First Security guard Services ltd. 100%Kfir electronic Security Systems and Surveillance ltd. 100% First Security guard Services 2008 ltd. 100%M.A.S.H. Mahatz Agencies ltd. 100% ISS Facilities Services ltd. 100%norcat ltd. 100% ISS Holdings nZ ltd. 100%norfolk enterprizes ltd. 100%norfolk International ltd. 100% norway Shmuel Werner ltd. 100% ForvaltningsCompagniet AS 100%
Hero Holding AS 50% *italy Human Ressource Center AS 100%ISS Facility Services S.r.l. 100% IpeC Kristiansand AS 100%g.S. Services S.p.A. 100% ISS Facility Services AS 100%Karmak S.p.A. 100% ISS Holding AS 100%
ISS Industri AS 100%japan ISS personalhuset AS 100%nihon ISS KK 100% ISS Serveringspartner AS 100%
nSB trafikkservice AS 45% **latvia Raufoss Beredskap AS 51%ISS namu Serviss SIA 51% Reaktorskolen AS 100%
Varig gruppen AS 70%lithuaniaISS pastatu Valda uAB 51% philippines
ISS Facility Services phils., Inc. 100%luxembourgISS Facility Services S.A. 100% polandlux Intérim S.A.R.l. 100% ISS Facility Services Sp. z.o.o. 100%
malaysia portugalISS Facility Services Sdn. Bhd. 30% ISS Facility Services, lda 100%ISS Hygiene Services Sdn. Bhd. 100% ISS FS Açores, lda 100%Kontrekleen Services Sdn. Bhd. 30% ISS Human Resources, lda. 100%Reliance Suci environmental Services Sdn. Bhd. 30% ISS pest Control, lda. 100%
ISS plantiagro, lda. 100%mexico ISS portugal II, lda. 100%decoración y Mantenimiento San Rafael, SA de CV 100%ISS Centro América, S de Rl de CV 100% romaniaISS Servicios gerenciales, S de Rl de CV 100% 3d Romania S.A. 100%ISS Servicios Integrales, S de Rl de CV 100% ISS Facility Services S.R.l. 100%Mantenimiento ténico tapnew, SA de CV 100% ISS Romania group S.R.l. 100%Martex, SA de CV 100%

consolidated financial stateMents | annual report 2009 · 117
notes to the Consolidated finanCial statements
39. subsidiaries, assoCiates, Joint ventures and sPes (Continued)
russia sweden (continued)Facility Services RuS llC 100% ISS Facility Services Holding AB 100%
ISS Industriservice AB 48% **singapore ISS lemonia AB 100%ISS Catering pte. ltd. 100% ISS palvelut Holding AB 100%ISS Facility Services private limited 100% ISS traffiCare AB 100%ISS Hydroculture pte. ltd. 100%ISS landscaping pte. ltd. 100% switzerlandISS M&e pte. ltd. 100% erwin Jakober Ag 100%ISS pest Management pte. ltd. 100% ISS Aviation Ag 100%ISS Sanitation Services pte. ltd. 100% ISS Bernasconi SA 100%ISS-CdCS Catering pte. ltd. 100% ISS Facility Services (liechtenstein) Ag 100%ISS-Woko Catering pte. ltd. 100% ISS Facility Services Ag 100%Kaffe ISS Catering pte. ltd. 100% ISS FM Services Ag 100%Serve 1st Services pte. ltd. 100% ISS Holding Ag 100%
ISS notter Kanalservice Ag 100%slovakia ISS pest Control Ag 100%ISS Aviation Slovakia spol s.r.o. 51% ISS Schweiz Ag 100%ISS Facility Services spol s.r.o. 100% Jakober Ag 100%ISS Security spol s.r.o. 100%Ryvola Slovakia spol s.r.o. 100% taiwan
ISS Facility Services ltd. 100%slovenia ISS International Facility Services ltd. 100%ISS Facility Services d.o.o. 100% ISS Security ltd. 100%Magnetik d.o.o. 100%
thailandsouth africa golden Mind Manufacturing Co., ltd. 100%ISS Facility Services (pty) limited 100% golden Mind Marketing Co., ltd. 100%
golden Mind Services Co., ltd. 100%spain golden Mind transportation Co., ltd. 100%Centro de Actividades Formativas y educacionales S.l. 100% ISS Facility Services Co., ltd. 100%Fabri Facility Management, S.l. 100% ISS Security Services Co ltd. 100%gelim Andalucia S.A. 100% Job golden Co., ltd. 100%gelim Asturias S.A. 100% notre-Bel Co., ltd. 100%gelim Baleares S.A. 100% SARA Services Co., ltd. 100%gelim Madrid S.A. 100%gelim S.A. 100% turkeygelim Valencia S.A. 100% CMC Iletisim Bilgi Reklam ve danismanlik Integrated Service Solutions S.l. 100% Hiz. San. tic. A.S. 90%ISS Activa educacional S.l. 100% dort u Hasere Kontrol Hizmetleri A.S. 90%ISS Facility Services S.A. 100% ISS tesis yönetim Hizmetleri A.S. 90%ISS Financiera Corporativa S.l. 0% *** Mettek güvenlik organizasyonlari A.S. 90%ISS Higiene Ambiental 3d S.A. 100% Mettek Hizmet organizasyonlari A.S. 90%ISS logistica producción y outsourcing S.l. 100% paksil organizasyon otel turizm Hizmet San. A.S. 90%ISS Mediterranean Vending Solutions S.l. 100% proser Koruma ve güvenlik Hizmetleri A.S. 90%ISS Salud y Servicios Sociosanitarios S.A. 100% Sardunya Hazir yemek uretim ve Hizmet A.S. 90%ISS Serv. Auxiliares y Complem. de oficinas S.A. 100%ISS Servicios Control Incendios S.l. 100% united kingdomISS Soluciones de Catering S.l. 100% Arena21 ltd. 100%ISS Soluciones de Jardinería S.l. 100% ISS (Brentwood) ltd. 100%ISS Soluciones de Mantenimiento gestión Integral S.l. 100% ISS Collections ltd. 0% ***ISS Soluciones de Seguridad S.l. 100% ISS damage Control (Scotland) ltd. 100%
ISS damage Control ltd. 100%
sri lanka ISS Facility Services ltd. 100%ISS Abans environmental Services (pt) ltd. 50% * ISS Financing plc. 0% ***
ISS Mediclean ltd. 100%sweden ISS Servicelink ltd. 100%gK Rengörarna AB 100% ISS uK Holding ltd. 100%ISS demogruppen AB 100% ISS uK ltd. 100%ISS Facility Services AB 100% pegasus Security Holdings ltd. 100%

118 · annual report 2009 | consolidated financial stateMents
notes to the Consolidated finanCial statements
39. subsidiaries, assoCiates, Joint ventures and sPes (Continued)
united kingdom (continued) usaRCo group ltd. 100% C&S Building Maintenance Corporation 100%Spectrum Franchising ltd. 100% ISS Holding (uSA) Inc. 100%Spectrum Holdings ltd. 100% ISS Facility Services Holding, Inc. 100%Strata Security and Combined Services ltd. 100% ISS Facility Services of California, Inc. 100%the Catering people ltd. 100% ISS Facility Services, Inc. 100%
ISS grounds Control, Inc. 100%uruguay ISS Management and Finance Co., Inc. 100%Falcri ltda. 100% ISS tMC Services, Inc. 100%Habitue S.A. 100% ISS uniguard, Inc. 100%ISS uruguay S.A. 100% tMC Ridge, llC 100%Samilar S.A. 100% tri-enterprise Construction, llC 100%
undertakings of immaterial interest are left out.* Joint venture
** Associate
*** Special purpose entity (Spe)
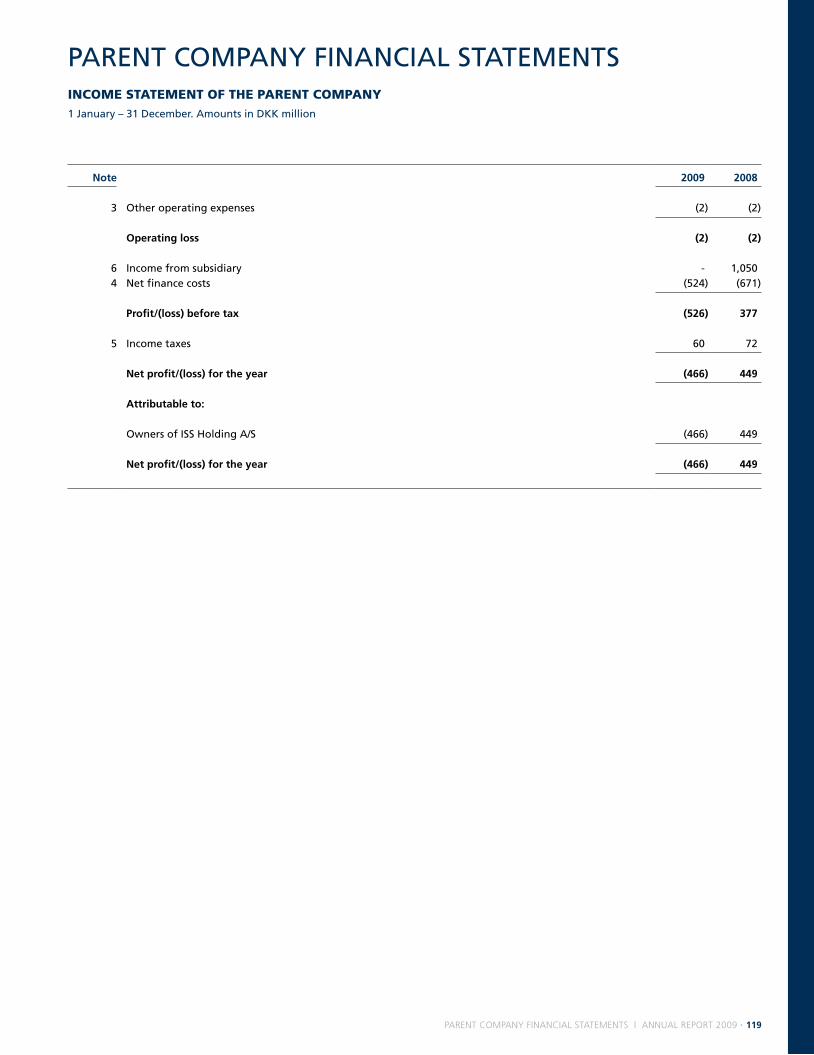
parent coMpany financial stateMents | annual report 2009 · 119
inCome statement of the Parent ComPany
1 January – 31 december. Amounts in dKK million
note 2009 2008
3 other operating expenses (2) (2)
operating loss (2) (2)
6 Income from subsidiary - 1,050 4 net finance costs (524) (671)
profit/(loss) before tax (526) 377
5 Income taxes 60 72
net profit/(loss) for the year (466) 449
attributable to:
owners of ISS Holding A/S (466) 449
net profit/(loss) for the year (466) 449
pARent CoMpAny FInAnCIAl StAteMentS

120 · annual report 2009 | parent coMpany financial stateMents
statement of ComPrehensive inCome of the Parent ComPany
1 January – 31 december. Amounts in dKK million
note 2009 2008
net profit/(loss) for the year (466) 449
other comprehensive income14 Fair value adjustment of hedges, net (77) (82)14 Fair value adjustment of hedges, net, transferred to net finance costs 87 (43)
5, 11 tax regarding other comprehensive income (2) -
other comprehensive income 8 (125)
total comprehensive income for the year (458) 324
attributable to:
owners of ISS Holding A/S (458) 324
total comprehensive income for the year (458) 324

parent coMpany financial stateMents | annual report 2009 · 121
statement of Cash flows of the Parent ComPany
1 January – 31 december. Amounts in dKK million
note 2009 2008
operating loss (2) (2)Changes in working capital 0 (0)
11 Income taxes received, net 110 166
cash flow from operating activities 108 164
6 dividends received from subsidiary - 1,050
cash flow from investing activities - 1,050
Repayment of borrowings - (1,043)Interest paid, net (581) (649)payments from companies within the ISS group 472 478
cash flow from financing activities (109) (1,214)
total cash flow (1) (0)
Cash and cash equivalents at 1 January 1 1 total cash flow (1) (0)
15 cash and cash equivalents at 31 december 0 1

122 · annual report 2009 | parent coMpany financial stateMents
statement of finanCial Position of the Parent ComPany
At 31 december. Amounts in dKK million
note 2009 2008
assets
6 Investment in subsidiary 14,153 14,153 15 Receivables from companies within the ISS group 343 324 7 deferred tax assets 89 191
total non-current assets 14,585 14,668
15 Receivables from companies within the ISS group 99 510 15 other receivables - 0 15 Cash and cash equivalents 0 1
total current assets 99 511
total assets 14,684 15,179
Equity and liabilities
8 total equity 6,860 7,318
9, 15 long-term debt 7,712 7,700
total long-term liabilities 7,712 7,700
15 trade payables - 0 15 debt to companies within the ISS group - 39 15 other liabilities 112 122
total current liabilities 112 161
total liabilities 7,824 7,861
total equity and liabilities 14,684 15,179
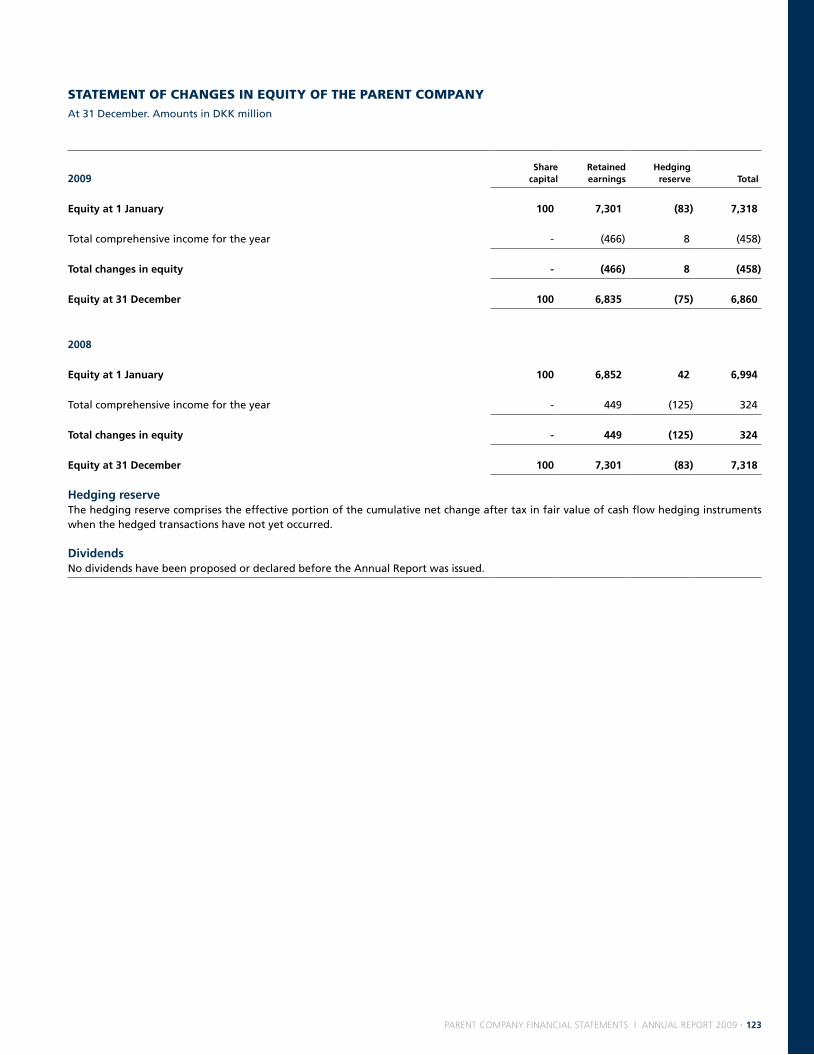
parent coMpany financial stateMents | annual report 2009 · 123
2009share
capitalretained earnings
hedging reserve total
Equity at 1 january 100 7,301 (83) 7,318
total comprehensive income for the year - (466) 8 (458)
total changes in equity - (466) 8 (458)
Equity at 31 december 100 6,835 (75) 6,860
2008
Equity at 1 january 100 6,852 42 6,994
total comprehensive income for the year - 449 (125) 324
total changes in equity - 449 (125) 324
Equity at 31 december 100 7,301 (83) 7,318
hedging reservethe hedging reserve comprises the effective portion of the cumulative net change after tax in fair value of cash flow hedging instruments when the hedged transactions have not yet occurred.
dividendsno dividends have been proposed or declared before the Annual Report was issued.
statement of Changes in eQuity of the Parent ComPany
At 31 december. Amounts in dKK million

124 · annual report 2009 | parent coMpany financial stateMents
notes to the finanCial statements of the Parent ComPany
note page
accounting policies1 Significant accounting policies 1252 Critical accounting estimates and judgements 125
income statement3 Fees to auditors elected at the Annual general Meeting 1264 net finance costs 1265 Income taxes 127
statement of financial position6 Investment in subsidiary 1277 deferred tax 1288 Share capital 1289 Borrowings 129
other10 Remuneration to the Board of directors and the executive group Management 13011 tax receivables and tax payables 13012 Contingent liabilities 13113 Financial risk management 13114 derivatives 13215 Financial assets and liabilities 13216 Related parties 133

parent coMpany financial stateMents | annual report 2009 · 125
1. signifiCant aCCounting PoliCies
2. CritiCal aCCounting estimates and Judgements
notes to the finanCial statements of the Parent ComPany
statement of ComPlianCethe financial statements of ISS Holding A/S have been prepared in accordance with International Financial Reporting Standards (IFRS) as adopted by the eu and additional danish disclosure requirements (class C large size) and the statutory order on the adoption of IFRS is-sued pursuant to the danish Financial Statements Act.
In addition, the financial statements have been prepared in compli-ance with the IFRSs issued by the IASB.
Changes in aCCounting PoliCiesWith effect from 1 January 2009 ISS Holding A/S has implemented "Cost of an investment in a Subsidiary, Jointly Controlled entity or Associate" (amendments to IFRS 1 and IAS 27). the change results in dividends from subsidiaries being fully recognised in the income statement when the right to receive the dividend is established. pre-viously, dividends were only recognised in the income statement to the extent that they exceeded accumulated earnings after the date of acquisition. the adoption of the amendment did not affect the recognition and measurement.
In addition hereto reference is made to the description of changes in accounting policies in note 1 to the group's consolidated financial statements.
desCriPtion of aCCounting PoliCiesWith the exception of the items described below, the accounting policies for ISS Holding A/S are identical to the group's accounting policies, which are described in note 1 to the consolidated financial statements.
inCome statementincome from subsidiary comprises dividends and gains and losses from divestment of subsidiaries. dividends are recognised in the in-come statement in the financial year in which the dividend is de-clared. If dividends declared exceed the total comprehensive income for the year, an impairment test is performed.
statement of finanCial Positioninvestments in subsidiaries are measured at cost. If there is indica-tion of impairment, an impairment test is performed as described in the accounting policies in note 1 to the consolidated financial state-ments. Where the recoverable amount is lower than the cost, invest-ments are written down to this lower value.
tax ISS Holding A/S is jointly taxed with all danish resident subsidiar-ies. the danish income tax payable is allocated between the jointly taxed danish companies based on their proportion of taxable in-come (full absorption including reimbursement of tax deficits). the jointly taxed companies are included in the danish tax on account scheme. Additions, deductions and allowances are recognised under net finance costs.
Critical accounting estimates and judgements relating to the applied accounting policies for ISS Holding A/S are the same as for the group to the extent of similar accounting items, see note 2 to the consoli-dated financial statements for a description. In addition, estimates and judgements are required for measurement of ISS Holding A/S's investments in subsidiaries as described below. Furthermore, the spe-cific risks for ISS Holding A/S are described in the notes to the finan-cial statements of the parent company.
investments in subsidiaries are tested for impairment when there is an indication that the investments may be impaired. the assessment of whether there is an indication of impairment is based on both external and internal sources of information such as performance of the subsidiaries, significant decline in market values etc.

126 · annual report 2009 | parent coMpany financial stateMents
notes to the finanCial statements of the Parent ComPany
3. fees to auditors eleCted at the annual general meeting
DKK million 2009 2008
kpmgAudit fees 1 1 other services 1 1
total kpmg 2 2
Audit fees comprised audit of the Financial Statements.
4. net finanCe Costs
DKK million 2009 2008
Interest income from ISS global A/S 30 62 Interest income from other companies within the ISS group 19 32 Foreign exchange gain 28 -
financial income 77 94
Interest expenses etc. 1) (630) (699)Interest expenses to companies within the ISS group - (2)Amortisation of financing fees 29 (31)Foreign exchange loss - (33)
financial expenses (601) (765)
net finance costs (524) (671)
1) In all material aspects related to long-term debt.
In 2009, amortisation of financing fees is positively impacted by an adjustment of dKK 51 million related to amortisation in prior years.

parent coMpany financial stateMents | annual report 2009 · 127
notes to the finanCial statements of the Parent ComPany
5. inCome taxes
DKK million 2009 2008
Current tax regarding profit before tax 164 126 deferred tax regarding profit before tax (102) (54)
tax on profit before tax 62 72 Adjustments relating to prior years, net (2) 0
total tax recognised in the income statement 60 72
income tax recognised in other comprehensive income
2009 2008
DKK million before tax tax net of tax before tax tax net of tax
Fair value adjustment of hedges, net (77) 19 (58) (82) 20 (62)Fair value adjustment of hedges, net, transferred to net finance costs 87 (21) 66 (43) 11 (32)limitation to interest deduction in denmark - - - - (31) (31)
total income tax recognised in other comprehensive income 10 (2) 8 (125) - (125)
6. investment in subsidiary
DKK million 2009 2008
Cost at 1 January 22,050 22,050
cost at 31 december 22,050 22,050
Revaluation at 1 January (7,897) (7,897)
revaluation at 31 december (7,897) (7,897)
carrying amount at 31 december 14,153 14,153
income from subsidiaryReceived dividends - 1,050
income from subsidiary - 1,050
subsidiary share % share %
ISS A/S, Copenhagen, denmark 100 100

128 · annual report 2009 | parent coMpany financial stateMents
notes to the finanCial statements of the Parent ComPany
7. deferred tax
DKK million 2009 2008
deferred tax assets, net at 1 January 191 245 deferred tax regarding profit before tax (102) (54)
deferred tax assets, net at 31 december 89 191
deferred tax specificationDKK million 2009 2008
tax losses carried forward 89 191
deferred tax 89 191
the recognition of deferred tax assets regarding tax losses carried forward is supported by expected future profitability in the foreseeable future. In addition, ISS Holding A/S has unrecognised deferred tax assets regarding tax losses carried forward of dKK 1 million (2008: dKK 1 million). the unrecognised tax losses can be carried forward indefinitely.
8. share CaPital
DKK million 2009 2008
Share capital at 1 January 100 100
share capital at 31 december 100 100
Number of shares (in thousands of shares)number of shares at 1 January 100,000 100,000
number of shares at 31 december – fully paid 100,000 100,000
At 31 december 2009, a total of 100,000,001 shares with a nominal value of dKK 1 per share were issued and fully paid (2008: 100,000,001 shares). no shares carry special rights. Shares are not freely transferable.

parent coMpany financial stateMents | annual report 2009 · 129
notes to the finanCial statements of the Parent ComPany
9. borrowings
DKK million 2009 2008
Issued bonds 3,300 3,291 Bank loans 4,412 4,409
long-term debt 7,712 7,700
fair value 7,708 6,382
the fair value of the issued bonds (subordinated notes) is based on the quoted market price on the luxembourg Stock exchange.
during 2009, no financing fees have been recognised in long-term debt (2008: dKK 2 million) while accumulated financing fees recognised in long-term debt on 31 december 2009 amounted to dKK 131 million (2008: dKK 153 million).
In 2009 and 2008, ISS Holding A/S had no debt convertible into equity.
maturity profile of long-term debt
DKK million2009
carrying amount
facevalue 1-2 years 2-3 years 3-4 years 4-5 years > 5 years
Issued bonds 3,300 3,378 - - - - 3,378 Bank loans 4,412 4,465 - - - - 4,465
long-term debt 7,712 7,843 - - - - 7,843
2008carrying amount
facevalue 1-2 years 2-3 years 3-4 years 4-5 years > 5 years
Issued bonds 3,291 3,383 - - - - 3,383 Bank loans 4,409 4,470 - - - - 4,470
long-term debt 7,700 7,853 - - - - 7,853
the presentation of the maturity profile of long-term debt is based on undiscounted principal cash flows.
terms and maturity of long-term debtDKK million 2009 2008
Weighted average interest rate
interest rate
interestrate risk
year of maturity
facevalue
amount hedged
carrying amount
carrying amount
Issued bonds: Subordinated notes 8.875% Fixed Fair value 2016 3,378 - 3,300 3,291 Bank loans: Second lien facility euribor + 3.75% Floating Cash flow 2015 4,465 4,018 4,412 4,409
long-term debt 7.9% 1) 7,843 7,712 7,700
1) Weighted average interest rate taking the effect of interest rate hedges into account.
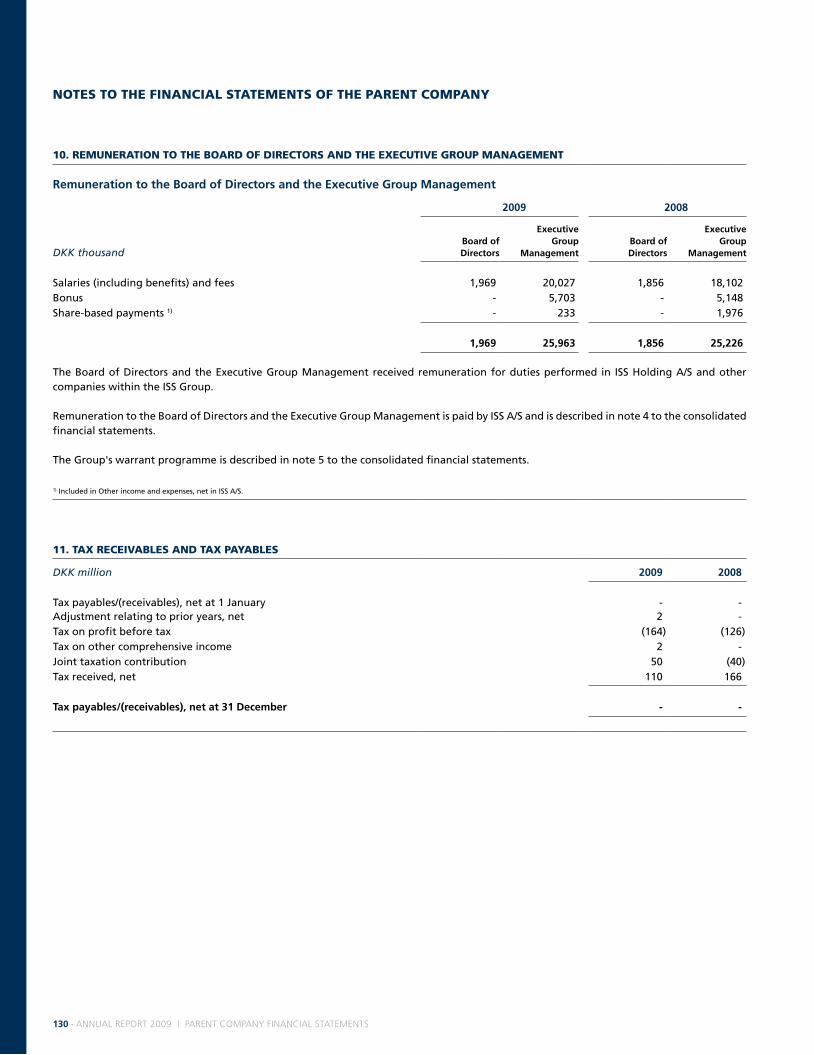
130 · annual report 2009 | parent coMpany financial stateMents
notes to the finanCial statements of the Parent ComPany
10. remuneration to the board of direCtors and the exeCutive grouP management
remuneration to the board of directors and the Executive group management
2009 2008
DKK thousandboard of directors
Executive group
management board of directors
Executive group
management
Salaries (including benefits) and fees 1,969 20,027 1,856 18,102 Bonus - 5,703 - 5,148 Share-based payments 1) - 233 - 1,976
1,969 25,963 1,856 25,226
the Board of directors and the executive group Management received remuneration for duties performed in ISS Holding A/S and other companies within the ISS group.
Remuneration to the Board of directors and the executive group Management is paid by ISS A/S and is described in note 4 to the consolidated financial statements.
the group's warrant programme is described in note 5 to the consolidated financial statements.
1) Included in other income and expenses, net in ISS A/S.
11. tax reCeivables and tax Payables
DKK million 2009 2008
tax payables/(receivables), net at 1 January - - Adjustment relating to prior years, net 2 - tax on profit before tax (164) (126)tax on other comprehensive income 2 - Joint taxation contribution 50 (40)tax received, net 110 166
tax payables/(receivables), net at 31 december - -
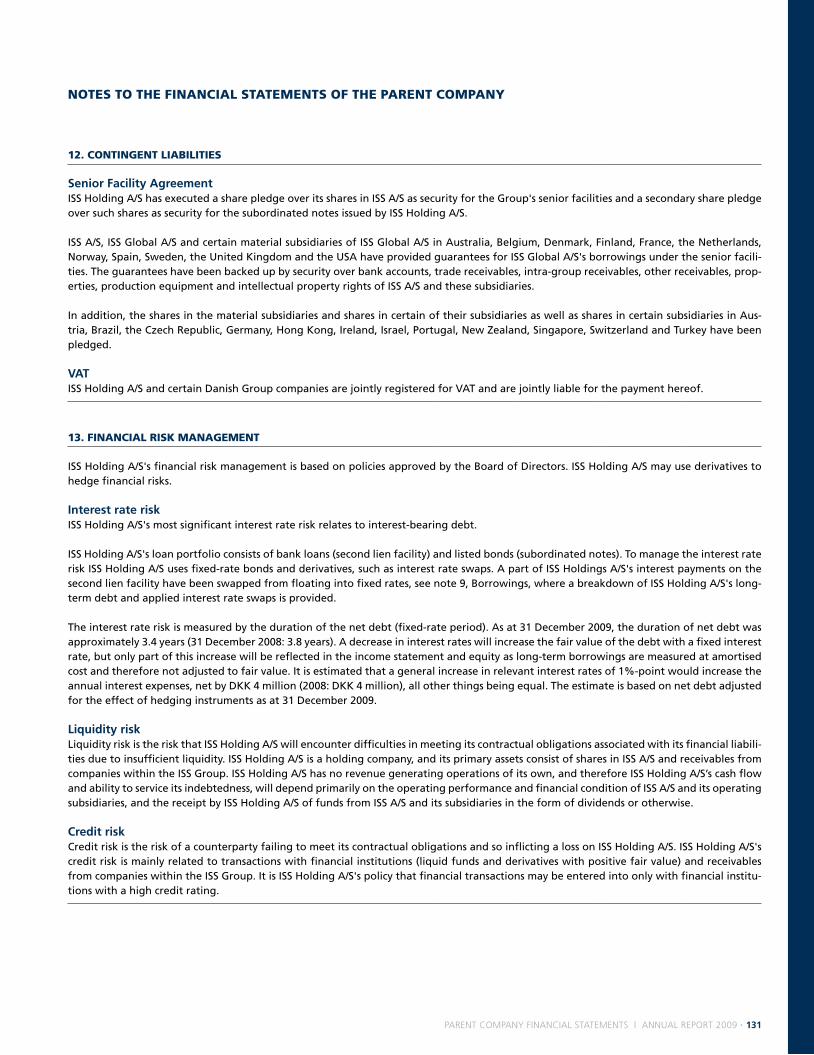
parent coMpany financial stateMents | annual report 2009 · 131
notes to the finanCial statements of the Parent ComPany
12. Contingent liabilities
senior facility agreementISS Holding A/S has executed a share pledge over its shares in ISS A/S as security for the group's senior facilities and a secondary share pledge over such shares as security for the subordinated notes issued by ISS Holding A/S.
ISS A/S, ISS global A/S and certain material subsidiaries of ISS global A/S in Australia, Belgium, denmark, Finland, France, the netherlands, norway, Spain, Sweden, the united Kingdom and the uSA have provided guarantees for ISS global A/S's borrowings under the senior facili-ties. the guarantees have been backed up by security over bank accounts, trade receivables, intra-group receivables, other receivables, prop-erties, production equipment and intellectual property rights of ISS A/S and these subsidiaries.
In addition, the shares in the material subsidiaries and shares in certain of their subsidiaries as well as shares in certain subsidiaries in Aus-tria, Brazil, the Czech Republic, germany, Hong Kong, Ireland, Israel, portugal, new Zealand, Singapore, Switzerland and turkey have been pledged.
vatISS Holding A/S and certain danish group companies are jointly registered for VAt and are jointly liable for the payment hereof.
13. finanCial risk management
ISS Holding A/S's financial risk management is based on policies approved by the Board of directors. ISS Holding A/S may use derivatives to hedge financial risks.
interest rate risk ISS Holding A/S's most significant interest rate risk relates to interest-bearing debt.
ISS Holding A/S's loan portfolio consists of bank loans (second lien facility) and listed bonds (subordinated notes). to manage the interest rate risk ISS Holding A/S uses fixed-rate bonds and derivatives, such as interest rate swaps. A part of ISS Holdings A/S's interest payments on the second lien facility have been swapped from floating into fixed rates, see note 9, Borrowings, where a breakdown of ISS Holding A/S's long-term debt and applied interest rate swaps is provided.
the interest rate risk is measured by the duration of the net debt (fixed-rate period). As at 31 december 2009, the duration of net debt was approximately 3.4 years (31 december 2008: 3.8 years). A decrease in interest rates will increase the fair value of the debt with a fixed interest rate, but only part of this increase will be reflected in the income statement and equity as long-term borrowings are measured at amortised cost and therefore not adjusted to fair value. It is estimated that a general increase in relevant interest rates of 1%-point would increase the annual interest expenses, net by dKK 4 million (2008: dKK 4 million), all other things being equal. the estimate is based on net debt adjusted for the effect of hedging instruments as at 31 december 2009.
liquidity risk liquidity risk is the risk that ISS Holding A/S will encounter difficulties in meeting its contractual obligations associated with its financial liabili-ties due to insufficient liquidity. ISS Holding A/S is a holding company, and its primary assets consist of shares in ISS A/S and receivables from companies within the ISS group. ISS Holding A/S has no revenue generating operations of its own, and therefore ISS Holding A/S’s cash flow and ability to service its indebtedness, will depend primarily on the operating performance and financial condition of ISS A/S and its operating subsidiaries, and the receipt by ISS Holding A/S of funds from ISS A/S and its subsidiaries in the form of dividends or otherwise.
credit riskCredit risk is the risk of a counterparty failing to meet its contractual obligations and so inflicting a loss on ISS Holding A/S. ISS Holding A/S's credit risk is mainly related to transactions with financial institutions (liquid funds and derivatives with positive fair value) and receivables from companies within the ISS group. It is ISS Holding A/S's policy that financial transactions may be entered into only with financial institu-tions with a high credit rating.
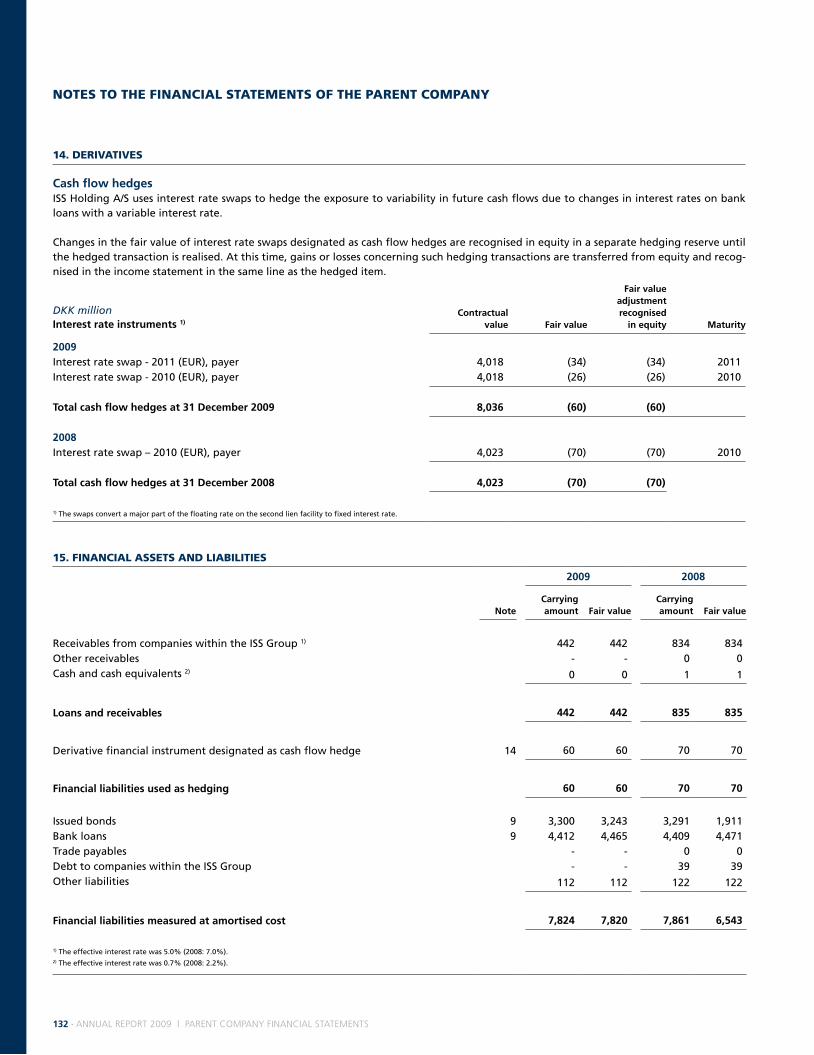
132 · annual report 2009 | parent coMpany financial stateMents
notes to the finanCial statements of the Parent ComPany
14. derivatives
cash flow hedgesISS Holding A/S uses interest rate swaps to hedge the exposure to variability in future cash flows due to changes in interest rates on bank loans with a variable interest rate.
Changes in the fair value of interest rate swaps designated as cash flow hedges are recognised in equity in a separate hedging reserve until the hedged transaction is realised. At this time, gains or losses concerning such hedging transactions are transferred from equity and recog-nised in the income statement in the same line as the hedged item.
DKK millioninterest rate instruments 1)
contractual value fair value
fair value adjustment recognised
in equity maturity
2009Interest rate swap - 2011 (euR), payer 4,018 (34) (34) 2011Interest rate swap - 2010 (euR), payer 4,018 (26) (26) 2010
total cash flow hedges at 31 december 2009 8,036 (60) (60)
2008Interest rate swap – 2010 (euR), payer 4,023 (70) (70) 2010
total cash flow hedges at 31 december 2008 4,023 (70) (70)
1) the swaps convert a major part of the floating rate on the second lien facility to fixed interest rate.
15. finanCial assets and liabilities
2009 2008
note
carrying amount fair value
carrying amount fair value
Receivables from companies within the ISS group 1) 442 442 834 834 other receivables - - 0 0 Cash and cash equivalents 2) 0 0 1 1
loans and receivables 442 442 835 835
derivative financial instrument designated as cash flow hedge 14 60 60 70 70
financial liabilities used as hedging 60 60 70 70
Issued bonds 9 3,300 3,243 3,291 1,911Bank loans 9 4,412 4,465 4,409 4,471trade payables - - 0 0 debt to companies within the ISS group - - 39 39 other liabilities 112 112 122 122
financial liabilities measured at amortised cost 7,824 7,820 7,861 6,543
1) the effective interest rate was 5.0% (2008: 7.0%).2) the effective interest rate was 0.7% (2008: 2.2%).

parent coMpany financial stateMents | annual report 2009 · 133
notes to the finanCial statements of the Parent ComPany
16. related Parties
In addition to the description in note 36 to the consolidated financial statements of related parties and transactions with these, related parties of ISS Holding A/S comprise ISS A/S and it's subsidiaries, associates, joint ventures and Spes, see note 39 to the consolidated financial statements.
In 2009, ISS Holding A/S had the following transactions with other related parties, which were all made on market terms:
> ISS Holding A/S received/paid interest from/to ISS global A/S and other companies within the ISS group, see note 4, net finance costs.> ISS Holding A/S received/paid joint taxation contribution equal to 25% of taxable income from/to ISS equity A/S (the ultimate parent com-
pany in denmark), see note 11, tax receivables and tax payables.
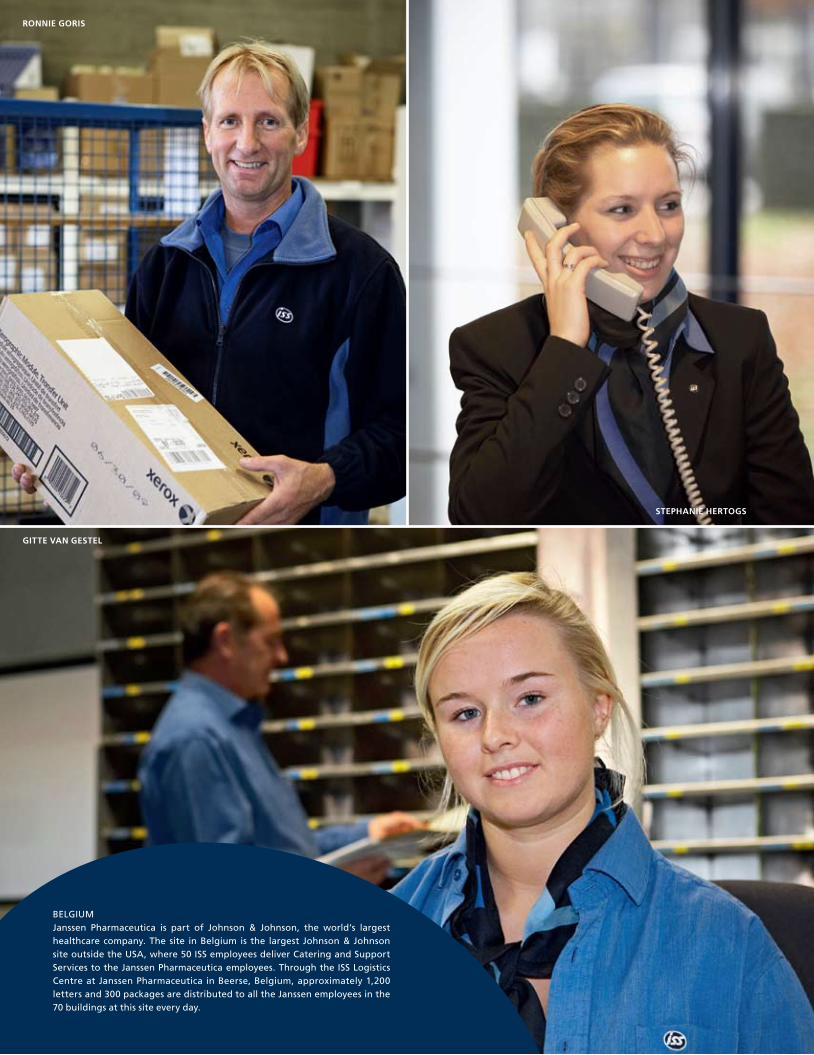
gittE van gEstEl
ronniE goris
stEphaniE hErtogs
BelgIuMJanssen pharmaceutica is part of Johnson & Johnson, the world’s largest healthcare company. the site in Belgium is the largest Johnson & Johnson site outside the uSA, where 50 ISS employees deliver Catering and Support Services to the Janssen pharmaceutica employees. through the ISS logistics Centre at Janssen pharmaceutica in Beerse, Belgium, approximately 1,200 letters and 300 packages are distributed to all the Janssen employees in the 70 buildings at this site every day.

definitions | annual report 2009 · 135
deFInItIonS
Adjusted eBItdA = operating profit before other items + depreciation and amortisation
Carrying amount of net debt = long-term debt + Short-term debt - Receivables from affiliates - Securities -
Cash and cash equivalents
Cash conversion, % = (operating profit before other items + Changes in working capital) x 100
operating profit before other items
eBItdA = operating profit + depreciation and amortisation
equity ratio, % = total equity x 100
total assets
Interest-bearing debt, net = Carrying amount of net debt - non-interest-bearing debt, net
Interest coverage = operating profit before other items + depreciation and amortisation
net finance costs
Sum of non-interest-bearing items included in carrying amount of net debt, e.g. non-interest-bearing debt, net = marked-to-market value of interest rate swaps, unamortised gains from settlement
of interest rate swaps and unamortised loan costs.
operating margin, % = operating profit before other items x 100
total revenue
organic growth 1), % = (Comparable revenue current year – comparable revenue prior year) x 100
Comparable revenue prior year
1) Comparable revenue implies the exclusion of changes in revenue attributable to businesses acquired or divested and the effect of changes in foreign exchange rates. growth generated by acquired busi-
nesses with reported annual revenue of dKK 50 million or more, as well as acquisition of businesses that establish an ISS presence in a new jurisdiction are excluded from the calculation of organic growth
during the first 12 months of ISS ownership. Acquisition of businesses with reported annual revenue of less than dKK 50 million are treated as having been integrated into ISS upon acquisition, and ISS’s
calculation of organic growth includes changes in revenue of these acquired businesses compared with revenue expectations at the date of acquisition. organic growth is not a measure of financial per-
formance under danish gAAp or IFRS and the organic growth figures have not been, and cannot be, audited.

136 · annual report 2009
fabiana dE paula andradE
arnEl lasat
dEnis doylE
IRelAnduniversity College dublin (uCd) was established in 1854. For over 150 years, uCd has produced graduates of remarkable distinction. perhaps the best known of all its graduates is the writer James Joyce, who completed his Bach-elor of Arts at the university in 1902. ISS delivers Cleaning and property Serv-ices, thereby keeping the buildings and the grounds nice and clean for the thousands of students, teachers, staff and guests who use the campus every day.

capital structure | annual report 2009 · 137
CApItAl StRuCtuRe
sharE capital
ISS is indirectly owned by funds advised by eQt partners and goldman Sachs Capital partners that hold 54% and 44% of the share capital, respectively. In addition, certain members of the Board of directors, the executive group Management and a number of senior officers of ISS hold approximately 2% of the share capital through director and management participation programmes.
At 31 december 2009, the carrying value of Shareholders’ equity (including Minority Interests) was dKK 2,213 million.
borroWings
Standard & poor’s have assigned a BB- long-term credit rat-ing to ISS Holding and its wholly owned subsidiaries, ISS glo-bal A/S (ISS global) and ISS A/S, and Moody’s have assigned ISS Holding and ISS A/S a B2 corporate rating.
Moody’s have assigned the subordinated notes issued by ISS Holding a Caa1 rating, and Standard & poor’s have assigned the bonds issued by ISS Holding and ISS global’s eMtn pro-gramme a B rating.
bondsISS Holding has issued euR 454 million of 8.875% subordi-nated notes maturing on 15 May 2016.
ISS global has issued senior unsecured eMtns in two tranch-es, of which euR 350 million mature on 18 September 2010 and euR 110 million mature on 8 december 2014.
ISS Financing plc, a special purpose vehicle, has issued euR 525 million of 11% senior notes maturing on 15 June 2014.
loans
senior credit facilitiesAt 31 december 2009, ISS global had senior credit facilities of dKK 20.1 billion under which dKK 18.2 billion were drawn and dKK 1.5 billion was allocated to support performance bonds issued by operating subsidiaries.
the senior credit facilities include customary loan covenant clauses, which were all complied with in 2009.
the senior lenders comprise a syndicate of international banks and institutional investors. the senior credit facilities mature in 2012 and 2013.
Standard & poor’s BB-Moody’s B2
iss holding a/s bondsIssuer ISS Holding A/SBloomberg ISS dCStandard & poor’s rating BMoody’s Caa1listing luxembourgAmount outstanding euR 454 millionMaturity date 15 May 2016Coupon 8.875%ISIn securities code xS0253470644Reuters dK025347064=
global a/s emtn bondsIssuer ISS global A/SBloomberg ISS dCStandard & poor’s rating Blisting luxembourg
emtns due 2010Amount outstanding euR 350 millionMaturity date 18 September 2010Coupon 4.75%ISIn securities code xS0176317054Reuters dK017631705=
emtns due 2014Amount outstanding euR 110 millionMaturity date 8 december 2014Coupon 4.50%ISIn securities code xS0206714247Reuters dK020671424=
iss finanCing PlC senior notesIssuer ISS Financing plcBloomberg ISS dCStandard & poor’s rating Blisting luxembourgAmount outstanding euR 525 millionMaturity date 15 June 2014Coupon 11.0%ISIn securities code xS0441258117Reuters dK0441258117=
CorPorate Credit ratings
138 · annual report 2009 | capital structure
ComPosition of senior Credit faCilities
term loans:ISS has loans of dKK 14,072 million under two term loan facilities, of which dKK 1,050 million were borrowed under term Facility A and dKK 13,022 million were borrowed under term Facility B. term Facility A, which matures on 30 June 2012, is amortising with approximately dKK 382 million in 2010; dKK 382 million in 2011; and dKK 286 million in 2012. term Facility B, which matures on 31 december 2013, will be repaid in two equal instalments on 30 June 2013 and 31 december 2013.
aCQuisition faCilities:As a result of a strategic decision to slow down the pace of acquisitions and further increase the focus on organic growth, ISS cancelled dKK 1,000 million of un-drawn Acquisition Facility B reducing the available credit line to dKK 2,500 million with effect from 14 April 2009. on 11 May 2009, the expiration date of the availability period for Acquisition Facility B, ISS had drawn a total of dKK 2,125 million of the facility and an un-drawn amount of dKK 375 million were automatically cancelled.
In accordance with the provisions of the Senior Facilities Agreement to repay 50% of the excess cash flow relating to the previous financial year, ISS repaid dKK 366 million under Acquisition Facility A on 26 May 2009. Following the repayment, ISS's borrowings under Acquisition Facility A were reduced to dKK 1,057 million.
At 31 december 2009, ISS has loans of dKK 3,110 million under two acquisition facilities, of which dKK 985 million were drawn under Ac-quisition Facility A and dKK 2,125 million were drawn under Acquisition Facility B.
Acquisition Facility A which was fully drawn at 31 december 2009 matures on 30 June 2012 and is amortising with dKK 453 million in 2010; dKK 249 million in 2011; and dKK 283 million in 2012. the drawn amount under Acquisition Facility B matures on 31 december 2013 and it will be repaid in two equal instalments on 30 June 2013 and 31 december 2013.
revolving Credit faCility:ISS has a revolving credit facility (RCF) in an amount equivalent to dKK 2,448 million, of which amounts equivalent to dKK 1,059 million were drawn as of 31 december 2009. Borrowings under the RCF are primarily provided by local lenders to certain subsidiaries and are included in ”other short-term debt’’ and ‘‘other long-term debt’’ in ISS’s consolidated financial statements. In addition, dKK 973 million of the revolving credit facility was allocated to support performance bonds issued by operating subsidiaries.
the RCF matures on 30 June 2012.
letter of Credit faCilityISS has a letter of credit facility in an amount of dKK 500 million. letters of credit are primarily issued in support of borrowings, other than borrowings under the revolving credit facility or the Secured local Facilities, and, to the extent these borrowings are deemed to constitute indebtedness, the borrowings are included in ‘‘other short-term debt’’ and ‘‘other long-term debt’’ in ISS’s consolidated financial state-ments.
the letter of credit facility matures on 30 June 2012.
the Senior Facilities have been drawn in certain currencies in addition to danish Kroner as specified under the Senior Facilities Agree-ment.
securitisationISS has initiated a securitisation programme in Spain, norway, denmark, Sweden and the united Kingdom, which at 31 december 2009 had generated euR 126 million in funding. the programme has a total credit facility of euR 500 million and is expected to be further utilised throughout 2010. the facility expires 14 September 2012. the proceeds will be used for repaying part of the eMtn's maturing in September 2010. second lien facilityon 31 december 2009, ISS had dKK 4.5 billion, euR 600 million of second lien facility, as part of the refinancing of ISS Hold-ing’s floating-rate subordinated notes. the second lien facility includes customary loan covenant clauses, which were all complied with in 2009.
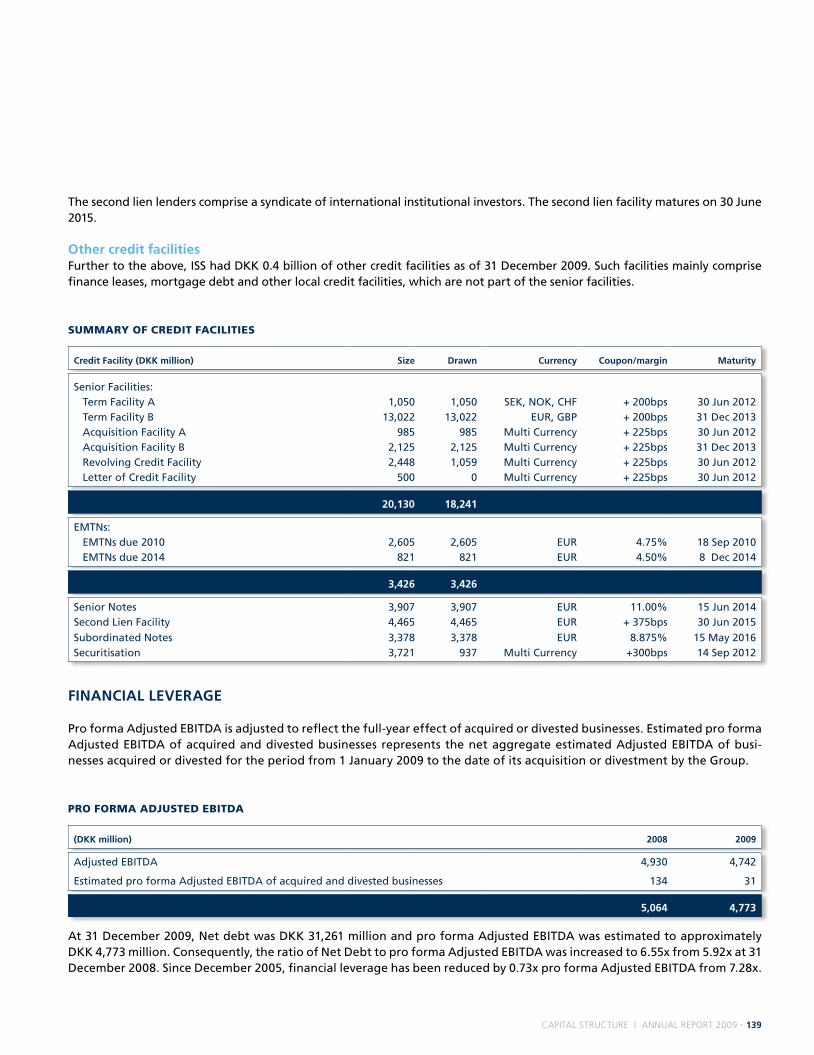
capital structure | annual report 2009 · 139
the second lien lenders comprise a syndicate of international institutional investors. the second lien facility matures on 30 June 2015.
other credit facilitiesFurther to the above, ISS had dKK 0.4 billion of other credit facilities as of 31 december 2009. Such facilities mainly comprise finance leases, mortgage debt and other local credit facilities, which are not part of the senior facilities.
summary of Credit faCilities
credit facility (dkk million) size drawn currency coupon/margin maturity
Senior Facilities: term Facility A 1,050 1,050 SeK, noK, CHF + 200bps 30 Jun 2012 term Facility B 13,022 13,022 euR, gBp + 200bps 31 dec 2013 Acquisition Facility A 985 985 Multi Currency + 225bps 30 Jun 2012 Acquisition Facility B 2,125 2,125 Multi Currency + 225bps 31 dec 2013 Revolving Credit Facility 2,448 1,059 Multi Currency + 225bps 30 Jun 2012 letter of Credit Facility 500 0 Multi Currency + 225bps 30 Jun 2012
20,130 18,241
eMtns: eMtns due 2010 2,605 2,605 euR 4.75% 18 Sep 2010 eMtns due 2014 821 821 euR 4.50% 8 dec 2014
3,426 3,426
Senior notes 3,907 3,907 euR 11.00% 15 Jun 2014Second lien Facility 4,465 4,465 euR + 375bps 30 Jun 2015
Subordinated notes 3,378 3,378 euR 8.875% 15 May 2016Securitisation 3,721 937 Multi Currency +300bps 14 Sep 2012
financial lEvEragE
pro forma Adjusted eBItdA is adjusted to reflect the full-year effect of acquired or divested businesses. estimated pro forma Adjusted eBItdA of acquired and divested businesses represents the net aggregate estimated Adjusted eBItdA of busi-nesses acquired or divested for the period from 1 January 2009 to the date of its acquisition or divestment by the group.
Pro forma adJusted ebitda
(dkk million) 2008 2009
Adjusted eBItdA 4,930 4,742
estimated pro forma Adjusted eBItdA of acquired and divested businesses 134 31
5,064 4,773
At 31 december 2009, net debt was dKK 31,261 million and pro forma Adjusted eBItdA was estimated to approximately dKK 4,773 million. Consequently, the ratio of net debt to pro forma Adjusted eBItdA was increased to 6.55x from 5.92x at 31 december 2008. Since december 2005, financial leverage has been reduced by 0.73x pro forma Adjusted eBItdA from 7.28x.

140 · annual report 2009 | capital structure
net debt as of 31 deCember 2009
principal valueleverage
(x pro forma Ebitda)
Senior Facilities 18,241 3.82xeuro Medium term notes 3,426 0.72xSenior notes 3,907 0.82xSecond lien Facility 4,465 0.94x8.875% Subordinated notes due 2016 3,378 0.71xother short-term and long-term debt 368 0.08xSecuritisation 937 0.20x
34,722
total cash and cash equivalents and securities (3,461) -0.73x
31,261 6.55x
note: For further information on the group’s borrowings, see note 28 to the consolidated financial statements.

annual report 2009 · 141
angElina thomas
tibEriu codrEa
maria canario
tom hoWlEy
daria Wit
unIted KIngdoMImperial College Healthcare nHS trust was created on 1 october 2007 by merging the three hospitals: St Mary’s, Hammersmith and Charing Cross and integrating with the faculty of medicine at Imperial College london. ISS Facil-ity Services’ Healthcare division (ISS Mediclean) provides the full range of soft integrated facility services e.g. Catering, Cleaning, and Hospital orderly Services to all three hospitals, while ISS technical and project solutions (ISS Adviance) provides property Services to the College.

142 · annual report 2009 | country addresses
argentinaCountry Manager: Fernando lix Klett ISS Argentina S.A.Bazurco 2355C1419FKCBuenos Airestel.: +54 11 4830 4100Fax: +54 11 4830 4111www.ar.issworld.com
australia Country Manager: Charles BlinkworthISS Facility Services Australia ltd.unit 1, 12 Mars Road lane Cove nSW 2066tel.: +61 2 8644 9700Fax: +61 2 8987 5830www.au.issworld.com
austria Country Manager: thomas HinnerskovISS Facility Services gmbHBrünner Strasse 85A-1210 Viennatel.: +43 (0) 5 7400Fax: +43 (0) 5 7400-991000www.at.issworld.com
belgiumCountry Manager: Kris ClootsISS n.V.Steenstraat 20/1B-1800 Vilvoorde / Koningslotel.: +32 2 263 66 11Fax: +32 2 263 66 12www.be.issworld.com
brazil Country Manager:Jorge luis lima ISS Servisystem do Brasil ltdaestrada do Kaiko, 806844-900 embuSão paulo Braziltel.: +55 11 21 35 37 00Fax: +55 11 47 04 62 52www.br.issworld.com
brunei Country Manager: Houtman SimanjuntakISS Facility Services Sdn. Bhd.1A, Bangunan Menglait 1, Mile 2Jalan gadongBandar Seri Begawan Be3919Brunei darussalamtel.: +673-2420973Fax: +673-2446498www.bn.issworld.com
chile Country Manager: Miguel galmes ISS Facility Services S.A.Avenida las torres 1385el Rosal - HuechurabaSantiago de Chiletel.: +56 27 26 65 00Fax: +56 27 26 65 07 www.cl.issworld.com
china Country Manager: Jack Zhou ISS Hongrun Facility Services (Shanghai) limited13/F, yinlu Mansion1112 pingliang RoadShanghaitel.: +8621 6519 5234Fax: +8621 6519 6412www.cn.issworld.com
croatia Country manager: Igor Rajkovic ISS uslužne djelatnosti d.o.o.Radnicka cesta 80CR-10000 Zagrebtel.: +385 1 61 55 868Fax: +385 1 61 55 869www.hr.issworld.com
czech republicCountry Manager: Jan BohácekISS Facility Services s.r.o.eastbuilding, Antala Staska 510/38140 00 prague 4 - Krctel.: +420 2 6139 2311Fax: +420 2 6139 2320www.cz.issworld.com
denmark Country Manager: Maarten van engelandISS Facility Services A/SMøntmestervej 31dK-2400 Copenhagen nVtel.: +45 38 17 17 17Fax: +45 38 33 12 11www.dk.issworld.com
Estonia Country Manager: priit paiste ISS Haldus oüVilde tee 12912613 tallinnestoniatel.: +372 613 9107Fax: +372 613 9132www.iss.ee
finland Country Manager: Kari Virta ISS pavelut oyp.o. Box 100 Rajatorpantie 8 A - VantaaFI - 01055 ISStel.: +358 205 155Fax: +358 205 150 155www.fi.issworld.com
france Country Manager: yann ColeouISS Holding paris SAS65 rue ordenerF-75018 paristel.: +33 1 44 92 48 48Fax: +33 1 44 92 48 00www.fr.issworld.com
germany Country Manager: Christoph Heymann ISS Facility Services gmbHWanheimer Straße 9240468 düsseldorftel.: +49 211 30278-0Fax: +49 211 30278-222 www.de.issworld.com
greece Country Manager: Stefanos ValtarasISS Facility Services S.A.479 Mesogeion AvenuegR – 153 43 Agia paraskevi, Athenstel.: +30 210 27 05 600Fax: +30 210 27 25 623www.gr.issworld.com
greenland Country Manager: Jesper Hansen ISS grønland A/Spostboks 519dK-3900 nuuktel.: +299 34 20 50Fax: +299 34 20 77www.gl.issworld.com
hong kong Country Manager: Keith Futcher ISS Facility Services limited18/F Warwick House Westtaikoo place, 979 King’s RoadQuarry Bay, Hong Kongtel.: +852 2826 9166Fax: +852 2869 1441www.hk.issworld.com
hungary Country Manager: györgy györfi ISS Facility Services Kft.peterdy u. 15H-1071 Budapesttel.: +36 (1) 413-3140Fax: +36 1 413-3141www.hu.issworld.com
iceland Country Manager: gudmundur gudmundssonISS Island HFArmulí 40IS-108 Reykjaviktel.: +354 5800 600Fax: +354 5800 666www.is.issworld.com
india Country Manager: K.J. Jolly ISS Integrated Facility Services pvt. ltd.3 B, 3rd Floor, goldline Business Centre,new link Road, Malad(W),Mumbai – 400 064tel.: +91 22 2879 7505/06Fax: +91 22 2878 7002www.in.issworld.com
indonesia Country Manager: Houtman Simanjuntak p.t. ISS Indonesiagraha Simatupang Menara II, 9th FloorJl. letjen. t.B. Simatupang Kav. 38Jakarta 12540tel.: +62 21 7829455Fax: +62 21 7829438www.id.issworld.com
ireland Country Manager: paul lynch ISS Ireland ltd.11/13 Malpas St.dublin 8tel.: +353 01 707 8000Fax: +353 01 707 8001www.ie.issworld.com
israel Country Manager: Shimon ShovalISS Israel30 Hacharoshet st.,p.o.B. 703,or-yehuda 60256,Israel tel.: +972-3-538-2236Fax: +972-3-538-2240www.il.issworld.com
CountRy AddReSSeS

country addresses | annual report 2009 · 143
italy Country Manager: Antonio Ive ISS Facility Services S.r.l.Via e Bugatti 1220142 MIlAnotel.: +39 02 82681299Fax: +39 02 82681210 www.it.issworld.com
luxembourg Country Manager: Kris Cloots ISS Facility Services S.A.Rue Christophe plantin 5l - 2339 gasperichluxembourgtel.: +352 42 46 20 1Fax: +352 42 46 20 20www.lu.issworld.com
malaysia Country Manager: Simon lim ISS Facility Services Sdn Bhdno. 18, Jalan 19/146300 petaling JayaSelangorMalaysiatel.: +603 7968 8288/7968 8388Fax: +603 7968 2388www.my.issworld.com
mexico Country manager: Claus e. Madsen grupo ISS MéxicoAquiles Serdán 157Col. Ángel Zimbrón02090 México dFtel.: +52 (55) 9114 1300Fax: +52 (55) 9114 1333www.mx.issworld.com
netherlands Country Manager: peter van der Vorm ISS nederland B.V.Van deventerlaan 30-40nl-3528 Ae utrechttel.: +31 30 242 43 44Fax: +31 30 241 39 47www.nl.issworld.com
new zealand Country Manager: Brian young ISS Facility Services2 Arthur Brown placeMt WellingtonAucklandtel.: +64 95 73 45 00Fax: +64 95 73 56 45www.nz.issworld.com
norway Country Manager: Bjørn nilsen ISS Facility Services ASSjølyst plass 2postboks 132 Økernn-0509 oslotel.: +47 815 55 155Fax: +47 228 85 400www.no.issworld.com
philippines Country Manager: luis M. CeldranISS Facility Services phils., Inc.CRB Road cor. Bagsakan RoadFtI Compound, taguig Cityphilippines tel.: +632 838 6144 to 48Fax: +632 837 1113www.ph.issworld.com
poland Country Manager: Krzysztof poznanski ISS Facility Services Sp. z o.o.ul. M Flisa 2pl-02-247 Warsawtel.: +48 22 879 9391Fax: +48 22 612 5345www.pl.issworld.com
portugal Country Manager: José Martins ISS Facility Services ldaRua Moinho da Barrunchada, 4 - 1º dtº2790-109 Carnaxidetel.: +351 21 424 67 60Fax: +351 21 424 67 99www.pt.issworld.com
romania Country Manager: dan Jacota 3d Romania S.A.13 Ferdinand I Blvd021381 Sector 2, Bucharesttel.: +40 21 2524785Fax: +40 21 2524777www.ro.issworld.com
russia Country Manager: elena lipskaya Facility Services Rus llCBld.99 Malaya Semenovskaya str.107023, Moscowtel.: +7 (495) 933 44 73Fax: +7 (495) 642 96 44 www.ru.issworld.com
singapore Country Manager: C.C. Woon ISS Facility Services private limitedno.1 Jalan Kilangtimor#10-00 pacific tech CentreS-159303tel.: +65 6 227 9711Fax: +65 6 225 8340www.sg.issworld.com
slovakia Country Manager: Honor Ilavsky ISS Facility Services spol. s r.o. Mokráň Záhon 2821 04 Bratislavatel.: +421 2 32 630 111Fax: +421 2 32 630 199www.sk.issworld.com
slovenia Country Manager: Rudi Zupan ISS Facility Servicestržaška cesta 952000 Maribortel.: +386 2 450 33 00Fax: +386 2 450 33 38www.si.issworld.com
spain Country Manager: Joaquim Borrás Ferré ISS Facility Services S.A.C/ Francesc Viñas, 7 08174 Sant Cugat del Vallès Barcelona tel: +34 93 590 3060 Fax: +34 93 590 0627www.iss.es
sweden Country Manager: Marcus Kristiansson ISS Facility Services AB Årstaängsvägen 11Box 47635S-117 94 Stockholmtel.: +46 8 681 60 00Fax: +46 8 681 63 90 www.se.issworld.com
switzerland Country Manager: André nauer ISS Schweiz AgBuckhauserstrasse 22postfach CH-8010 Zürichtel. +41 58 787 80 00Fax +41 58 787 80 11www.ch.issworld.com
taiwan Country Manager: dr. Kenneth Kao ISS Facility Services ltd.10F - 1, no. 20, Sec. 3, Bade Roadtaipei, tawain 105tel.: +886 2 2577 4888Fax: +886 2 2577 4948www.tw.issworld.com
thailand Country Manager: theinsiri theingviboonwong ISS Facility Services Co., ltd.92/9 Moo 7, phaholyothin RoadAnusawaree, BangkhenBangkok 10220tel.: +66 2 552 5015Fax: +66 2 552 1260www.th.issworld.com
turkey Country Manager: Cavit Habib ISS tesis yönetim Hizmetleri A.S.Kore Sehitleri Cad.Mithat uluünlübey Sok. no:19Zincirlikuyu 34394Istanbul - turkeytel.: +90 212 354 74 00Fax: +90 212 274 63 50http://www.tr.issworld.com/
united kingdom Country Manager: Henrik Andersen ISS uK limitedISS Housegenesis Business parkAlbert driveWoking Surrey gu21 5RWtel +44 845 057 6500Fax +44 871 429 6500www.uk.issworld.com
uruguay general Manager: Jorge Rodriguez dr. Carlos María de pena 4368 esquina palomeque12.900 Montevideo uruguaytel.:+598 2 3046012Fax: +598 2 3046012 ant 201www.uy.issworld.com
u.s.aCountry Manager: darrel glover ISS Facility Services Inc.1019 Central parkway north, Suite 100San Antonio, texas 78232tel.: +1 210 495 6021Fax: +1 210 495 6071www.us.issworld.com

iss oPerates in more tHan 50 Countries in euroPe, asia, PaCifiC, nortH ameriCa anD Latin ameriCa
ArgentinaAustraliaAustriaBelgium
Bosnia and HerzegovinaBrazilBrunei
BulgariaCanadaChileChina 1)
CroatiaCzech RepublicDenmarkestonia
FinlandFrance germanygreece
greenlandHungaryicelandindia
indonesiairelandisraelitaly
Japanlatvialithuanialuxembourg
MalaysiaMexiconetherlandsnew Zealand
norwayphilippines polandportugal
RomaniaRussiasingaporeslovakia
sloveniasouth Africaspainsweden
switzerlandtaiwanthailandturkey
united KingdomuruguayusA
1) including Hong Kong
iss is among the world’s largest private employers, the vast majority of its more than 485,000 employ-ees are in the front-line delivery of services.
through a network of local operations, iss offers Facility services on an international scale, leverag-ing knowledge and experience between countries for the benefit of its customers. it is iss’s ambi-tion to develop partnerships with its customers, enabling them to focus attention and resources on their core business by outsourcing a broad range of support services to iss.
Facility Servicesiss’s core business is to manage and deliver Facility services, covering a range of services within Clean-ing, support services, property services, Catering, security and Facility Management.
the services are delivered as single services, Multi services or as an integrated Facility services (iFs) so- lution with on-site management through a single point of contact with the customer.
Organisationiss’s head office is located in Copenhagen, Den-mark. iss maintains a decentralised organisational structure under which its country operations are separately organised and act with a significant amount of autonomy, assisted by a strong regional management structure providing strategic direc-tion, managerial support and financial control. this structure makes the organisation more responsive to market conditions while at the same time foster-ing an entrepreneurial culture within iss.
Ownershipiss equity A/s, a company indirectly owned by funds advised by eQt partners and goldman sachs Capital partners, is the owner and single share-holder of iss Holding A/s.
ManagementDecisions regarding iss’s strategy and financing are the responsibility of the Board of Directors and executive group Management. ole Andersen is Chairman of the Board and Jørgen lindegaard is group Chief executive officer.
Historyiss has operated in the service industry for more than a hundred years. the iss group was founded as a small Danish security company in 1901 and be-gan offering cleaning services in 1934. selected key milestones of the group’s history are listed oppo-site.
Visioniss has a strong position in the global Facility ser- vices market. to maintain this position, iss contin-ues to focus on following the iss vision:
iss At A glAnCe
1901 iss was founded in Copenhagen, Denmark as a small
security company with 20 night watchmen named
Kjøbenhavn-Frederiksberg nattevagt (Copenhagen-Fred-
eriksberg night Watch)
1934 iss entered the cleaning business with the establishment
of Det Danske Rengørings selskab A/s (the Danish
Cleaning Company) as an independent subsidiary of
the security company
1946 the first geographical expansion outside Denmark:
swedish subsidiary established
1968 the company adopted the iss name
1973 overseas expansion started
1975 group revenue reached DKK 1 billion
1977 iss shares listed on the Copenhagen stock exchange
1989 the total number of employees in the group reached
100,000
1997 strategy “aim2002“ was launched. this strategy focused
on Multi services – selling a number of services to the
same customer
1999 iss acquired Abilis, the second largest european provider
of cleaning and specialised services, in a DKK 3.6 billion
acquisition, the group’s largest ever. Abilis had about
50,000 employees and annual revenues of DKK 5.2 billion
in 1998. the total number of employees in the group
reached 200,000
2000 A new five-year strategy “create2005“ was launched,
introducing the Facility services concept
2003 iss’s first major pan-european integrated Facility services
contract signed
2005 A new strategy was introduced aiming at a continuous
transformation of iss towards an integrated Facility
services company. iss A/s was acquired by funds advised
by eQt partners and goldman sachs Capital partners, and
de-listed from the Copenhagen stock exchange. the total
number of employees in the group reached 300,000
2006 group revenue passed DKK 50 billion. iss made the
second-largest acquisition in company history, when
acquiring the outstanding 51% of the shares in tempo
services ltd. in Australia
2007 group revenue passed DKK 60 billion. iss entered the us
market through the acquisition of sanitors inc. the total
number of employees in the group reached 400,000
2008 introduction of iss’s strategy plan “the iss Way”, which
focuses on further aligning the business model and
strengthening knowledge-sharing abilities. iss’s largest
ever international integrated Facility services contract
was signed
CLEANING 52%
CATERING 9%
PROPERTY SERVICES 21%
SUPPORT SERVICES 7%
SECURITY 7%
FACILITY MANAGEMENT 4%
iss is one of tHe WorLD’s Largest CommerCiaL ProViDers of faCiLity serViCes, oPerating
in oVer 50 Countries in euroPe, asia, PaCifiC, nortH ameriCa anD Latin ameriCa. iss Has a
DiVerse Customer Base tHat is estimateD to inCLuDe more tHan 200,000 PuBLiC anD PriVate
seCtor Customers.
lead Facility services globally by leading Facility services locally
ISS MILeSTOneS
reVenue By serViCe 2009

AnnuAl RepoRt 2009
Key FiguRes
Amounts in DKK million (unless otherwise stated) 2009 2008 2007 2006 2005 *
Revenue 69,004 68,829 63,922 55,772 31,741 operating profit before other items 3,874 4,061 3,835 3,234 1,932 operating margin before other items, % 5.6 5.9 6.0 5.8 6.1 eBitDA 1) 4,145 4,622 4,484 3,764 1,979 Adjusted eBitDA 1), 2) 4,742 4,930 4,680 3,979 2,383 operating profit 3) 3,277 3,753 3,639 3,019 1,528 net finance costs (2,308) (2,731) (3,017) (2,351) (1,721)profit before goodwill impairment/amortisation of brands and customer contracts 385 494 376 226 (410)net profit/(loss) for the year 4) (1,629) (631) (442) (809) (945)
Additions to property, plant and equipment, gross 954 964 938 907 576 Cash flow from operating activities 3,732 4,334 3,713 3,195 2,109 investments in intangible assets, property, plant and equipment, net (897) (718) (715) (843) (372)
total assets 54,354 53,605 55,348 52,253 46,456 goodwill 27,434 27,259 27,593 26,178 22,995 Carrying amount of net debt 1) 30,630 29,385 29,245 26,271 22,741 total equity 4) 2,213 3,533 5,518 5,980 6,774
Financial ratios 1)
interest coverage 2.1 1.8 1.6 1.7 1.4 Cash conversion, % 96 103 99 102 145 employees on full-time, % 71 69 68 66 61 number of employees at 31 December 485,800 472,800 438,100 391,400 310,800
Growthorganic growth, % 0.6 5.3 6.0 5.5 - Acquisitions, net, % 2 6 9 15 - total revenue, % 3 8 15 20 - Currency adjustments, % (3) (3) (0) 0 -
Other Financial Measures 5)
pro Forma Adjusted eBitDA 4,773 5,064 4,866 4,203 pro Forma net Debt 31,261 29,978 29,981 27,714 pro Forma net Debt / pro Forma eBitDA 6.55x 5.92x 6.16x 6.59x
note: except for the key figures that can be directly derived from the consolidated financial statements on pages 49-118 of this report, the key figures and ratios above are not measures
of financial performance under Danish gAAp or iFRs. the group includes these financial measures because it believes that they are appropriate measures of the group’s financial perform-
ance. other companies, including those in iss’s industry, may calculate similarly titled financial measures differently.
* iss Holding A/s was founded on 11 March 2005, while the activities of iss were acquired on 9 May 2005. Consequently, the 2005 figures do not represent full year figures and it is therefore
not possible to conduct a proper comparison with the 2005 figures.
the applied accounting principles are described in note 1, significant accounting policies in the consolidated financial statements.
1) see page 135 for definitions.2) Adjusted eBitDA, as calculated by the group, represents operating profit before other items plus Depreciation and amortisation. By using operating profit before other items for the
calculation of adjusted eBitDA instead of operating profit, the group excludes from the calculation of adjusted eBitDA integration costs relating to acquisitions and those items recorded
under other income and expenses, net, in which the group includes income and expenses that it believes do not form part of the group’s normal ordinary operations, such as gains and
losses arising from divestments, the winding up of operations, disposals of property, restructuring and certain acquisition related costs. some of the items that the group records under
the line item other income and expenses, net, are recurring and some are non-recurring in nature.3) excluding goodwill impairment and write-down and Amortisation of brands and customer contratcs.4) including minority interests.5) the pro Forma adjusted financial information is for informational purposes only. see page 137, Capital structure, for further information on other Financial Measures.
Key figures
Revenue DKK 69.0 billion (euR 9.3 billion)operating profit before other items DKK 3.9 billion (euR 0.5 billion)employees 485,800
ContaCt information
group Communications Kaspar Bach Habersaat, Head of group Communicationstel: +45 38 17 00 00
iss Holding A/sBredgade 30DK-1260 Copenhagen KDenmarktel: +45 38 17 00 00Fax: +45 38 17 00 [email protected]
CVR 28 50 47 99
eDiteD By: group Finance and group Communications,iss A/s
Design: iss A/s and Datagraf A/s
pRoDuCtion & pRint: Datagraf A/s, Denmark, March 2010.
Datagraf is environmentally certified after Ds/en iso 14001:2004 and eMAs and FsC certified.
Ferenc jóbA
ISS HOLDInG A/S · breDGADe 30 · DK-1260 cOPenHAGen K · DenMArKWWW.ISSWOrLD.cOM · [email protected] · TeL: +45 38 17 00 00 · FAX: +45 38 17 00 11
An
nu
Al R
epo
Rt 20
09

144 · annual report 2009 | iss group & services
HungARythe Vaci utca Center in Budapest, Hungary is a modern office building in the middle of the old downtown area. the Center has nearly 10,000 square meters of office space to offer. over ten different companies with a total of approximately 700 employees have established their businesses in the Center. ISS is responsible for Security, Reception and Cleaning in the building.
Argentina
Australia
Austria
Belgium
Brazil
Brunei
Chile
China
Croatia
Czech Republic
denmark
estonia
Finland
France
germany
greece
greenland
Hong Kong
Hungary
Iceland
India
Indonesia
Ireland
Israel
Italy
luxembourg
Malaysia
Mexico
netherlands
new Zealand
norway
philippines
poland
portugal
Romania
Russia
Singapore
Slovakia
Slovenia
Spain
Sweden
Switzerland
taiwan
thailand
turkey
united Kingdom
uruguay
uSA
cleaning services
support services
property services
catering services
security services
facility management
ISS gRoup & SeRVICeS