Embed Size (px)
Citation preview
KEY FACTS AND FIGURES
1SUSTAINABLE VALUE REPORT 2014
Sustainable corporate management p. 3
Product responsibility p. 8
Group-wide environmental protection p. 12
Supplier management p. 23
Employees p. 24
Corporate Citizenship p. 36
Read more at www.bmwgroup.com

2SUSTAINABLE VALUE REPORT 2014
KEY FACTS AND FIGURES
Explanatory notes on key facts and figures
This section contains the key sustainability indicators of the BMW Group.
The sustainability key figures include the following production sites of the BMW Group: Berlin, Dingolfing, Eisenach, Landshut, Leipzig, Munich, Regensburg (all in Germany), Steyr (Austria), Goodwood, Hams Hall, Oxford, Swindon (all in the UK), Rosslyn (South Africa), Spartanburg (USA), Araquari assembly plant (Brazil), Rayong assembly plant (Thailand), Chennai assembly plant (India) and BMW Brilliance Shenyang (China).
The indicators are arranged according to the chapter structure of the SVR 2014 – Sustainable corporate management, Product responsibility, Group-wide environmental protection, Supplier management, Employees and Corporate Citizenship. The main indicators of each chapter are summarised and complemented by further topic-specific indicators.
Within the chapters the topics are no longer organised by subheadings. The order in which the indicators are presented is largely based on the GRI. To avoid redun-dancies, performance indicators that are shown in charts are not repeated in the form of tables.
Sustainable corporate management
Product responsibility
Group-wide environmental protection
Supplier management
Employees
Corporate Citizenship

3SUSTAINABLE VALUE REPORT 2014
KEY FACTS AND FIGURES
Financial figures
in € million
10 11 12 13 14 Change in %
Capital expenditure 3,263 3,692 5,240 6,711 6,100 – 9.1
Revenues 60,477 68,821 76,848 76,059 80,401 5.7
Profit before financial result 5,111 8,018 8,275 7,978 9,118 14.3
Profit before tax 4,853 7,383 7,803 7,893 8,707 10.3
Income taxes 1,610 2,476 2,692 2,564 2,890 12.7
Net profit 3,243 4,907 5,111 5,329 5,817 9.2
In the 2014 financial year, Group revenues rose by 5.7% to €80,401 million compared to 2013*. Despite considerable investment in future technologies, increased intensity of competition and higher personnel costs, profit before tax rose significantly year on year 10.3% to €8,707 million.* The previous year’s figures were adjusted in accordance with IAS 8; see note number [9] in the Notes to the Group Financial Statements in the BMW Group Annual Report 2014.
GRI G3 Indicator EC1
BMW Group value added
in %
a) Net value added 25.3 b) Cost of materials 54.1 c) Depreciation and amortisation 9.5 d) Other expenses 11.1
Net value added results from the value of work performed less the value of work bought in during the financial year including depreciation. At €20,620 million (2013*: €19,217 million) it has remained at a constant high level. The bulk of the net value added (47.4%) is applied to employees (2013*: 46.9%). The proportion applied to providers of finance fell to 8.4% year on year, mainly due to lower refinancing costs in the financial services business on international capital markets. The government/ public sector (including deferred tax expense) accounted for 16.0%. The proportion of net value added applied to shareholders, at 9.2%, was higher than in the previous year. Other shareholders take a 0.1% share of net value added. The remaining share of net value added (18.9%) will be retained in the Group to finance future operations.* The previous year’s figures were adjusted in accordance with IAS 8; see note number [9] in the Notes to the Group Financial Statements in the BMW Group Annual Report 2014.
GRI Indicator EC6
Employees 47.4
Providers of finance 8.4Government/public sector 16.0
Shareholders 9.2Group 18.9
Minority interest 0.1
BUSINESS MANAGEMENT
Sustainable corporate management
Product responsibility
Group-wide environmental protection
Supplier management
Employees
Corporate Citizenship
a
d
b
c

4SUSTAINABLE VALUE REPORT 2014
KEY FACTS AND FIGURES
Comparison of forecasts for 2014 with actual business performance in 2014
Forecast for 2014 In-year adjustments Actual in Annual Report 2013 Business performance in 2014
BMW Group
Profit before tax significant increase € million 8,707 (+10.3%)
Employees at the end of the year solid increase 116,324 (+5.4%)
Automotive segment
Sales volume¹ significant increase Q3: solid increase Units 2,117,965 (+7.9%)
Fleet emissions² moderate decline Q3: slight decrease g CO²/km 130 (–2.3%)
Revenues significant increase Q2: solid increase € million 75,173 (+6.4%)
EBIT margin target corridor of 8 –10% % 9.6%
Return on capital employed significant decrease % 61.7 (–1.3%p)
Motorcycles segment
Sales volume slight increase Q3: solid increase Units 123,495 (+7.2%)
Return on capital employed on the previous year’s level % 21.8 (+5.4%p)
Financial Services segment
Return on equity slight decrease % 19.4 (–0.6%p)
1 including joint venture BMW Brilliance Automotive Ltd., Shenyang (2014: 275,891 automobiles).2 EU-28.
The table shows the key financial and non-financial performance indicators that are used for internal management of the company. Operating performance is managed primarily at the level of the segments. Additional key indicators in the management system at Group level are for purposes of calculation and management of long-term business development.In the Automotive segment, the number of vehicles sold, and thus revenues, increased significantly, in particular due to the introduction of new models as well as the dynamic market environment in North America and China. The EBIT margin, at 9.6%, was within the target range of 8–10%. RoCE in this segment decreased slightly to 61.7% due to extensive strategic investments (2013*: 63.0%). Thanks to increasingly efficient drivetrain systems, fleet emissions in 2014 dropped again slightly to 130 g of CO₂/km (2013: 133 g of CO₂/km).* The previous year’s figures were adjusted in accordance with IAS 8; see note number [9] in the Notes to the Group Financial Statements in the BMW Group Annual Report 2014.
Sustainable corporate management
Product responsibility
Group-wide environmental protection
Supplier management
Employees
Corporate Citizenship
5SUSTAINABLE VALUE REPORT 2014
KEY FACTS AND FIGURES
Pension provisions
in € million
6,000
5,000
4,000
3,000
2,000
1,000
10 11 12 13² 14
1,563 2,183 3,813¹ 2,303 4,604
1 The previous year’s figures were adjusted to comply with the amended IAS 19.2 The previous year’s figures were adjusted in accordance with IAS 8; see note number [9] in the Notes
to the Group Financial Statements in the BMW Group Annual Report 2014.
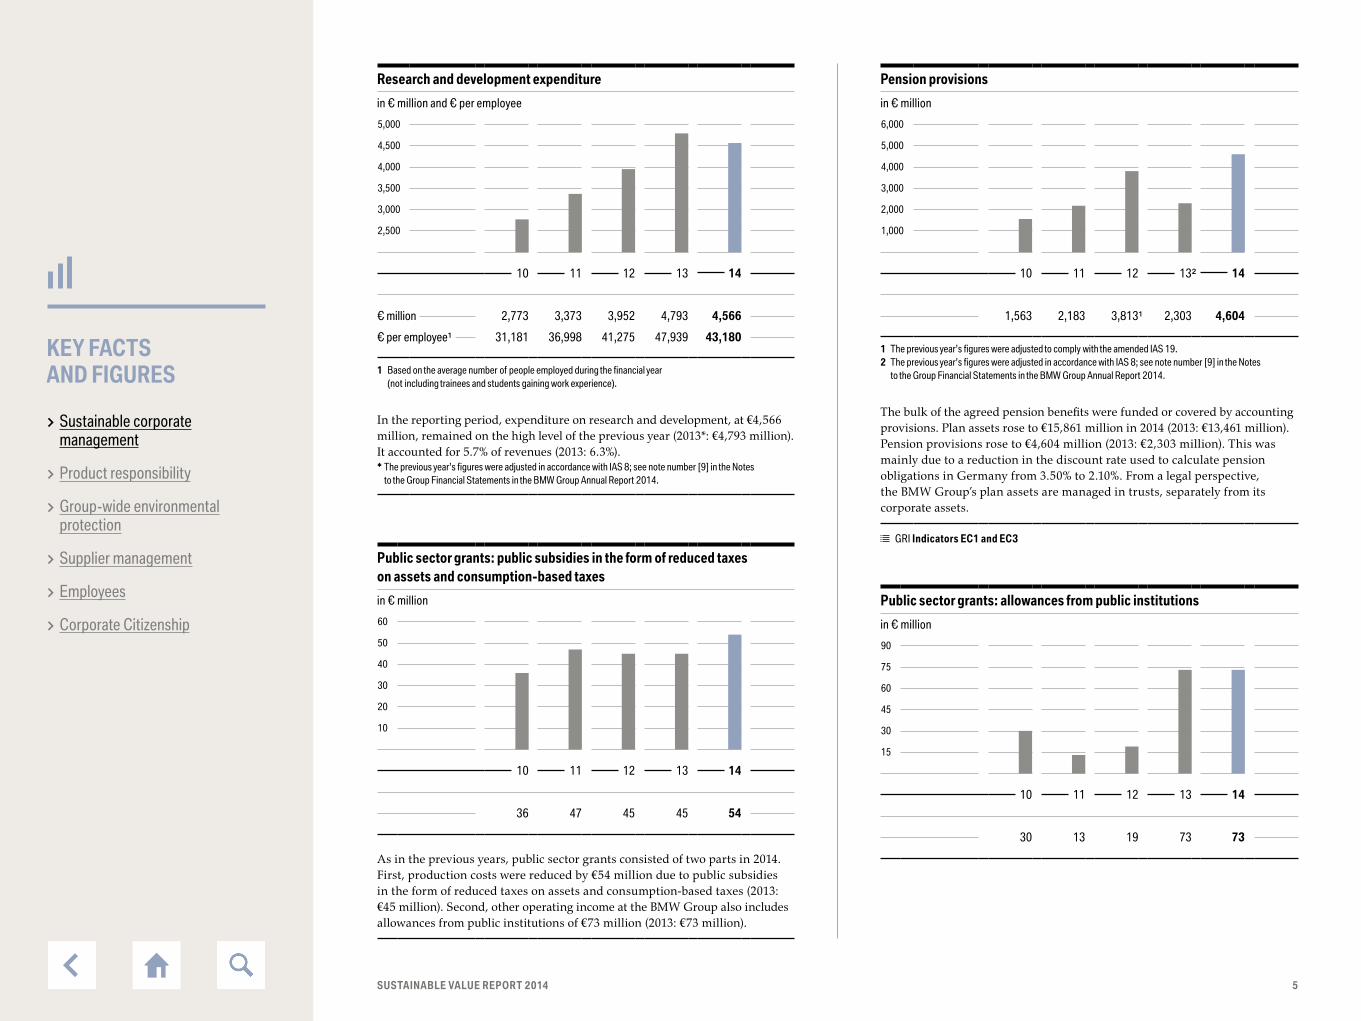
The bulk of the agreed pension benefits were funded or covered by accounting provisions. Plan assets rose to €15,861 million in 2014 (2013: €13,461 million). Pension provisions rose to €4,604 million (2013: €2,303 million). This was mainly due to a reduction in the discount rate used to calculate pension obligations in Germany from 3.50% to 2.10%. From a legal perspective, the BMW Group’s plan assets are managed in trusts, separately from its corporate assets.
GRI Indicators EC1 and EC3
Research and development expenditure
in € million and € per employee
5,000
4,500
4,000
3,500
3,000
2,500
10 11 12 13 14
€ million 2,773 3,373 3,952 4,793 4,566
€ per employee¹ 31,181 36,998 41,275 47,939 43,180
1 Based on the average number of people employed during the financial year (not including trainees and students gaining work experience).
In the reporting period, expenditure on research and development, at €4,566 million, remained on the high level of the previous year (2013*: €4,793 million). It accounted for 5.7% of revenues (2013: 6.3%).* The previous year’s figures were adjusted in accordance with IAS 8; see note number [9] in the Notes
to the Group Financial Statements in the BMW Group Annual Report 2014.
Public sector grants: public subsidies in the form of reduced taxes on assets and consumption-based taxes
in € million
60
50
40
30
20
10
10 11 12 13 14
36 47 45 45 54
As in the previous years, public sector grants consisted of two parts in 2014. First, production costs were reduced by €54 million due to public subsidies in the form of reduced taxes on assets and consumption-based taxes (2013: €45 million). Second, other operating income at the BMW Group also includes allowances from public institutions of €73 million (2013: €73 million).
Public sector grants: allowances from public institutions
in € million
90
75
60
45
30
15
10 11 12 13 14
30 13 19 73 73
Sustainable corporate management
Product responsibility
Group-wide environmental protection
Supplier management
Employees
Corporate Citizenship

6SUSTAINABLE VALUE REPORT 2014
KEY FACTS AND FIGURES
Vehicle production of the BMW Group by plant in 2014
in units
14 13 Change Production share in % in %
Dingolfing 369,027 342,629 7.7 17.0
Spartanburg 349,949 297,326 17.7 16.2
Regensburg 272,015 295,417 – 7.9 12.6
Munich 228,126 247,330 – 7.8 10.5
Leipzig 211,434 186,695 13.3 9.8
Oxford 179,318 175,986 1.9 8.3
Dadong¹ 143,390 126,888 13.0 6.6
Tiexi¹ 144,076 88,032 63.7 6.7
Rosslyn 68,771 65,646 4.8 3.2
Graz (Magna Steyr)² 113,401 125,559 – 9.7 5.2
Born (VDL Nedcar bv)² 29,196 – – 1.3
Goodwood 4,495 3,354 34.0 0.2
Assembly plants 52,368 51,504 1.7 2.4
BMW Group 2,165,566 2,006,366 7.9 100.0
1 BMW Brilliance Automotive Ltd., Shenyang, China (joint venture).2 Contract production.
The production volume of the three corporate brands BMW, MINI and Rolls-Royce amounted to 2,165,566 vehicles in the year under report (2013: 2,006,366 vehicles/+ 7.9 %). The BMW Group’s production network was further expanded: the first vehicles were assembled at the new BMW Group car production plant in Araquari (Brazil) in autumn 2014. This plant will be fully completed by September 2015. Its production portfolio will include the MINI Countryman, BMW 1 Series 5-door, BMW 3 Series Sedan, BMW X1 and X3. In addition, Dutch carmaker VDL Nedcar bv, Born began contract production of MINI vehicles in July 2014.
GRI G3 Indicator EC9
Sustainable corporate management
Product responsibility
Group-wide environmental protection
Supplier management
Employees
Corporate Citizenship

7SUSTAINABLE VALUE REPORT 2014
KEY FACTS AND FIGURES
BMW Group stakeholder survey 2013¹
01 CO² emissions and climate change
02 Alternative drivetrain technologies
03 Energy supply/renewable energy
04 Product safety
05 Efficient use of resources and/or recycling management
06 Future mobility/mobility services
07 Environmental and social standards in the supply chain
08 Anti-corruption/compliance
09 Water
10 Demographic change
11 Human rights
12 Biodiversity
13 Further education and training
14 Occupational health and safety
15 Corporate citizenship
16 Work-life balance
17 Diversity
18 Donations/sponsorship
19 Corporate volunteering
Very important Important Less important Not important No comment
1 In August and September 2012, an online stakeholder survey was carried out with a total of 88 stakeholders (mainly sustainability experts). In 2013, the results of the 2012 online stakeholder survey were reviewed and expanded based on telephone interviews with 12 selected experts from different regions and a range of focal areas (e.g. NGOs, universities, companies). No quantitative survey was carried out to update the above chart in 2014.
Sustainable corporate management
Product responsibility
Group-wide environmental protection
Supplier management
Employees
Corporate Citizenship

8SUSTAINABLE VALUE REPORT 2014
KEY FACTS AND FIGURES
Coverage rate of the production locations with quality and environmental management systems
as a % of production location workforce
100
80
60
40
20
10 11 12 13 14
100 100 100 100 100
GRI Product responsibility management approach
Development of CO² emissions of BMW Group cars in Europe
(Index: 1995 = 100; Basis: Fleet consumption of newly registered cars in Europe [EU-15] measured on the basis of the New European Driving Cycle in accordance with the ACEA self-commitment)
110
105
100
95
90
85
80
75
70
65
60
55
97 98 99 00 01 02 03 04 05 06 07 08 09¹ 10 11 12 13 14
102.4 101.0 98.6 96.7 96.7 92.9 92.9 94.8 90.0 88.6 80.0 73.3 71.4 70.0 69.0 66.0 63.0 62.0
1 Measured only on EU-27 basis from 2009 onwards and on EU-28 basis from 2014 onwards.
The BMW Group reduced CO₂ emissions of newly sold cars in Europe by around 38% between 1995 and 2014. In 2014, our European vehicle fleet achieved an average fuel consumption of 4.9 litres of diesel/100 km, 6.0 litres of petrol/100 km and average CO₂ emissions of 130 g/km (internal calculation). We also lead the field in Germany, with CO₂ emissions from our vehicle fleet of 136 g/km. This also applies to the premium segment. Efficient Dynamics gives us a competitive advantage, in particular in markets with a CO₂-based vehicle tax. Our goal is to reduce CO₂ emissions of our vehicle fleet by at least a further 25% between 2008 and 2020.
GRI Indicator A7 (Sector supplement)
PRODUCT RESPONSIBILITY
Sustainable corporate management
Product responsibility
Group-wide environmental protection
Supplier management
Employees
Corporate Citizenship

9SUSTAINABLE VALUE REPORT 2014
KEY FACTS AND FIGURES
Fuel savings of BMW Group vehicles sold in the US (according to CAFE¹)
in mpg²
35
34
33
32
31
30
29
28
27
26
25
24
23
22
21
20
19
01 02 03 04 05 06 07 08 09 10 11 12 13 14³
Fleet value of cars sold Fleet value of light trucks sold (X3/4/5/6)
1 CAFE: Corporate Average Fuel Economy.2 mpg: miles per gallon.3 BMW forecast, not yet officially confirmed.
The Corporate Average Fuel Economy (CAFE) figure represents the sales-weighted fuel consumption of a manufacturer’s fleet of vehicles weighing less than approximately 3,850 kilograms (10,000 pounds) and manufactured for sale in the USA. If a manufacturer falls below the specified lower limit, penalties must be paid to the government.Current Environmental Protection Agency (EPA) legislation is valid until 2016. The subsequent legislation will cover the period from 2017 to 2025, with a review in 2021 to verify its viability.The BMW Group’s Efficient Dynamics Strategy calls for fuel economy technologies to be made available to all customers worldwide as soon as possible.
GRI Indicator A7 (Sector supplement)
Sustainable corporate management
Product responsibility
Group-wide environmental protection
Supplier management
Employees
Corporate Citizenship
10SUSTAINABLE VALUE REPORT 2014
KEY FACTS AND FIGURES
CO² emissions of BMW Group automobiles (EU-28)
in g CO²/km
160
150
140
130
120
110
10 11 12 13 14
148 145 138 133 130
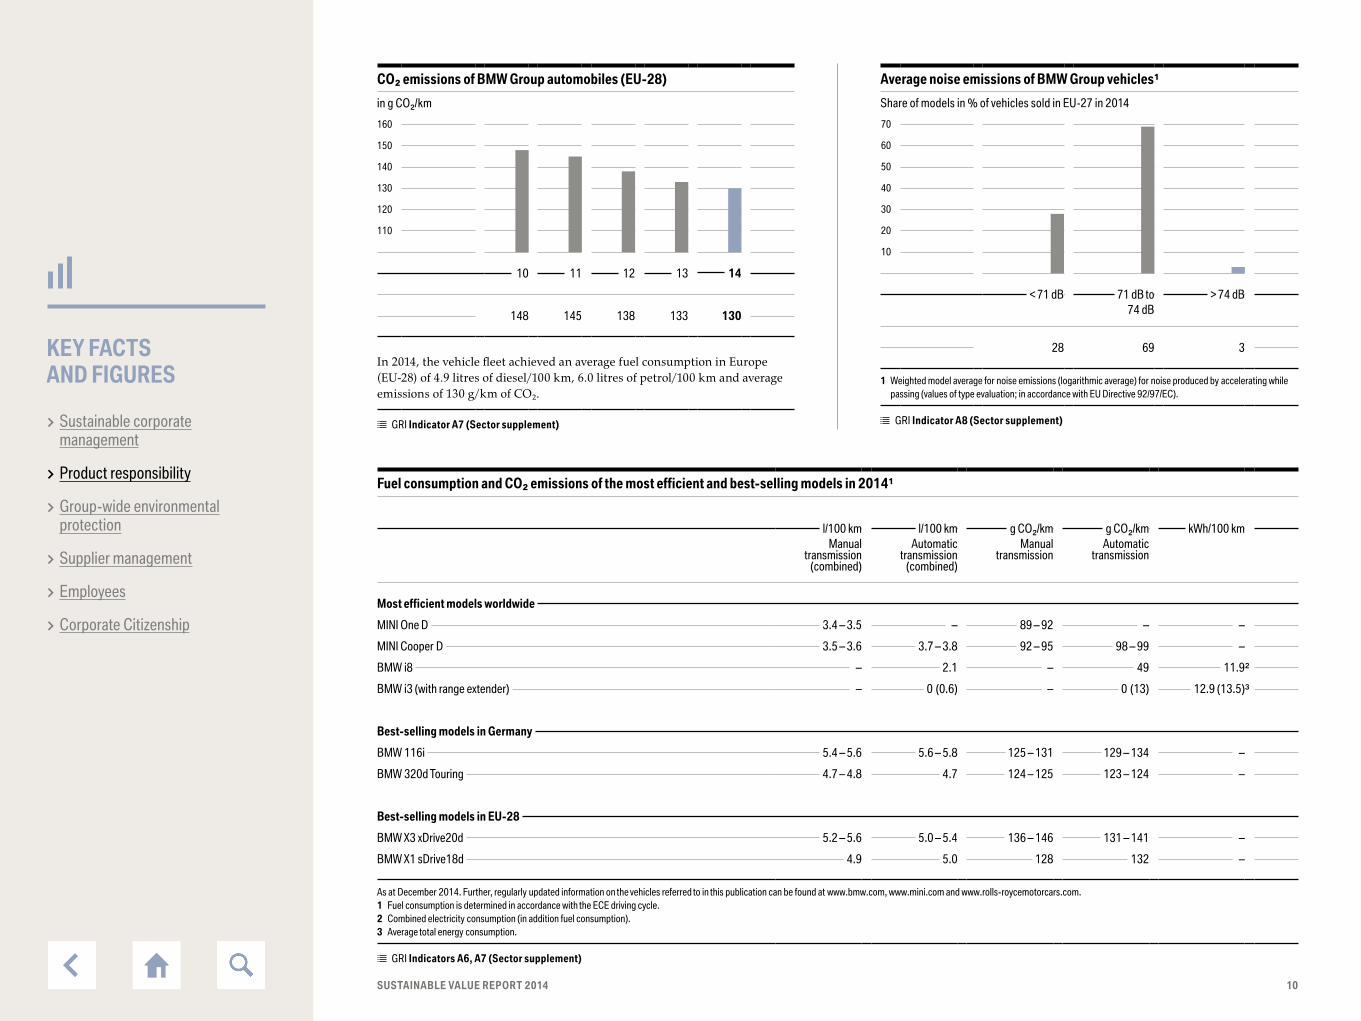
In 2014, the vehicle fleet achieved an average fuel consumption in Europe (EU-28) of 4.9 litres of diesel/100 km, 6.0 litres of petrol/100 km and average emissions of 130 g/km of CO₂.
GRI Indicator A7 (Sector supplement)
Average noise emissions of BMW Group vehicles¹
Share of models in % of vehicles sold in EU-27 in 2014
70
60
50
40
30
20
10
< 71 dB 71 dB to > 74 dB 74 dB
28 69 3
1 Weighted model average for noise emissions (logarithmic average) for noise produced by accelerating while passing (values of type evaluation; in accordance with EU Directive 92/97/EC).
GRI Indicator A8 (Sector supplement)
Fuel consumption and CO² emissions of the most efficient and best-selling models in 2014¹
l/100 km l/100 km g CO²/km g CO²/km kWh/100 km Manual
transmission (combined)
Automatictransmission
(combined)
Manualtransmission
Automatictransmission
Most efficient models worldwide
MINI One D 3.4 – 3.5 – 89 – 92 – –
MINI Cooper D 3.5 – 3.6 3.7 – 3.8 92 – 95 98 – 99 –
BMW i8 – 2.1 – 49 11.9²
BMW i3 (with range extender) – 0 (0.6) – 0 (13) 12.9 (13.5)³
Best-selling models in Germany
BMW 116i 5.4 – 5.6 5.6 – 5.8 125 – 131 129 – 134 –
BMW 320d Touring 4.7 – 4.8 4.7 124 – 125 123 – 124 –
Best-selling models in EU-28
BMW X3 xDrive20d 5.2 – 5.6 5.0 – 5.4 136 – 146 131 – 141 –
BMW X1 sDrive18d 4.9 5.0 128 132 –
As at December 2014. Further, regularly updated information on the vehicles referred to in this publication can be found at www.bmw.com, www.mini.com and www.rolls-roycemotorcars.com.1 Fuel consumption is determined in accordance with the ECE driving cycle.2 Combined electricity consumption (in addition fuel consumption).3 Average total energy consumption.
GRI Indicators A6, A7 (Sector supplement)
Sustainable corporate management
Product responsibility
Group-wide environmental protection
Supplier management
Employees
Corporate Citizenship

11SUSTAINABLE VALUE REPORT 2014
KEY FACTS AND FIGURES
Share of plastic recyclates in vehicles¹
in %
25
20
15
10
5
12 13 14
15 20 20
1 Recyclate share in thermoplastic materials. The vehicle with the highest share of recyclates is shown.
In the area of polymers in particular, importance is placed on securing com-plete material cycles. In the case of thermoplastic resins, for example, up to 20% of the materials used come from secondary sources. The share of thermo-plastic resins used in vehicle production has increased considerably in recent years (from 8% to 17%), and, with it, the absolute volume of recyclates used.
GRI Indicator EN2
Average distribution of materials in BMW Group vehicles¹
in %
a) Steel and iron 56 f) Textile 1
b) Non-ferrous metals 18 g) M.O.N.³ 1
c) Thermoplastic resins 12 h) Other 5
d) Elastomers² 4 i) Operating fluids 1
e) Duromers 2
1 Calculation of representative vehicles includes: BMW 1 Series, BMW 3 Series, BMW 5 Series, BMW 7 Series, BMW X1, BMW X5, MINI Hatchback, MINI Countryman, RR, i3, i8.
2 Such as tyres and seals.3 Modified organic natural materials.
Steel and iron still make up the largest proportion by weight of materials used in BMW Group vehicles. The percentage share of each material is not comparable with the figures for 2013 due to a refinement of the calculation method. Weighting of the representative vehicles by number of units began this year. We also increased the number of representative vehicles, e.g. by adding MINI and BMW i models. The influence of materials used in Project i is not yet measurable due to the small number of units produced so far.
GRI Indicators EN1, EN2, A10 (Sector supplement)
a
gfed
b
c
h i
Sustainable corporate management
Product responsibility
Group-wide environmental protection
Supplier management
Employees
Corporate Citizenship

12SUSTAINABLE VALUE REPORT 2014
KEY FACTS AND FIGURES
BMW Group input/output assessment for 2014 vehicle production
Input Output
Raw materials¹ Vehicles
Steel 2,398,898 t BMW Group vehicles produced in Tsd. 2,023
Plastics 531,687 t Vehicles produced (contracted) in Tsd. 142
Aluminium 551,293 t Total waste 727,079 t
Magnesium 7,161 t of which recyclable 716,740 t
Operating fluids² 69,475 t of which waste for disposal 10,339 t
Water 4,434,595 m³ Total wastewater 2,965,615 m³
Energy 4,867,094 MWh CO² emissions (Scope 1 and 2) 1,369,877 t
Volatile organic compounds (VOC) 2,607 t
NOX 581 t
CO 375 t
SO2 6 t
Particulates, dust 59 t
1 Due to the fact that internal reporting has a different scope, this figure excludes BMW Brilliance (China) but includes Magna Steyr.2 Operating fluid for products (e.g. engine and gear oil, brake and cooling fluid, cooling agent, fuel for production refuelling). As the data is captured via the central purchasing system, this figure excludes BMW Brilliance (China) and Magna Steyr.
We reduce our environmental impact and the level of resources we consume by integrating environmental management into our production processes. We see this as a continuous improvement process that aims to achieve CO₂-free energy supply for the BMW Group locations. Our goal is to reduce our consumption of resources and emissions per vehicle produced by an average of 45% by 2020 (compared to 2006). The parameters we use to measure this are energy, water, process wastewater, waste for disposal and solvent emissions. We have been able to achieve this for the first time in the current financial year. Compared to the previous year, we improved resource efficiency by an average of 6.7%.
GRI Indicators EN1, EN3, EN4, EN8, EN16, EN20, EN21, EN22
GROUP-WIDE ENVIRONMENTAL PROTECTION
Sustainable corporate management
Product responsibility
Group-wide environmental protection
Supplier management
Employees
Corporate Citizenship
13SUSTAINABLE VALUE REPORT 2014
KEY FACTS AND FIGURES
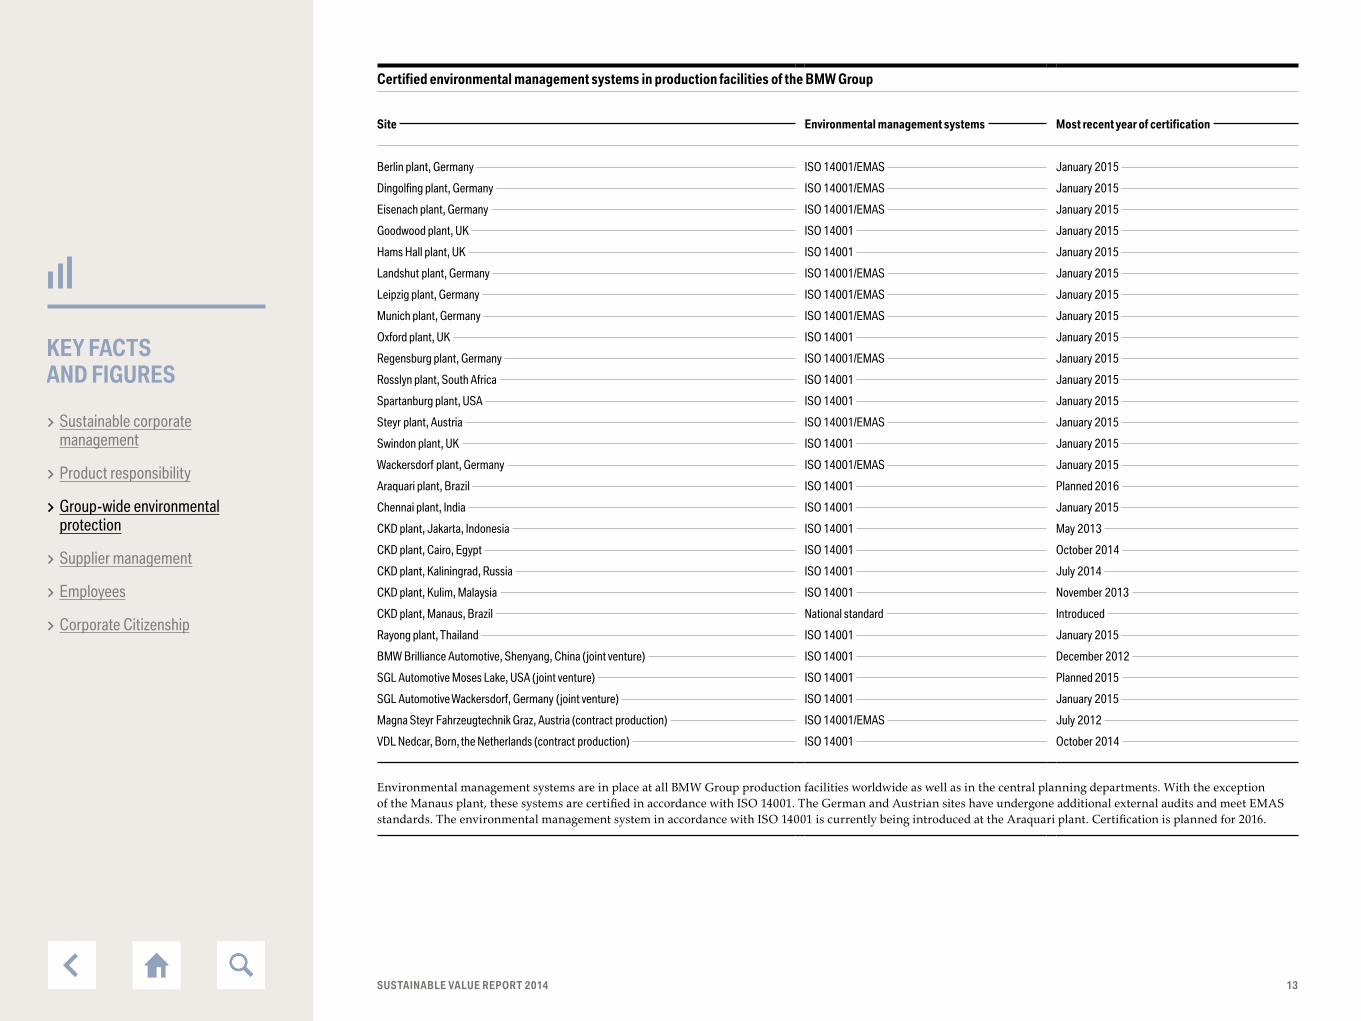
Certified environmental management systems in production facilities of the BMW Group
Site Environmental management systems Most recent year of certification
Berlin plant, Germany ISO 14001/EMAS January 2015
Dingolfing plant, Germany ISO 14001/EMAS January 2015
Eisenach plant, Germany ISO 14001/EMAS January 2015
Goodwood plant, UK ISO 14001 January 2015
Hams Hall plant, UK ISO 14001 January 2015
Landshut plant, Germany ISO 14001/EMAS January 2015
Leipzig plant, Germany ISO 14001/EMAS January 2015
Munich plant, Germany ISO 14001/EMAS January 2015
Oxford plant, UK ISO 14001 January 2015
Regensburg plant, Germany ISO 14001/EMAS January 2015
Rosslyn plant, South Africa ISO 14001 January 2015
Spartanburg plant, USA ISO 14001 January 2015
Steyr plant, Austria ISO 14001/EMAS January 2015
Swindon plant, UK ISO 14001 January 2015
Wackersdorf plant, Germany ISO 14001/EMAS January 2015
Araquari plant, Brazil ISO 14001 Planned 2016
Chennai plant, India ISO 14001 January 2015
CKD plant, Jakarta, Indonesia ISO 14001 May 2013
CKD plant, Cairo, Egypt ISO 14001 October 2014
CKD plant, Kaliningrad, Russia ISO 14001 July 2014
CKD plant, Kulim, Malaysia ISO 14001 November 2013
CKD plant, Manaus, Brazil National standard Introduced
Rayong plant, Thailand ISO 14001 January 2015
BMW Brilliance Automotive, Shenyang, China (joint venture) ISO 14001 December 2012
SGL Automotive Moses Lake, USA (joint venture) ISO 14001 Planned 2015
SGL Automotive Wackersdorf, Germany (joint venture) ISO 14001 January 2015
Magna Steyr Fahrzeugtechnik Graz, Austria (contract production) ISO 14001/EMAS July 2012
VDL Nedcar, Born, the Netherlands (contract production) ISO 14001 October 2014
Environmental management systems are in place at all BMW Group production facilities worldwide as well as in the central planning departments. With the exception of the Manaus plant, these systems are certified in accordance with ISO 14001. The German and Austrian sites have undergone additional external audits and meet EMAS standards. The environmental management system in accordance with ISO 14001 is currently being introduced at the Araquari plant. Certification is planned for 2016.
Sustainable corporate management
Product responsibility
Group-wide environmental protection
Supplier management
Employees
Corporate Citizenship

14SUSTAINABLE VALUE REPORT 2014
KEY FACTS AND FIGURES
Energy consumption in detail
in MWh
10 11 12 13 14
Total energy consumption (upper heating value in case of fossil fuels)
Total energy consumption 4,072,217 4,278,582 4,549,788 4,721,174 4,867,094
Total energy consumption in detail (upper heating value in case of fossil fuels)
Electricity (external source) 1,654,956 1,702,157 1,790,534 1,910,065 2,141,222
Community heating 319,270 200,808 249,123 316,532 281,216
from renewable energy sources in %¹ 18 28 36 48 51
Fossil fuels
Fuel oil 43,828 12,176 12,622 14,023 7,459
Natural gas 1,756,760 2,034,529 2,169,059 2,165,362 2,198,202
of which CHP losses 110,511 211,680 210,514 191,840 210,740
Non-fossil fuels
Biogas (landfill gas) 288,402 328,912 328,450 315,192 238,654
of which CHP losses 86,100 91,600 103,422 94,486 73,638
Regenerative fuels
Solar energy (photovoltaics) 3 0² 114³ 142 341
1 Conservative calculation from the country-specific shares. Method adapted for Germany and Austria by using the transparency data in supplier invoices since 2012.2 No contribution to energy supply due to maintenance work.3 Commissioning of a new system in 2012. Further systems planned.
We plan to further reduce energy consumption per vehicle by 2020 – by 45% compared to 2006. In 2014 we were able to further reduce our energy consumption per vehicle produced to 2.25 MWh (– 4.7% compared to 2013). This is an improvement of 34.2% compared to the base year 2006 and corresponds with a comparatively lower increase in overall energy consumption (3.1%) relative to production volume (7.6%).
GRI Indicators EN3, EN4, EN5
Sustainable corporate management
Product responsibility
Group-wide environmental protection
Supplier management
Employees
Corporate Citizenship
15SUSTAINABLE VALUE REPORT 2014
KEY FACTS AND FIGURES
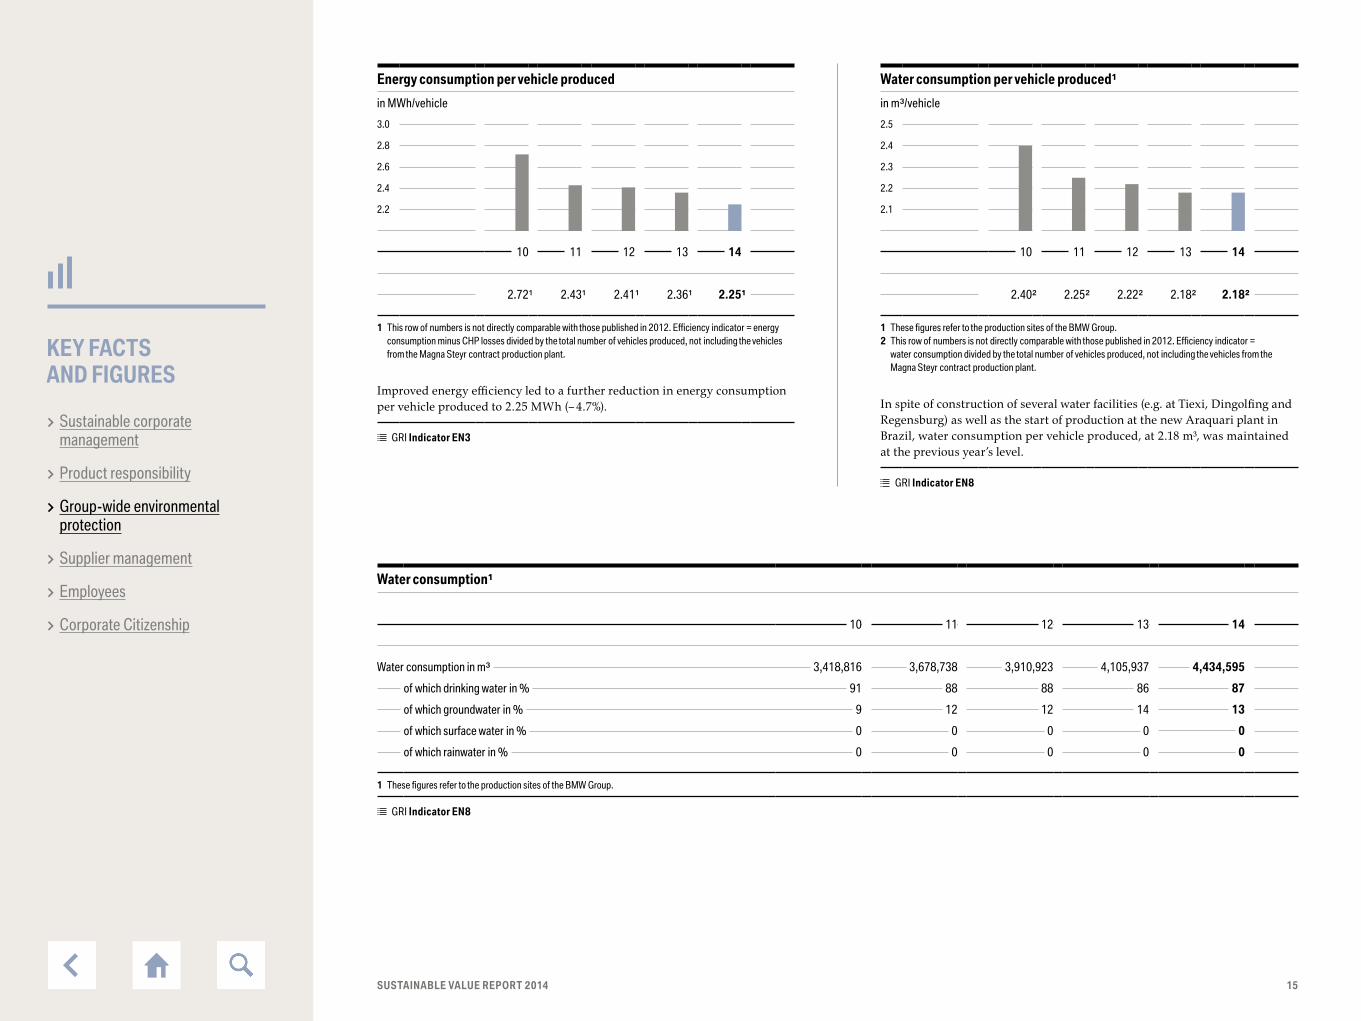
Energy consumption per vehicle produced
in MWh/vehicle
3.0
2.8
2.6
2.4
2.2
10 11 12 13 14
2.72¹ 2.43¹ 2.41¹ 2.36¹ 2.25¹
1 This row of numbers is not directly comparable with those published in 2012. Efficiency indicator = energy consumption minus CHP losses divided by the total number of vehicles produced, not including the vehicles from the Magna Steyr contract production plant.
Improved energy efficiency led to a further reduction in energy consumption per vehicle produced to 2.25 MWh (– 4.7%).
GRI Indicator EN3
Water consumption per vehicle produced¹
in m³/vehicle
2.5
2.4
2.3
2.2
2.1
10 11 12 13 14
2.40² 2.25² 2.22² 2.18² 2.18²
1 These figures refer to the production sites of the BMW Group. 2 This row of numbers is not directly comparable with those published in 2012. Efficiency indicator =
water consumption divided by the total number of vehicles produced, not including the vehicles from the Magna Steyr contract production plant.
In spite of construction of several water facilities (e.g. at Tiexi, Dingolfing and Regensburg) as well as the start of production at the new Araquari plant in Brazil, water consumption per vehicle produced, at 2.18 m³, was maintained at the previous year’s level.
GRI Indicator EN8
Water consumption¹
10 11 12 13 14
Water consumption in m³ 3,418,816 3,678,738 3,910,923 4,105,937 4,434,595
of which drinking water in % 91 88 88 86 87
of which groundwater in % 9 12 12 14 13
of which surface water in % 0 0 0 0 0
of which rainwater in % 0 0 0 0 0
1 These figures refer to the production sites of the BMW Group.
GRI Indicator EN8
Sustainable corporate management
Product responsibility
Group-wide environmental protection
Supplier management
Employees
Corporate Citizenship

16SUSTAINABLE VALUE REPORT 2014
KEY FACTS AND FIGURES
BMW Group CO² footprint
in t CO² 10 11 12 13 14
Total emissions¹ 1,961,348 2,715,364 61,603,503 64,019,874 66,913,264
Scope 1: Direct greenhouse gas emissions
Total emissions 409,911 450,828 484,612 492,798 494,931
Emissions of company-owned production sites 340,131 370,241 395,012 399,473² 403,810²
Company vehicles 65,974 76,120 84,633 88,695 85,695
Company-owned planes 3,806 4,468 4,966 4,630 5,426
Scope 2: Indirect greenhouse gas emissions
Total emissions 933,097 858,785 862,214 922,843² 966,067²
Electricity/heat purchased by company-owned production sites 933,097 858,785 862,214 922,843² 966,067²
Scope 3: Indirect greenhouse gas emissions
Total emissions 618,340 1,405,751 60,256,678 62,604,233 65,452,266
Logistics³ 466,027 1,195,887 1,247,100 1,383,774 1,518,304
Business trips³ 48,450 108,492 111,971 113,388 137,601
Employees’ commuter traffic4 103,863 101,372 113,505 122,584 121,428
Upstream chain5 – – 12,592,090 13,274,865 14,331,118
Utilisation phase6 – – 45,251,958 46,696,786 48,239,470
Disposal5 – – 940,054 1,012,836 1,104,345
1 Addition of emissions from employee’s commuter traffic as well as from 2012 onwards emissions from supply chain, utilisation phase and disposal.2 Currently applicable VDA emissions factors applied.3 Emissions figures from 2011 onwards are not directly comparable to previous years due to refinement of the calculation method.4 Extrapolation from the table “Means of transport used by BMW employees and indirect CO² emissions from employees’ commuter traffic”.5 Emissions from supply chain and disposal processes are calculated based on the carbon footprints of representative vehicles from the product lines.6 The fleet emissions are extrapolated from the average fleet emissions of the main sales markets of the BMW Group. The calculation was based on an average mileage of 150,000 km.
Some of the main measures taken in this process are continuous increases in energy efficiency, use of highly efficient combined heat and power systems (CHP) as well as the use of electricity supplied from renewable sources. In spite of an increase in the number of vehicles produced (comparison of vehicle production not including contract production at Magna Steyr and Nedcar) of 7.6%, this led to an increase in CO₂ emissions from vehicle production of just 3.6% (Scope 1 and Scope 2 including emissions from CHP losses, not including company cars and company-owned airplanes).
In addition, we fulfil our responsibilities along the entire value chain. With Efficient Dynamics, we are continuously reducing CO₂ emissions of our new vehicles we sell worldwide. As a result, we were able to further reduce average fleet emissions per kilometre in 2014. Global sales volume rose by 7.9% in the year under review. Through the application of Efficient Dynamics, the increase in emissions caused by this rise in volume was limited to just 3.3%. Upstream emissions also make a considerable contribution towards Scope 3 emissions. For this reason, we collaborate with our suppliers to identify and lever resource efficiency potential. For instance, in 2013, we joined the Supply Chain programme of the Carbon Disclosure Project (CDP) in order to achieve greater transparency with regard to resource efficiency and to work together to derive CO₂ savings potential.
GRI Indicators EN16, EN18
Sustainable corporate management
Product responsibility
Group-wide environmental protection
Supplier management
Employees
Corporate Citizenship

17SUSTAINABLE VALUE REPORT 2014
KEY FACTS AND FIGURES
CO² emissions per vehicle produced
in t/vehicle
0.95
0.90
0.85
0.80
0.75
0.70
0.65
10 11 12 13 14
0.89¹ 0.75¹ 0.72¹ 0.68¹ 0.66¹
1 This row of numbers is not directly comparable with those published in 2012. Efficiency indicator = CO² emissions minus combined heat and power (CHP) losses divided by the total number of vehicles produced, not including the vehicles from the Magna Steyr and Nedcar contract production plants.
Improved energy efficiency, the use of highly efficient and environmentally sustainable combined heat and power systems (CHP) as well as renewable energy led to a reduction in CO₂ emissions per vehicle produced in the reporting period of 2.9% to 0.66 tonnes (2013: 0.68).
GRI Indicators EN16, EN18
Solvent emissions per vehicle produced
in kg/vehicle
2.50
2.25
2.00
1.75
1.50
1.25
1.00
10 11 12 13 14
1.66¹ 1.75¹ 1.78¹ 1.59¹ 1.29¹
1 This row of numbers is not directly comparable with those published in 2012. Efficiency indicator = VOC emissions divided by the total number of vehicles produced, not including the vehicles from the Magna Steyr and Nedcar contract production plants.
In 2014, solvent emissions decreased significantly by 18.9% to 1.29 kg per vehicle produced. This is mainly due to the retrofitting of the paint shop in the Chinese Dadong plant with an exhaust air purification system. This had a full-year effect in the 2014 financial year (the system was installed during 2013).
GRI Indicator EN20
Emissions
in t
10 11 12 13 14
Nitrogen oxide (NOX) 457 592 617 598 581
Particulates, dust 25 56 60 60 59
Sulphur dioxide (SO2) 8 17 9 7 6
Carbon monoxide (CO) 243 372 354 380 375
Volatile organic compounds (VOC) 2,374 2,869 3,119 2,992 2,607
GRI Indicator EN20
Sustainable corporate management
Product responsibility
Group-wide environmental protection
Supplier management
Employees
Corporate Citizenship
18SUSTAINABLE VALUE REPORT 2014
KEY FACTS AND FIGURES
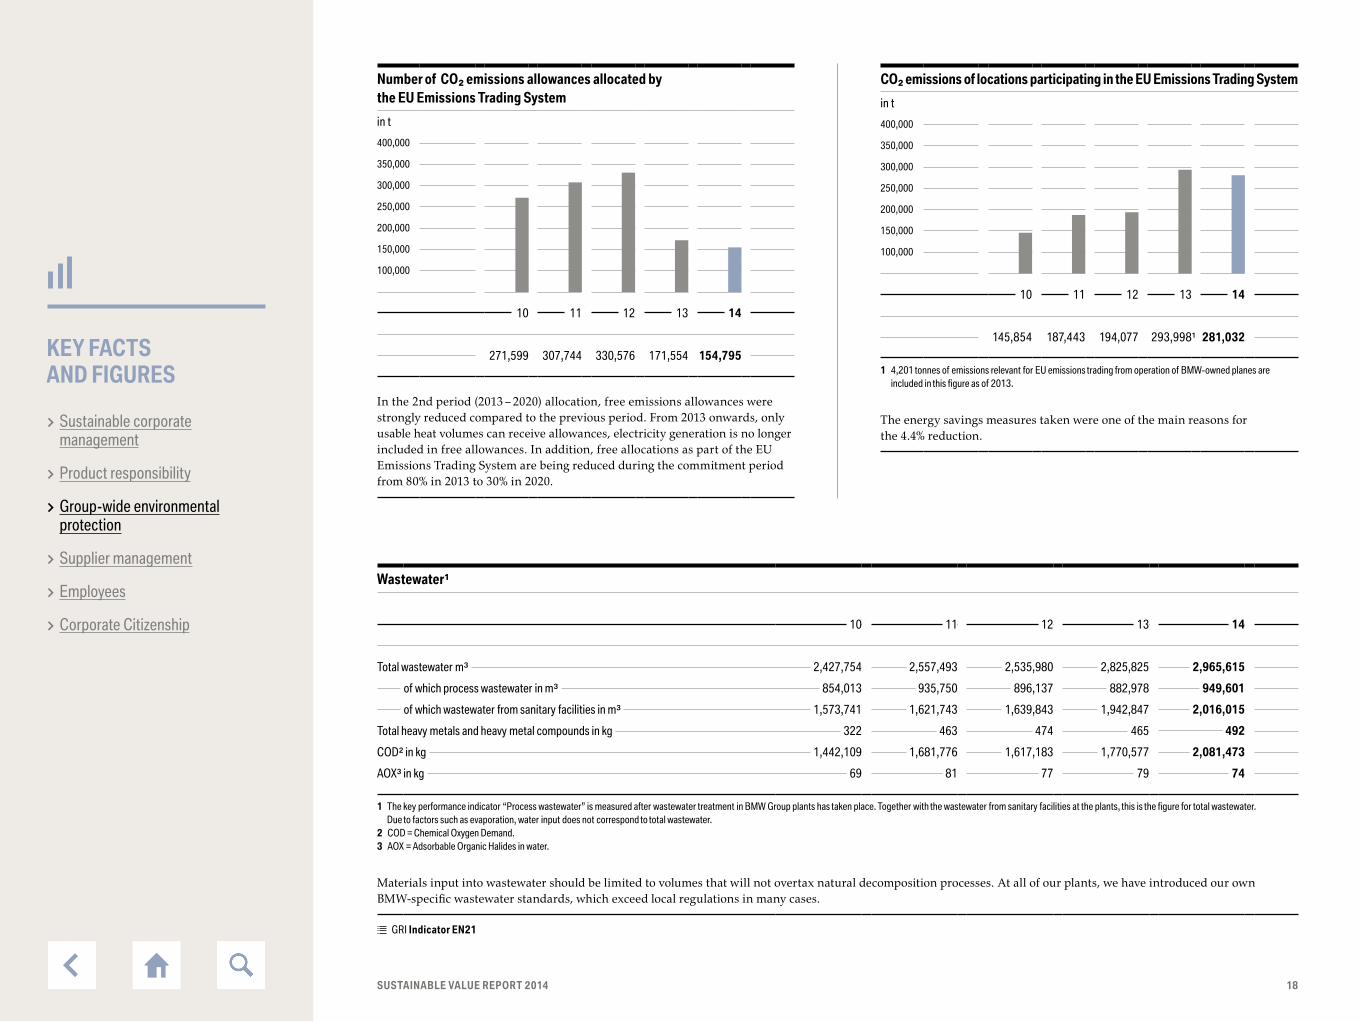
Wastewater¹
10 11 12 13 14
Total wastewater m³ 2,427,754 2,557,493 2,535,980 2,825,825 2,965,615
of which process wastewater in m³ 854,013 935,750 896,137 882,978 949,601
of which wastewater from sanitary facilities in m³ 1,573,741 1,621,743 1,639,843 1,942,847 2,016,015
Total heavy metals and heavy metal compounds in kg 322 463 474 465 492
COD² in kg 1,442,109 1,681,776 1,617,183 1,770,577 2,081,473
AOX³ in kg 69 81 77 79 74
1 The key performance indicator “Process wastewater” is measured after wastewater treatment in BMW Group plants has taken place. Together with the wastewater from sanitary facilities at the plants, this is the figure for total wastewater. Due to factors such as evaporation, water input does not correspond to total wastewater.
2 COD = Chemical Oxygen Demand.3 AOX = Adsorbable Organic Halides in water.
Materials input into wastewater should be limited to volumes that will not overtax natural decomposition processes. At all of our plants, we have introduced our own BMW-specific wastewater standards, which exceed local regulations in many cases.
GRI Indicator EN21
CO² emissions of locations participating in the EU Emissions Trading System
in t
400,000
350,000
300,000
250,000
200,000
150,000
100,000
10 11 12 13 14
145,854 187,443 194,077 293,998¹ 281,032
1 4,201 tonnes of emissions relevant for EU emissions trading from operation of BMW-owned planes are included in this figure as of 2013.
The energy savings measures taken were one of the main reasons for the 4.4% reduction.
Number of CO² emissions allowances allocated by the EU Emissions Trading System
in t
400,000
350,000
300,000
250,000
200,000
150,000
100,000
10 11 12 13 14
271,599 307,744 330,576 171,554 154,795
In the 2nd period (2013 – 2020) allocation, free emissions allowances were strongly reduced compared to the previous period. From 2013 onwards, only usable heat volumes can receive allowances, electricity generation is no longer included in free allowances. In addition, free allocations as part of the EU Emissions Trading System are being reduced during the commitment period from 80% in 2013 to 30% in 2020.
Sustainable corporate management
Product responsibility
Group-wide environmental protection
Supplier management
Employees
Corporate Citizenship

19SUSTAINABLE VALUE REPORT 2014
KEY FACTS AND FIGURES
Process wastewater per vehicle produced¹
in m³/vehicle
0.70
0.60
0.50
0.40
0.30
10 11 12 13 14
0.60² 0.57² 0.51² 0.47² 0.47²
1 The indicators refer to production wastewater.2 This row of numbers is not directly comparable with those published in 2012. Efficiency indicator =
process wastewater divided by the total number of vehicles produced, not including the vehicles from the Magna Steyr contract production plant.
In spite of challenges such as the start of production of the new plant in Brazil and the ramp-up curve of the BMW i vehicles, process wastewater per vehicle produced (0.47 m³) remained at the previous year’s level (0.47 m³).
GRI Indicator EN21
Waste for disposal per vehicle produced
in kg/vehicle
14.0
12.0
10.0
8.0
6.0
4.0
2.0
10 11 12 13 14
10.49¹ 8.49¹ 6.47¹ 5.73¹ 4.93¹
1 This row of numbers is not directly comparable with those published in 2012. Efficiency indicator = waste for disposal divided by the total number of vehicles produced, not including the vehicles from the Magna Steyr contract production plant.
Non-recyclable production waste was reduced in 2014 to 4.93 kg per vehicle produced. This is a decrease of 14.0% compared to 2013 (5.73 kg per vehicle). A large number of measures contributed to this reduction, e.g. the new method of treating washing water as waste for disposal at the vehicle brake disc production line in the Berlin plant.
GRI Indicator EN22
Waste
in t
10 11 12 13 14
Total waste 564,117 594,791 664,752 680,299 727,079
Hazardous waste for recovery 14,987 18,413 19,979 21,884 28,503
Hazardous waste for disposal 9,772 8,720 8,127 7,668 7,439
Non-hazardous waste for recovery 534,188 562,482 633,394 647,725 688,237
Non-hazardous waste for disposal 5,171 5,176 3,252 3,022 2,900
Materials for recycling 549,175 580,895 653,373 669,609 716,740
Metals for recycling (scrap) 428,175 449,900 494,894 500,589 525,812
Waste for disposal 14,943 13,896 11,379 10,690 10,339
The BMW Group aims to avoid waste. Unavoidable waste by-products are tested for reuse, material recycling and other applications. Recycling of waste is always given priority over waste disposal. Waste for disposal was reduced to 10,339 tonnes in 2014 (2013: 10,690). This is an overall reduction of 3.3% in spite of a 7.6% rise in production. At the same time, the proportion of materials for recycling or reuse increased again in 2014, reaching 99% (rounded-up figure) of total waste volume.
GRI Indicator EN22
Sustainable corporate management
Product responsibility
Group-wide environmental protection
Supplier management
Employees
Corporate Citizenship

20SUSTAINABLE VALUE REPORT 2014
KEY FACTS AND FIGURES
Land development
10 11 12 13 14
Size of property in m² 28,524,493 28,666,818 29,421,179 29,268,154 33,129,255
Land development in % 18.8 18.8 19.0 19.7 22.2
Means of transport used by BMW Group employees and indirect CO² emissions from employees’ commuter traffic
11¹ 12² 13³ 144
in % in t CO² in % in t CO² in % in t CO² in % in t CO²
Cars 45 43,008 47 53,036 50 59,882 51 60,009
Public transport 16 4,947 17 3,738 17 3,914 16 3,461
Plant bus 33 12,867 30 15,869 27 13,432 26 14,244
Bicycle/on foot 6 0 6 0 6 0 7 0
Total 100 60,823 100 72,643 100 77,228 100 77,714
1 Headquarters, including Research and Innovation Centre Munich; the Munich, Dingolfing, Regensburg and Berlin plants account for 60% of employees of the BMW Group and 81% of employees in Germany.2 Headquarters, including Research and Innovation Centre Munich; the Munich, Dingolfing, Regensburg Landshut, Leipzig and Berlin plants account for 64% of employees of the BMW Group and 90% of employees in Germany.3 Headquarters, including Research and Innovation Centre Munich; the Munich, Dingolfing, Regensburg, Landshut, Leipzig and Berlin plants account for 63% of employees of the BMW Group and 90% of employees in Germany.4 Headquarters, including Research and Innovation Centre Munich; the Munich, Dingolfing, Regensburg, Landshut, Leipzig and Berlin plants account for 64% of employees of the BMW Group and 92% of employees in Germany.
Mobility patterns changed slightly in 2014 compared to 2013. Current reports on plant bus utilisation and a survey carried out by the FIZ Research and Innovation Centre as well as in Landshut indicate that driving distances to work have decreased slightly and that car use has increased moderately at the FIZ. However, this increase was more than compensated for by a reduction in specific CO₂ car emissions in accordance with the current portfolio mix. Therefore, the overall average CO₂ emissions per employee and day of production of (4.5 kg) was lower than the previous year’s level. Total emissions rose slightly due to an increase in workforce numbers.
GRI Indicators EN7, EN17, EN29, A9 (Sector supplement)
Sustainable corporate management
Product responsibility
Group-wide environmental protection
Supplier management
Employees
Corporate Citizenship
21SUSTAINABLE VALUE REPORT 2014
KEY FACTS AND FIGURES
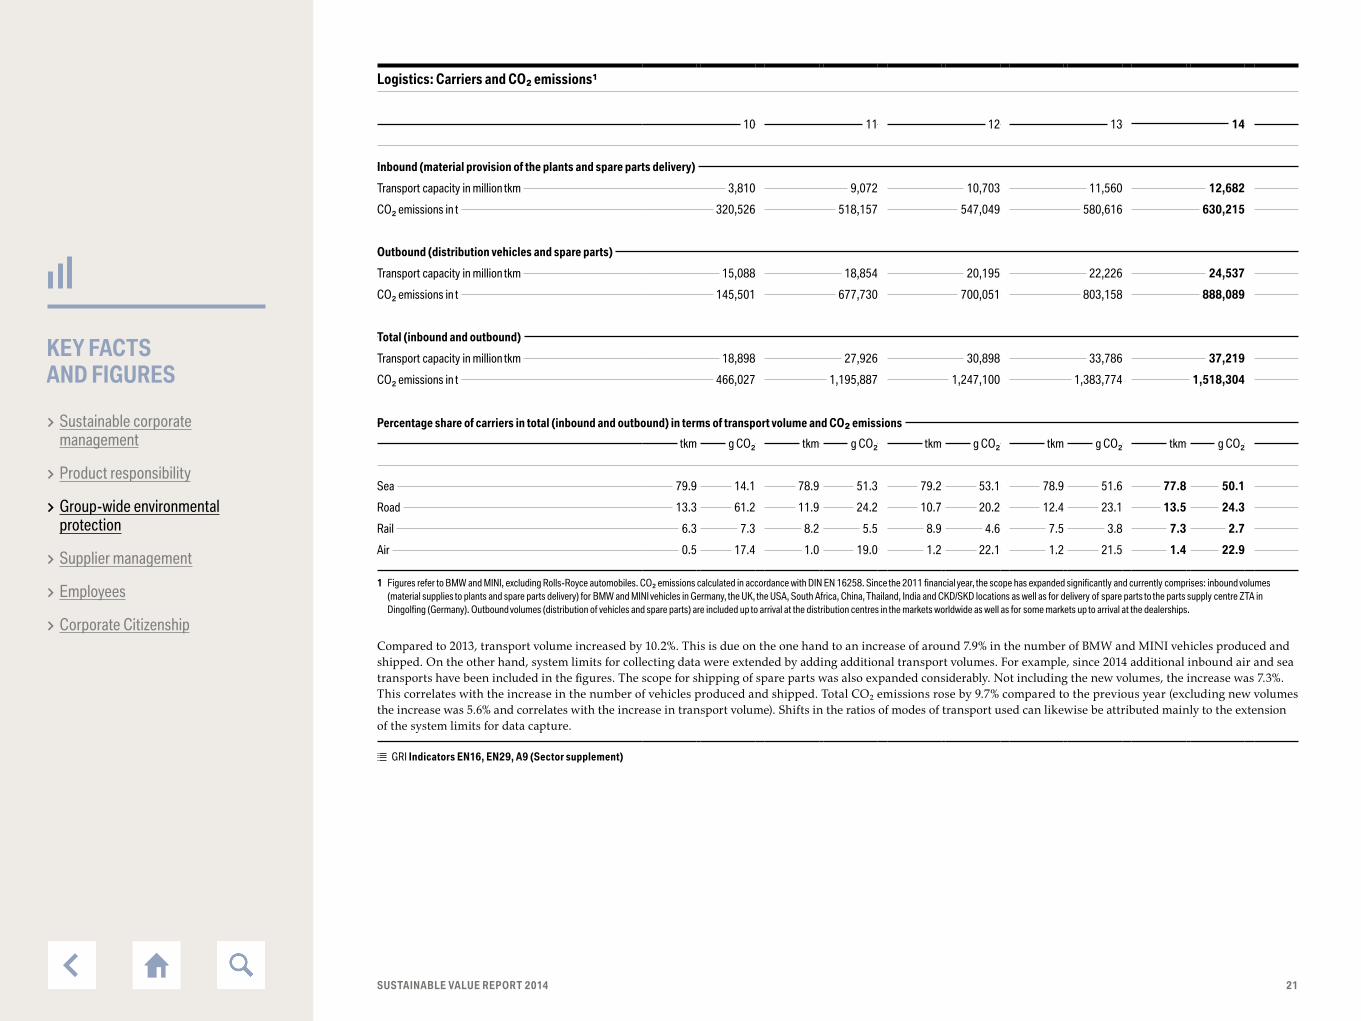
Logistics: Carriers and CO² emissions¹
10 11 12 13 14
Inbound (material provision of the plants and spare parts delivery)
Transport capacity in million tkm 3,810 9,072 10,703 11,560 12,682
CO² emissions in t 320,526 518,157 547,049 580,616 630,215
Outbound (distribution vehicles and spare parts)
Transport capacity in million tkm 15,088 18,854 20,195 22,226 24,537
CO² emissions in t 145,501 677,730 700,051 803,158 888,089
Total (inbound and outbound)
Transport capacity in million tkm 18,898 27,926 30,898 33,786 37,219
CO² emissions in t 466,027 1,195,887 1,247,100 1,383,774 1,518,304
Percentage share of carriers in total (inbound and outbound) in terms of transport volume and CO² emissions
tkm g CO² tkm g CO² tkm g CO² tkm g CO² tkm g CO²
Sea 79.9 14.1 78.9 51.3 79.2 53.1 78.9 51.6 77.8 50.1
Road 13.3 61.2 11.9 24.2 10.7 20.2 12.4 23.1 13.5 24.3
Rail 6.3 7.3 8.2 5.5 8.9 4.6 7.5 3.8 7.3 2.7
Air 0.5 17.4 1.0 19.0 1.2 22.1 1.2 21.5 1.4 22.9
1 Figures refer to BMW and MINI, excluding Rolls-Royce automobiles. CO² emissions calculated in accordance with DIN EN 16258. Since the 2011 financial year, the scope has expanded significantly and currently comprises: inbound volumes (material supplies to plants and spare parts delivery) for BMW and MINI vehicles in Germany, the UK, the USA, South Africa, China, Thailand, India and CKD/SKD locations as well as for delivery of spare parts to the parts supply centre ZTA in Dingolfing (Germany). Outbound volumes (distribution of vehicles and spare parts) are included up to arrival at the distribution centres in the markets worldwide as well as for some markets up to arrival at the dealerships.
Compared to 2013, transport volume increased by 10.2%. This is due on the one hand to an increase of around 7.9% in the number of BMW and MINI vehicles produced and shipped. On the other hand, system limits for collecting data were extended by adding additional transport volumes. For example, since 2014 additional inbound air and sea transports have been included in the figures. The scope for shipping of spare parts was also expanded considerably. Not including the new volumes, the increase was 7.3%. This correlates with the increase in the number of vehicles produced and shipped. Total CO₂ emissions rose by 9.7% compared to the previous year (excluding new volumes the increase was 5.6% and correlates with the increase in transport volume). Shifts in the ratios of modes of transport used can likewise be attributed mainly to the extension of the system limits for data capture.
GRI Indicators EN16, EN29, A9 (Sector supplement)
Sustainable corporate management
Product responsibility
Group-wide environmental protection
Supplier management
Employees
Corporate Citizenship

22SUSTAINABLE VALUE REPORT 2014
KEY FACTS AND FIGURES
Investment in environmental protection¹
in € million
160
140
120
100
80
60
40
20
10 11 12 13 14
Germany 21.7 32.6 50.9 78.6 68.2 Entire production network 134.4 148.1 149.8
Figures for production sites.1 Calculation of integrated environmental investments according to VDA standard.
Investment by the BMW Group in environmental protection in the reporting period was at the same level as in 2013. In 2014, we expanded our production structures for new launches and for extra capacity for production of BMW, MINI and Rolls-Royce vehicles and we invested in our production plants for BMW i. One example of this is the new production plant in Araquari (Brazil). An important aspect in all investment decisions was to take into account environmental considerations with a view to increasing resource efficiency.
GRI Indicators EN7, EN17, EN29, A9 (Sector supplement)
Share of vehicles shipped by rail from BMW Group plants¹
in %
70
60
50
40
30
20
10
10 11 12 13 14
49.5 53.1 56.9 60.7 63.3
1 Excluding Rolls-Royce automobiles.
An increase in the share of exports led to a further increase in the average volume of rail transport of BMW Group vehicles from the plants to 63.3%.
GRI Indicators EN29, A9 (Sector supplement)
Sustainable corporate management
Product responsibility
Group-wide environmental protection
Supplier management
Employees
Corporate Citizenship

23SUSTAINABLE VALUE REPORT 2014
KEY FACTS AND FIGURES
Regional mix of BMW Group purchase volumes in 2014
in %, basis: production material
a) Germany 47.2 d) NAFTA 14.5
b) Eastern Europe 17.2 e) Asia/Australia 3.7
c) Rest of Western Europe 15.9 f) Africa 1.5
In the reporting period, the company announced construction of a new plant in San Luis Potosí (Mexico) with a planned annual capacity of 150,000 units. This is in line with the company’s strategy of balanced global growth. For the BMW Group, this means a further increase in purchase volume in the NAFTA region in the coming years. This will also make an important contribution in terms of currency hedging. In view of these developments, the decentralised organisation within NAFTA will be reinforced and realigned. Here, too, local suppliers were selected according to the BMW Group sustainability requirements.
GRI Indicator EC6
a
fe
d
b
c
SUPPLIER MANAGEMENT
Sustainable corporate management
Product responsibility
Group-wide environmental protection
Supplier management
Employees
Corporate Citizenship

24SUSTAINABLE VALUE REPORT 2014
KEY FACTS AND FIGURES
BMW Group employees at end of year¹
Number
120,000
100,000
80,000
60,000
40,000
20,000
10 11 12 13 14
Total 95,453 100,306 105,876 ² 110,351³ 116,324 4
Employees in Germany Employees international
1 Figures exclude suspended contracts of employment, employees in the non-work phases of pre-retirement arrangements and low income earners.
2 Of whom 35.2% are tariff-bound production employees of the BMW Group.3 Of whom 35.1% are tariff-bound production employees of the BMW Group.4 Of whom 36.1% are tariff-bound production employees of the BMW Group.
The number of employees in the BMW Group had increased worldwide by the end of 2014 to a total of 116,324 (2013: 110,351 employees/+5.4%). This increase was mainly due to the expansion of our international production network as well as our increasing focus on innovation and future technol-ogies. Additional engineers and experts were recruited for this purpose.
GRI Indicator LA1
BMW Group employees
10 11 12 13 14
Workforce according to segment
Automotive 88,468 91,517 96,518 100,682 106,064
Motorcycles 2,814 2,867 2,939 2,726 2,894
Financial Services 4,053 5,801 6,295 6,823 7,245
Other 118 121 124 120 121
Share of employees with fixed-term contracts¹ in % 2.0 3.1 3.8 3.9 4.2
1 Excluding vocational trainees, interns and students.
GRI Indicator LA1
BMW Group apprentices as at 31 December
Number
5,000
4,500
4,000
3,500
3,000
2,500
10 11 12 13 14
Total 3,798 3,899 4,266 4,445 4,595
Around 1,500 young people began their vocational training at the BMW Group in 2014, 1,200 of whom were located in Germany. The company has thus expanded its training activities worldwide (2013: 1,363 vocational trainees worldwide).On the reporting date, the company employed a total of 4,595 young people in vocational training and young talent programmes worldwide.
GRI Indicator LA1
EMPLOYEES
Sustainable corporate management
Product responsibility
Group-wide environmental protection
Supplier management
Employees
Corporate Citizenship

25SUSTAINABLE VALUE REPORT 2014
KEY FACTS AND FIGURES
Share of employees per country with production site(s) in 2014
in %
a) Germany 71.0 f) India 0.6
b) UK 6.2 g) Thailand 0.3
c) USA 6.7 h) China 1.4
d) Austria 3.0 i) Brazil 0.6
e) South Africa 3.2 j) Other countries 7.0
Nearly three-quarters of employees at the BMW Group work in Germany, followed by the USA with 6.7% and the UK with 6.2%.
GRI Indicator LA1
a
gfed
b
c
h i j
Share of women in the workforce per country with production site(s) in 2014
in %
a) Germany 15.4
b) UK 14.3
c) USA 24.5
d) Austria 10.8
e) South Africa 20.0
f) India 8.2
g) Thailand 36.7
h) China 45.4
i) Brazil 26.5
j) Other countries 34.6
The share of women in the workforce varies strongly in the different functional areas: the share of women in production-related activities is less than 10%, while it is over 20% in sales-related activities.The employee share and share of women is therefore lower in production- intensive countries.
GRI Indicator LA13
BMW AG employees according to age group divided into functions and gender¹
in %
< 30 years old 30 – 50 years old > 50 years old
2012 total 10.9 65.3 23.8
2013 total 12.5 64.1 23.5
2014 total 12.5 62.0 25.5
direct² 15.1 58.8 26.1
indirect³ 10.8 64.2 25.1
male 11.3 62.1 26.6
female 20.4 61.6 18.0
1 Figures refer to employees with permanent contracts.2 Clock-controlled production employees.3 All employees without clock control.
Demographic change in an aging workforce is also reflected in the age structure at BMW AG. While the share of employees under 30 remained constant year on year and the share of employees between 30 and 50 slightly decreased, the share of over 50-year-old employees increased.
GRI Indicator LA13
Share of employees at BMW AG from Europe (not including Germany)and from non-EU countries
in %
a) From Germany 91.1
b) Europe (not including Germany) 4.0
c) Non-EU countries 4.9
As at 31 December 2014, employees from 108 different countries worked for BMW AG.
a
cb
Sustainable corporate management
Product responsibility
Group-wide environmental protection
Supplier management
Employees
Corporate Citizenship

26SUSTAINABLE VALUE REPORT 2014
KEY FACTS AND FIGURES
Share of female employees in total workforce of BMW AG/BMW Group
in %
18
17
16
15
14
13
12
10 11 12 13 14
BMW AG 13.2 13.5 14.2 14.5 14.8 BMW Group 15.2 16.1 16.8¹ 17.4 17.8
1 Figures for 2012 adjusted due to data cleansing.
Social diversity at the BMW Group is an integral part of our sustainabil-ity strategy and makes an important contribution towards the company’s performance. With this in mind, the BMW Group’s Diversity Concept has an important role to play in the company’s strategic direction, in which pro-viding opportunities for women is one of the three dimensions of diversity (along with an international workforce and a good age mix). The share of women in the overall workforce continued to increase. The share of women at BMW AG, for example, rose from 14.5 to 14.8% and at the BMW Group from 17.4 to 17.8%.
GRI Indicator LA13
Share of female employees in management positions atBMW AG/BMW Group
in %
12 13 14
SupervisoryBoard 20.0 20.0 25.0
Board ofManagement 12.5 12.5 12.5
Non-tariff employees
BMW AG 10.0 10.9 11.4
BMW Group 12.7¹ 13.8 14.2
1 Figures for 2012 adjusted due to data cleansing.
The term “non-tariff employees” primarily refers to managers, which is why it is listed here as the third category of management positions. The share of women also increased in the non-tariff area in 2013. At BMW AG, the share of women rose by 4.6%, at the BMW Group by 2.9%.
GRI Indicator LA13
Share of employees with severe disabilities at BMW AG
in %
6
5
4
3
2
1
10 11 12 13 14
6.0 5.1 6.0 5.9 6.2
The figure for severely disabled employees is based on the statutory require-ments in accordance with the German Social Insurance Code (SGB IX). Inaddition, the BMW Group awarded contracts amounting to around €30 mil-lion to workshops for the severely disabled in 2014. Around €7 million ofthis figure can be written off in accordance with the compensatory levy act. The order volume increased by around 1 million compared to the previous year.
GRI Indicator LA13
Sustainable corporate management
Product responsibility
Group-wide environmental protection
Supplier management
Employees
Corporate Citizenship

27SUSTAINABLE VALUE REPORT 2014
KEY FACTS AND FIGURES
Share of local employees in management positions at major company locations
in %
11 12 13 14
Munich plant, Germany 99.2 98.8 98.8 98.9
Dingolfing plant, Germany 99.7 99.7 99.7 99.7
Berlin plant, Germany 100.0 100.0 100.0 100.0
Landshut plant, Germany 100.0 100.0 99.2 100.0
Leipzig plant, Germany 100.0 100.0 98.2 99.2
Regensburg plant, Germany 100.0 100.0 100.0 100.0
UK 92.5 92.5 89.3 85.2
USA 90.9 91.2 89.0 86.8
Austria 88.8 83.0 84.7 86.2
South Africa 91.5 89.2 89.0 89.9
China¹ 43.3 28.4 63.0 50.6
India 56.0 54.8 59.5 61.8
Thailand 70.4 68.0 75.0 61.3
1 Including employees of the joint venture BMW Brilliance Automotive, which is not consolidated in the BMW Group.
“Local” refers to managers with local contracts. Persons deployed to work at the location who do not have a local employment contract are not included. Such persons are reflected in the difference from 100% in each case.
GRI Indicator EC7
Share of employees represented by a trade union or falling under collective agreements¹
in %
10 11 12 13 14
Germany³ 100 100 100 100 100
UK² 75 94 86 86 86
China (plant) 100 100 100 100 100
Austria³ 100 100 100 100 100
South Africa 46 51 61 61 60
USA (no collective agreements exist) 0 0 0 0 0
1 Figures from the UK, China and South Africa only available from 2010 onwards.2 In 2012, all employees from central functions as well as the Goodwood plant were included in the calculation. The figure for the UK is therefore not directly comparable with those of previous years.
If the same method were applied, the share would also be 86% in 2011.3 Excluding executives.
At the BMW Group, institutionalised operational co-determination is implemented Group-wide according to the applicable national regulations. At all BMW AG plants and branches as well as in Austria and the UK, elected works councils observe co-determination for the employees. In China and South Africa, employees are represented by local workers’ representatives, while at the company locations in the USA no collective agreements exist.
GRI Indicator LA4
Sustainable corporate management
Product responsibility
Group-wide environmental protection
Supplier management
Employees
Corporate Citizenship

28SUSTAINABLE VALUE REPORT 2014
KEY FACTS AND FIGURES
Average weekly working time by country¹
in hours
10 11 12 13 14
Germany
Industry-wide collective agreement for the Bavarian metal and electronics industries 35.0 35.0 35.0 35.0 35.0
Industry-wide collective agreement for commercial workers andemployees of the Saxony metal and electronics industries 38.0 38.0 38.0 38.0 38.0
Non-tariff employees 40.0 40.0 40.0 40.0 40.0
Austria (Steyr plant) 38.5 38.5 38.5 38.5 38.5
USA (Spartanburg plant) 40.0 40.0 40.0 40.0 40.0
UK (Oxford plant) 37.0 37.0 37.0 37.0 37.0
South Africa (Rosslyn plant) 40.0 40.0 40.0 40.0 40.0
1 Usual weekly working time according to employment contract, without part-time work.
The average weekly working time in Germany is 40 hours for non-tariff employees, and up to five hours less in Bavaria and Saxony due to the provisions of collective agreements there. At BMW Group plants abroad the weekly working time is similar to Germany.
Alternative work forms at BMW AG¹
Number of employees
10 11 12 13 14
Part-time employees 3,709 3,825 3,948 3,966 3,739
in % of total number of employees 5.3 6.0 5.8 5.7 5.1
Teleworking positions³ 9,209 11,717 15,235 18,094 22,297 ²
in % of total number of employees 13.2 16.4 22.5 25.9 49.9
Sabbaticals 498 450 514 511 516
in % of total number of employees 0.7 0.6 0.8 0.7 0.7
Parental leave 1,600 1,513 1,674 1,968 2,271
in % of total number of employees 2.3 2.1 2.5 2.8 3.1
1 Figures refer to employees with permanent and part-time contracts.2 Reporting logic was adapted when teleworking was introduced in 2014. In the past, reporting was based on the technical possibility of teleworking; since 2014, the number of employees is reported who actually engaged in teleworking.3 Administrative positions.
Part-time work is an important part of the flexible work time instruments at the BMW Group, particularly in view of the increasing demand for structures that allow for a good work-life balance as well as models adapted to different life phases. The number of part-time employees remained almost unchanged. The number of employees on teleworking models is increasing steadily.
GRI Indicator LA1
Sustainable corporate management
Product responsibility
Group-wide environmental protection
Supplier management
Employees
Corporate Citizenship

29SUSTAINABLE VALUE REPORT 2014
KEY FACTS AND FIGURES
Average days of further training per BMW Group employee¹
Number
4.0
3.5
3.0
2.5
2.0
1.5
10 11 12 13 14
2.6 3.6 3.7 3.5 3.9
1 Data retrieved by direct capture of the number of participants as well as a small share by qualified extrapolation.
In 2014, the BMW Group increased expenditure on further education and training to €335 million (+16,3% compared to the previous year). Average days of further education and training per BMW Group employee increased significantly.
GRI Indicator LA10
Average training hours at the BMW AG Academy, by employee category¹
Number of employees
12 13 14
Non-tariffemployees 27.1 31.2 30.5
“Meister”(master craftsmen) 32.5 40.7 35.0
Tariff² 16.2 17.0 17.5
Days of further training for managers in the BMW Group
Number 16,123 18,843 18,920
1 Until 2008: BMW AG Performance Centres.2 (w/o “Meister”) + vocational trainees + other.
The BMW Academy founded in 2009 coordinates vocational training and further training for all company locations in Germany and the UK under one roof. This facilitates the coordination of training courses and generates synergies through the use of shared resources. The BMW Group’s training offensive was able to build on its figures from 2014. Both the average amount of time spent on training as well as expenditure were at a similar level to the previous year. This trend can be observed throughout the whole company. In addition to classical training courses and e-learning, brand new education programmes were launched, such as bachelor’s and master’s degrees in cooperation with universities. The BMW Group invests continuously in training its managers worldwide.
GRI Indicator LA10Investment in further education and training¹ at the BMW Group
in € million
400
350
300
250
200
150
10 11 12 13 14
179 246 282 288 335
1 BMW Group investments are dependent on current further education and training requirements, which may lead to year-on-year fluctuations.
The BMW Group sees targeted employee training as an investment in the future. For this purpose, investment in education and further training was increased by 16,3% in 2014. Building and maintaining skills expertise within the Group’s workforce are key aspects of strategic corporate governance in this area.
Sustainable corporate management
Product responsibility
Group-wide environmental protection
Supplier management
Employees
Corporate Citizenship

30SUSTAINABLE VALUE REPORT 2014
KEY FACTS AND FIGURES
BMW Group personnel costs per employee¹
in €
95,000
90,000
85,000
80,000
75,000
70,000
10 11 12² 13³ 14
83,141 84,887 89,161 89,869 92,337
1 Figures exclude suspended employment contracts, employees in non-work phases of pre-retirement part-time arrangements, trainees, students and low income earners.
2 Adapted in accordance with the revised version of IAS 19; see note [7] in the Notes to the Group Financial Statements of the BMW Group Annual Report 2013.
3 The previous year’s figures were adjusted in accordance with IAS 8; see note number [9] in the Notes to the Group Financial Statements in the BMW Group Annual Report 2014.
Maintaining a competitive level of expenditure on personnel plays a major role in the success of the BMW Group. In addition to focusing on cost, the aim is also to increase efficiency at all levels of the business. The high degree of motivation amongst employees and the positive corporate approach towards the workforce are maintained and underscored by a combination of rewards determined individually on the basis of performance and success.
GRI Indicator LA10
Profit-sharing scheme at BMW AG by year of payment¹
in % of monthly salary/in % of personal base value (from 2011)
200
175
150
125
100
75
10 11 12 13 14
none 98.0² 153.0 152.6 162.8
Due to the significant decline in profits, in 2009 and 2010 BMW AG employees did not receiveany bonuses for 2008 and 2009.1 New employees receive full bonuses after four years of employment.2 New bonus system from 2011 based on personal base value.
Since the 2010 financial year (payout in 2011), bonuses at BMW AG have been determined according to a uniform system across all hierarchical levels. Starting in the 2011 financial year (payout in 2012) this system was also introduced for employees worldwide as a standardised corporate success component in nearly all BMW Group companies. The consistency of this component is thus ensured both hierarchically (from production worker to board member) and geographically (worldwide). This portion of the bonus depends on the earnings performance of the BMW Group and is accordingly calculated according to these three parameters: Group earnings after tax, after-tax return on sales, and dividends. Including the post-tax return on sales in the calculation of bonuses (including for the Board of Management and the upper executives) in particular ensures an orientation towards the profitable, and hence sustainable, growth of the BMW Group.
Share of performance-related compensation in BMW AG salaries, by employee category¹
in % of salary group
12 13 14
Uppermanagement 54 – 70 53 – 69 53 – 72
Middlemanagement 37 – 40 37 – 40 37 – 41
Lowermanagement 10 10 10
1 The definition focuses on the target value and has thus changed compared to the previous years.
Performance-based remuneration comprises a personal bonus and a cor-porate earnings-related bonus. The amount of the personal bonus depends on personal performance as well as achievement of the individual’s targets. The amount of the corporate bonus depends on the company’s performance. The variable part of remuneration increases as more responsibility is taken within the company.
Sustainable corporate management
Product responsibility
Group-wide environmental protection
Supplier management
Employees
Corporate Citizenship
31SUSTAINABLE VALUE REPORT 2014
KEY FACTS AND FIGURES
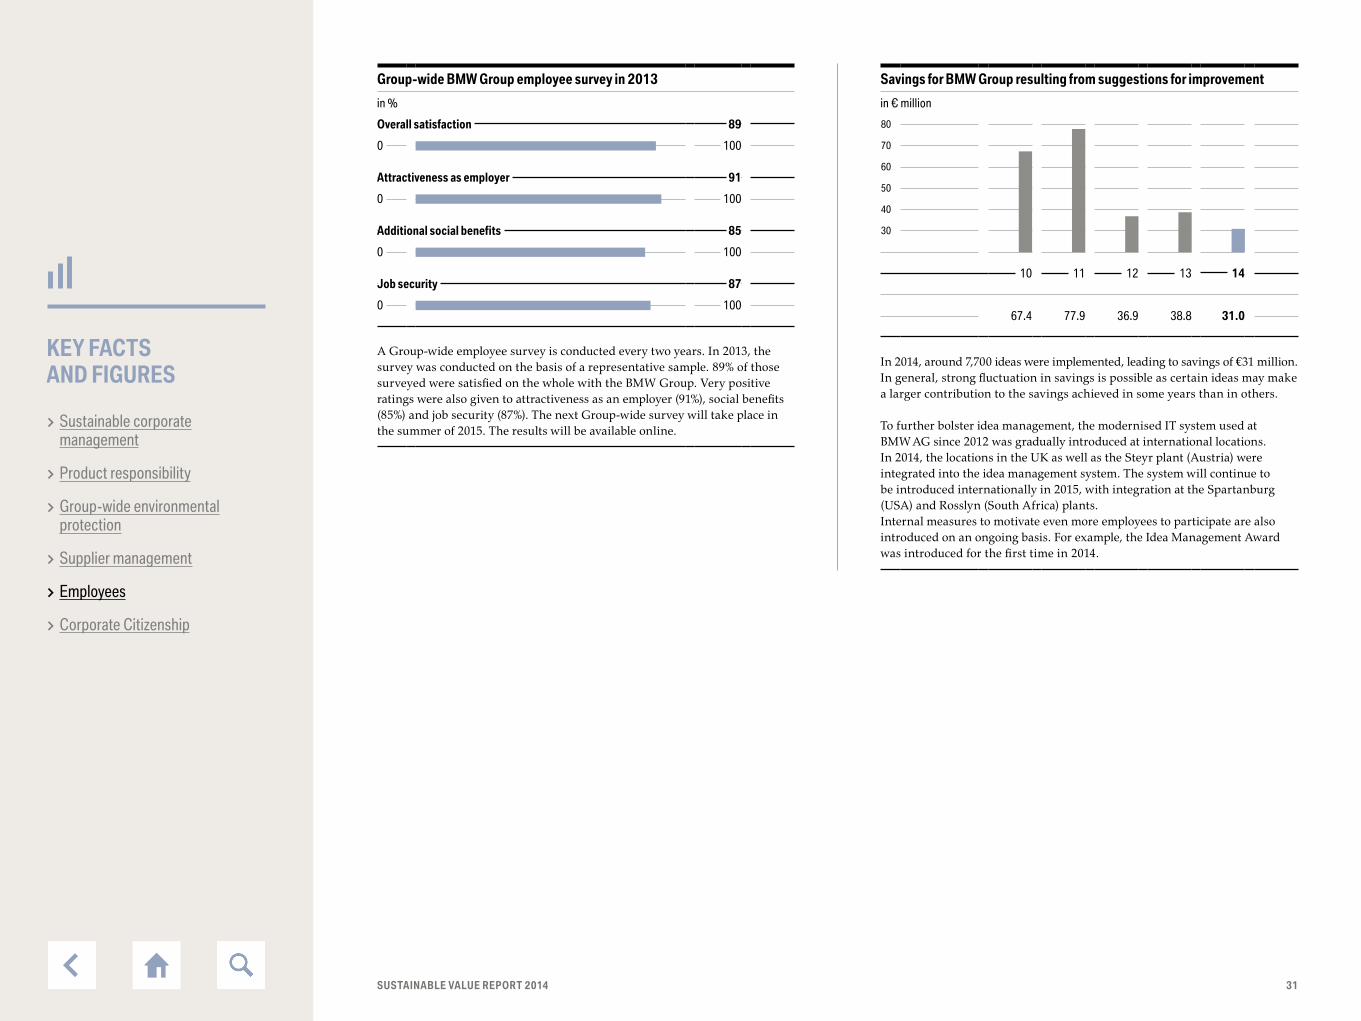
Group-wide BMW Group employee survey in 2013
in %
Overall satisfaction 89
0 100
Attractiveness as employer 91
0 100
Additional social benefits 85
0 100
Job security 87
0 100
A Group-wide employee survey is conducted every two years. In 2013, the survey was conducted on the basis of a representative sample. 89% of those surveyed were satisfied on the whole with the BMW Group. Very positive ratings were also given to attractiveness as an employer (91%), social benefits (85%) and job security (87%). The next Group-wide survey will take place in the summer of 2015. The results will be available online.
Savings for BMW Group resulting from suggestions for improvement
in € million
80
70
60
50
40
30
10 11 12 13 14
67.4 77.9 36.9 38.8 31.0
In 2014, around 7,700 ideas were implemented, leading to savings of €31 million. In general, strong fluctuation in savings is possible as certain ideas may make a larger contribution to the savings achieved in some years than in others.
To further bolster idea management, the modernised IT system used at BMW AG since 2012 was gradually introduced at international locations. In 2014, the locations in the UK as well as the Steyr plant (Austria) were integrated into the idea management system. The system will continue to be introduced internationally in 2015, with integration at the Spartanburg (USA) and Rosslyn (South Africa) plants.Internal measures to motivate even more employees to participate are also introduced on an ongoing basis. For example, the Idea Management Award was introduced for the first time in 2014.
Sustainable corporate management
Product responsibility
Group-wide environmental protection
Supplier management
Employees
Corporate Citizenship

32SUSTAINABLE VALUE REPORT 2014
KEY FACTS AND FIGURES
Occupational health and safety management systems at BMW Group sites
Occupational health andPlant occupational health and safety certification safety management system Most recent year of certification
Berlin plant, Germany OHSAS 18001 December 2014
Dingolfing plant, Germany OHRIS May 2012
Eisenach plant, Germany OHSAS 18001 Planned 2015
Goodwood plant, UK¹ HS(G) 65³ Introduced
Hams Hall plant, UK¹ HS(G) 65³ Introduced
Landshut plant, Germany OHRIS October 2012
Leipzig plant, Germany OHRIS March 2013
Munich plant, Germany OHRIS April 2012
Oxford plant, UK¹ HS(G) 65 Introduced
Regensburg plant, Germany OHRIS June 2012
Rosslyn plant, South Africa OHSAS 18001 December 2014
Spartanburg plant, USA OHSAS 18001 February 2013
Steyr plant, Austria OHSAS 18001 December 2012
Swindon plant, UK¹ HS(G) 65³ Introduced
Wackersdorf plant, Germany4 OHRIS June 2012
Araquari plant, Brazil OHSAS 18001 Planned 2016
Chennai plant, India OHSAS 18001 January 2013
CKD production Jakarta, Indonesia OHSAS 18001 January 2014
CKD production Cairo, Egypt OHSAS 18001 October 2014
CKD production Kaliningrad, Russia5 National standard Introduced
CKD production Kulim, Malaysia OHSAS 18001 December 2012
CKD production Manaus, Brazil National standard Introduced
CKD production Rayong, Thailand OHSAS 18001 January 2013
BMW Brilliance Automotive, Shenyang, China² (joint venture) OHSAS 18001 January 2013
SGL Automotive Moses Lake, USA (joint venture) OHSAS 18001 Planned 2015
SGL Automotive Wackersdorf, Germany (joint venture) OHSAS 18001 Planned 2015
Magna Steyr Fahrzeugtechnik Graz, Austria (contract production) OHSAS 18001 July 2012
VDL Nedcar, Born, the Netherlands (contract production) Based on OHSAS 18001 Not planned
1 OHSAS certification planned 2015.2 Includes the Dadong, Tiexi and Powertrain plants.3 HS(G) 65, Successful health and safety management, British Government guidelines on safety at the workplace. Does not require certification.4 Jointly certified with BMW Regensburg plant.5 GOST (state standard specification) 12.0230-2007 SSBT. Does not require certification.
At present, OHRIS- and OHSAS-certified occupational health and safety management systems are in place at 19 of our 30 production plants (including joint ventures and contract production in Jakarta, Cairo, Kaliningrad, Kulim, Manaus and Graz). Seven additional facilities work with systems that meet national standards. OHSAS certification was introduced at the Indonesia plant in January 2014. Certification of the Eisenach plant and the plants in the UK is planned in 2015. The same goes for the joint venture locations SGL Automotive Moses Lake and Wackersdorf, where certification was postponed to Q4 2015 due to plant expansion work.
GRI Indicator LA8
Sustainable corporate management
Product responsibility
Group-wide environmental protection
Supplier management
Employees
Corporate Citizenship

33SUSTAINABLE VALUE REPORT 2014
KEY FACTS AND FIGURES
Occupational safety at BMW AG/BMW Group¹
Number/number of participants
10 11 12 13 14
Total accidents BMW AG (number) 4,458 3,941 4,128 4,413 4,481
Accidents BMW AG with days absent from work²(number) 913 744 639 539 667
Accident frequency rate³ BMW AG 9.7 7.9 6.6 5.3 5.8
Accident frequency rate³ BMW Group 9.1 7.1 5.8 4.8 5.1
Safety training by BMW AGoccupational safety association 1,419 1,059 4,315 2,387 2,750
Web-based training inoccupational safety at BMW Group4 11,935 15,902 17,180
Other training courses inoccupational safety at BMW Group4 16,513 10,892 10,984
Employees at BMW Group (number) 10,626 9,611 6,941
Employees of third-party companies (number) 5,887 1,281 4,043
BMW Group risk assessments5 19,967 21,612 26,040 26,462 27,300
1 Figures for BMW AG including dealerships as of 2014.2 Occupational accidents with at least one day of absence from work.3 Number of occupational accidents per one million hours worked with at least one day of absence from work.4 Training courses captured in 2012 for the first time.5 Safety assessments of workplaces, including with regard to possible ergonomic and health strains (ABATech method). Figures are cumulative and apply to the BMW Group.
There have been no fatal accidents at the BMW Group for the last nine years. Continuous improvements in workplace safety and special safety training are bearing fruit. In addition to training by the occupational safety association, a large number of internal training courses is carried out, data on which has been captured since 2011. A total of 10,984 employees of the BMW Group as well as employees of third-party companies took part in safety training. In addition 4,888 people underwent training in first aid in Germany alone.
GRI Indicators LA7, LA8
Sustainable corporate management
Product responsibility
Group-wide environmental protection
Supplier management
Employees
Corporate Citizenship

34SUSTAINABLE VALUE REPORT 2014
KEY FACTS AND FIGURES
Sickness rate at BMW AG
in %
5.0
4.5
4.0
3.5
3.0
2.5
10 11 12 13 14
4.6 4.5 4.4 4.3 4.2
The sickness rate at BMW AG (4.2%) is again lower than the previous year’s level (4.3%). The sickness rate was thus reduced for the fourth consecutive time.
Accident frequency rate at BMW Group by region¹
per one million hours worked
Accident frequency
Germany (BMW AG excluding dealerships) 5.8
North America² 1.5
South Africa³ 2.3
UK4 4.8
Austria5 6.1
1 Occupational accidents with at least one day of absence from work per one million hours worked.2 Spartanburg plant, Financial Services, dealerships.3 Rosslyn plant, Financial Services, dealerships.4 Oxford plant, Swindon, Hams Hall, Goodwood, Financial Services, dealerships.5 Steyr plant.
Occupational accidents at BMW AG are currently captured on a region- specific basis as well as in the regions of our production sites. Gradual application to other BMW Group locations (e.g. regions with CKD plants) is planned over the coming years.
GRI Indicator LA7
Accident frequency rate at BMW Group¹
per one million hours worked
10.0
9.0
8.0
7.0
6.0
5.0
4.0
10 11 12 13 14
9.1 7.1 5.8 4.8 5.1
1 Number of occupational accidents per one million hours worked with at least one day of absence from work.
Occupational safety takes absolute priority at the BMW Group and is firmly anchored in all work processes in production.In the reporting period, dealerships of BMW AG were included in accident frequency calculations for the first time. Implementation and optimisation of the certified occupational safety management safety system in accordance with OHSAS 18001 led to a significantly lower accident frequency rate at the dealerships of the sales organisation in Germany compared to the industry average.Within the new system limits (around 88% of BMW Group employees captured in data), the accident frequency rate is 5.1; based on the system limits of the 2013 financial year, the figure is 4.4 (improvement of 8.3%).
GRI Indicator LA7
Sustainable corporate management
Product responsibility
Group-wide environmental protection
Supplier management
Employees
Corporate Citizenship

35SUSTAINABLE VALUE REPORT 2014
KEY FACTS AND FIGURES
Total days of work missed at BMW AG¹
Number
18,000
16,000
14,000
12,000
10,000
8,000
6,000
4,000
2,000
10 11 12 13 14
Total 16,620² 15,892³ 12,737³ 14,853³ 13,952³
Due to a notifiable work accident. Due to a notifiable accident on the way to or from work.
1 Figures for BMW AG, including dealerships.2 Days of absence from work due to notifiable occupational accidents and/or accidents
on the way to or from work (> 3 days of absence from work).3 Days of absence from work due to notifiable occupational accidents and/or accidents
on the way to or from work with at least one day of absence from work.
The number of occupational accidents with days absent from work dropped by 7.8% in 2014 compared to the previous year. The correlating decrease in days absent from work was 6.1%. The average duration of absence from work per occupational accident was 12.7 days, the figure for the previous year was 14.9 days.
GRI Indicator LA7
Employee attrition rate BMW AG¹
as a % of the workforce
6
5
4
3
2
1
10 11 12 13 14
2.74 2.16 3.87 3.47 1.41
1 Number of employees on unlimited employment contracts leaving the company.
At 1.4%, the attrition rate was slightly lower in 2014 than in 2013. A lower retirement rate is the primary reason for this. If retirement figures are excluded, the attrition rate remains very low, demonstrating the effectiveness of the proven programmes and measures of the BMW Group geared toward positioning itself as an attractive employer.
GRI Indicator LA2
Total number of employees leaving BMW AG, by reason for leaving¹
Number
3,000
2,500
2,000
1,500
1,000
500
10 11 12 13 14
Total 1,753 1,389 2,561 2,371 1,014
Number dismissed by employer Voluntarily left company (termination or suspension of employment contract by employee) Pension, death, pre-retirement part-time working arrangements
1 Figures refer to employees with permanent contracts.
The sharp drop in the number of people leaving the company for age-related reasons (retirement, pre-retirement part-time working arrangements) led to a decrease in the overall figure. The share of women in the total number of people leaving the company (1,014) was 17.5% in 2014. By contrast, the share of women among newly recruited employees was 20.5%.
GRI Indicator LA2
Sustainable corporate management
Product responsibility
Group-wide environmental protection
Supplier management
Employees
Corporate Citizenship

36SUSTAINABLE VALUE REPORT 2014
KEY FACTS AND FIGURES
BMW Group donations worldwide in 2014
in %, total amount €10,199,438¹
a) Science/education 43.1 d) Politics 0.3
b) Society/community 41.3 e) Environment/sustainability 0.3
c) Culture 6.9 f) Sport 8.1
1 The sum indicated here does not include either cause-related marketing or sponsorship and does not contain the projects and activities carried out in the context of the company’s social and cultural commitment.
The BMW Group focuses its activities in the area of donations on society and the community as well as science and education, providing targeted support of projects connected with the company’s core competencies and activities. Donations made by the BMW Group in 2014 were approximately 20% higher than in 2013.
GRI Indicators EC1, SO6
a
d
b
ce f
Donations in the field of politics
in €
700,000
600,000
500,000
400,000
300,000
200,000
100,000
10 11 12 13 14
603,145 430,517 427,442 223,701 31,499
Since 2014, the BMW Group has supported the work on social policy carried out by the democratic parties in Germany solely through theme-based partnerships that are subject to the clear sponsoring regulations of the BMW Group. In 2013 the procedure for supporting political parties was successively changed. In the past, the BMW Group primarily donated vehicles for use free of charge. The parties provided the BMW Group with confirm-ation of receipt of a donation by stating the corresponding value or rental rate. In 2013, this procedure was temporarily continued for the CSU. This led to a final settlement for vehicle transfer in 2014. All BMW Group donations above €10,000 for each year are published by name in the accounts included in the party financing report of the President of the German Federal Parliament. International political donations by the BMW Group are only made in clearly defined and exceptional cases which are subject to the respective legal framework conditions. Expenditure on international political donations in 2014 amounted to around 0.6% (previous year: 0.9%) of total expenditure on international donations.
GRI Indicator SO6
CORPORATE CITIZENSHIP
Sustainable corporate management
Product responsibility
Group-wide environmental protection
Supplier management
Employees
Corporate Citizenship

37SUSTAINABLE VALUE REPORT 2014
KEY FACTS AND FIGURES
Amount of expenditure on corporate citizenship, by type of activity
in € thousand
40,000
35,000
30,000
25,000
20,000
15,000
10,000
5,000
10 11 12 13 14
Total 26,591 36,846 31,979 28,944 34,524
Donations/contributions in kind Community investment Commercial activities (sponsoring, cause-related marketing)
The activities of the BMW Group in the area of corporate citizenship are divided into three main areas. Firstly: monetary donations and donations in kind. Secondly: community investment. Community investment refers to investment in project initiatives conceived in-house, cooperative endeavours and partnerships as well as corporate volunteering by BMW Group employees. And thirdly: commercial activities, i.e. sponsorship and cause-related marketing.Total expenditure on corporate citizenship activities of the BMW Group decreased compared to the 2013 financial year. The main reasons for this were individual lighthouse projects that were expanded in the 2014 financial year, for example the Intercultural Innovation Award and Junior Campus. In addition, new legislation in some countries has led to an increase in CSR activities in order to meet requirements.
GRI Indicator EC1
Sustainable corporate management
Product responsibility
Group-wide environmental protection
Supplier management
Employees
Corporate Citizenship

38SUSTAINABLE VALUE REPORT 2014
Fuel consumption and CO₂ emissions ratings for the vehicles referred to in this report
Model Urban (l/100 km) Extra-urban (l/100 km) Combined (l/100 km) CO² emissions combined (g/km)
BMW ActiveHybrid 3 – [5.5] – [6.2] – [5.9] – [139]
BMW ActiveHybrid 5 – [6.1 – 6.7] – [6.6 – 7.2] – [6.4 – 7.0] – [149 – 163]
BMW ActiveHybrid 7 – [6.0] – [7.2] – [6.8] – [158]
BMW 116i 7.0 – 7.3 [7.2 – 7.4] 4.5 – 4.7 [4.6 – 4.8] 5.4 – 5.6 [5.6 – 5.8] 125 – 131 [129 – 134]
BMW 320d Touring 5.9 – 6.0 [5.7] 4.0 [4.1] 4.7 – 4.8 [4.7] 124 – 125 [123 – 124]
BMW X1 sDrive18d 5.7 [5.6] 4.4 [4.7] 4.9 [5.0] 128 [132]
BMW X3 xDrive20d 5.9 – 6.3 [5.4 – 5.8] 4.7 – 5.1 [4.8 – 5.1] 5.2 – 5.6 [5.0 – 5.4] 136 – 146 [131 – 141]
MINI Cooper D 4.3 – 4.4 [4.2 – 4.3] 3.1 – 3.2 [3.5] 3.5 – 3.6 [3.7 – 3.8] 92 – 95 [98 – 99]
MINI One D 3.9 – 4.0 3.1 – 3.2 3.4 – 3.5 89 – 92
Model Urban (l/100 km) Extra-urban (l/100 km) Combined (l/100 km) CO² emissions combined Average total energy consumption (g/km) (kWh/100 km)
BMW i3 (Range Extender) omitted omitted – [0.6] – [13] – [13.5]
BMW i3 omitted omitted – [0] – [0] – [12.9]
Model Urban (l/100 km) Extra-urban (l/100 km) Combined (l/100 km) CO² emissions combined Electricity consumption combined (g/km) (in addition to fuel consumption)
(kWh/100 km)
BMW i8 omitted omitted [2.1] – [49] – [11.9]
BMW X5 xDrive40e¹ omitted omitted – [3.3 – 3.4] – [77 – 78] – [15.3 – 15.4]
1 Provisional data.
Figures in brackets apply to automatic transmission. Fuel consumption and CO² emissions are dependent on wheel and tyre size. Fuel consumption is determined in accordance with the ECE driving cycle. Valid for vehicles with a European country specification. All engines comply with at least Euro 5 emissions standards. Further information on the official fuel consumption, specific official CO² emissions and power consumption of new passenger vehicles can be found in the “Guideline for fuel consumption, CO² emissions and electric power consumption of new passenger vehicles”, available free of charge from all sales outlets, the Deutsche Automobil Treuhand GmbH (DAT), Hellmuth-Hirth-Straße 1, 73760 Ostfildern – Scharnhauser Park, Germany and at http://www.dat.de/angebote/verlagsprodukte/leitfaden-kraftstoffverbrauch.html.
As at December 2014.Further, regularly updated information on the vehicles referred to in this publication can be found at www.bmw.com, www.mini.com and www.rolls-roycemotorcars.com.