Embed Size (px)
Citation preview

1
KEY CONCERNS FOR THE LITHIUM INDUSTRY TO THE END OF THE DECADELITHIUM SUPPLY & MARKETS CONFERENCE MONTREAL, CANADA
31 MAY 2017
For
per
sona
l use
onl
y

2
DEMAND
For
per
sona
l use
onl
y
3
0102030405060708090
2000 2005 2010 2015
LCE
kt
Lithium Consumption by Li-ion Battery End Use (LCE kt)
Portable Electronics Aftermarket
Power Devices & Other ESS Applications
Automotive
BATTERY GROWTH IN THE AUTO SEGMENT HAS GENERATED SIGNIFICANT LITHIUM DEMAND
• With the portable electronics market atsaturation, growth is being delivered byautomotive, ESS and power devicessegments
• The automotive market’s lithiumconsumption is being enhanced bydeclining costs (currently ~US$220/Kwhheading toward US$150/Kwh) and amove to bigger batteries
• EV growth rates are currently ~40% andmany expect 45-50% may be reached by2020
• ESS growth rates ~25% and accelerating
• Battery lithium consumption (kg per kWhsteadily declining 1kg > 0.8kg andpossibly to 0.6kg
Source: Roskill, Canaccord, Independent research
For
per
sona
l use
onl
y
4
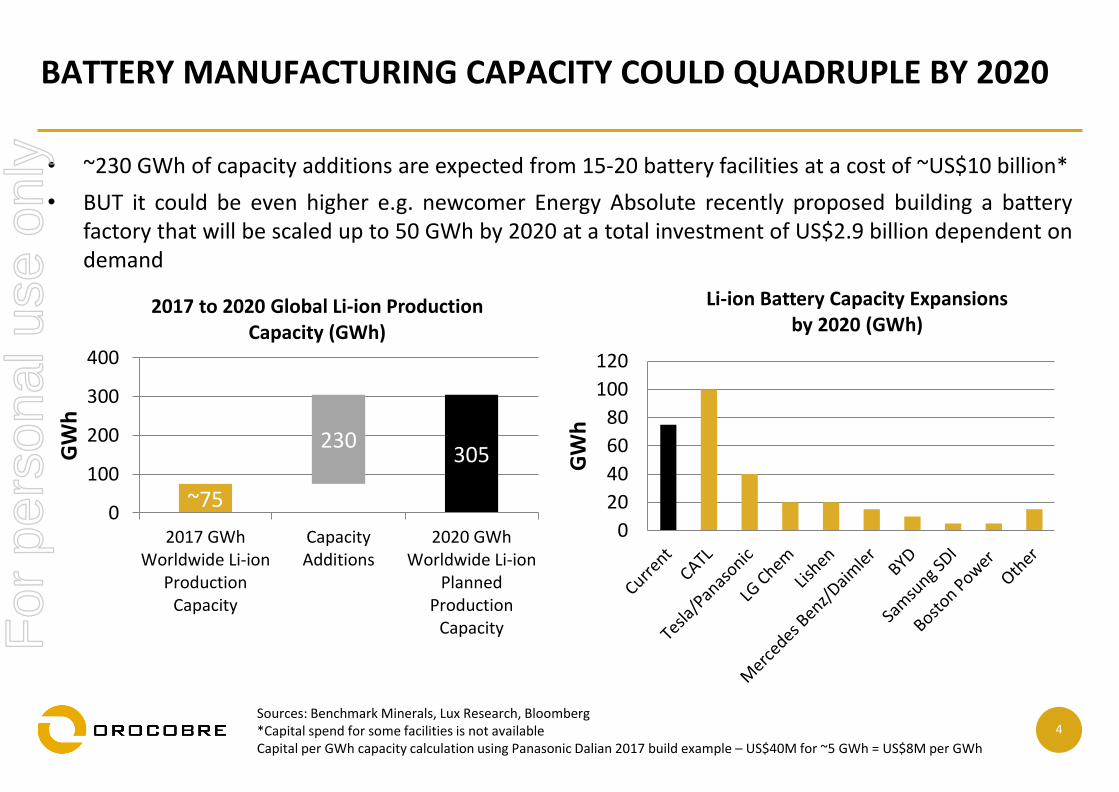
BATTERY MANUFACTURING CAPACITY COULD QUADRUPLE BY 2020
0
20
40
60
80
100
120
GW
h
Li-ion Battery Capacity Expansions by 2020 (GWh)
~75
305230
0
100
200
300
400
2017 GWhWorldwide Li-ion
ProductionCapacity
CapacityAdditions
2020 GWhWorldwide Li-ion
PlannedProduction
Capacity
GW
h
2017 to 2020 Global Li-ion Production Capacity (GWh)
• ~230 GWh of capacity additions are expected from 15-20 battery facilities at a cost of ~US$10 billion*
• BUT it could be even higher e.g. newcomer Energy Absolute recently proposed building a batteryfactory that will be scaled up to 50 GWh by 2020 at a total investment of US$2.9 billion dependent ondemand
Sources: Benchmark Minerals, Lux Research, Bloomberg *Capital spend for some facilities is not available Capital per GWh capacity calculation using Panasonic Dalian 2017 build example – US$40M for ~5 GWh = US$8M per GWh
For
per
sona
l use
onl
y
5
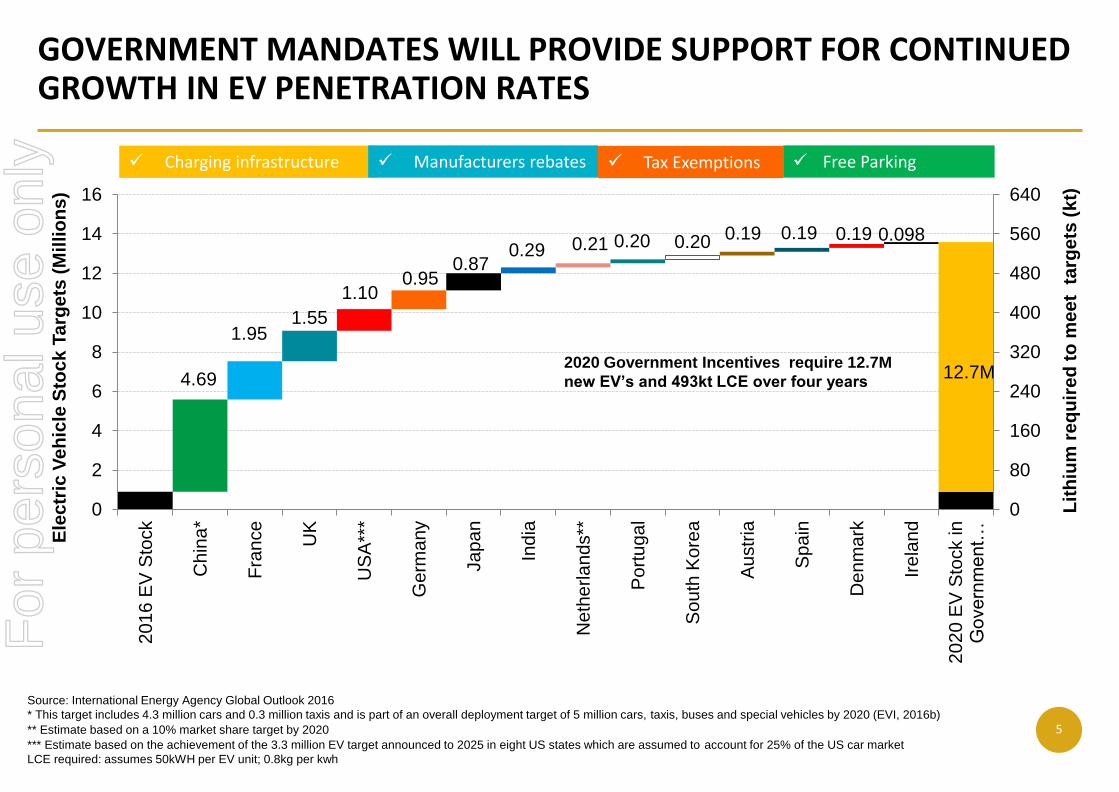
GOVERNMENT MANDATES WILL PROVIDE SUPPORT FOR CONTINUED GROWTH IN EV PENETRATION RATES
4.69
1.951.55
1.100.95
0.870.29 0.21 0.20 0.20 0.19 0.19 0.19 0.098
12.7M
0
80
160
240
320
400
480
560
640
0
2
4
6
8
10
12
14
16
20
16
EV
Sto
ck
Ch
ina
*
Fra
nce
UK
US
A**
*
Ge
rma
ny
Ja
pa
n
India
Ne
the
rla
nd
s**
Po
rtu
ga
l
So
uth
Ko
rea
Au
str
ia
Spain
De
nm
ark
Ire
lan
d
20
20
EV
Sto
ck in
Government…
Lit
hiu
m r
eq
uir
ed
to
me
et
ta
rge
ts (
kt)
Ele
ctr
ic V
eh
icle
Sto
ck
Ta
rge
ts (
Mil
lio
ns
)
2020 Government Incentives require 12.7M
new EV’s and 493kt LCE over four years
Source: International Energy Agency Global Outlook 2016
* This target includes 4.3 million cars and 0.3 million taxis and is part of an overall deployment target of 5 million cars, taxis, buses and special vehicles by 2020 (EVI, 2016b)
** Estimate based on a 10% market share target by 2020
*** Estimate based on the achievement of the 3.3 million EV target announced to 2025 in eight US states which are assumed to account for 25% of the US car market
LCE required: assumes 50kWH per EV unit; 0.8kg per kwh
✓ Charging infrastructure ✓ Manufacturers rebates ✓ Free Parking✓ Tax Exemptions
For
per
sona
l use
onl
y
6
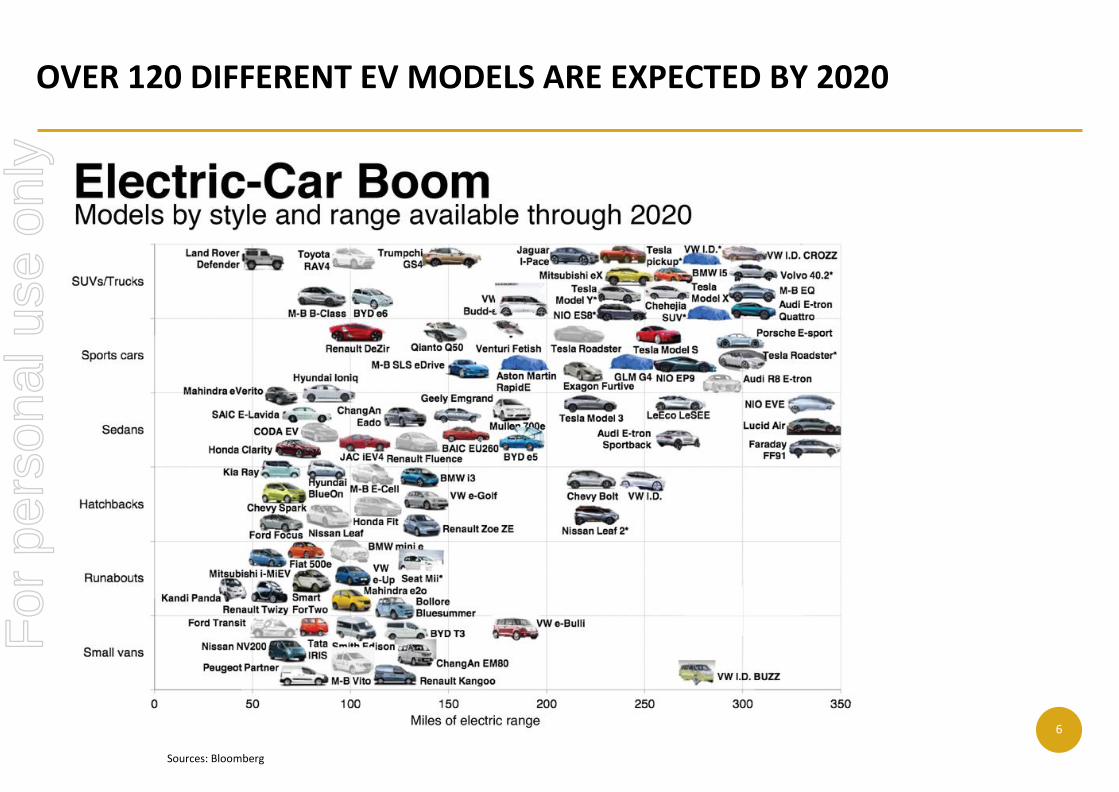
OVER 120 DIFFERENT EV MODELS ARE EXPECTED BY 2020
Sources: Bloomberg
For
per
sona
l use
onl
y
7
2.5%=2.6M
3.5% =3.6M
4.5% =4.7M
0
1
2
3
4
5
2016 2017 2018 2019 2020
Ve
hic
les(
Mill
ion
s)
EV Sales Units (Millions) with various EV Penetration rates
104kt LCE
144kt LCE
186kt LCE
0
50
100
150
200
2016 2017 2018 2019 2020
LCE
ktp
a
Lithium Demand (LCE ktpa) with various EV Penetration rates
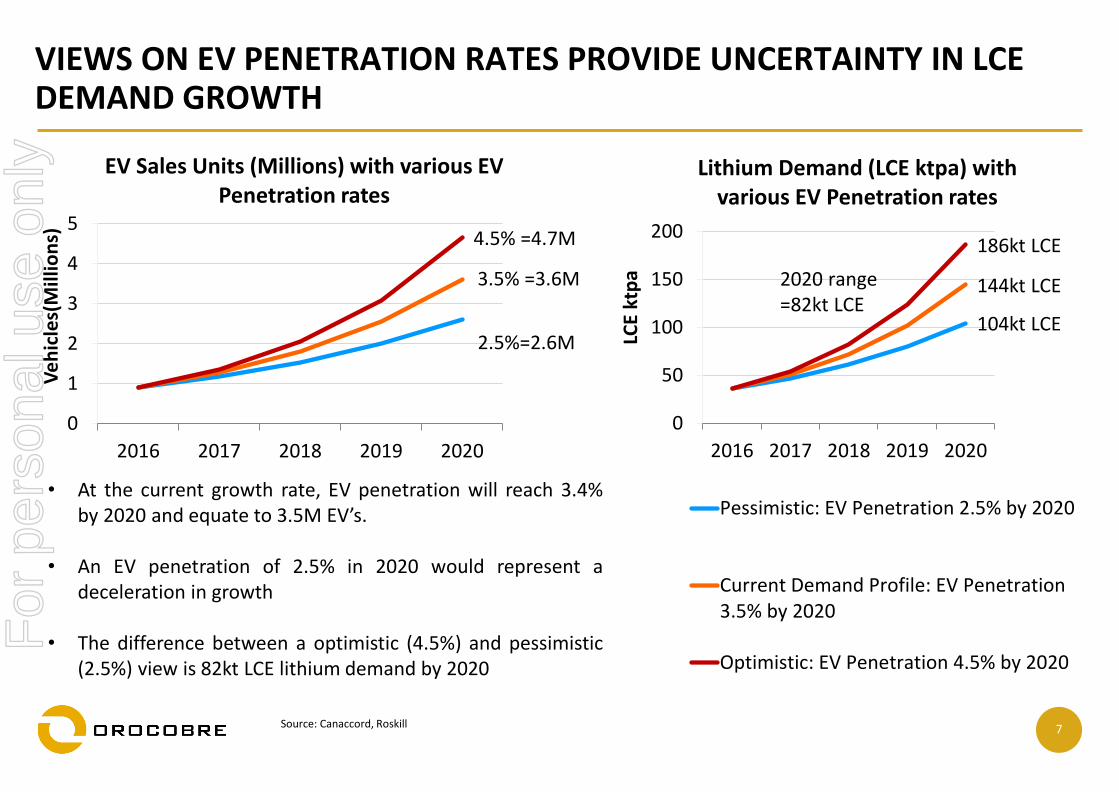
Pessimistic: EV Penetration 2.5% by 2020
Current Demand Profile: EV Penetration3.5% by 2020
Optimistic: EV Penetration 4.5% by 2020
2020 range =82kt LCE
VIEWS ON EV PENETRATION RATES PROVIDE UNCERTAINTY IN LCE DEMAND GROWTH
• At the current growth rate, EV penetration will reach 3.4%by 2020 and equate to 3.5M EV’s.
• An EV penetration of 2.5% in 2020 would represent adeceleration in growth
• The difference between a optimistic (4.5%) and pessimistic(2.5%) view is 82kt LCE lithium demand by 2020
Source: Canaccord, Roskill
For
per
sona
l use
onl
y
8
ANALYSTS FORECAST A RANGE OF OUTCOMES
150kt LCE
74kt LCE
0
20
40
60
80
100
120
140
160
2016 2017 2018 2019 2020
LCE
ktp
a
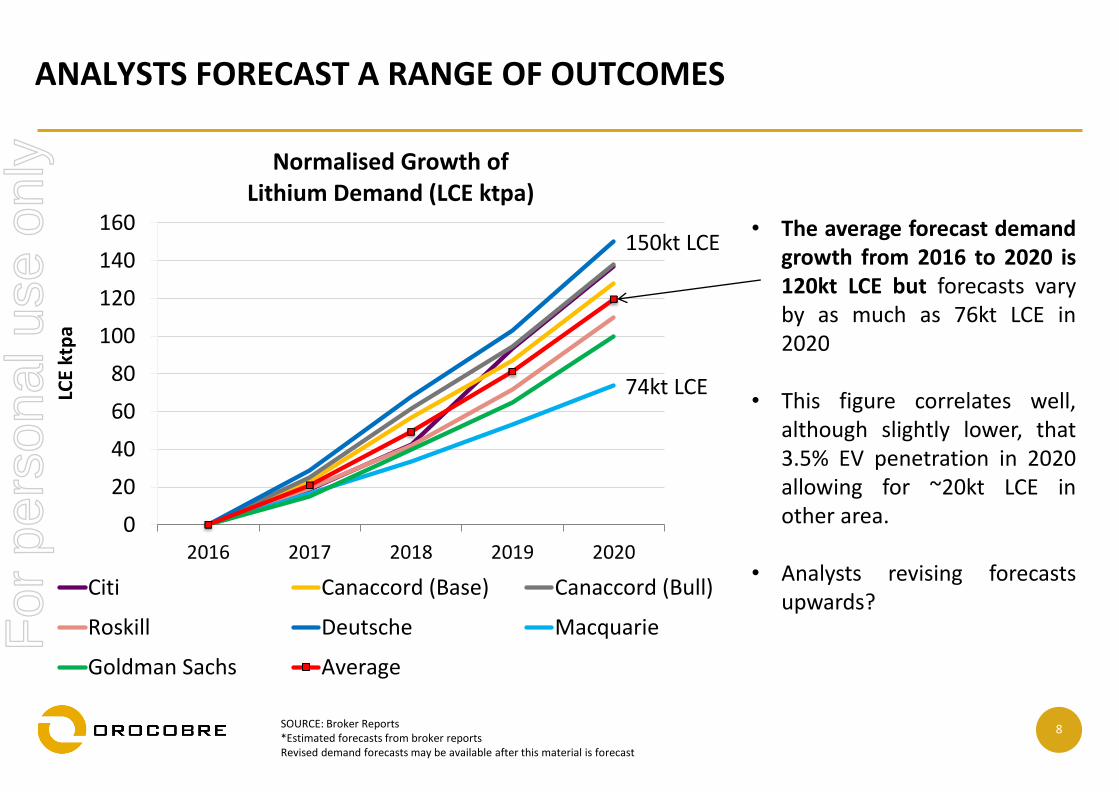
Normalised Growth of Lithium Demand (LCE ktpa)
Citi Canaccord (Base) Canaccord (Bull)
Roskill Deutsche Macquarie
Goldman Sachs Average
SOURCE: Broker Reports*Estimated forecasts from broker reportsRevised demand forecasts may be available after this material is forecast
• The average forecast demandgrowth from 2016 to 2020 is120kt LCE but forecasts varyby as much as 76kt LCE in2020
• This figure correlates well,although slightly lower, that3.5% EV penetration in 2020allowing for ~20kt LCE inother area.
• Analysts revising forecastsupwards?
For
per
sona
l use
onl
y
9
WILL WE HAVE SUFFICIENT BATTERY CAPACITY?
0
50
100
150
200
250
300
350
2017 2018 2019 2020
GW
h
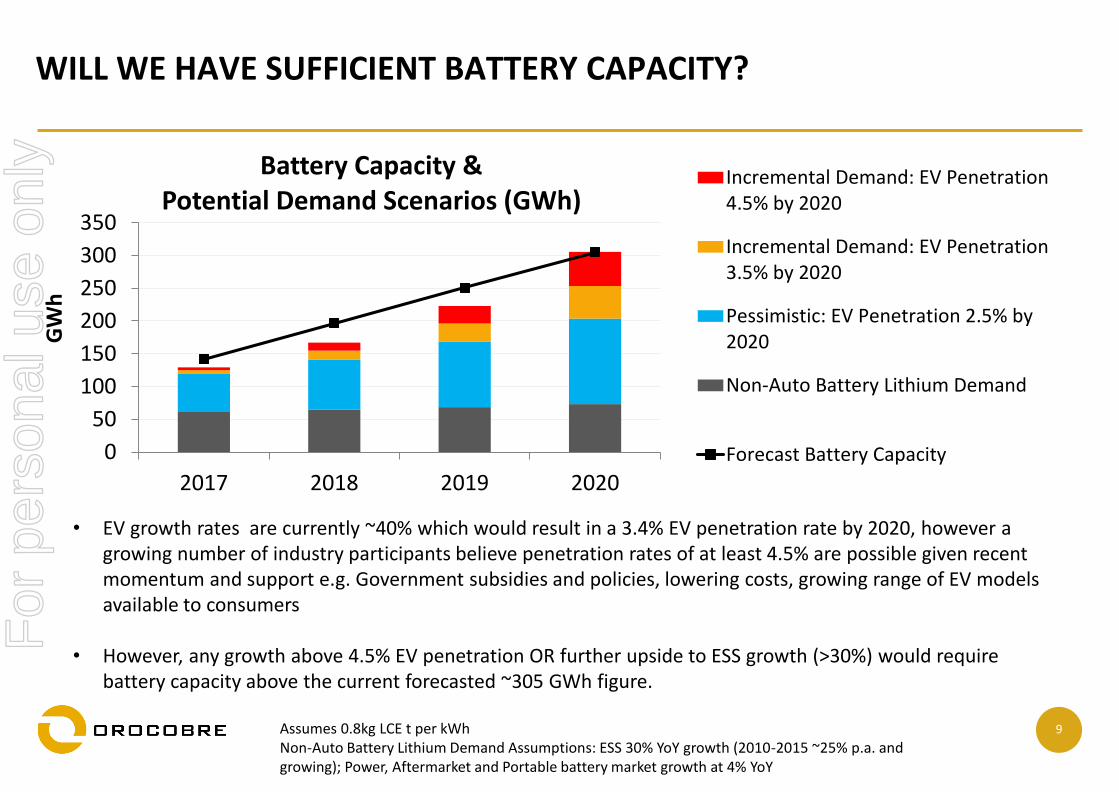
Battery Capacity & Potential Demand Scenarios (GWh)
Incremental Demand: EV Penetration4.5% by 2020
Incremental Demand: EV Penetration3.5% by 2020
Pessimistic: EV Penetration 2.5% by2020
Non-Auto Battery Lithium Demand
Forecast Battery Capacity
• EV growth rates are currently ~40% which would result in a 3.4% EV penetration rate by 2020, however a growing number of industry participants believe penetration rates of at least 4.5% are possible given recent momentum and support e.g. Government subsidies and policies, lowering costs, growing range of EV models available to consumers
• However, any growth above 4.5% EV penetration OR further upside to ESS growth (>30%) would require battery capacity above the current forecasted ~305 GWh figure.
Assumes 0.8kg LCE t per kWhNon-Auto Battery Lithium Demand Assumptions: ESS 30% YoY growth (2010-2015 ~25% p.a. and growing); Power, Aftermarket and Portable battery market growth at 4% YoY
For
per
sona
l use
onl
y
10
SUPPLY
For
per
sona
l use
onl
y
11
0%
40%
80%
120%
0
10
20
30
20
06
20
07
20
08
20
09
20
10
20
11
20
12
20
13
20
14
20
15
20
16
LCE
ktp
a
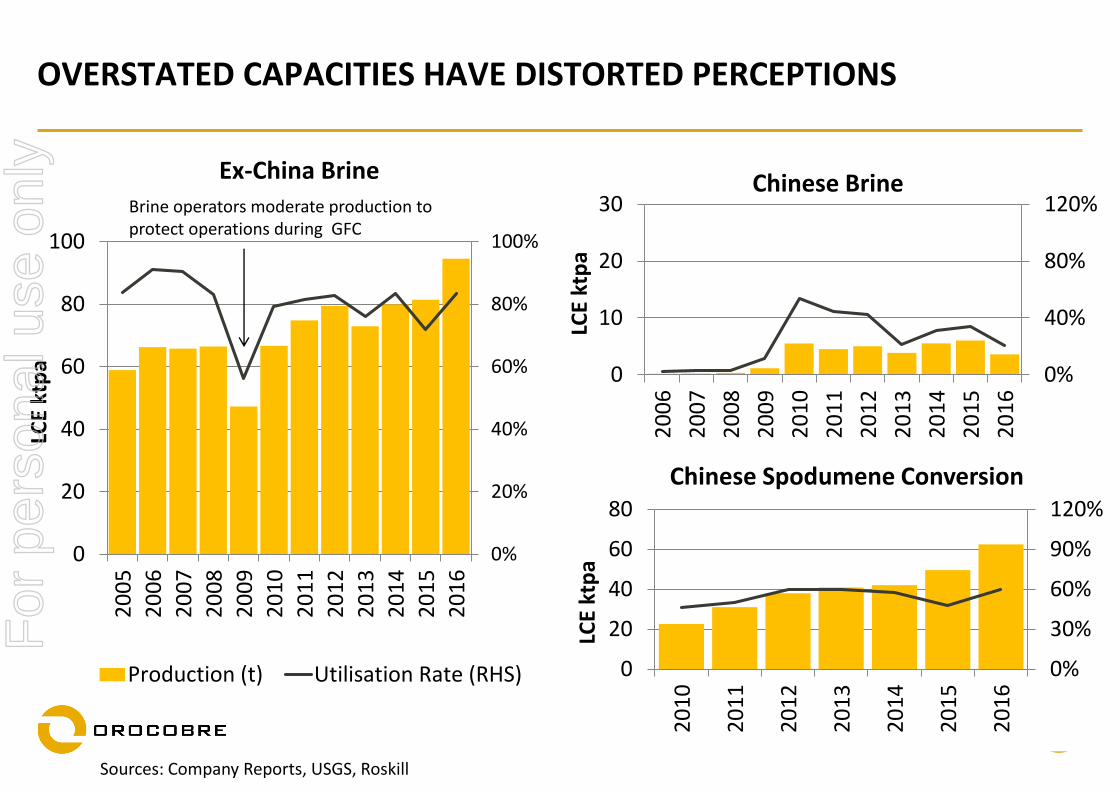
Chinese Brine
0%
20%
40%
60%
80%
100%
0
20
40
60
80
100
20
05
20
06
20
07
20
08
20
09
20
10
20
11
20
12
20
13
20
14
20
15
20
16
LCE
ktp
a
Ex-China Brine
Production (t) Utilisation Rate (RHS)
OVERSTATED CAPACITIES HAVE DISTORTED PERCEPTIONS
Sources: Company Reports, USGS, Roskill
Brine operators moderate production to protect operations during GFC
0%
30%
60%
90%
120%
0
20
40
60
80
20
10
20
11
20
12
20
13
20
14
20
15
20
16
LCE
ktp
a
Chinese Spodumene Conversion
For
per
sona
l use
onl
y
12
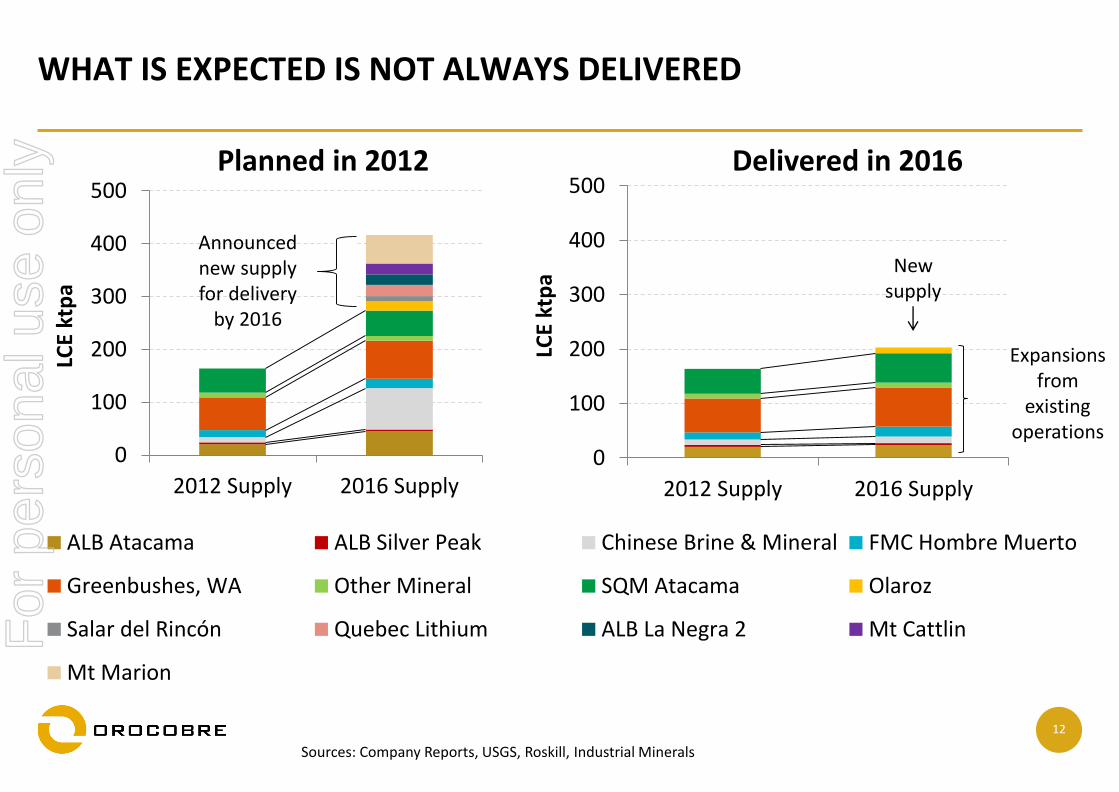
WHAT IS EXPECTED IS NOT ALWAYS DELIVERED
Sources: Company Reports, USGS, Roskill, Industrial Minerals
0
100
200
300
400
500
2012 Supply 2016 Supply
LCE
ktp
a
ALB Atacama ALB Silver Peak Chinese Brine & Mineral FMC Hombre Muerto
Greenbushes, WA Other Mineral SQM Atacama Olaroz
Salar del Rincón Quebec Lithium ALB La Negra 2 Mt Cattlin
Mt Marion
0
100
200
300
400
500
2012 Supply 2016 Supply
LCE
ktp
a
Planned in 2012 Delivered in 2016
Expansions from
existing operations
New supply
Announced new supply for delivery
by 2016
For
per
sona
l use
onl
y
13
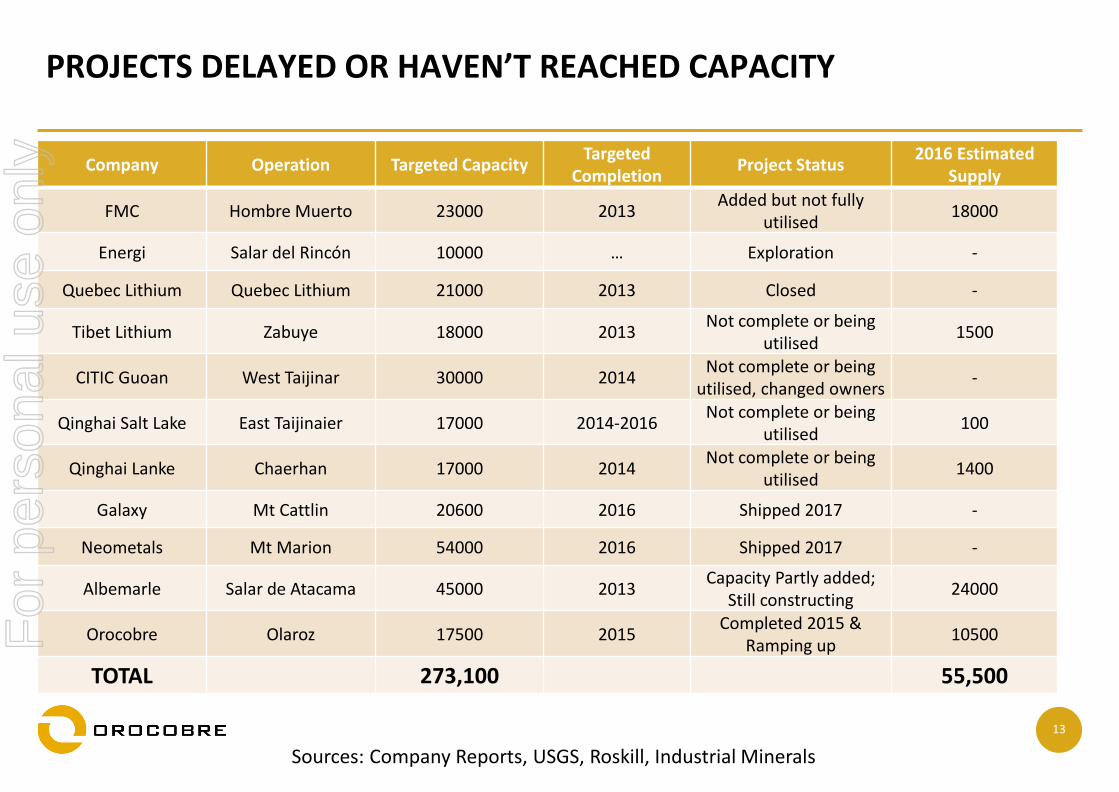
PROJECTS DELAYED OR HAVEN’T REACHED CAPACITY
Company Operation Targeted CapacityTargeted
CompletionProject Status
2016 Estimated Supply
FMC Hombre Muerto 23000 2013Added but not fully
utilised18000
Energi Salar del Rincón 10000 … Exploration -
Quebec Lithium Quebec Lithium 21000 2013 Closed -
Tibet Lithium Zabuye 18000 2013Not complete or being
utilised1500
CITIC Guoan West Taijinar 30000 2014Not complete or being
utilised, changed owners-
Qinghai Salt Lake East Taijinaier 17000 2014-2016Not complete or being
utilised100
Qinghai Lanke Chaerhan 17000 2014Not complete or being
utilised1400
Galaxy Mt Cattlin 20600 2016 Shipped 2017 -
Neometals Mt Marion 54000 2016 Shipped 2017 -
Albemarle Salar de Atacama 45000 2013Capacity Partly added;
Still constructing24000
Orocobre Olaroz 17500 2015Completed 2015 &
Ramping up10500
TOTAL 273,100 55,500
Sources: Company Reports, USGS, Roskill, Industrial Minerals
For
per
sona
l use
onl
y
14
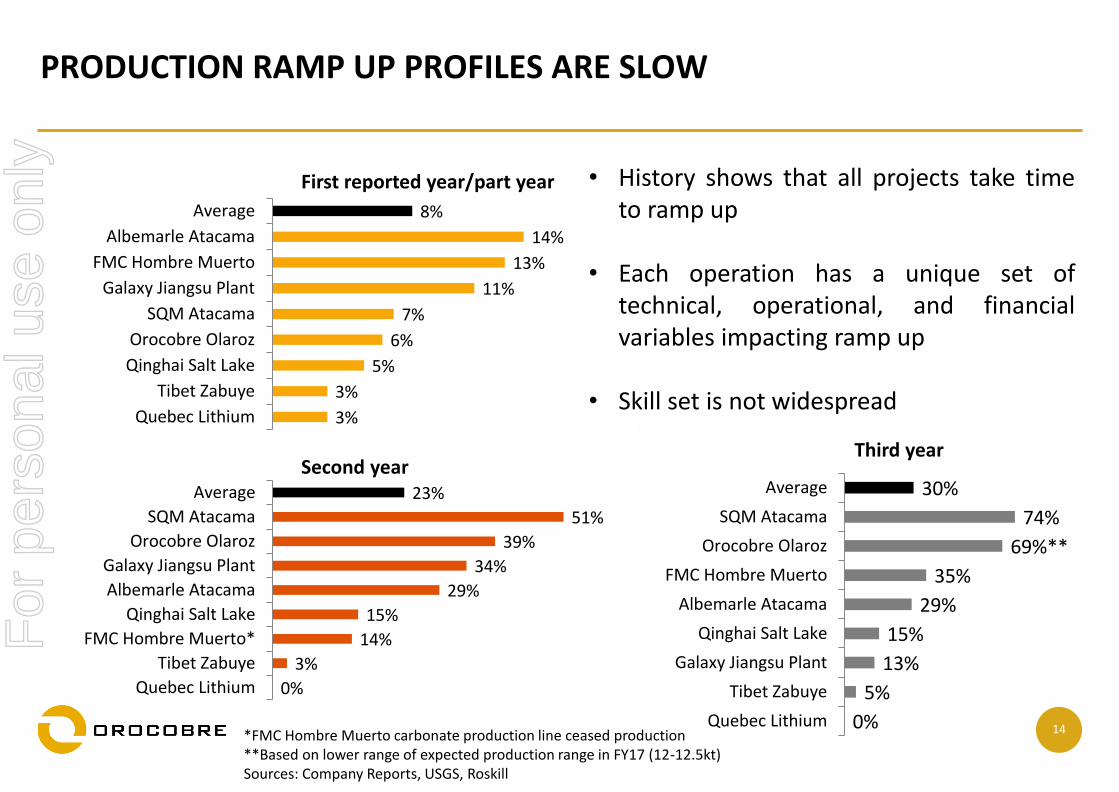
PRODUCTION RAMP UP PROFILES ARE SLOW
3%
3%
5%
6%
7%
11%
13%
14%
8%
Quebec Lithium
Tibet Zabuye
Qinghai Salt Lake
Orocobre Olaroz
SQM Atacama
Galaxy Jiangsu Plant
FMC Hombre Muerto
Albemarle Atacama
Average
*FMC Hombre Muerto carbonate production line ceased production**Based on lower range of expected production range in FY17 (12-12.5kt)Sources: Company Reports, USGS, Roskill
0%
5%
13%
15%
29%
35%
69%**
74%
30%
Quebec Lithium
Tibet Zabuye
Galaxy Jiangsu Plant
Qinghai Salt Lake
Albemarle Atacama
FMC Hombre Muerto
Orocobre Olaroz
SQM Atacama
Average
0%
3%
14%
15%
29%
34%
39%
51%
23%
Quebec Lithium
Tibet Zabuye
FMC Hombre Muerto*
Qinghai Salt Lake
Albemarle Atacama
Galaxy Jiangsu Plant
Orocobre Olaroz
SQM Atacama
Average
First reported year/part year
Second yearThird year
• History shows that all projects take timeto ramp up
• Each operation has a unique set oftechnical, operational, and financialvariables impacting ramp up
• Skill set is not widespread
For
per
sona
l use
onl
y
15
SUPPLY DEMAND BALANCE
For
per
sona
l use
onl
y
16
0
50
100
150
200
250
300
350
400
450
2016 2017F 2018F 2019F 2020F
Tho
usa
nd
s
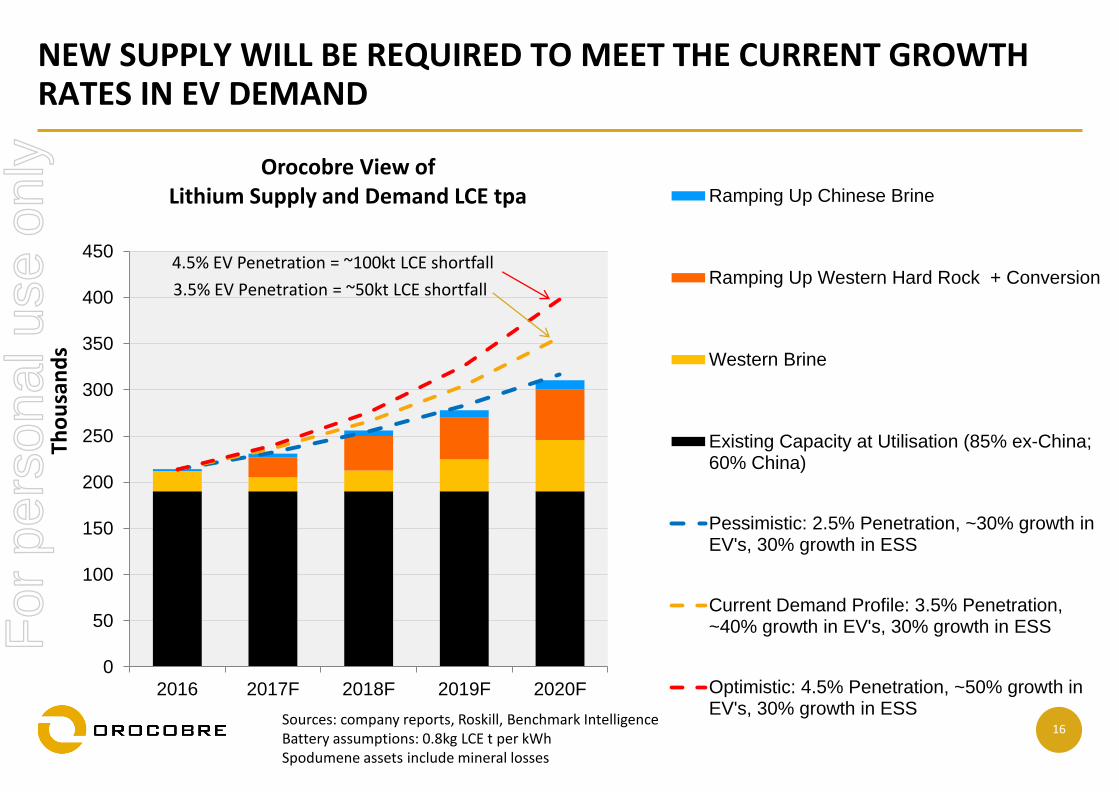
Orocobre View of Lithium Supply and Demand LCE tpa Ramping Up Chinese Brine
Ramping Up Western Hard Rock + Conversion
Western Brine
Existing Capacity at Utilisation (85% ex-China;60% China)
Pessimistic: 2.5% Penetration, ~30% growth inEV's, 30% growth in ESS
Current Demand Profile: 3.5% Penetration,~40% growth in EV's, 30% growth in ESS
Optimistic: 4.5% Penetration, ~50% growth inEV's, 30% growth in ESS
3.5% EV Penetration = ~50kt LCE shortfall
NEW SUPPLY WILL BE REQUIRED TO MEET THE CURRENT GROWTH RATES IN EV DEMAND
Sources: company reports, Roskill, Benchmark Intelligence Battery assumptions: 0.8kg LCE t per kWhSpodumene assets include mineral losses
4.5% EV Penetration = ~100kt LCE shortfall
For
per
sona
l use
onl
y

17
PARTNERSHIPS & CONSOLIDATION
For
per
sona
l use
onl
y
18
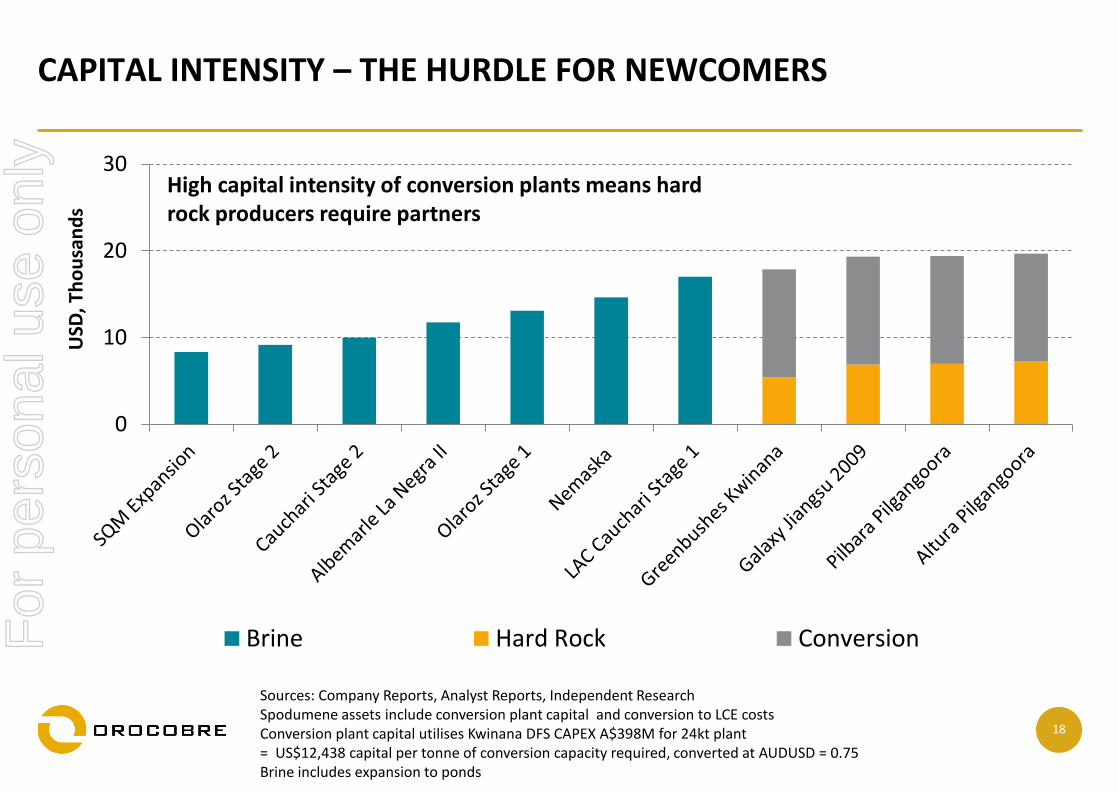
CAPITAL INTENSITY – THE HURDLE FOR NEWCOMERS
Sources: Company Reports, Analyst Reports, Independent ResearchSpodumene assets include conversion plant capital and conversion to LCE costsConversion plant capital utilises Kwinana DFS CAPEX A$398M for 24kt plant = US$12,438 capital per tonne of conversion capacity required, converted at AUDUSD = 0.75Brine includes expansion to ponds
0
10
20
30
USD
, Th
ou
san
ds
Brine Hard Rock Conversion
High capital intensity of conversion plants means hard rock producers require partners
For
per
sona
l use
onl
y
19
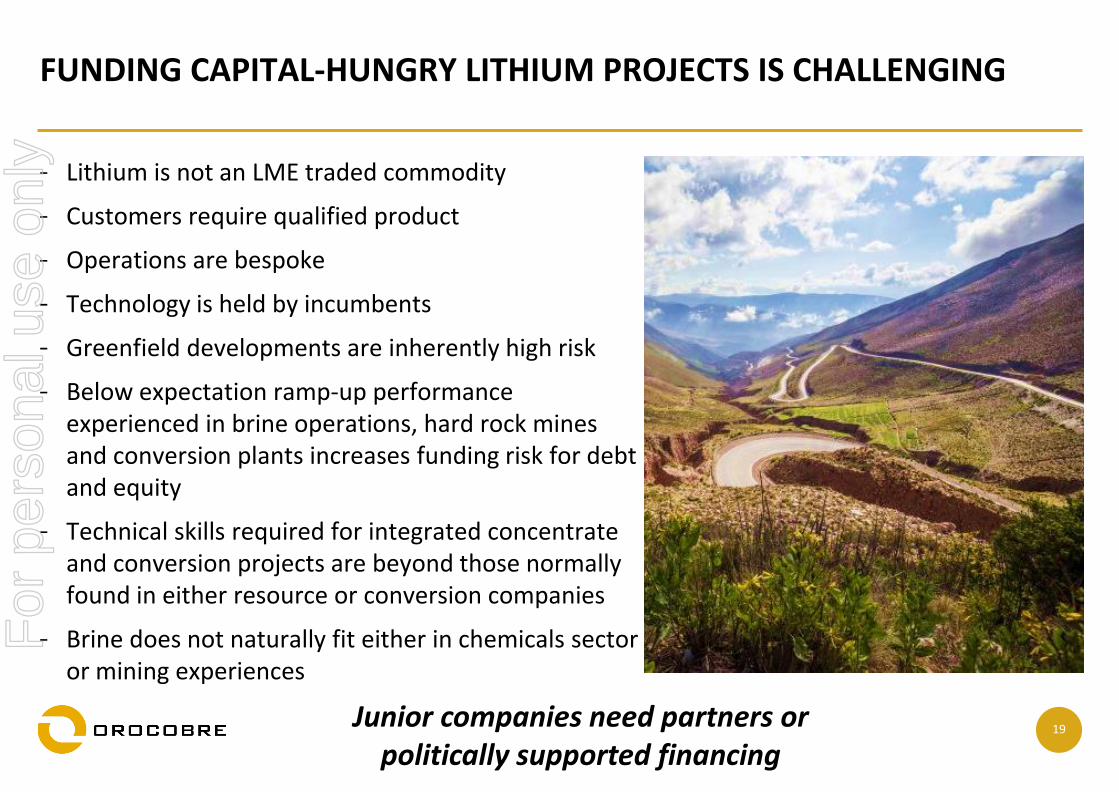
FUNDING CAPITAL-HUNGRY LITHIUM PROJECTS IS CHALLENGING
- Lithium is not an LME traded commodity
- Customers require qualified product
- Operations are bespoke
- Technology is held by incumbents
- Greenfield developments are inherently high risk
- Below expectation ramp-up performance experienced in brine operations, hard rock mines and conversion plants increases funding risk for debt and equity
- Technical skills required for integrated concentrate and conversion projects are beyond those normally found in either resource or conversion companies
- Brine does not naturally fit either in chemicals sector or mining experiences
Junior companies need partners or politically supported financing
For
per
sona
l use
onl
y
20
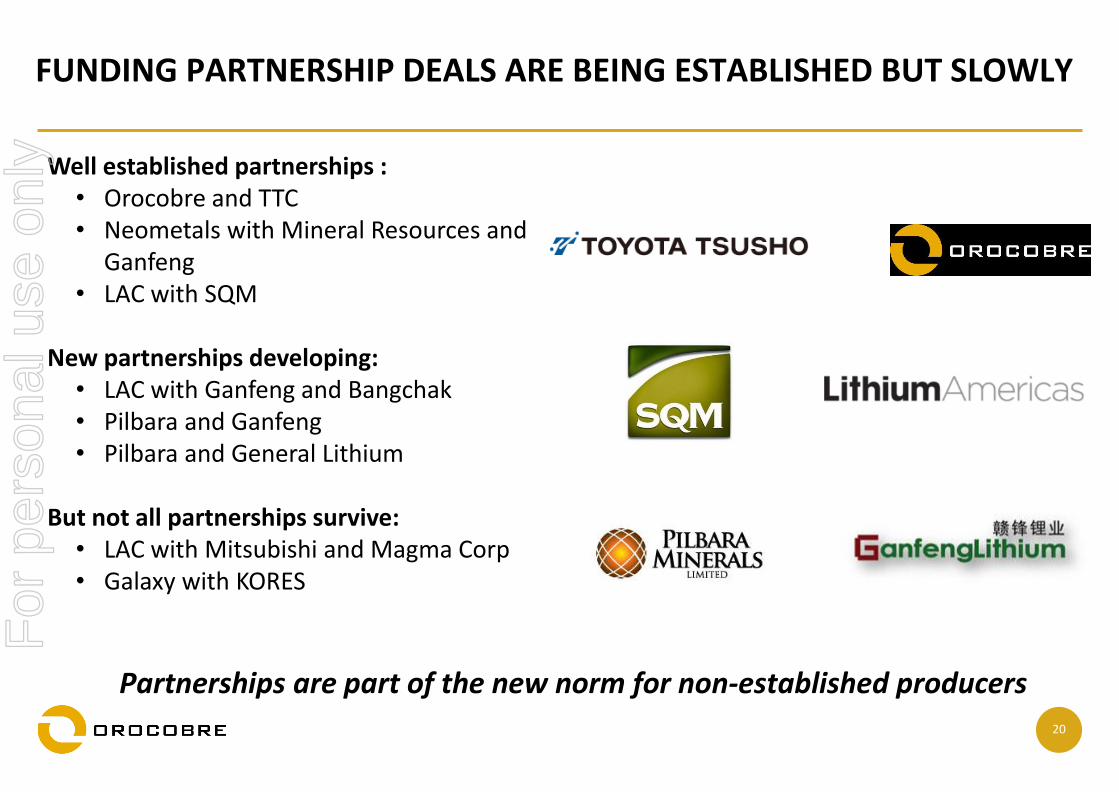
FUNDING PARTNERSHIP DEALS ARE BEING ESTABLISHED BUT SLOWLY
Well established partnerships :• Orocobre and TTC• Neometals with Mineral Resources and
Ganfeng• LAC with SQM
New partnerships developing:• LAC with Ganfeng and Bangchak• Pilbara and Ganfeng• Pilbara and General Lithium
But not all partnerships survive:• LAC with Mitsubishi and Magma Corp• Galaxy with KORES
Partnerships are part of the new norm for non-established producers
For
per
sona
l use
onl
y

21
EXPANSION ASPIRATIONS
For
per
sona
l use
onl
y
22
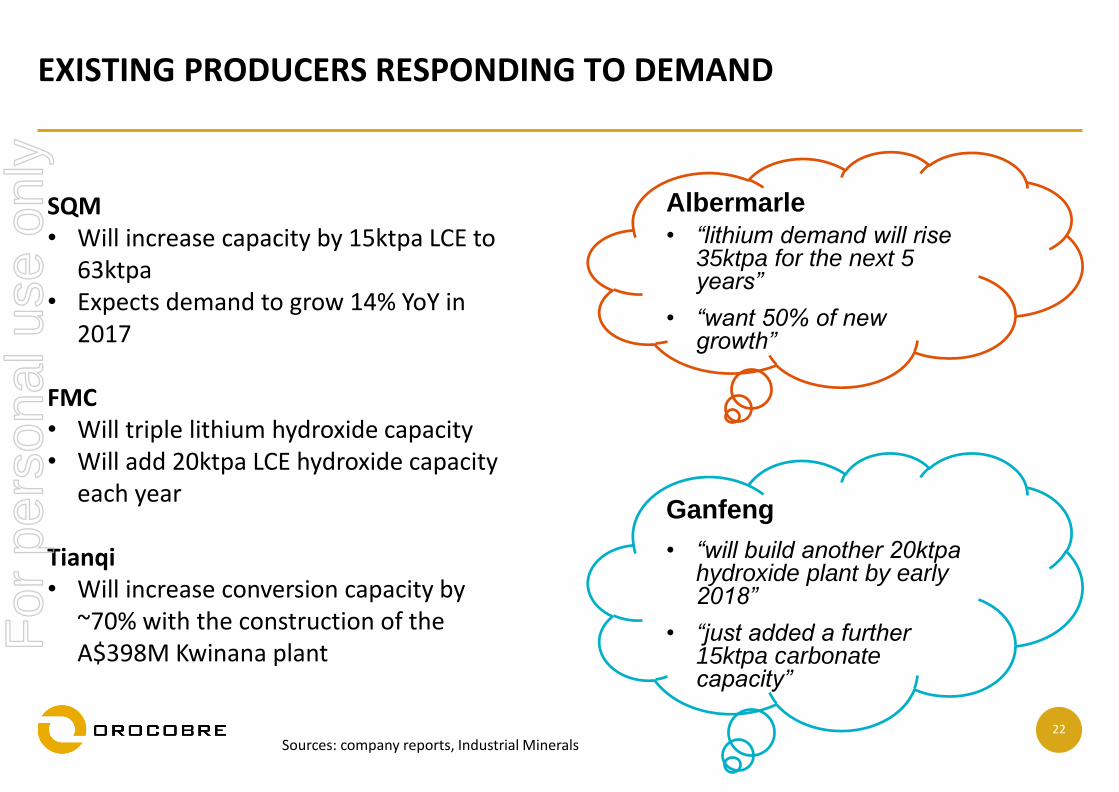
EXISTING PRODUCERS RESPONDING TO DEMAND
SQM• Will increase capacity by 15ktpa LCE to
63ktpa• Expects demand to grow 14% YoY in
2017
FMC• Will triple lithium hydroxide capacity • Will add 20ktpa LCE hydroxide capacity
each year
Tianqi• Will increase conversion capacity by
~70% with the construction of the A$398M Kwinana plant
Sources: company reports, Industrial Minerals
Albermarle
• “lithium demand will rise 35ktpa for the next 5 years”
• “want 50% of new growth”
Ganfeng
• “will build another 20ktpa hydroxide plant by early 2018”
• “just added a further 15ktpa carbonate capacity”
For
per
sona
l use
onl
y
23
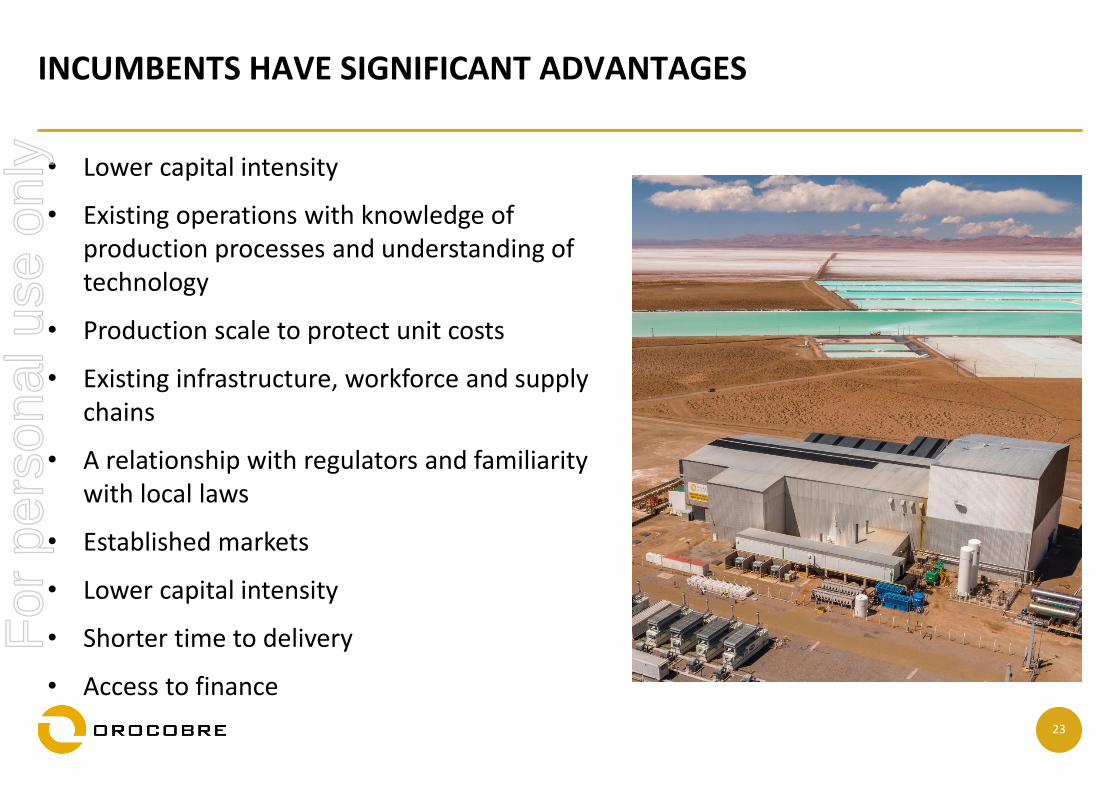
INCUMBENTS HAVE SIGNIFICANT ADVANTAGES
• Lower capital intensity
• Existing operations with knowledge of production processes and understanding of technology
• Production scale to protect unit costs
• Existing infrastructure, workforce and supply chains
• A relationship with regulators and familiarity with local laws
• Established markets
• Lower capital intensity
• Shorter time to delivery
• Access to finance
For
per
sona
l use
onl
y
24
CONCLUSIONS
For
per
sona
l use
onl
y
25
SUMMARY
• Strong growth in demand but uncertainty on how strong
• New developments are needed to meet >2.5% EV penetration in 2020
• There are projects in the pipeline but supply response will be slower than
desired
• Financing projects is challenging and juniors need partners
• Established producers rising to the challenge but response will take time
• Market conditions to stay tight, if not undersupplied, to 2020
For
per
sona
l use
onl
y

26
KEY CONCERNS FOR THE LITHIUM INDUSTRY TO THE END OF THE DECADELITHIUM SUPPLY & MARKETS CONFERENCE MONTREAL, CANADA
31 MAY 2017
For
per
sona
l use
onl
y