Embed Size (px)
Citation preview
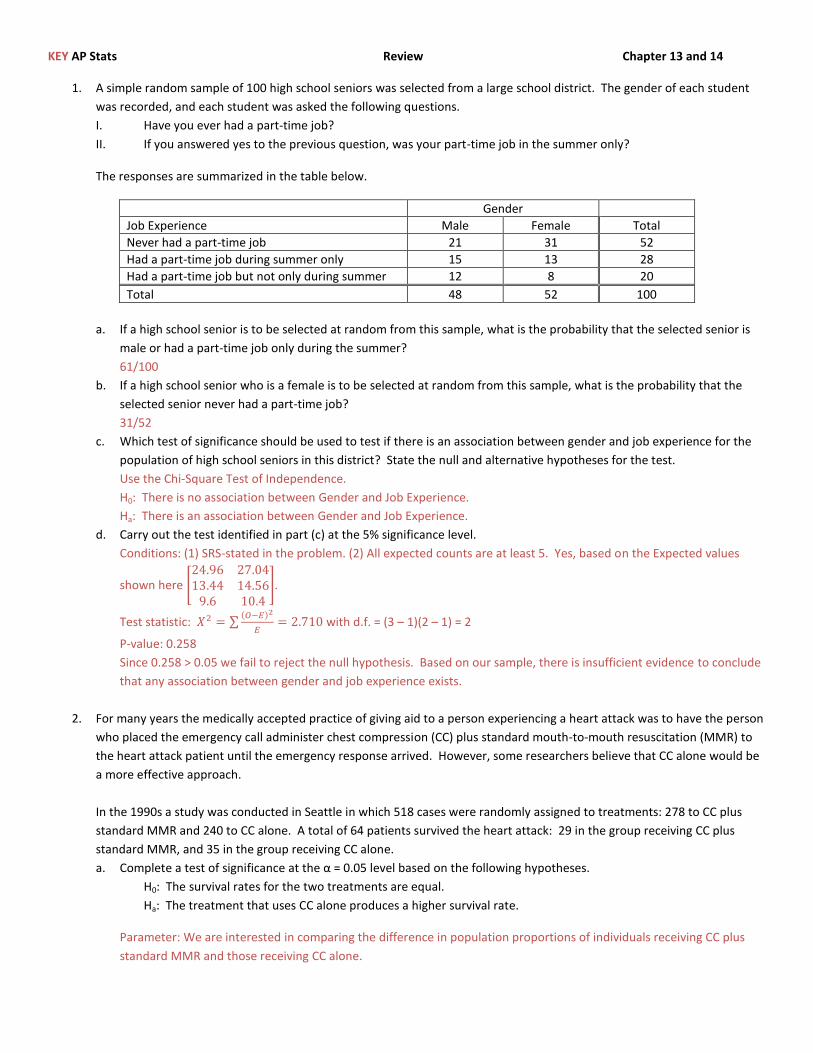
KEY AP Stats Review Chapter 13 and 14
1. A simple random sample of 100 high school seniors was selected from a large school district. The gender of each student
was recorded, and each student was asked the following questions.
I. Have you ever had a part-time job?
II. If you answered yes to the previous question, was your part-time job in the summer only?
The responses are summarized in the table below.
Gender
Job Experience Male Female Total
Never had a part-time job 21 31 52
Had a part-time job during summer only 15 13 28
Had a part-time job but not only during summer 12 8 20
Total 48 52 100
a. If a high school senior is to be selected at random from this sample, what is the probability that the selected senior is
male or had a part-time job only during the summer?
61/100
b. If a high school senior who is a female is to be selected at random from this sample, what is the probability that the
selected senior never had a part-time job?
31/52
c. Which test of significance should be used to test if there is an association between gender and job experience for the
population of high school seniors in this district? State the null and alternative hypotheses for the test.
Use the Chi-Square Test of Independence.
H0: There is no association between Gender and Job Experience.
Ha: There is an association between Gender and Job Experience.
d. Carry out the test identified in part (c) at the 5% significance level.
Conditions: (1) SRS-stated in the problem. (2) All expected counts are at least 5. Yes, based on the Expected values
shown here [
].
Test statistic: ∑( )
with d.f. = (3 – 1)(2 – 1) = 2
P-value: 0.258
Since 0.258 > 0.05 we fail to reject the null hypothesis. Based on our sample, there is insufficient evidence to conclude
that any association between gender and job experience exists.
2. For many years the medically accepted practice of giving aid to a person experiencing a heart attack was to have the person
who placed the emergency call administer chest compression (CC) plus standard mouth-to-mouth resuscitation (MMR) to
the heart attack patient until the emergency response arrived. However, some researchers believe that CC alone would be
a more effective approach.
In the 1990s a study was conducted in Seattle in which 518 cases were randomly assigned to treatments: 278 to CC plus
standard MMR and 240 to CC alone. A total of 64 patients survived the heart attack: 29 in the group receiving CC plus
standard MMR, and 35 in the group receiving CC alone.
a. Complete a test of significance at the α = 0.05 level based on the following hypotheses.
H0: The survival rates for the two treatments are equal.
Ha: The treatment that uses CC alone produces a higher survival rate.
Parameter: We are interested in comparing the difference in population proportions of individuals receiving CC plus
standard MMR and those receiving CC alone.
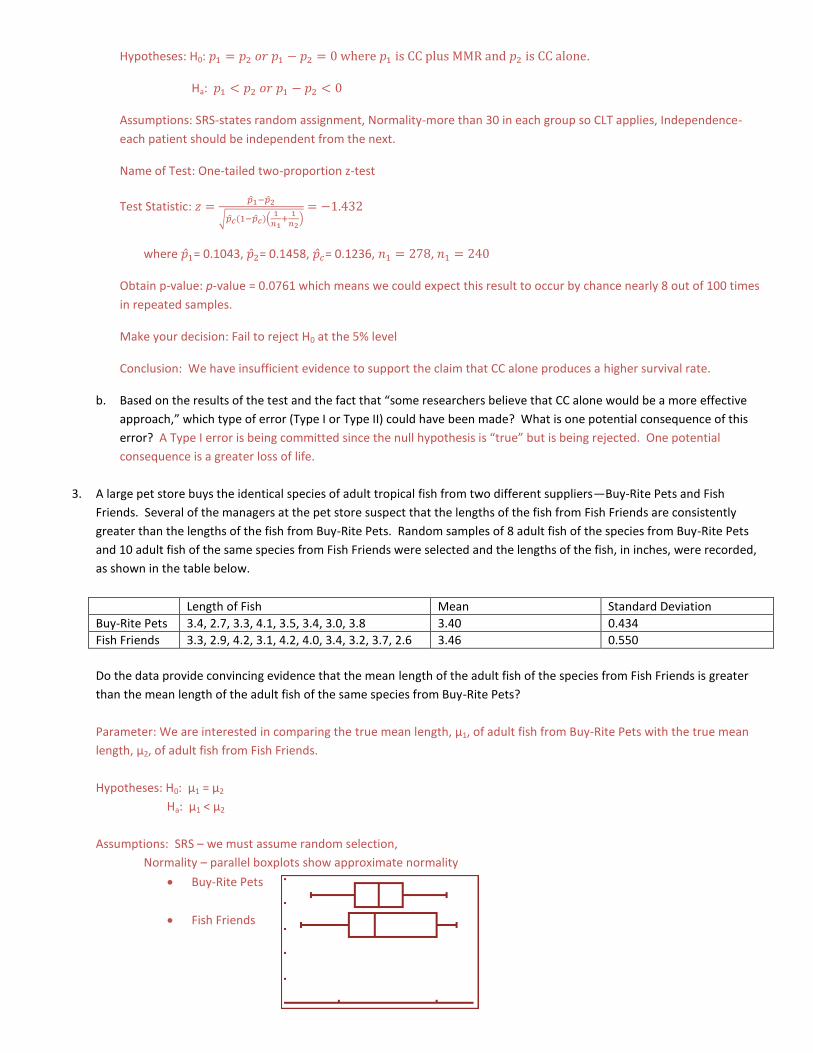
Hypotheses: H0: .
Ha:
Assumptions: SRS-states random assignment, Normality-more than 30 in each group so CLT applies, Independence-
each patient should be independent from the next.
Name of Test: One-tailed two-proportion z-test
Test Statistic: ̂ ̂
√ ̂ ( ̂ )(
)
where ̂ = 0.1043, ̂ = 0.1458, ̂ = 0.1236, ,
Obtain p-value: p-value = 0.0761 which means we could expect this result to occur by chance nearly 8 out of 100 times
in repeated samples.
Make your decision: Fail to reject H0 at the 5% level
Conclusion: We have insufficient evidence to support the claim that CC alone produces a higher survival rate.
b. Based on the results of the test and the fact that “some researchers believe that CC alone would be a more effective
approach,” which type of error (Type I or Type II) could have been made? What is one potential consequence of this
error? A Type I error is being committed since the null hypothesis is “true” but is being rejected. One potential
consequence is a greater loss of life.
3. A large pet store buys the identical species of adult tropical fish from two different suppliers—Buy-Rite Pets and Fish
Friends. Several of the managers at the pet store suspect that the lengths of the fish from Fish Friends are consistently
greater than the lengths of the fish from Buy-Rite Pets. Random samples of 8 adult fish of the species from Buy-Rite Pets
and 10 adult fish of the same species from Fish Friends were selected and the lengths of the fish, in inches, were recorded,
as shown in the table below.
Length of Fish Mean Standard Deviation
Buy-Rite Pets 3.4, 2.7, 3.3, 4.1, 3.5, 3.4, 3.0, 3.8 3.40 0.434
Fish Friends 3.3, 2.9, 4.2, 3.1, 4.2, 4.0, 3.4, 3.2, 3.7, 2.6 3.46 0.550
Do the data provide convincing evidence that the mean length of the adult fish of the species from Fish Friends is greater
than the mean length of the adult fish of the same species from Buy-Rite Pets?
Parameter: We are interested in comparing the true mean length, µ1, of adult fish from Buy-Rite Pets with the true mean
length, µ2, of adult fish from Fish Friends.
Hypotheses: H0: µ1 = µ2
Ha: µ1 < µ2
Assumptions: SRS – we must assume random selection,
Normality – parallel boxplots show approximate normality
Buy-Rite Pets
Fish Friends
Independence – the population of fish at Buy-Rite Pets is likely to be at least 10(8) or 80, and the population of fish
at Fish Friends is likely to be at least 10(10) or 100.
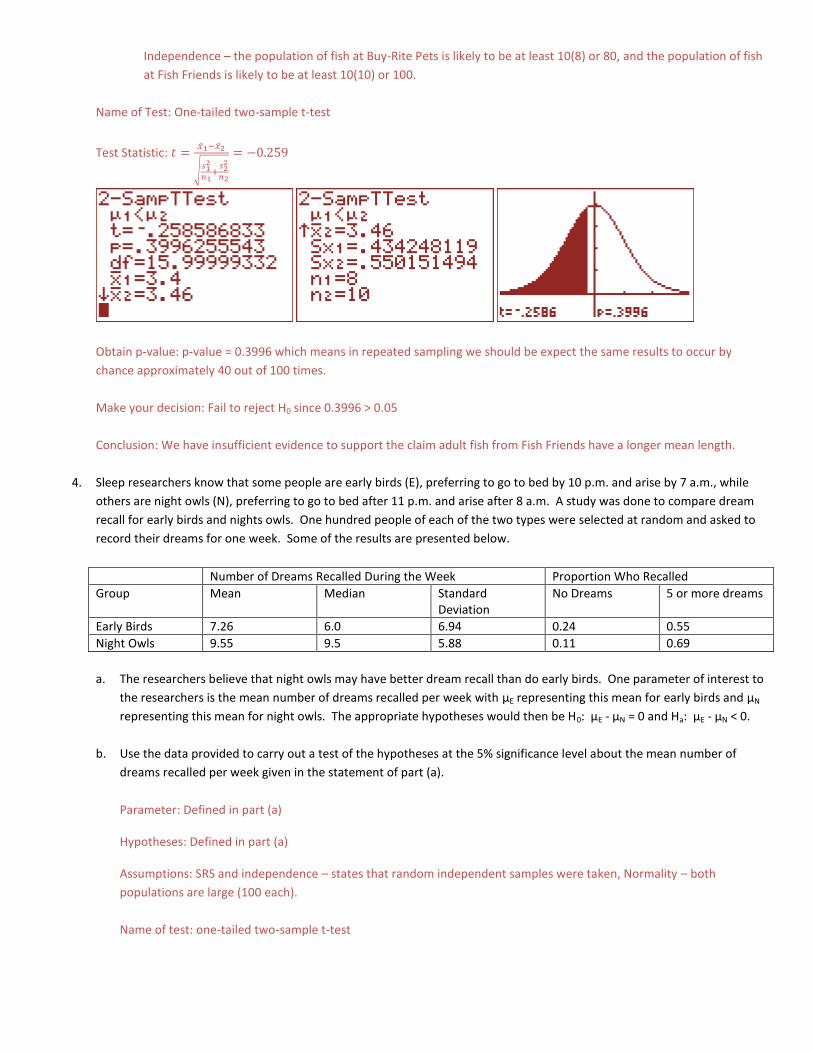
Name of Test: One-tailed two-sample t-test
Test Statistic: ̅ ̅
√
Obtain p-value: p-value = 0.3996 which means in repeated sampling we should be expect the same results to occur by
chance approximately 40 out of 100 times.
Make your decision: Fail to reject H0 since 0.3996 > 0.05
Conclusion: We have insufficient evidence to support the claim adult fish from Fish Friends have a longer mean length.
4. Sleep researchers know that some people are early birds (E), preferring to go to bed by 10 p.m. and arise by 7 a.m., while
others are night owls (N), preferring to go to bed after 11 p.m. and arise after 8 a.m. A study was done to compare dream
recall for early birds and nights owls. One hundred people of each of the two types were selected at random and asked to
record their dreams for one week. Some of the results are presented below.
Number of Dreams Recalled During the Week Proportion Who Recalled
Group Mean Median Standard Deviation
No Dreams 5 or more dreams
Early Birds 7.26 6.0 6.94 0.24 0.55
Night Owls 9.55 9.5 5.88 0.11 0.69
a. The researchers believe that night owls may have better dream recall than do early birds. One parameter of interest to
the researchers is the mean number of dreams recalled per week with µE representing this mean for early birds and µN
representing this mean for night owls. The appropriate hypotheses would then be H0: µE - µN = 0 and Ha: µE - µN < 0.
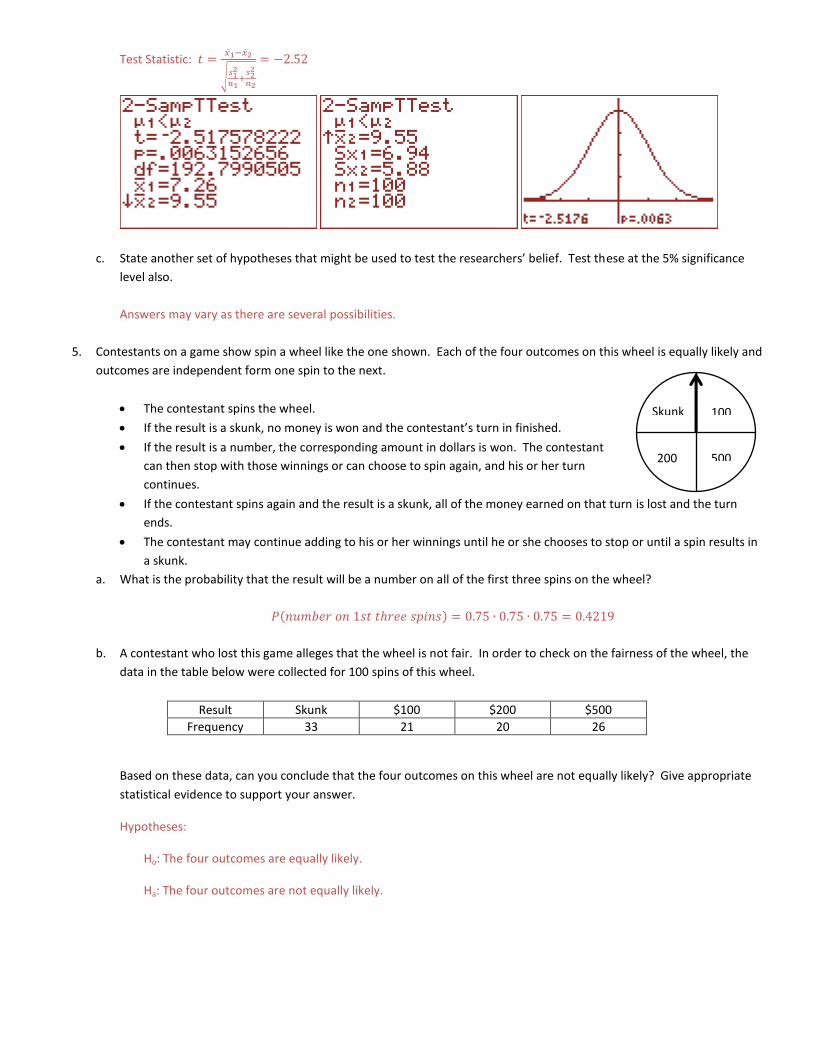
b. Use the data provided to carry out a test of the hypotheses at the 5% significance level about the mean number of
dreams recalled per week given in the statement of part (a).
Parameter: Defined in part (a)
Hypotheses: Defined in part (a)
Assumptions: SRS and independence – states that random independent samples were taken, Normality – both
populations are large (100 each).
Name of test: one-tailed two-sample t-test
Skunk 100
200 500
Test Statistic: ̅ ̅
√
c. State another set of hypotheses that might be used to test the researchers’ belief. Test these at the 5% significance
level also.
Answers may vary as there are several possibilities.
5. Contestants on a game show spin a wheel like the one shown. Each of the four outcomes on this wheel is equally likely and
outcomes are independent form one spin to the next.
The contestant spins the wheel.
If the result is a skunk, no money is won and the contestant’s turn in finished.
If the result is a number, the corresponding amount in dollars is won. The contestant
can then stop with those winnings or can choose to spin again, and his or her turn
continues.
If the contestant spins again and the result is a skunk, all of the money earned on that turn is lost and the turn
ends.
The contestant may continue adding to his or her winnings until he or she chooses to stop or until a spin results in
a skunk.
a. What is the probability that the result will be a number on all of the first three spins on the wheel?
( )
b. A contestant who lost this game alleges that the wheel is not fair. In order to check on the fairness of the wheel, the
data in the table below were collected for 100 spins of this wheel.
Result Skunk $100 $200 $500
Frequency 33 21 20 26
Based on these data, can you conclude that the four outcomes on this wheel are not equally likely? Give appropriate
statistical evidence to support your answer.
Hypotheses:
Ho: The four outcomes are equally likely.
Ha: The four outcomes are not equally likely.
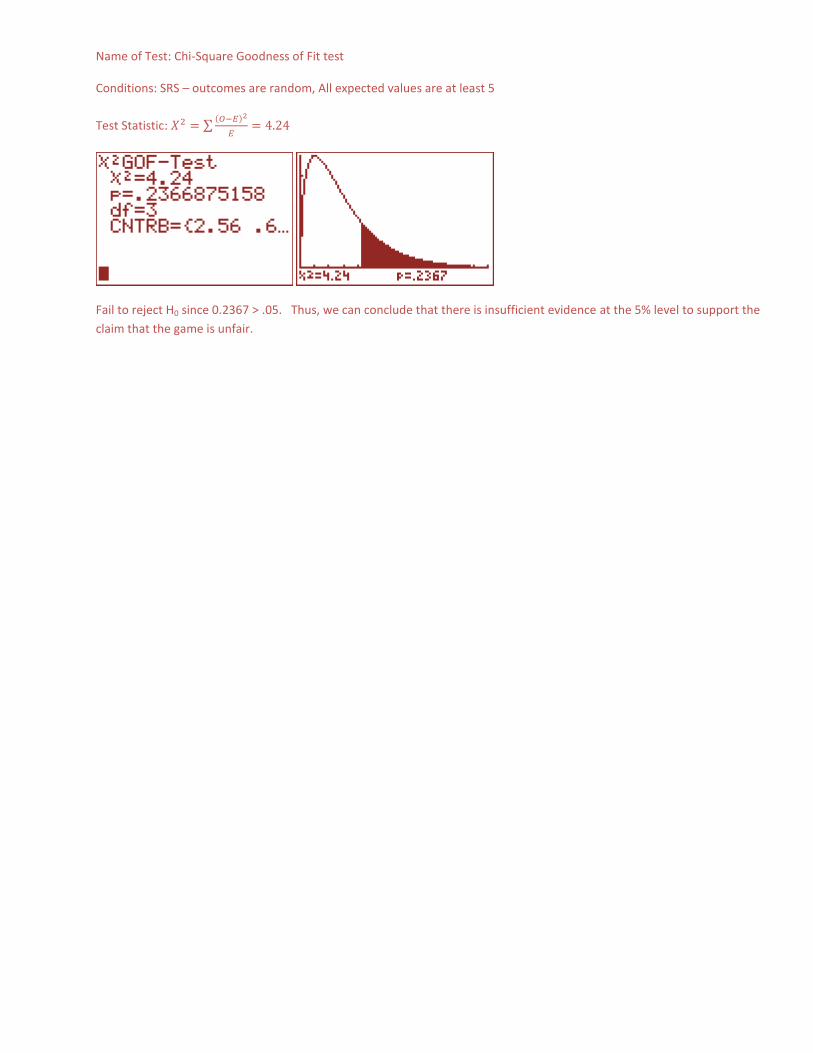
Name of Test: Chi-Square Goodness of Fit test
Conditions: SRS – outcomes are random, All expected values are at least 5
Test Statistic: ∑( )
Fail to reject H0 since 0.2367 > .05. Thus, we can conclude that there is insufficient evidence at the 5% level to support the
claim that the game is unfair.