Embed Size (px)
Citation preview
Establishment of a MicrotoxLaboratory and Presentation of
Several Case StudiesUsing Microtox Data
Env.Eng.Report No. 77-8?-8
Kevin C. Sheehan, Kathleen E. Sellersand Neil M. Ram
University of MassachusettsAmherst, Massachusetts 01003
Department of Civil EngineeringEnvironmental Engineering Program
Establishment of a MicrotoxLaboratory and Presentation of
Several Case StudiesUsing Microtox Data
Env.Eng.Report No. 77-B?-8
Kevin C. Sheehan, Kathleen E. Sellersand Neil M. Ram
April 1984
April, 198*JEnv. Eng. Report No. 77~83-8
Technical Report
Establishment of a Microtox Laboratory and Presentation of SeveralCase Studies Using Microtox Data
by
Kevin C. SheehanResearch Engineer
Kathleen E. SellersResearch Assistant
and
Neil M, RamAssistant Professor
Department of Civil EngineeringEnvironmental Engineering Program
University of MassachusettsAmherst, MA 01003
Submitted to the
Massachusetts Department of Environmental Quality EngineeringDivision of Water Pollution Control
Anthony D. Cortese, Sc.D., CommissionerThomas C. McMahon, Director
April 1984
I. Acknowledgements
The study was supported by Research and Demonstration Programsfrom the Massachusetts Division of Water Pollution Control (MDWPC)Project number 80~32. The authors would like to thank the MDWPC forcollecting water samples and determining in situ water qualityparameters. The authors would also like to thank Mr. Richard Earlsfor his work on Microtox enhancement studies. Thanks are alsoextended to Mrs. Dorothy Pascoe for typing the text of this report.
II. Executive Summary
The Microtox toxicity analyzer (Beckman Instruments, Inc;Carlsbad, CA) has been proposed as an alternative testing system tomore conventional methods of assessing aquatic toxicity which usefish, invertebrates, or algae as test organisms. The Microtox systememploys lyophilized marine bacteria, which, upon reconstitution, emita constant level of light. When exposed to a toxicant, the level ofMoluminescence is diminished in direct proportion to the toxicantconcentration. The Microtox toxicity analyzer is equipped with arefrigerated reaction chamber, a precision photometer for measuringlight output, and a digital display to monitor the instrument'sfunctions. Relative toxicity is expressed as an EC50 value, or'effective concentration* causing a 50 percent diminution in lightoutput in a stated exposure period. Other criteria, such as an EC10or EC25 may be used when a more conservative approach is desired.
The Microtox test has several advantages over conventional fishor daphnid acute toxicity tests, including: 1) usage of a
5statistically larger test population (more than 10 bacteria pertest); 2) small sample requirements,:and 3) comparable precision andaccuracy to other methods of measuring aqueous toxicity, at a fractionof the cost,
The type of sample collected for Microtox analysis is left tothe discretion of the sampling program. Approximately one liter ofsample should be collected in a clean, unused borosilicate glasscontainer equipped with a teflon lined cap. All samples should be
stored in a closed container at approximately 5 C and analyzed as soonas possible, preferably within twenty-four hours.
The first step in the Microtox analysis is the reconstitution ofa lyophilized bacterium (Photobacterium phosphoreum). Thesebioluminescent bacteria are then exposed to a range of toxicantconcentrations. Light output is measured with a precision photometerafter some predetermined exposure period, and compared with initiallight output and reagent blanks to determine the toxicantconcentration causing an EC50.
Microtox data can be analyzed with graphical methods similar tothose utilized in other toxicity testing procedures. The manufacturerrecommends the use of the gamma function, Y, which is defined as theratio of the amount of light lost in a given exposure period to theamount of light remaining at the end of the test, to determine theEC50 value. The EC50 value corresponds to a gamma value of unity.This function reportedly produces a more linear plot than othertechniques, and simplifies data analysis.
During its two year operation of a Microtox toxicity testinglaboratory C1982-19W, the University of Massachusetts has analyzed
iii
21 samples using the Microtox system. Several of these tests were inconjunction with fish, daphnid and algal bioassays. This reportpresents data for these 21 samples, four of which were analyzedconcurrently using Microtox, fish, and daphnid bioassays. TheMicrotox system was the most sensitive test in all but one of the fourmultiple assays. The fish toxicity test was the least sensitive inall cases. In no case did the Microtox test fail to detect toxicityin samples showing a toxic response using fish or daphnids as testorganisms.
In addition, several chemicals were investigated for theirpotential to exhibit a synergistic response with a few selectedtoxicants, in an attempt to increase the sensitivity of the Microtoxtest (Appendix B). The chemical components were tested singly, and incombinations of two, three and four chemicals. The toxic effectsexerted by single solute systems were additive for all two componentmixtures examined. The interactions within three and four chemicalcomponent systems were variable. None of the three compoundsinvestigated (chloramphenicol, methylene blue, achromycin) enhancedthe sensitivity of the Microtox test via synergistic reactions withthe test compounds.
The Microtox test is considerably less expensive and quicker toconduct than fish, algal or daphnid bioassays. Approximately twohours and 15 minutes are required for an entire Microtox analysis ascompared to a minimum of 48 and 96 hours for daphnid and fish toxicitytests, respectively. A single technician should be able to conductabout ten Microtox assays per week or 500 per year. The associatedcost of establishing such a bioassay laboratory is $21,000 (1983dollars) including the initial capital investment for the Microtoxinstrument and supply costs, but excluding personnel charges. Eachadditional year's worth of supplies for 500 samples costs about$11,000 (1983 dollars). If the direct costs of establishing aMicrotox laboratory are distributed over one year (excludinginterest), then the cost per test is $72, assuming only onetechnician, at a salary of $1 5,000/year, is needed to perform 500analyses in that time. The cost per analysis, excluding the Microtoxinstrument capitol investment, is $52 (1983 dollars).
xv
III. TABLE OF CONTENTS . .
I. Acknowledgements ii
II. Executive Summary iii
III. Table of Contents . v
IV. List of Tables vi
V. List of Figures vii
VI. Introduct ion 1
VII. Literature Review ' 4
VIII. Procedures 8
IX. Methods of Data Presentation 21
X. Case Studies 25
XI. Conclusions 40
XII. Equipment, Supply, and Time Requirements 41
XIII. References 46
XIV. Appendices 49
A. Case Study Water Quality Data 49
B. Studies on the Enhancement of the Microtox Bioluminescent 51Toxicity Test Using Two, Three or Four Component ChemicalSystems
v
IV. LIST OF TABLES
Table Title
1 Sample Microtox Data: W Percent Unfiltered 15Sanitary Landfill Leachate, Fitchburg, Massachusetts:July, 1982
2 Sample Microtox Data: 45 percent Hollingsworth and 17Vose Industrial Effluent Sample, Groton, Massachusetts:March, 1983
3 Light Diminution of Microtox Reagent Following 18Reconstitution
4 Microtox Toxicity Test Results at Various Time Intervals 23(minutes): Miscellaneous Wastewater Samples
5 Fitchburg, Massachusetts Sanitary Landfill Leachate 28Toxicity Test Results
6 Foxboro Metal Plating Toxicity Test Results, 29Foxboro, Massachusetts
7 Brockton, Massachusetts WWTP Toxicity Test Results 30
8 Bickford Pond Toxicity Test Results, 31Princeton, Massachusetts
9 Microtox Toxicity Test Results at Various Time Intervals 33(minutes): Raytheon Missile Systems Effluent,Lowell, Massachusetts and Hollingsworth and Vose Effluent,Groton, Massachusetts
10 Microtox Toxicity Test Results at Various Time Intervals 34(minutes): Oxford Pickle Effluent, South Deerfield,Massachusetts
11 Summary of Toxicity Data 36
12 Microtox Reproducibility Data 3n
13 Equipment and Supply Requirements ,2
1 J Time Requirements /,
15 Estimated Direct Costs to Conduct a Single Microtox 45Test
V. LIST OF FIGURES
Figure Title
1 Schematic Diagram of the Microtox System 9,
2 Comparison of Light Output Utilizing Various Diluents 20Relative to Microtox
3 Data Reduction Example: Gamma vs. Concentration Using 22Raytheon Missile Systems Effluent Data,Lowell, Massachusetts
4 Data Reduction Example: Percent Light Diminution vs. 23Concentration Using Raytheon Missile Systems EffluentData, Lowell, Massachusetts
5 Data Reduction Example: Time to EC50 vs. Concentration 24Using Raytheon Missile Systems Effluent Data,Lowell, Massachusetts
vii
VI. Introduction
The proliferation of synthetic chemicals resulting from ourexpanding industrialized'economy has led to the entry of toxiccompounds into the aquatic environment. The direct adverse effectsof these contaminants on aquatic life include acute, sub-acute, andchronic toxicological hazards. Additionally, introduction ofpollutants into the aquatic environment results in a decrease ofaesthetic quality attributable to odor, color, and foaming, andstresses the system's self purifying capacity. Growing awareness ofthe deleterious effects of these contaminants on aquatic life hasprompted state and federal agencies to develop technologies andmethods to prevent, control, abate, and detect such pollution.
Toxicity is the ability of a chemical to adversely affect thelife process. The minimum requirement for monitoring toxicity is aset of interdependent enzyme systems controlling measurablephysiological patterns (Beckman, 1980). Toxicity tests determinethe concentration of a chemical or percentage of some complex wastewhich causes either death, or some altered physiological processreflecting interference with the normal life cycle of the testorganism. The established methods for detecting toxicants in waterutilize fish, invertebrates, or algae as the test organisms. Thesetoxicity tests can take many forms, which, depending upon the testorganism, include: 1) acute; 2) chronic; 3) sub-chronic embryo-larval; 4) early juvenile; 5) avoidance; 6) respiratory activity;and 7) blood chemistry tests. There are many shortcomings inherentin these testing techniques. They are time and labor intensive(from 48 hours to 21 days to complete), and require large volumes ofsample Cup to 60 liters). Only a small number of organisms (ten pervessel) are usually tested resulting in a small test population andsubsequently wide statistical confidence intervals. Fish anddaphnids may additionally be subject to such variations as age,size, and level of stress.
Since light can be measured with a high degree of sensitivityand accuracy, a bioluminescent organism whose light is diminished indirect proportion to a toxicant exposure is an ideal test organismfor assessing aquatic toxicity. Bioluminescence is the emission oflight by organisms. Representatives of nearly every animal phylumand most plants, including photosynthetic organisms exhibitbioluminescence (Strehler, 1968). Some of the most thoroughlystudied bioluminescent organisms Include the firefly Photinuspyralis and the luminous bacteria.
The existence of luminescent bacteria has been known for over300 years, first being reported in 1592 by Fabricus Aquapendente(Strehler, 1968). Luminous bacteria emit light through an oxidationof reduced flavin mononucleotide (FMNH ) by molecular oxygen. This
reaction, a branch of the electron transport chain, is catalyzed by
the enzyme luciferace, and is accompanied by the oxidation of along-chain aliphatic aldehyde (Nealson and Hastings, 1979). Manyspecies of luminescent bacteria emit light at a constant level underideal conditions. In the presence of an antibacterial substance ortoxicant, however, the amount of light emitted decreases an amountproportional to the concentration of the toxicant (Bulich andGreene, 1979). This phenomenon makes luminescent bacteria idealcandidates for the assessment and quantification of toxic 'substances.
For these reasons, bioluminescent bacteria have been suggestedas an alternative test organism for the rapid and simpledetermination of toxicity in an aqueous sample. In recent yearsthere has been extensive work in developing a bacterialbioluminescence test for detecting the presence of aqueoustoxicants. In contrast to traditional methods of assessing aquatictoxicity, this analysis is reported to be rapid, reliable,inexpensive, and easy to perform. In addition, it requires a smallvolume of sample and in many cases is as, or more sensitive thanconventional testing procedures (Bulich and Green, 1979; Bulich etal., 1979; Qureshi et al., 1980). The Microtox toxicity testing
system, developed by Beckman Instruments Incorporated in the late1970's, represents the latest development in this technology.
The Microtox toxicity analyzer employs a lyopholized (freezedried) marine bacterium (Photobacterium phosphoreum) which, uponreconstitution, emits a constant level of light. Upon exposure to atoxicant, the level of bioluminescence is diminished in directproportion to the toxicant concentration. The lyopholized bacterialpopulation represents several advantages, as a test population, overconventional fish and daphnid bioassays. These include: increasedpopulation size; uniform population characteristics; and greaterreproducibility and reliability. It is additionally a very fast,simple, and sensitive technique.
The Beckman system includes a precision photometer equippedwith a digital display and incubated reaction chamber, in additionto an output for an auxiliary strip chart recorder. Data arereported either as EC50 values (percent effluent or toxicantconcentration causing a 50 percent reduction in light output for a
Beckman Instruments, Microbics Operations, 6200 El Camino Real,Carlsbad, California 92008; 619-438-9151)
stated time interval), or as any percent light diminution in astated time period (10, 90, 99 percent, etc.). For example, a30EC90 value would represent a 90 percent reduction in light outputafter 30 minutes of contact between the photobacteria and toxicantsolution. EC values are comparable to LC (lethal concentration)values used in more conventional toxicity testing techniques.Additional methods for representing toxicity values are discussedlater in this report.
VII. -Literature Review' ••• , • . • . . . .
Luminescent bacteria were first used for the detection ofantibacterial substances in .the early 19^0vs (Rake, et al., '19*13;Kavanagh, 19W- In the mid~1960's,, the -use of biolumin'escehtbacteria was expanded as methods were developed for detecting thepresence of toxic substances in the:air using luminescent bacteria(Serat et al., 1969). The method was found to be easy to use andprovided a sensitive, reliable indication of the presence oftoxicants.
Several researchers have compared the Microtox bacterialbioluminescence toxicity test to other more conventional methods ofassessing aquatic toxicity. Bacterial 5EC50's for 68 organiccompounds were measured and compared statistically to 96 hour LC50's(96LC50) for fathead minnows by Curtis et al. (1982). They found" -'the Microtox test to have, precision equal to or greater thantraditional fish toxicity tests, with a direct relationship betweencompound toxicity to bioluminescent bacteria and-fish. Bulich etal. (1979) compared Microtox 5EC50 data for pure compounds with fish96LC50 values found in the literature. In- addition theysimultaneously tested 50 complex waste samples with Microtox andfish. The data exhibited a good correlation between the two testingprocedures. The authors also investigated the reproducibility ofthe Microtox assay, using sodium lauryl sulfate as a standard. Theaverage 5EC50 after 81 determinations was;.eo,ual to 1,57 mg/L with astandard deviation and coefficient of variation of 0,28"mg/L and18.2 percent, respectively. Similar data, in terms of toxicant andsample size, are not available for fish and invertebrate toxicitytests. The United States EPA (1981), however, conducted multiplesets of laboratory tests consisting .of static and dynamic aquaticbioassays with two species of fish and static tests with Daphni:amagna tested in duplicate. The mean daphnid 48LC50 and coefficient 'of variation for replicate analyses of silver within a lab rangedfrom 0.525-47 yg/L and 4.21-27-9 percent,, respectively. For fatheadminnows, the mean static 96LC50 for silver and coefficient ofvariation ranged from 9.5-250 pg/L and 8.0-29.5 percent,respectively. -
Vasseur et al. (1983) assayed 162 industrial wastewaters usingMicrotox, in many cases in conjunction with daphnid toxicity tests.Every sample which was toxic to Microtox-.(effluents which displayedten minute EC50 values) was also toxic to daphnids (effluents whichdisplayed a 24 hour LC50). Twelve percent of the samples which werenon-toxic to Microtox displayed toxicity to daphnids. Microtox wasfound to be more sensitive than the daphnid test, especially in thecase of organic compounds. The authors also tested the Microtoxsystem for reproducibility with these effluents.- With threereplicates of each sample, the average coefficient-of variation forMicrotox was 27.6 percent. This is ..higher.,than the value calculated
by Bulich et al. (1979), but may be attributable to' the smallernumber of replicates utilized in the study.
Samak and Noiseux (i960) tested individual compounds and acomplex petrochemical industrial wastewater using Microtox and zebrafish toxicity tests. The effluent was tested at various pH valuesto determine the sensitivity of Microtox to this parameter. TheMicrotrox response was stable between pH values of 5.5 and 8. Thecorrelation coefficient between zebra fish 72LC50 values andMicrotox 5EC50 values was 0.884.
Peltier and Weber, (1980) conducted numerous bioassays usingthe Microtox system as well as fish, and invertebrates as testorganisms. They found that about 75 percent of the samples toxic tofish showed toxicity with the Microtox method. Fish were moresensitive than Microtox in about half of the tests where bothmethods indicated toxicity. Of the ^8 samples found toxic toinvertebrates, 30 were also toxic to Microtox. Invertebrates weremore sensitive than Microtox in 70 percent of these 30 samples. Ofthe 18 samples missed by Microtox, only two were strongly toxic toinvertebrates. The luminescent bacteria test was found to be anexcellent screening test by Qureshi et al. (1980), but they notedthat it did not perform as well for wastewaters containing certainspecific compounds such as cyanide and ammonia.
Neiheisel, et al. (1982) conducted toxicity tests with fatheadminnows, daphnids, and the Microtox bacterial toxicity assay oninfluent and effluent samples from two conventional activated sludgewastewater treatment plants. A mixture of 16 volatile prioritypollutants was added to the influent of one plant while the secondwas operated as a control. They found that there was a significantreduction in toxicity in the secondary effluent of both systemscompared to the influent and primary effluents. Fish, daphnid, andMicrotox test values were similar for secondary effluents,indicating little or no toxicity. There was no difference intoxicity, with a few exceptions, between samples taken from theinfluent or primary effluent of the treatment systems. The Microtoxtest, however, was consistently more sensitive than the fish ordaphnid tests for influent and primary effluent samples. Thefathead minnow 96 hour and the daphnid 48 hour tests yielded similartoxicity values for comparable samples. The Microtox test was moresensitive in all cases, with lower 5EC50 values than the LC50 valuesachieved with the other tests.
Beckman Instruments, Incorporated (1983) presented comparativeacute toxicity test data for Microtox, fish, and daphnid bioassaysof complex effluents. Of 257 samples tested, 235 were assayedsimultaneously with fathead minnows and Microtox and 155 wereanalyzed with both daphnid and Microtox toxicity tests. TheMicrotox and fish toxicity tests both detected toxicity (EC50 orLC50 < 50) in 87 percent of the 235 samples jointly tested. The
daphnid and Microtox tests both detecte'd toxicity in 75 percent ofthe 155 samples tested simultaneously. The toxicity values werewithin 2.5 orders of magnitude for 97.5 percent of the fish vs.Microtox results and 96.1 percent .of the daphnid vs. Microtoxresults.
Lebsack et al. (1981) tested fossil fuel process waters withboth the Microtox bacterial bioluminescence test and fish toxicitytests and observed the bacterial system to be more sensitive inthree of nine cases. The-obtained EC50 and LC50 values were similarin most cases, usually being within a factor of two of each other.In another study, Strosher et al. (1980) found that bioluminescentbacteria were more sensitive than fish to hydrocarbons such asdiesel fuel, as well as more responsive to small changes inconcentration of the toxicant. The authors suggested that this testcould be very useful in studying the joint toxicities or synergisticeffects of compounds.
Chang et al. (1981) tested a variety of compounds with theMicrotox system and found it to have a correlation coefficient of0.9 and 1.0 with rat and fish tests, respectively, for detectingtoxicity. They found Microtox to have the advantage of a short test
5period and the statistical advantage of utilizing more than 10 testorganisms per analysis. Dutka and Kwan (1981) compared Microtox tothree other bacterial toxicity tests utilizing Spirillum volutans,Psuedomonas flourescens, and Aeromonas hydrophila. They found agreat deal of variation in the sensitivity patterns of the fourmicrobial tests, but Microtox was the most sensitive in a majorityof cases. They concluded that the Microtox system was a sensitivetoxicity assay procedure with its major benefit being quick .turnaround time.
To determine the reproducibility of Microtox data, Beckman(1983) performed 30 separate assays of sodium pentachlorophenateusing 30 separate vials of Microtox reagent. The mean 5EC50 and15EC50 were 0.468 and 0.351 mg/L, respectively. The 5EC50 had astandard deviation of 0.052 mg/L with a coefficient of variation of11 percent while the 15EC50 data showed a standard deviation of0.0*11 and a coefficient of variation of 12 percent.
Additional research and discussion of the Microtox system waspresented at the First International Symposium on Toxicity TestingUsing Bacteria, held by the Canada Centre for Inland Waters (1983).Indorato, et al. (1983) analyzed 13 chemical compounds with theMicrotox system and combined the results with the literaturedatabase to correlate fish LC50 and Microtox EC50 values. The datawere found to compare favorably, showing the Microtox test to be auseful screening technique for determining the relative toxicity ofnew or untested chemicals. The authors also developed amathematical correlation model to determine the need for performing
more complex and expensive fish tests. Mallak and Brunker (1983)compared the Microtox toxicity test to an in vitro enzyme assay bydetermining the toxicity of several metal working fluidpreservatives. Overall, the Microtox system was more sensitive, andwas found to have EC50 values within 25 percent of fish 96 nour LC50values for most of the biocides tested.
In summary, the bacterial bioluminescence test represents thelatest advance in the field of aquatic toxicity testing. THeMicrotox system is reported to be quick and easy to use, requiringonly a few milliliters of sample and about 30 minutes to perform,and has precision and an ability to detect toxicity which compareswith conventional testing methods at a fraction of the cost.
VIII, Procedure
The basic components of the Beckman Microtox system are thelyophilized bacteria, Photobacterium phosphoreum (Reagent?, asolution for reconstituting these organisms (ReconstitutionSolution), and a precision photometer equipped with a refrigeratedchamber in which the test is conducted and a digital display whichmonitors the functions of the instrument. In addition, an optionalstrip chart recorder is recommended to provide a permanent graphicaldisplay of the test results.
The degree of sample preparation for Microtox analysis dependsupon the characteristics of the material being tested. Highly toxicaqueous samples may require dilution prior to analysis to bringlight diminution into the 50 percent range. Microtox diluent(Diluent) is recommended for sample pre-dilution since this solutionis used to prepare further serial dilutions later in the Microtoxanalysis. A rule of thumb used in other toxicity testing proceduresis that the dissolved oxygen concentration should not fall below 5mg/L. It has been the experience of this laboratory that adequatedissolved oxygen is introduced through sample preparation anddilution. Finally, the sample must be adjusted to the properosmotic pressure for the marine bacterium used in the test, by theaddition of osmotic adjusting solution (Osmotic Adjusting Solution).
If the sample is highly colored it may affect the results ofthe analysis. Microtox has developed a special color correctionprocedure to compensate for 'these effects. Uncolored samples areanalyzed with the standard procedure.
In order to obtain consistency in the bacterial inoculumutilized in the Microtox procedure, Beckman has developed a methodof lyophilyzing (freeze drying) the bacterium Photobacteriumphosphoreum. The first step in the analysis is the reconstitutionof these bacteria to obtain a single batch, large population thatpossesses enhanced statistical properties over conventionalorganisms utilized in toxicity testing. Due to the volume ofsolutions used to reconstitute the bacteria and adjust theosmolality of the solution, the maximum,percentage of an aqueoussample that can be tested with this procedure is 45.
Once the bacteria are reconstituted they emit a fairly constantlevel of light. The reconstituted bacteria are kept in therefrigerated incubator well block of the instrument which is
maintained at 15 C. There are 15 wells in the block (Figure 1);A1-A5, B1-B5, and C1-C5. The B and C wells will ultimately containequal dilutions of the reconstituted Reagent for testing, while theA wells will ultimately contain serial dilutions of the sample to betested. Wells 81 and C1 will be used as controls while wells B2-B5and C2-C5 will receive doses of sample transferred from wells A2-A5.
miiiiliiiiiiiiliiiiimiiiiimiiiiimmiiiimimiIllllllllllllllllllllllllll
1 I J * S
• •••O
Confront MM Future*
c*uT'O« LI OUT
BECKMAN Antlyiff Mo<t*l 2055
Front P»o«l Control* «nd I
Figure 1 Schematic Diagram of the Microtox System(After Beckman, 1982b)
After a specified time period of exposure of the bacteria to thesample, light readings are taken by transferring the cuvettes fromthe incubator wells to the turret assembly which links the cuvettewith the photomultiplier tube. The light output of the organisms ismeasured and compared to the blanks so that the light decreaseattributable to the sample being tested can be determined.
The type and volume of sample collected for Microtox analysisis dependent on the water being sampled, and the information whichis needed by the sampling program. In general, composite samplescan yield general information about continuous effluents, but tendto mask or miss plugs of toxic substances. On the other hand, grabsamples are only representative of the time of sampling.Ultimately, the sample type is left to the discretion of theinvestigator.
The Microtox test requires only three milliliters of sample peranalysis, and the majority of the sample volume is therefore neededfor other water quality analyses performed. Water qualityparameters which should be determined on samples being analyzed bythe Microtox test include: pH, alkalinity, hardness, conductivity,and dissolved oxygen. These parameters have been shown to affectsample toxicity, and should be reported along with toxicity testresults. A one liter sample is sufficient to satisfy therequirements of these analyses.
Samples should be collected in clean, previously unusedborosilicate glass containers with teflon lined caps, stored in a
closed container at approximately 5 C, and if possible, analyzedwithin twenty-four hours.
The test can be completed in as little as five minutes, but maybe extended several hours if desired. The duration of the test hasbeen extended to three hours in the Environmental EngineeringLaboratory with no apparent complications. Once the test isterminated, the light output data is analyzed to determine the EC50for the sample. A decrease in light output of 50 percent is chosenby convention, and is not necessarily the best parameter. For someapplications an EC10 or EC25 may be preferable if greatersensitivity is warranted. A modified version of the manufacturer'srecommended procedures (Beckman, 1982b) as well as severalprocedural modifications developed in this laboratory are asfollows:
A. Analyzer Preparation
1. Check turret and incubator temperatures.
2. Set controls and zero instrument.
10
3. Place new cuvettes in incubator wells.
4. Place a new cuvette in the precooling well and pipet 1.0ml Microtox Reconsitution Solution into this cuvette.
5. - For 2:1 serial dilutions pipet 2.5 ml Microtox Diluentinto cuvettes A1 through A4. A1 is the non-toxic controlwhile A2 through A4 will ultimately contain sample serialdilutions.
6. Pipet 0.5 ml Microtox Diluent into cuvettes B1 through B5and C1 through C5. These cuvettes will ultimately containequal dilutions of reconstituted Reagent for testing.
B. Sample Dilution Preparation
1. Adjust sample osmolality to two percent NaC1 (by weight).
2. Make primary dilution of sample with Microtox Diluent ifnecessary.
3. Pipet 1.5 ml of sample into cuvettes A4 and A5. CuvetteA4 now contains 3.0 ml total.
4. Mix the contents of A4 by carefully aspirating anddispensing with the 500 yL pipet.
5. Transfer 1.5 ml from A*J to A3 and mix as in step 4.
6. Transfer 2.5 ml from A3 to A2 and mix as in step 4.
7. Aspirate 1.0 ml of the contents of A2 with a pipet anddiscard. The volume of A2 is now 2.0 ml.
8. Wait five minutes or more for thermal equilibrium.
C. Reconstitution of Microtox Reagent
1. Do not begin reconstitution until the ReconstitutionSolution has been in the precooling well for at least fiveminutes.
2. Remove one vial of Microtox Reagent from the refrigerator.
3. To minimize warming, quickly remove cap and stopper andshake dry pellet to bottom of vial.
4. Pour the precooled Reconstitution Solution into theReagent vial by rapidly inverting the cuvette. Mix byswirling for two to three seconds while holding the vialfrom the top to minimize warming.
11
5. Pour the- Reconstituted Reagent back into the cuvette usedto cool the Reconstitution Solution and replace cuvette inprecooling well.
6. Immediately mix by aspirating and dispensing with the 500yL pipet'about 20 times.
D. Dilution of the Microtox Reagent
1. If a recorder is used, mark the start of this sequence.
2. Without removing the cuvette, aspirate 10 yL of MicrotoxReagent.
3. Remove excess solution from pipet tip with a Kimwipe,being careful not to touch the opening.
4. Dispense the Reagent into cuvette B1. Transfer 10 yLReagent into cuvettes B2 through B5 and C1 through C5 inthe same manner using the same pipet tip.
5. Mix the contents of each cuvette by aspirating anddispensing with a 250 yL pipet five times.
E. Equilibration Period of the Diluted Microtox Reagent
1. Allow the cuvettes to equilibrate for at least 15 minutes.
F. Assay Procedure with Duplicate Determinations
1 . After the equilibration period, depress XI Sensitivity.The SPAN (100 percent ADJ) dial may be set to about fourturns at this time if desired as a rough first estimate.
2. Transfer the cuvette from well B2 into the turret well andclose the turret (read position).
3. Adjust the SPAN (100 percent ADJ) dial for a DPM readingof approximately 090 (90 percent on recorder scale).
4. Open the turret and replace cuvette B1 in its incubatorwell.
5. Place cuvette C1 in*the turret well, close the turret, andrecord the light reading for approximately five seconds.Repeat this procedure for cuvette B2. If either C1 or B2readings read less than 100 on the DPM, continue cyclingthe cuvettes in the order C2, B3, C3, B4, C*J, B5, C5- Ifthe C1 and B2 readings are both over 100 on the DPM, usethe SPAN (TOO percent ADJ) dial to adjust the B2 readingto 090 on the DPM and return to step 2.
12
6. Verify that the cuvettes in each column (1, 2, 3, etc.)contain at least one reading between 080 and 100 on theDPM. The cuvettes may be re-ordered and re-cycled ifnecessary.
7. Immediately pipet 500 yL Microtox Diluent from cuvette A1to B1 and from A1 to C1, without removing cuvettes fromwells. Mix each cuvette by aspirating and dispensing fivetimes.
8. Using the procedure described in step 7 make the followingsample dilution transfers:
500 yL from: A2 to B2, A2 to C2
A3 to B3, A3 to C3
A4 to B4, A4 to CM
A5 to B5, A5 to C5
The same pipet tip can be used if the dilutions are madein the listed order. Perform all light readings withinthe same time frame required for transfer and mixing insteps 7 and 8.
9. At 5 and 15 minute intervals after starting step 7, takelight readings following the procedure in step 5.Tabulate and reduce the initial data from step 3 and fiveminute data from step 9 while waiting for the next cycle.Verify that the blank ratios agree within 0.02. Tabulatethe 15 minute data as soon as it is obtained.
G. Absorbance Correction Management For Highly Colored AqueousSamples.
1. Pipet 1.5 ml Microtox Diluent into the outer chamber of aclean Absorbance Correction Cell (ACC) and place it in theturret well.
2. Pipet 1.0 ml Microtox Diluent into a standard cuvette andplace it in incubator well A1 .
3. Pipet 2.0 ml sample of chosen'concentration, normally thehighest assayed, into each of two standard cuvettes andplace them in incubator wells C1 and C2.
4. Fill the other incubator wells with clean cuvettes.
5. Wait five minutes or longer for equilibration.
13
6. Pipet 50 yL of Reconstituted Reagent into cuvette Al. Mixthe contents of A1 by aspirating and dispensing with the500 yL pipet five times.
7. Lift the ACC out of the turret well long enough totransfer enough cell suspension from cuvette Al into theinner chamber of the ACC to provide a liquid levelapproximately equal to that of the Diluent in the outerchamber. Immediately return the ACC to the turret well tominimize warming.
8. Close the turret (Read position). Set the SPAN (TOOpercent ADJ) dial for a reading of 90 percent and recordthe light level to establish a steady base line reading.Reset to 090 if the output drops below 070 and record forfive more minutes.
9. Open the turret but do not remove the ACC, use a plasticaspirator to remove as much Diluent as possible from theouter chamber.
10. With the ACC still in the turret, transfer 0.5 ml to 1.5ml of test sample from cuvette C1 into the outer chamberof the ACC.
11. Remove as much sample as possible with the aspirator.
12. With the ACC still in the turret, use a pipet to transfer1.5 ml of test sample from cuvette C2 to the outer chamberof the ACC.
13- Close the turret (READ position) and record the lightlevel for ten minutes or longer.
H. Precautions
1. A cuvette of Diluent should be kept in the precooling wellat all times and incubator block should be either all fullor all empty when power is on. This insures proper airpurging and prevents moisture condensation.
2. Proper and reproducible pipet usage is essential to insureinstrument precision.
I. Procedural Modifications
1. The time of the test may be extended, especially if it issuspected that the sample contains metals. There is oftena significant decrease or recovery in light output after30 minutes. This can be seen in Tables 1 and 2 whichpresent data for samples analyzed with the Microtox systemat the University of Massachusetts. In Table 1, it can be
14
Table 1Sample Microtox Data
44 Percent Unfiltered Sanitary Landfill LeachateFitchburg, Massachusetts: July, 1982
Time (Minutes)
0
5
10
15
20
25
30
35
40
45
50
55
60
Light Diminution (Percent)
0
87.3
85.5
84.3
84.1
84.6
85.9
86.6
87.8
89.4
90.5
91.6
91.9
15
seen that the 5, 10 and 15 minute data give no indicationof the curvature in the data plot apparent after 30minutes. Prolonged exposure to this sample yielded alower EC50. The data in Table 2 show a more pronouncedexample of increased toxicity with prolonged exposure,with the 60EC50 being approximately one-fifth of the5EC50.
A more stable light output is reached_about 20 minutes ofreagent equilibration (E) -after Reagent reconstitutionrather than 15 minutes as suggested in the procedure.Table 3 illustrates this phenomenon. It can be seen fromTables 3a and 3b that a much smaller decrease in lightoutput occurs after 20 minutes.
The.Reconstituted Reagent is weakly buffered at pH 7.Below pH 5 and above pH 8, toxic effects may be due to pHrather than sample toxicity. If a sample is suspected tobe strongly basic or acidic two sets of samples should betested: one at the sample pH and one adjusted to pH 7.Toxic effects can be separated from pH effects in thismanner,
Microtox Diluent should be used to dilute concentrated orhighly toxic samples. Other diluents such as deionized ordistilled water, phosphate buffer or MOPS buffer(C«H. CNO,,S) have been shown to cause slight decreases ini \D Qlight output relative to the blank. Figure 2 comparesvarious diluents to the standard Microtox diluent. Datafor the phosphate buffer solution is not shown due to theerratic results obtained. At 1.8 percent and 45 percentit led to a decrease in light output of up to 15 percentwhile at 9.8 and 0.36 percent it stimulated light outputas much as 110 percent of that obtained with MicrotoxDiluent.
16
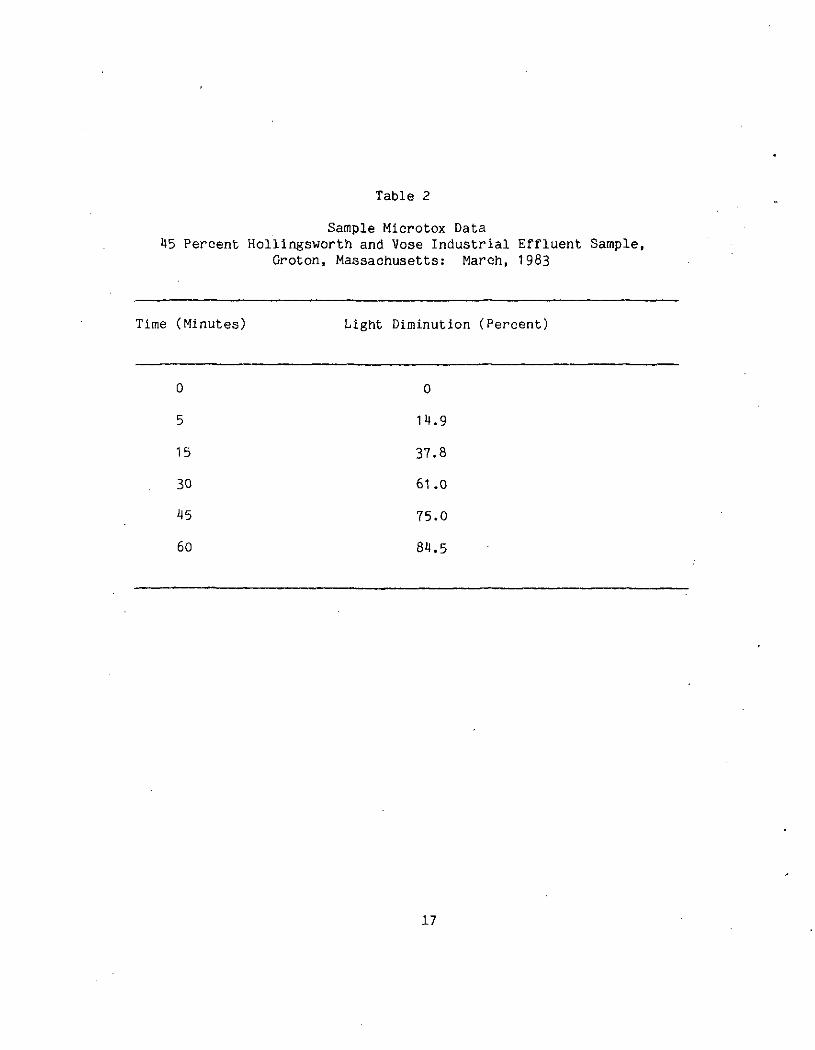
Table 2
Sample Microtox Data45 Percent Hollingsworth and Vose Industrial Effluent Sample,
Groton, Massachusetts: March, 1983
Time (Minutes) Light Diminution (Percent)
0 0
5 14.9
15 37.8
30 61 .0
45 75.0
60 84.5
17
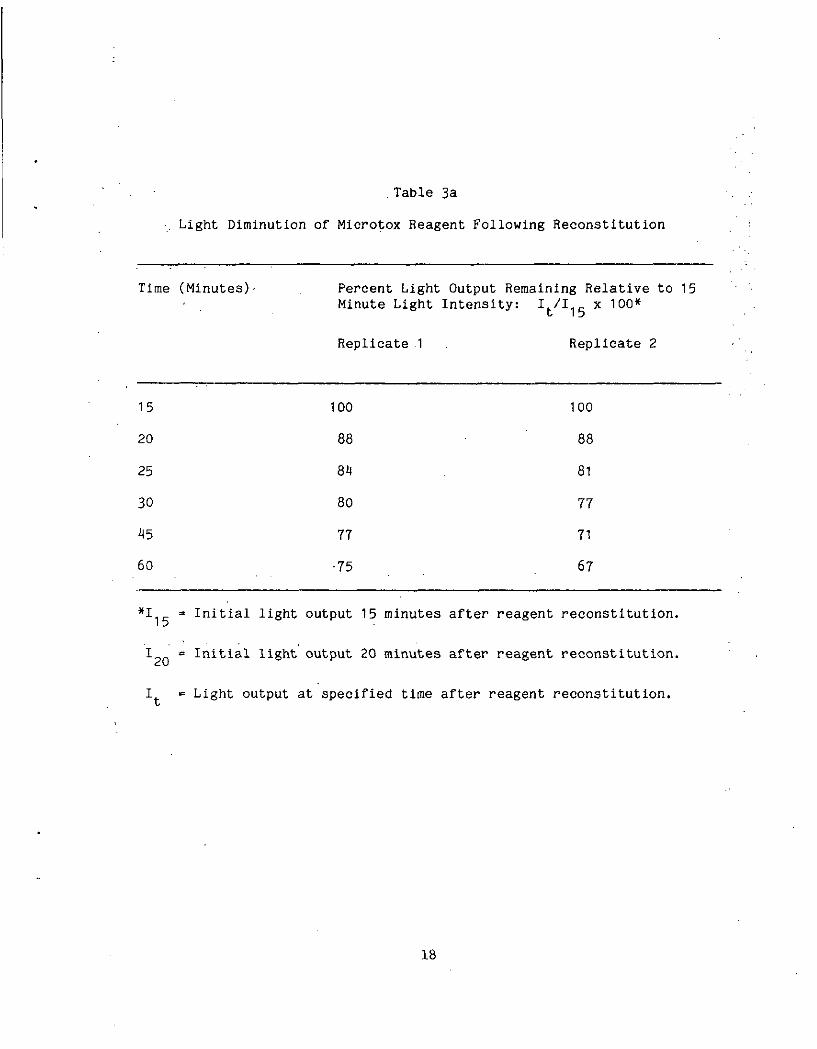
.Table 3a
-, Light Diminution of Microtox Reagent Following Reconstitution
Time (Minutes) -
15
20
25
30
45
60
Percent LightMinute Light
Replicate .1
100
88
84
80
77
•75
Output Remaining Relative to 15Intensity: I ./I,,- x 100*
t 1 o
Replicate 2
100
88
81
77
71
67
*I * Initial light output 15 minutes after reagent reconstitution,
I « Initial light output 20 minutes after reagent reconstitution.
I « Light output at specified time after reagent reconstitution.\f
18
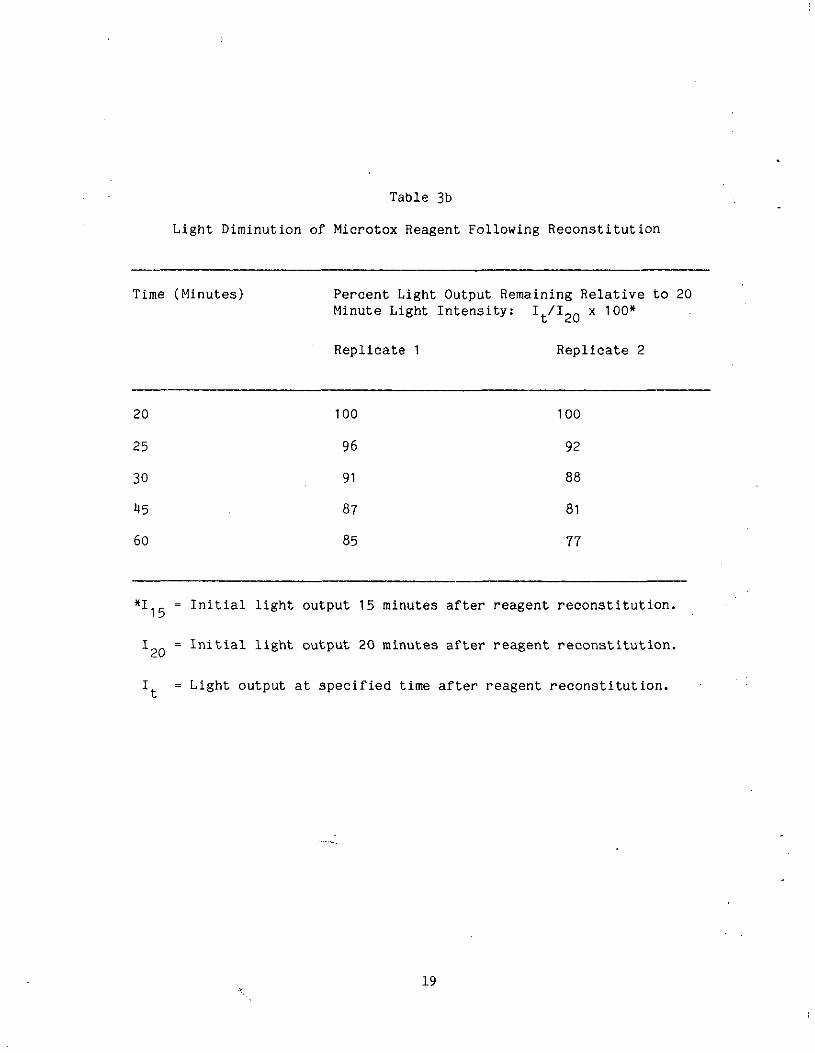
Table 3b
Light Diminution of Microtox Reagent Following Reconstitution
Time (Minutes)
20
25
30
45
60
Percent LightMinute Light
Replicate 1
100
96
91
87
85
Output Remaining Relative to 20Intensity: It/I20 x 100*
Replicate 2
100
92
88
81
77
*11 j. = Initial light output 15 minutes after reagent reconstitution.
I = Initial light output 20 minutes after reagent reconstitution.
I = Light output at specified time after reagent reconstitution.L*
19
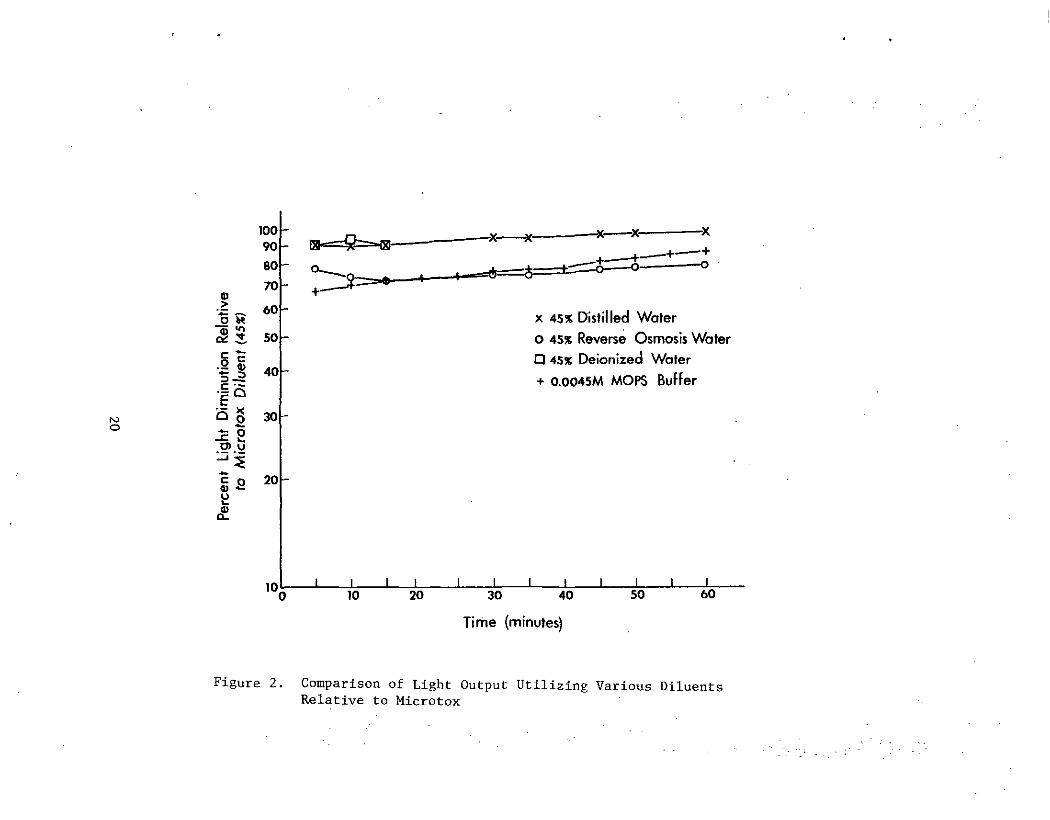
<D
J3 ^& 5.C r-*
§-2•§QE5|Jc PO^y
-*—c oa) i:
Q-
10090
80
70
60
50
40
30
20
10
- H«=S =HS X X ^^ + +
o^__^ ^^^_^ .___+^- :Q o- ~~°- +. — •*
x 45% Distilled Water
o 45% Reverse Osmosis Water
Q 45% Deionized Water
+ 0.0045M MOPS Buffer
-
-
t i l l i i i i i i t l6 10 20 30 40 50 60
Time (minutes)
Figure 2. Comparison of Light Output Utilizing Various DiluentsRelative to Microtox
IX. Methods of Data Presentation
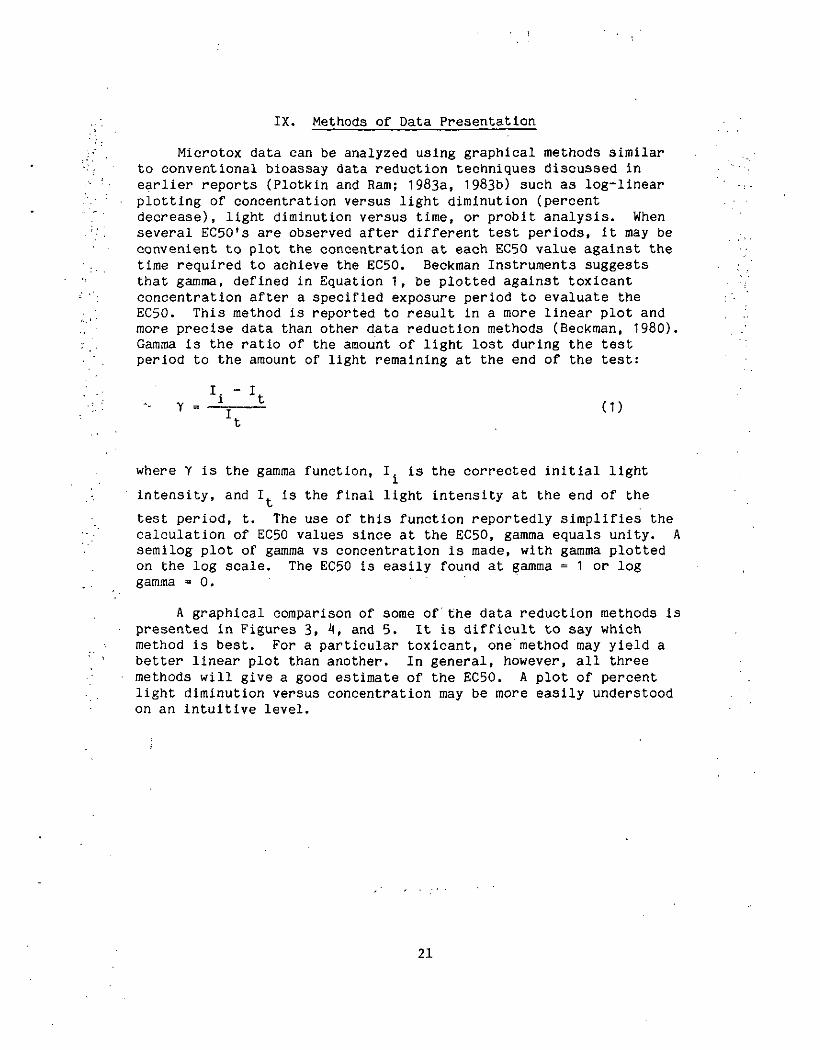
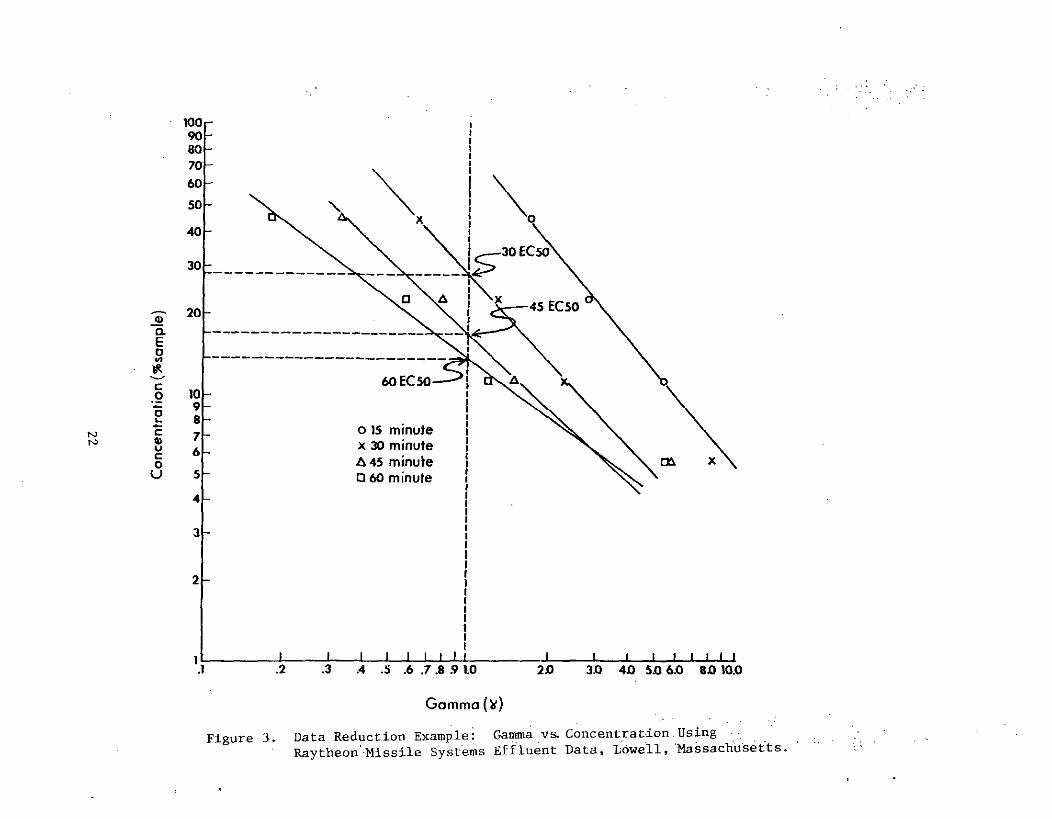
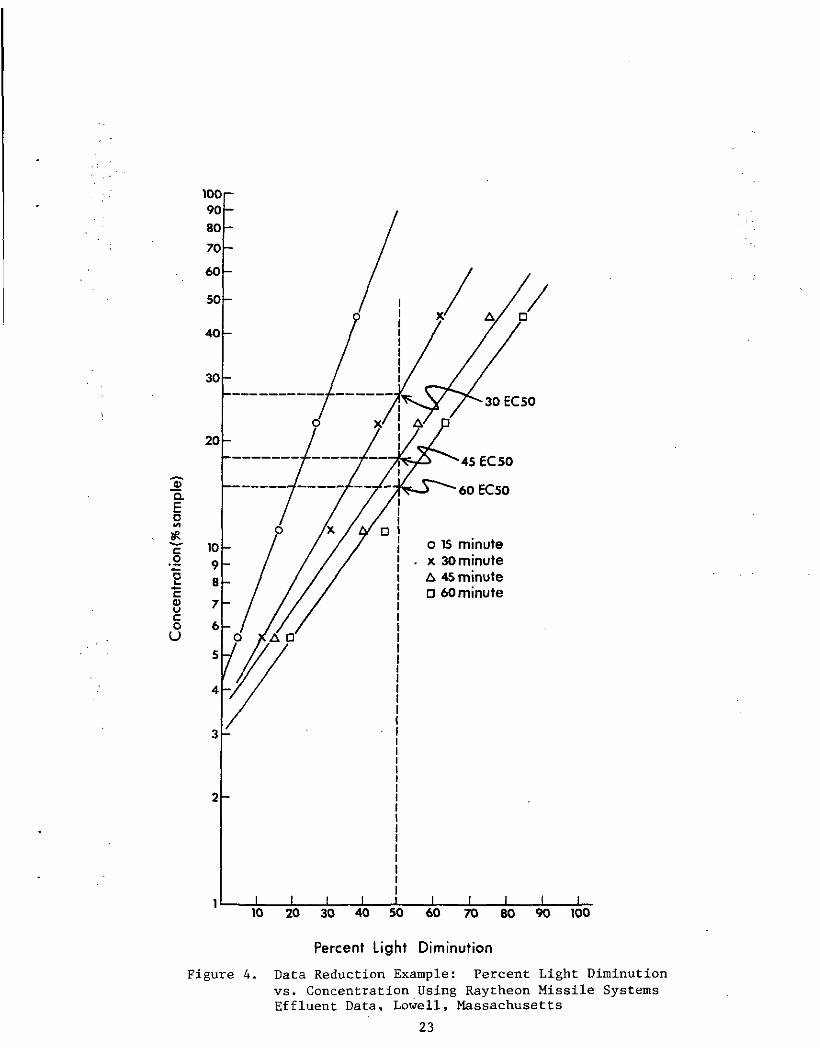
Microtox data can be analyzed using graphical methods similarto conventional bioassay data reduction techniques discussed inearlier reports (Plotkin and Ram; I983a, 1983b) such as log-linearplotting of concentration versus light diminution (percentdecrease), light diminution versus time, or probit analysis. Whenseveral EC50's are observed after different test periods, it may beconvenient to plot the concentration at each EC50 value against thetime required to achieve the EC50. Beckman Instruments suggeststhat gamma, defined in Equation 1f be plotted against toxicantconcentration after a specified exposure period to evaluate theEC50. This method is reported to result in a more linear plot andmore precise data than other data reduction methods (Beckman, 1980).Gamma is the ratio of the amount of light lost during the testperiod to the amount of light remaining at the end of the test:
where Y is the gamma function, I. is the corrected initial light
intensity, and I is the final light intensity at the end of the\f
test period, t. The use of this function reportedly simplifies thecalculation of EC50 values since at the EC50, gamma equals unity. Asemilog plot of gamma vs concentration is made, with gamma plottedon the log scale. The EC50 is easily found at gamma = 1 or loggamma =0. ' '
A graphical comparison of some of the data reduction methods ispresented in Figures 3. **, and 5. It is difficult to say whichmethod is best. For a particular toxicant, one method may yield abetter linear plot than another. In general, however, all threemethods will give a good estimate of the EC50. A plot of percentlight diminution versus concentration may be more easily understoodon an intuitive level.
21
N3ro
aEa
uco
<J
100908070
60
50
40
30
20
109876
5
4
o 15 minutex 30 minuteA 45 minuteQ60 minute
_L I I I l I I i i i I i.2 .3 .4 .3 .6 .7.8 .9 10 2JO 3-0 4D 5.0 6.0 8X) 10.0
Figure 3.
Gamma,
Data Reduction Example: Gamma vs. Concentration UsingRaytheon'Missile Systems Effluent Data, Lowell, Massachusetts
aEo
coucou
EC50
•45 EC 50
60EC50
o 15 minutex 30 minuteA 45 minutea 60 minute
10 20 30 40 50 60 70 BO 90 100
Percent Light Diminution
Figure 4. Data Reduction Example: Percent Light Diminutionvs. Concentration Using Raytheon Missile SystemsEffluent Data, Lowell, Massachusetts
23
o
50,
40
30
c<D(J 20
10
J I I I U10 20 30 40 50
Time to Achieve EC50 (minutes)
60
Figure 5. Data Reduction Example: Time to EC50 vs. ConcentrationUsing Raytheon Missile Systems Effluent Data,Lowell, Massachusetts
X. Case Studies
Since its establishment, the Environmental EngineeringLaboratory at the University of Massachusetts has analyzed 21samples with the Microtox toxicity testing system. Several of thesesamples have been analyzed in conjunction with fish and invertebratetoxicity testing by this laboratory. Data for all 21 samples arepresented here to illustrate the use of the Microtox toxicityanalyzer in assessing the toxicity of aqueous samples. Waterquality data for these samples are presented in Appendix A.
Miscellaneous Wastewater Samples
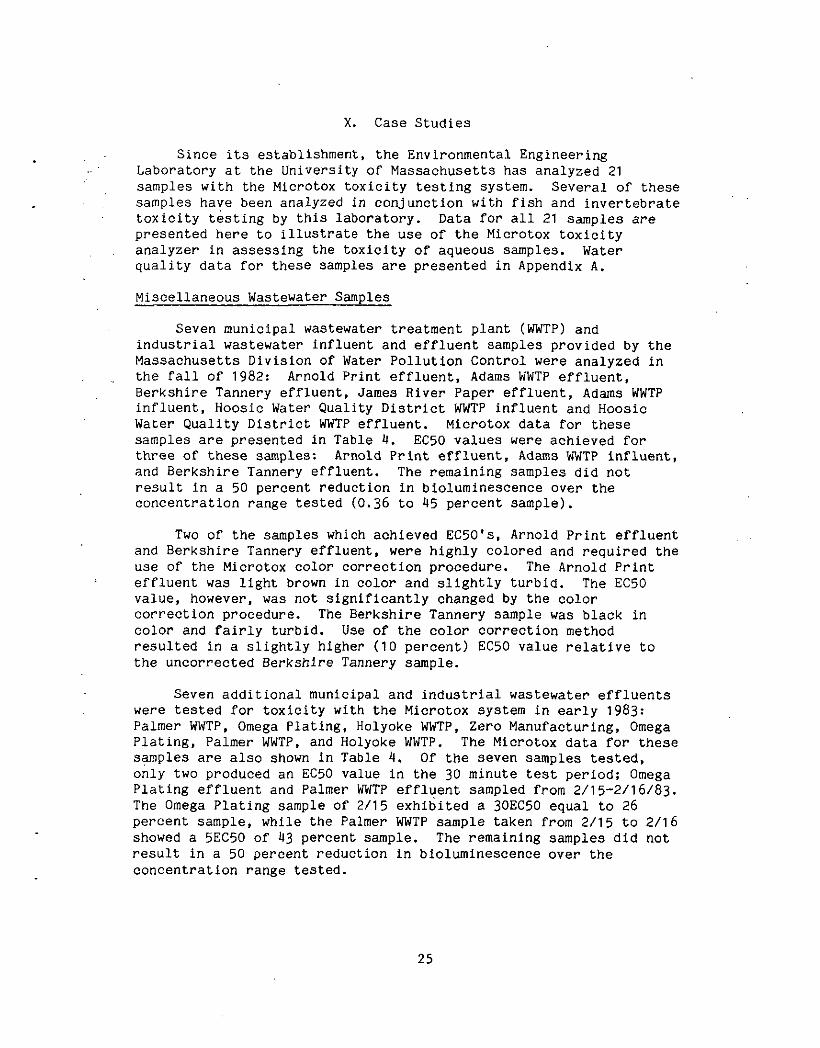
Seven municipal wastewater treatment plant (WWTP) andindustrial wastewater influent and effluent samples provided by theMassachusetts Division of Water Pollution Control were analyzed inthe fall of 1982: Arnold Print effluent, Adams WWTP effluent,Berkshire Tannery effluent, James River Paper effluent, Adams WWTPinfluent, Hoosic Water Quality District WWTP influent and HoosicWater Quality District WWTP effluent. Microtox data for thesesamples are presented in Table 4. EC50 values were achieved forthree of these samples: Arnold Print effluent, Adams WWTP Influent,and Berkshire Tannery effluent. The remaining samples did notresult in a 50 percent reduction in bioluminescence over theconcentration range tested (0.36 to 45 percent sample).
Two of the samples which achieved ECSO's, Arnold Print effluentand Berkshire Tannery effluent, were highly colored and required theuse of the Microtox color correction procedure. The Arnold Printeffluent was light brown in color and slightly turbid. The EC50value, however, was not significantly changed by the colorcorrection procedure. The Berkshire Tannery sample was black incolor and fairly turbid. Use of the color correction methodresulted in a slightly higher (10 percent) EC50 value relative tothe uncorrected Berkshire Tannery sample.
Seven additional municipal and industrial wastewater effluentswere tested for toxicity with the Microtox system in early 1983:Palmer WWTP, Omega Plating, Holyoke WWTP, Zero Manufacturing, OmegaPlating, Palmer WWTP, and Holyoke WWTP. The Microtox data for thesesamples are also shown in Table 4, Of the seven samples tested,only two produced an EC50 value in the 30 minute test period; OmegaPlating effluent and Palmer WWTP effluent sampled from 2/15-2/16/83.The Omega Plating sample of 2/15 exhibited a 30EC50 equal to 26percent sample, while the Palmer WWTP sample taken from 2/15 to 2/16showed a 5EC50 of 43 percent sample. The remaining samples did notresult in a 50 percent reduction in bioluminescence over theconcentration range tested.
25
Table 1
Microtox Toxiclty Test Results at Various Time Intervals (Minutes):Miscellaneous Wastewater Samples
. Sample
Arnold Print
Effluent
Adams WWTP Influent
Berkshire TanneryEffluent
James River PaperEffluent
Adams WWTP Effluent
Hooslc WQ DistrictWWTP Influent
Hooslc WQ DistrictWWTP Effluent
Palmer HHTP Effluent
Palmer HWTP Effluent
Omega PlatingEffluent
Omega PlatingEffluent
Holyoke HHTPEffluent
Holyoke WWTPEffluent
Zero ManufacturingEF fluent
Date Sample
Type1
8/31/82 G
8/30/82 G
8/31/82 G
8/31/82 G
8/31/82 G
8/31/82 G
8/31/82 G
2/11-2/15/83 C
2/15-2/16/83 C
2/15/83 G
2/15-2/16/83 C
2/11-2/15/83 C
2/11-2/16/83 C
2/15-2/16/83 C
Location
Adams, MA
Adams , MA
Hllllamatown, MA
Adams, MA
Adams , MA
Hllllamatown, MA
Hilliamstown, MA
Palmer, MA
Palmer, MA
Monson, MA
Monson, MA
Holyoke, MA
Holyoke, MA
Monson, MA
EC Value (% sample)
at various exposure times,(minutes)
5 EC50 - 0.56 (0.56)2
15 EC50 - .50 (,50)2
5 EC50 - 11
5 EC50 - 11 (10)2
30 EC20 - «5
30 EC15 - 15
30 EC35 - 15
30 EC5 - 15
5 EC25 - 15
5 EC50 - 13
30 EC50 • 20
5 ECU - 15
30 EC21 - 15
30 EC21 - 15
30 EC35 - 15
1. G • Grab sample; C - Composite sample.2. Values in parentheses were obtained with a non-color-corrected sample.
Fltchburg Sanitary Landfill Leachate
Fitchburg sanitary landfill leachate samples were tested fortoxicity in the fall of 1982, utilizing fathead minnows (Pimephalespromelas), invertebrates (Daphnia magna), green algae, (Selenastrumcapricornutum), and luminescent bacteria (Photobacteriumphosphoreum). The results of these tests are shown in Table 5- Theleachate was shown to be highly toxic with Microtox, exhibiting a5EC50 equal to 14 percent sample, moderately toxic to daphnids, witha 48LC50 of 62 to 66 percent sample, and slightly toxic to fatheadminnows, exhibiting a 96LC50 equal to 100 percent sample. Algalcells were unable to grow in a solution containing ten percentleachate, but recovered when centrifuged and reinoculated into algalnutrient medium. All algal tests were terminated within fourteen totwenty-one days upon realization of the maximum standing crop (lessthan a five percent increase in chlorophyll a. concentration in atwenty-four hour period).
Foxboro Metal Plating Wastewater
The effluent from the Foxboro metal plating plant, located inFoxborough, MA, was subjected to three bioassays in the winter of1982, utilizing bioluminescent bacteria (Photobacteriumphosphoreum), fish (Pimephales promelas) and invertebrates (Daphniamagna) as the test organisms. The results of these tests are shownin Table 6. The effluent displayed virtually no toxicity to fatheadminnows but was highly toxic to J). magna and the photobacteria usedin the Microtox system. The 48LC50 for daphnids was equal to 7.5percent sample, and the 30EC50 determined with the Microtox systemwas 40 percent sample. Additional exposure to the sample resultedin a two hour EC50 of 13 percent sample.
Brockton, Massachusetts Wastewater Treatment WWTP Effluent
Several toxicity tests were conducted on wastewater effluentfrom Brockton, MA using daphnids, fathead minnows, andbioluminescent bacteria as the test organisms. The data for theseanalyses are presented in Table 7. The sample was not sufficientlytoxic to kill 50 percent of the Daphnia pulex population during the48 hour test exposure period and no mortality was observed forfathead minnows after 96 hours of exposure to 100 percent effluent.In addition, none of the concentrations tested achieved an EC50 atanytime during the Microtox test.
Bickford Pond Tributary
A grab sample from an unnamed tributary to Bickford Pond inPrinceton, MA, was tested for toxicity utilizing bioluminescentbacteria (Photobacterium phosphoreum), fish (Pimephales promelas)and invertebrates (Daphnia pulex) as the test organisms. Theresults of these tests are presented in Table 8. The sample, which
27
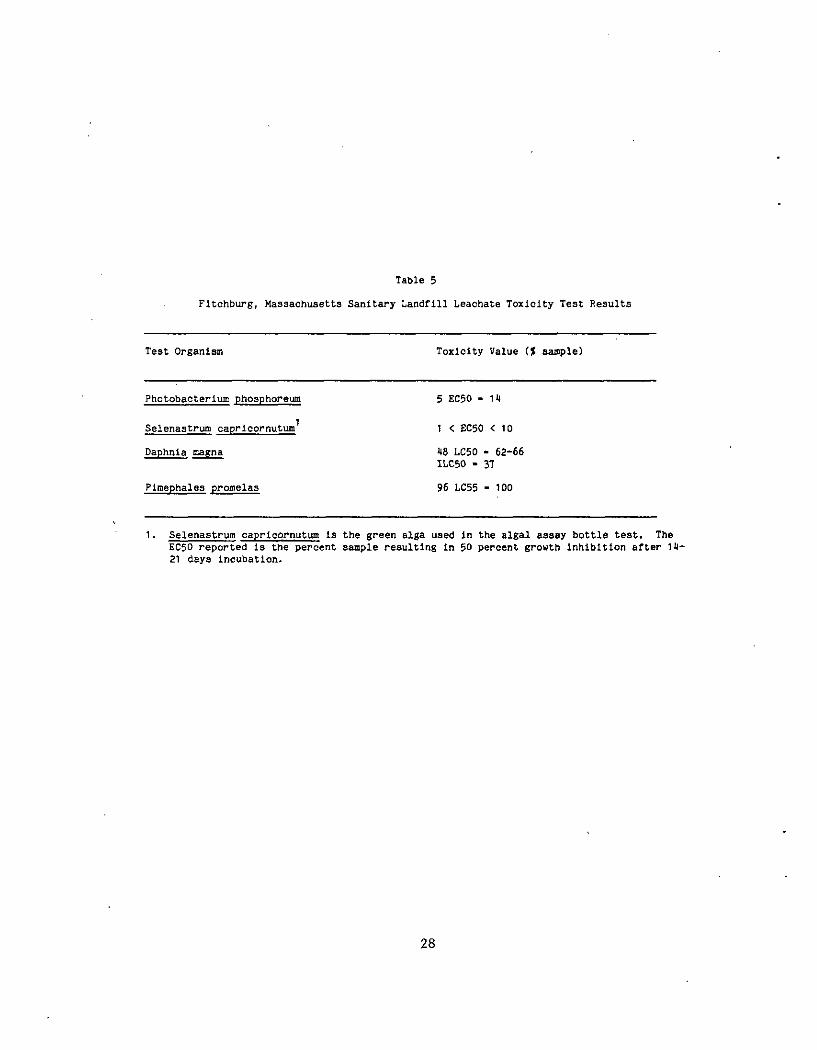
Table 5
Fitchburg, Massachusetts Sanitary Landfill Leachate Toxlcity Test Results
Test Organism Toxiclty Value (J sample)
Photobacterium phosphoreum 5 EC50 - 11*
Selenastrum caprlcornutum 1 < EC50 < 10
Daphnia magna H8 LC50 - 62-66ILC50 - 37
Pimephales proroelaa 96 LC55 - 100
1. Selenastrum caprleornutum is the green alga used in the algal assay bottle test. TheEC50 reported is the percent sample resulting in 50 percent growth inhibition after 121 days incubation.
28
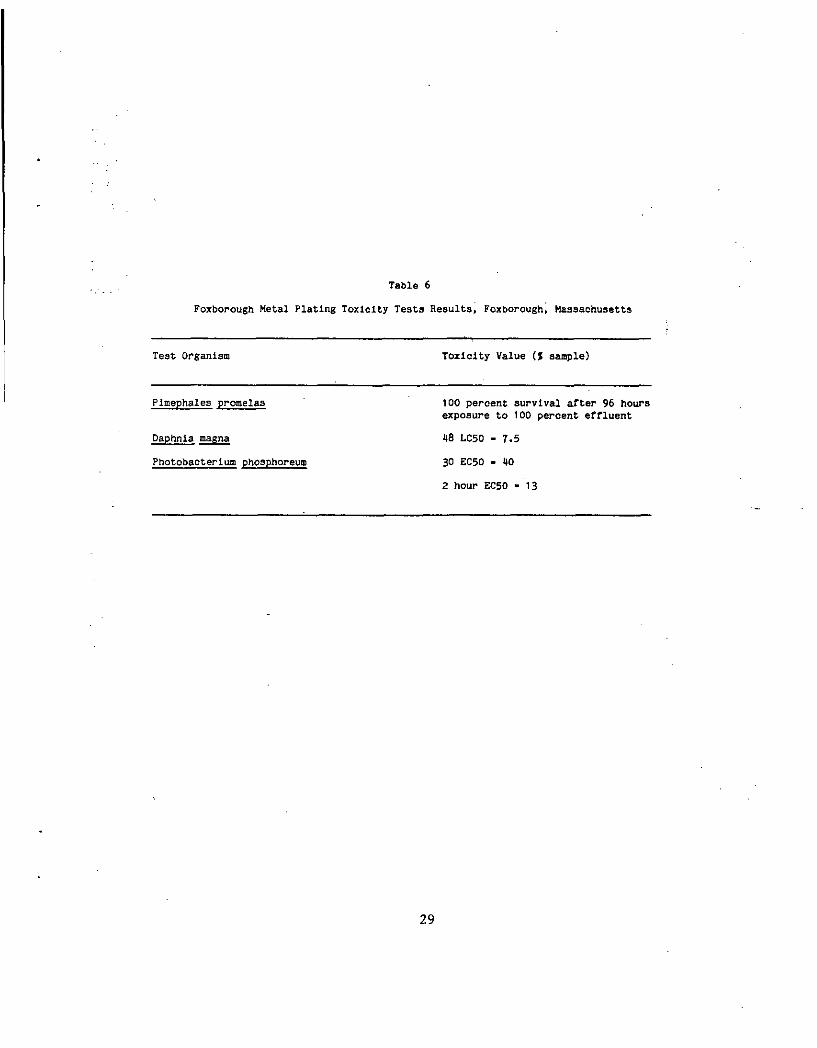
Table 6
Foxborough Metal Plating Toxicity Tests Results, Foxborough, Massachusetts
Test Organism Toxicity Value (% sample)
Plmephales promelas
jjaphnia magna
Photobacter1urn phosphoreum
100 percent survival after 96 hoursexposure to 100 percent effluent
48 LC50 - 7.5
30 EC50 - 1)0
2 hour EC50 "13
29
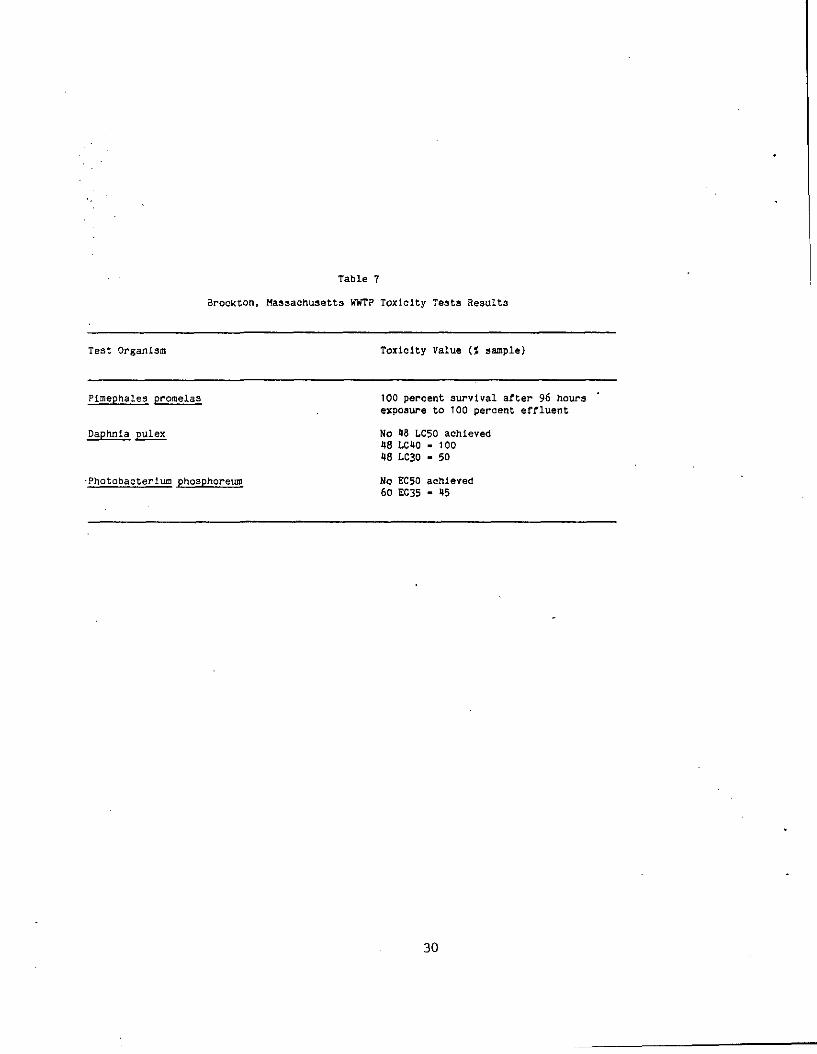
Table 7
Brockton, Massachusetts WWTP Toxlclty Testa Results
Test Organism Toxiclty Value (J sample)
Plmephales promelaa
Daghnia pulex
•Photobacterlum phosphoreum
100 percent survival after 96 hoursexposure to 100 percent effluent
No 18 LC50 achieved48 LCUO - 100US LC30 - 50
Ho EC50 acnieved60 EC35 - »5
30
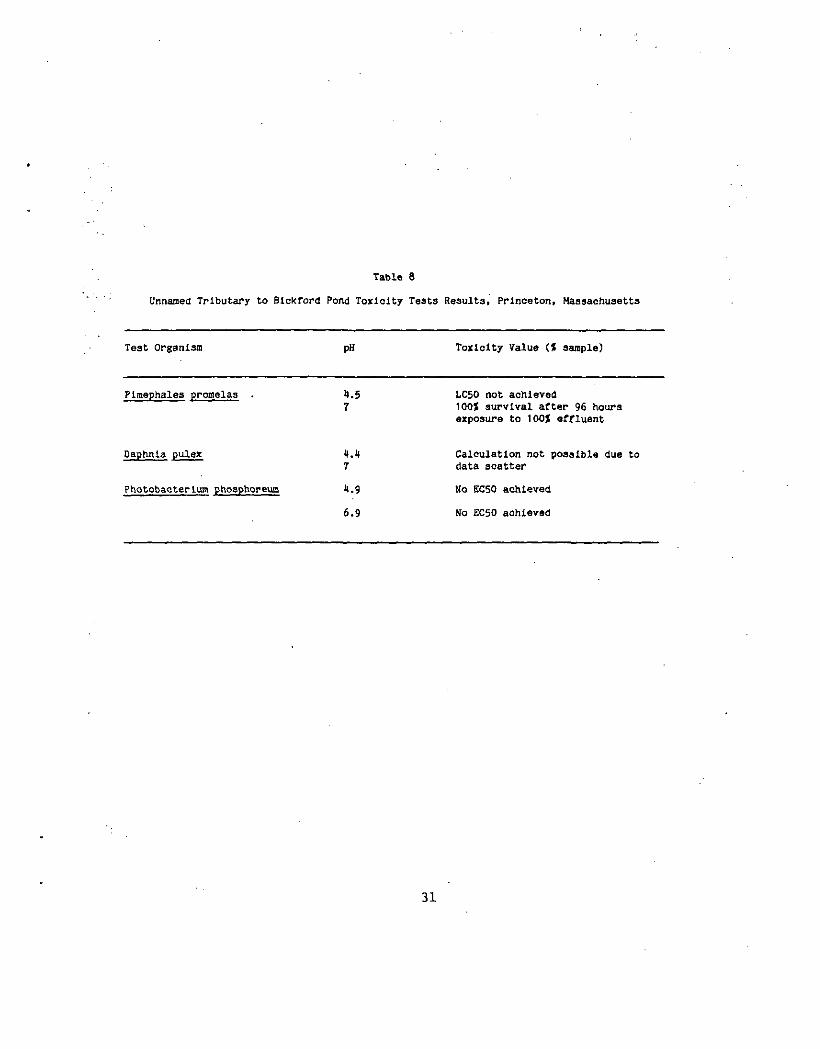
Table 6
Unnamed Tributary to Bickford Pond Toxiclty Teats Results, Princeton, Massachusetts
Test Organism pH Toxicity Value (% sample)
Plmephalea proaelaa
Daphnla pulex
Photpbsoterium phosphoreum
1
1.9
6.9
LC50 not achieved100J survival after 96 hoursexposure to 100$ effluent
Calculation not possible due todata scatter
Ho EC50 achieved
Ko EC50 achieved
31
was collected downstream from a wooded swamp, was believed to befree from conventional pollutants. In order to separate the toxiceffects of the acidic pH of the sample from the effects of otherpossible toxicants contained in the sample, the Microtox, daphnid,and fish toxicity tests were conducted at both the in situ pH valueas well as at neutral pH by adjustment with NaOH.
The results of these toxicity tests indicated that these waterswere non-toxic to fathead minnows, and showed a minor toxicity withMicrotox. It was not possible to interpret the results of thedaphnid test due to data scatter.
Raytheon Missile Systems and Hollingsworth and Vose Effluents
Two aqueous samples were analyzed at the University ofMassachusetts Environmental Engineering Laboratory with the Microtoxtoxicity testing system in March, 1983= Raytheon Missile Systemseffluent, and Hollingsworth and Vose effluent. The results of theseanalyses are presented in Table 9.
Raytheon Missile Systems effluent displayed an EC50 equal to28.7 percent effluent after 30 minutes of exposure. Additionalexposure of the Raytheon Missile Systems effluent resulted inincreased light diminution with EC50 values of 17-8 and 13.4 percentafter 45 and 60 minutes exposure, respectively. Alternatively, theHollingsworth and Vose effluent did not result in 50 percent lightdiminution at any time during the test period. Hollingsworth andVose effluent resulted in a maximum of 27.7 percent light diminutionafter 45 minutes exposure, indicating a low toxicity tobioluminescent bacteria.
Oxford Pickle Company Effluent
In April, 1983, an aqueous effluent sample from the OxfordPickle Company in South Deerfield, MA, was analyzed with theMicrotox system. The sample was turbid with a slightly greenishcolor, but did not require the use of the Microtox color correctionprocedure. The low pH value of the sample (4.0), however, warrantedMicrotox analyses at both the in situ pH (4.0) and adjusted pH (7.0)values so that toxic effects attributable to acidity could bedistinguished from the effects of possible chemical toxicantscontained in the sample.
Microtox data for this sample are presented in Table 10, Theeffluent was highly toxic to bioluminescent bacteria at both the insitu pH (4.0) and at neutral pH (7.0) values with five minute EC50values of 3.8 and 3.9 percent sample, respectively. At the pH valueof seven, the bacteria appeared to recover slightly from the effectsof the toxicant after 15 minutes. This recovery was not observed inthe sample at a pH value of 4.0, which exhibited greater lightdiminution at 15 minutes. There was a slight recovery in the sample
32
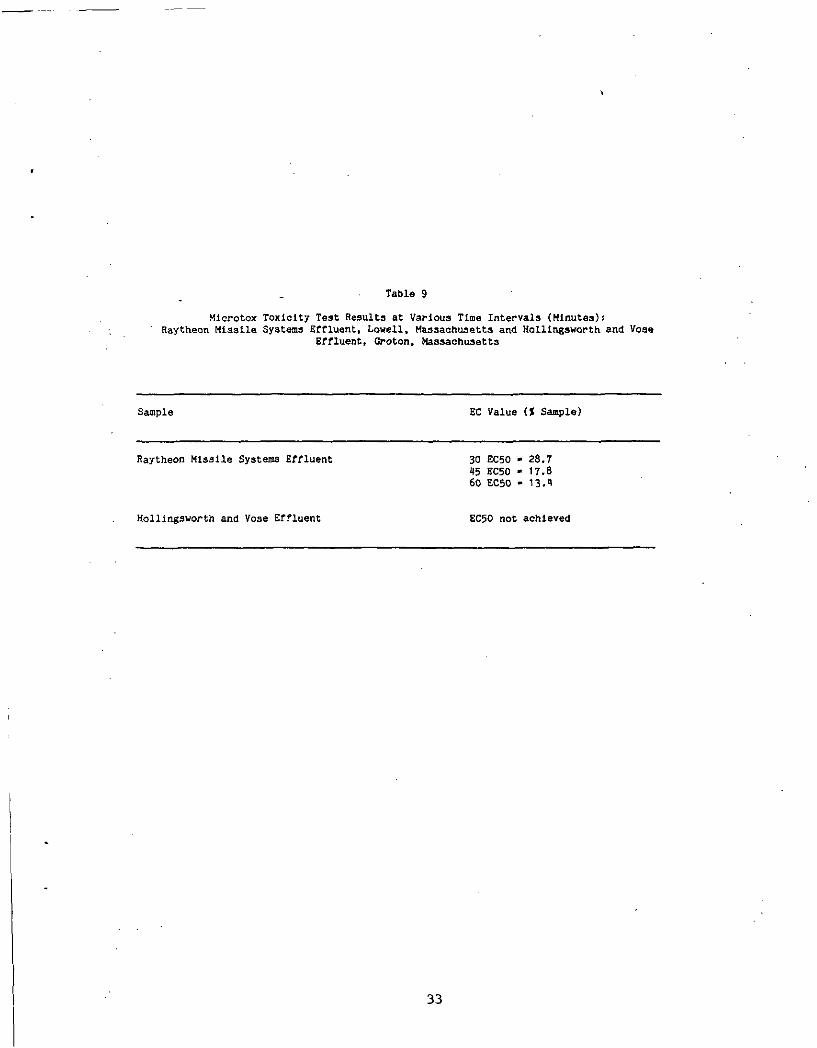
Table 9
Microtox Toxiclty Test Results at Various Time Intervals (Minutes):' Raytheon Missile Systems Effluent, Lowell, Massachusetts and Holllngaworth and Voae
Effluent, Groton, Massachusetts
Sample EC Value (% Sample)
Raytheon Missile Systems Effluent 30 EC50 • 23.745 EC50 - 17.860 EC50 - 13,1
Holllngsworth and Vose Effluent EC50 not achieved
33
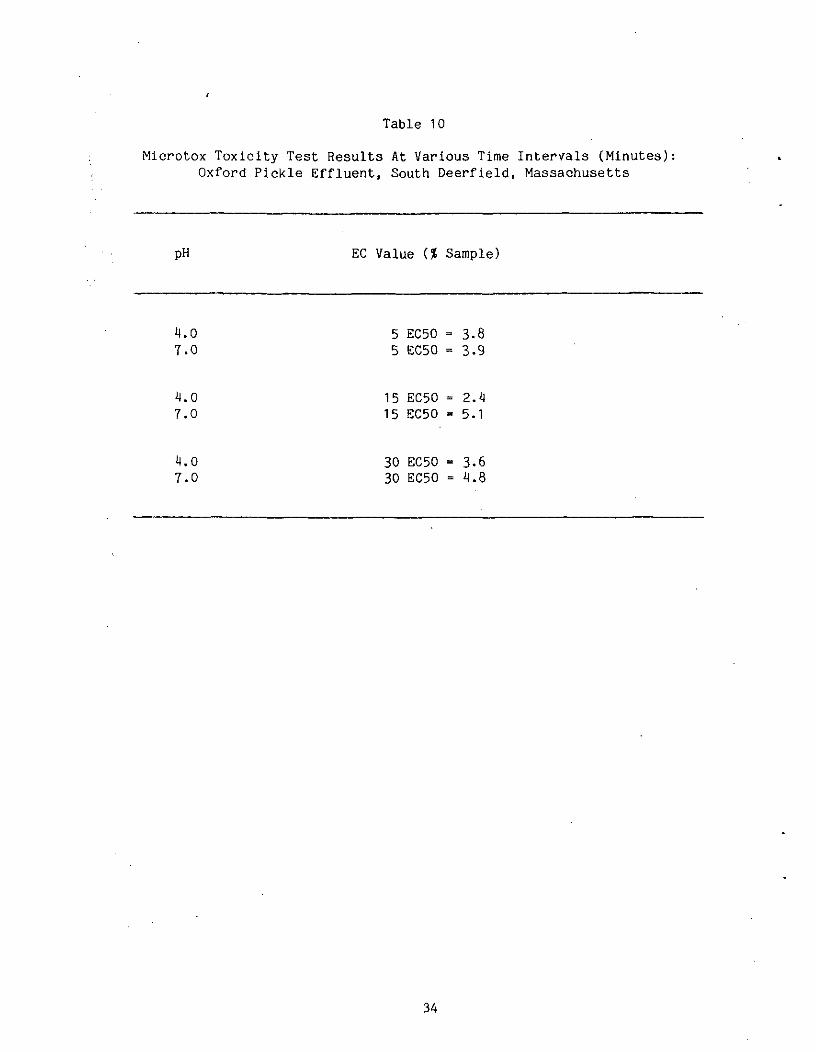
Table 10
Microtox Toxicity Test Results At Various Time Intervals (Minutes)Oxford Pickle Effluent, South Deerfield, Massachusetts
pH EC Value (% Sample)
4.0 5 EC50 = 3-87.0 5 EG50 - 3.9
4.0 15 EC50 » 2.47.0 15 SC50 = 5.1
4.0 30 EC50 = 3.67.0 30 EC50 - 4.8
34
at the pH value of four after 30 minutes exposure, with an EC50value of 3.6 percent sample. The sample at neutral.pH appeared tohave stabilized at 30 minutes with an EC50 value ,of 4.8 percentsample.
These results indicate that this sample was highly toxic tobi.oluminescent bacteria (Photobacterium phosphoreum) utilized in theMicrotox toxicity test. In addition, data from analyses at both thein situ pH value (4.0)'and adjusted pH value (7.0) suggest thattoxicity was attributable to a chemical constituent within theeffluent rather than the acidic quality of the sample.
The Environmental Engineering Laboratory has examined thereproducibility of the Microtox system after U5 minutes exposure to5.60 mg/L cadmium. This data is presented in Table 12. Four setsof replicate analyses by the same technician on four separate daysyielded a mean gamma value of 0.9501 with a standard deviation andcoefficient of variation of 0.0975 and 10.27 percent respectively.
Summary of Case Studies
The results of the toxicity tests conducted at the .Universityof Massachusetts Environmental Engineering Laboratory, since itsestablishment, are presented in Table 11.
In all but one case where multiple toxicity tests -wereperformed utilizing daphnids, fish, and Microtox, the Microtoxsystem was the most sensitive method. In the case of the FoxboroughPlating sample, the daphnid toxicity test was more sensitive thanMicrotox, with fathead minnows showing the least sensitivity.Fathead minnows were the most tolerant test organism in all cases.In no case did the Microtox test fail to detect toxicity in a samplethat showed toxicity with other testing methods.
The Microtox test is rapid and simple to perform, and requiresonly a small amount of sample. It also appears to offer equal orsuperior sensitivity to other techniques of determining aqueoustoxicity for the samples tested to date. The Microtox test has beenshown to have good reproducibility, with a coefficient of variationof 11 to 12 percent for 30 identical samples analyzed by onetechnician on the same instrument (Beckman, 1983). Although a muchsmaller sample size was used, similar variation has been seen infish and daphnid toxicity tests (USEPA, 1981).
Observation of the varying responses of the different testingtechniques suggests that EC50 values, determined with the Microtoxtest cannot be correlated with specific-LC50 values found usingother test organisms. However,' the Microtox system's ability tosensitivity detect toxicity rapidly make it an ideal screening toolfor testing aqueous samples.
35
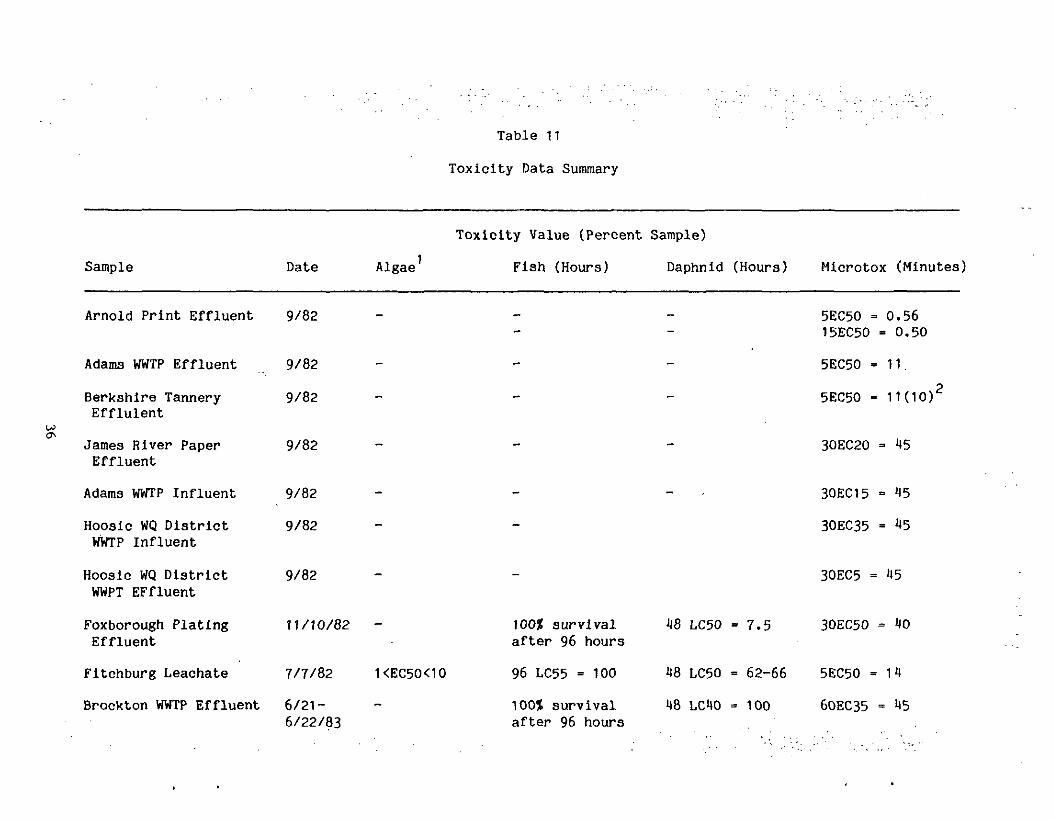
Table 11
Toxicity Data Summary
Sample Date Algae
Toxicity Value (Percent Sample)
Fish (Hours) Daphnid (Hours) Microtox (Minutes)
Arnold Print Effluent
Adams WWTP Effluent
Berkshire TanneryEfflulent
James River PaperEffluent
Adams WWTP Influent
Hoosic WQ District
9/82 -
9/82 -
9/82 -
9/82 -
9/82 - - -
9/82
5EC50 =1 5EC50
5EC50 =
5EC50 =
30EC20
30EC15
30EC35
0.56= 0.50
11.
1K10)2
= 45
- 45
= 45WWTP Influent
Hoosic WQ DistrictWWPT EFfluent
Foxborough PlatingEffluent
Fitchburg Leachate
Brockton WWTP Effluent
9/82
t1/10/82
7/7/82 1<EC50<10
6/21-6/22/83
100JC survivalafter 96 hours
96 LC55 = 100
100/t survivalafter 96 hours
48 LC50 =7.5
30EC5 «
30EC50 = 40
48 LC50 = 62-66 5EC50 = 14
48 LC40 = 100 60EC35 -
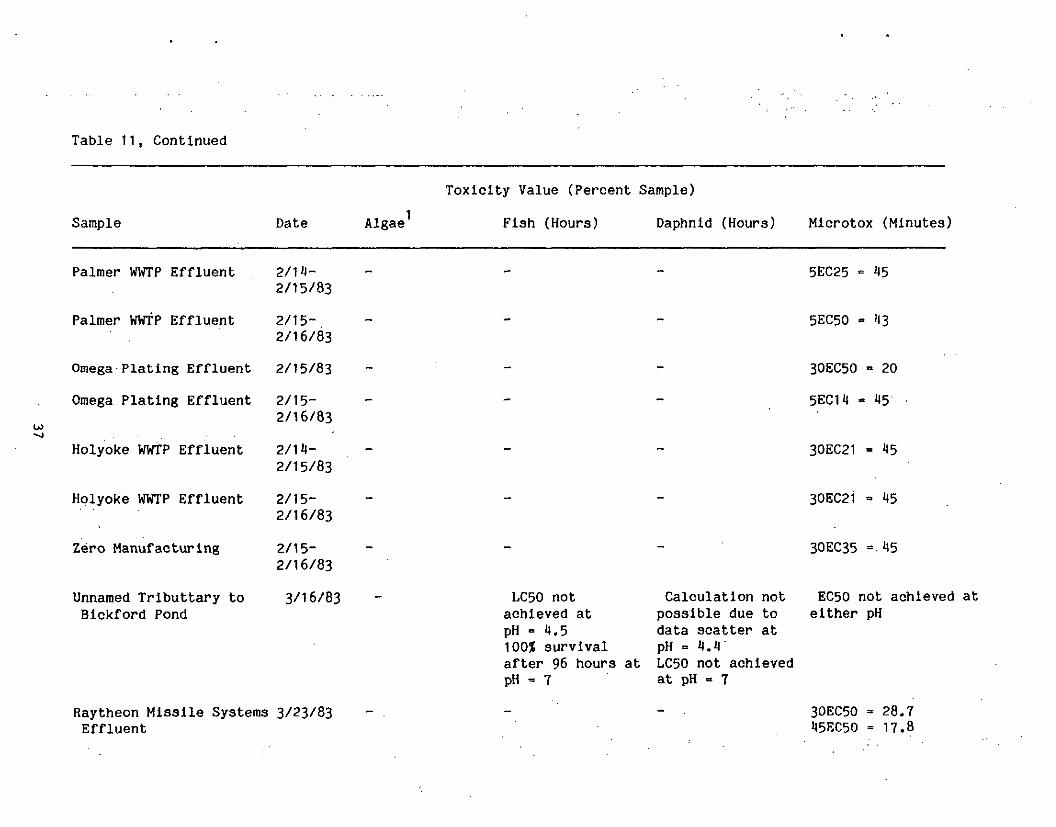
Table 11, Continued
Sample Date Algae
Toxicity Value (Percent Sample)
Fish (Hours) Daphnid (Hours) Microtox (Minutes)
UJ
Palmer WWTP Effluent
Palmer WWTP Effluent
Omega-Plating Effluent
Omega Plating Effluent
Holyoke WWTP Effluent
Hplyoke WWTP Effluent
Zero Manufacturing
Unnamed Trlbuttary toBickford Pond
2/14-2/15/83
2/15-2/16/83
2/15/83
2/15-2/16/83
2/14-2/15/83
2/15-2/16/83
2/15-2/16/83
3/16/83 LC50 notachieved atpH = 4.5100* survival
Calculation notpossible due todata scatter atpH = 4.4
after 96 hours at LC50 not achievedpH = 7 at pH « 7
5EC25 = 45
5EC50 » 43
30EC50 = 20
5EC14 - 45 •
30EC21 = 45
30EC21 = 45
30EC35 =-45
EC50 not achieved ateither pH
Raytheon Missile Systems 3/23/83Effluent
30EC50 = 28.745EC50 = 17.8
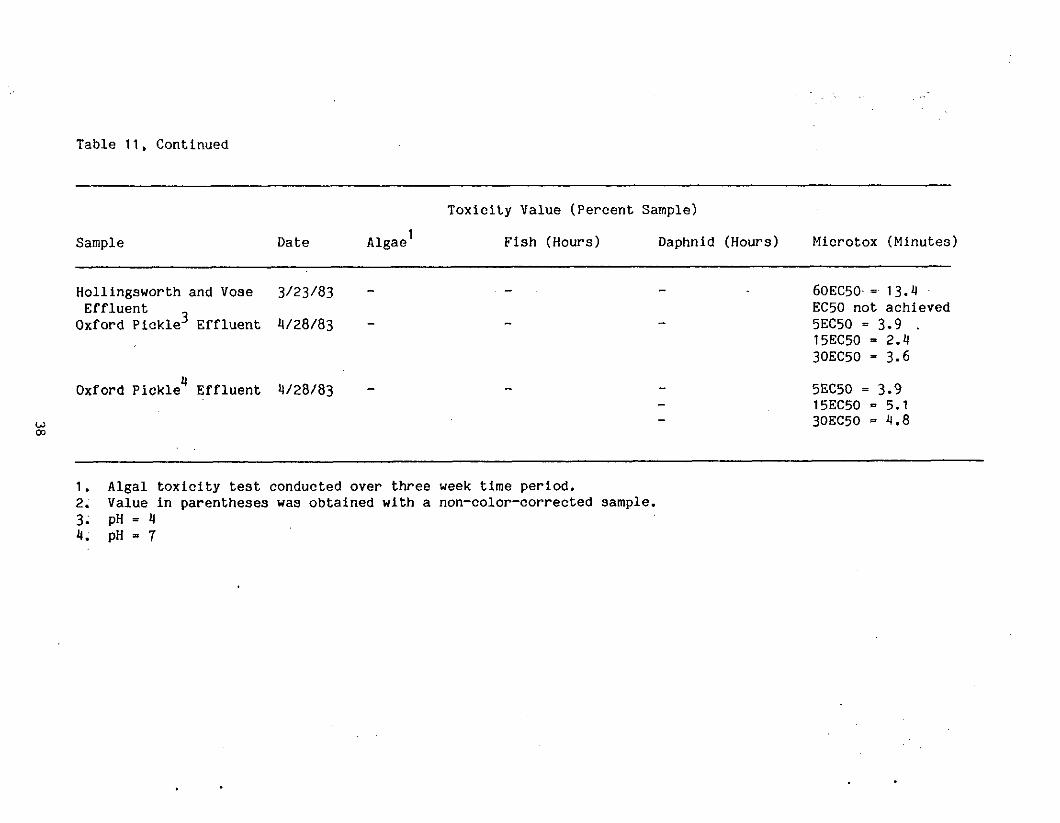
Table 11t Continued
Sample Date Algae
Toxicity Value (Percent Sample)
Fish (Hours) Daphnid (Hours) Microtox (Minutes)
Hollingsworth and Vose 3/23/83EffluentOxford PickleJ Effluent 4/28/83
Oxford Pickle Effluent 4/28/83
60EC50- = 1 3 - 4EC50 not achieved5EC50 = 3.9 .15EC50 = 2.430EC50 =3-6
5EC50 =3.915EC50 - 5.130EC50 =4.8
00
1. Algal toxicity test conducted over three week time period,2. Value in parentheses was obtained with a non-color-corrected sample,3. pH = 44. pH = 7
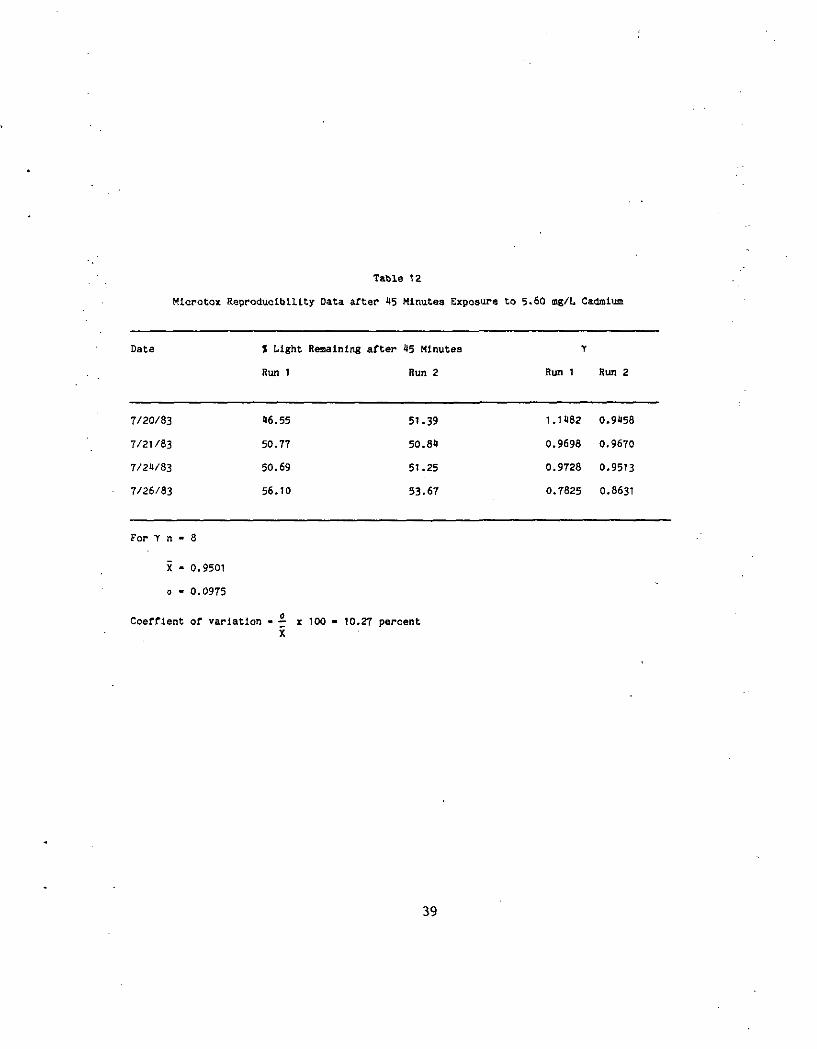
Table 12
Microtox Reproducl.btH.ty Data after 15 Minutes Exposure to 5.60 mg/L Cadmium
Date % Light Remaining after $5 Minutes
Run 1 Run 2
7/20/83 16.55 51-39
7/21/83 50.77 50.81
7/2U/83 50.69 51.25
7/26/83 56.10 53.67
For T n - 8
X - 0.9501
o - 0.0975
Y
Run 1 Run 2
1.1182 0.9158
0.9698 0.9670
0.9728 0,9513
0.7825 0.8631
Coefflent of variation - — x 100 - 10,27 percent
39
XI. Conclusions
The research efforts at the University of Massachusetts' ,Environmental Engineering Laboratory, as well as those of previouslymentioned authors (Curtis et al., 1982; Bulich et al., 1979; Peltierand Weber, 1980; Neiheisel et al., 1982; Beckman, I982a; Lebask etal., 1981; Strosher et al., 1980; Chang, et al., 1981), makepossible a comparison between the Microtox toxicity testing systemand more conventional methods for determining aquatic toxicity.This comparison indicates that there are differences between thefish, invertebrate, and Microtox data. It should not be surprisingthat 100 percent correlation was not observed between the Microtoxtoxicity test and other test organisms. Responses are known to varybetween fish and invertebrates and even, for that matter, betweendifferent species of the same test organism. In many cases,Microtox shows greater sensitivity than other toxicity testingmethods. This is beneficial and would result in increasedprotection of aquatic systems. The major concern is the group ofcompounds shown to cause lethality to fish and invertebrates, butnot to the bioluminescent bacteria utilized in the Microtox test.
40
XII. Equipment, Supply and Time Requirements
The equipment, supply, and time requirements for Microtoxanalysis are shown in Tables 13 and 14. The Microtox toxicity testis considerably less expensive and quicker to conduct than othermethods of assessing aquatic toxicity currently in use.Approximately two hours and 15 minutes are required for an entireMicrotox analysis. This figure excludes sampling time which isdependent on site location. A single technician, then, should becapable of processing about ten samples per week, or 500 samples peryear Inclusive of data analysis.
Table 15 details the direct costs, in 1983 dollars, of aMicrotox Laboratory. Approximately $21,000 are required toestablish a laboratory and furnish supplies for one year of Microtoxanalyses (500 tests). This figure includes the initial capital costof the Microtox Toxicity Analyzer C$9,135). The cost for eachadditional year's worth of supplies is about $11,000. If thecapitol cost of the Microtox instrument is distributed over thefirst year without considering interest, then cost per analysis is$72 assuming one technician performs 500 analyses in this period.The cost per analysis, excluding the Microtox instrument capitolinvestment, is $52.
41
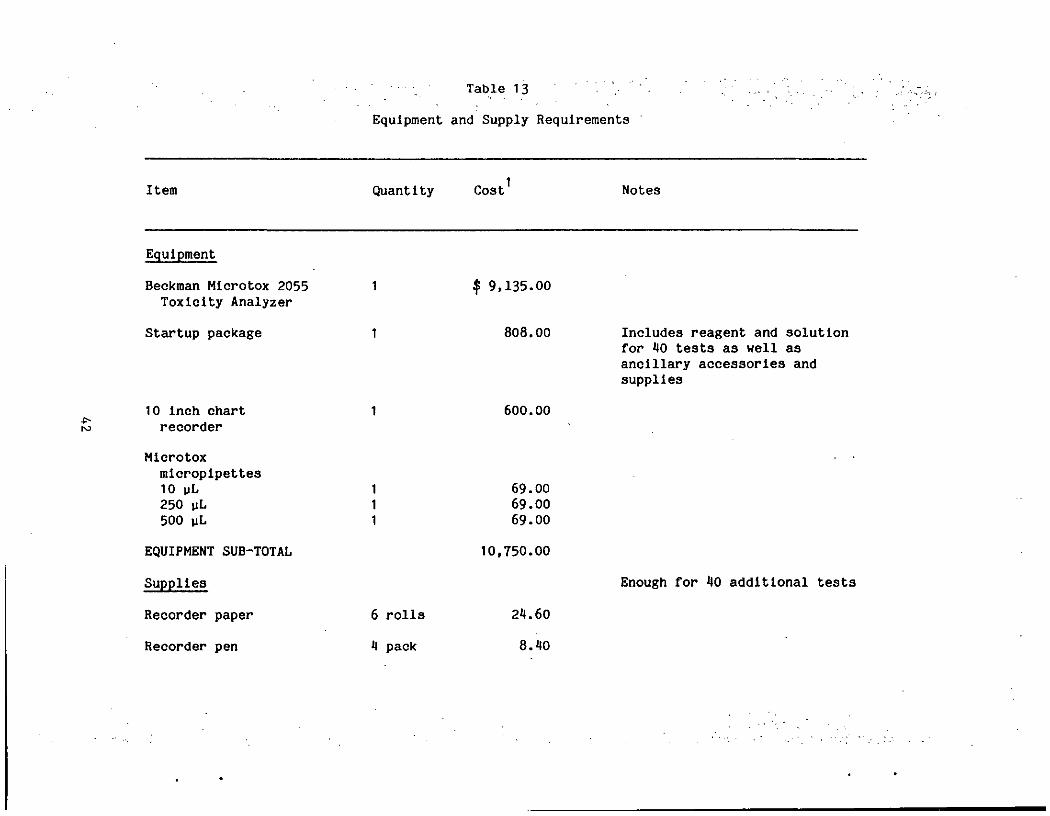
Table 13 '.
Equipment and Supply Requirements
Item Quantity Cost Notes
Equipment
Beckman Microtox 2055Toxlolty Analyzer
Startup package
10 Inch chartrecorder
Microtoxmlcroplpettes10 pL250 uL500 nL
EQUIPMENT SUB-TOTAL
Supplies
Recorder paper
Recorder pen
6 rolls
1 pack
9,135.00
808.00
600.00
69.0069.0069.00
10,750.00
21.60
8.10
Includes reagent and solutionfor 10 tests as well asancillary accessories andsupplies
Enough for 10 additional tests
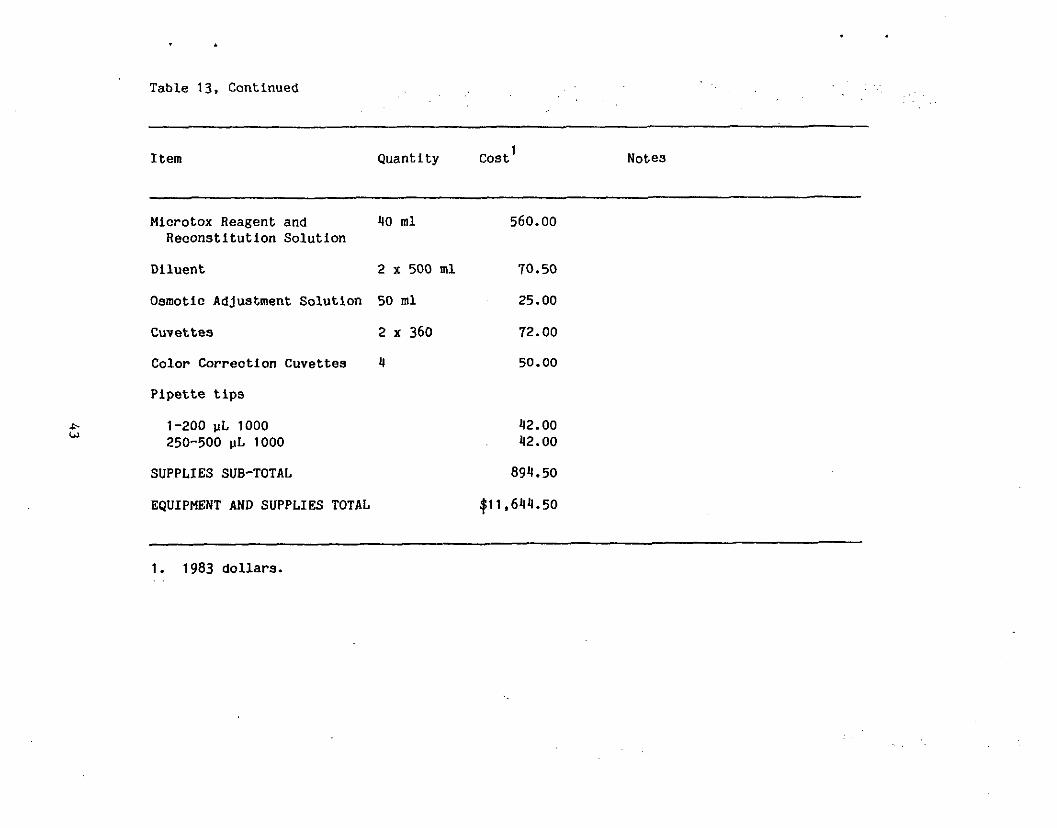
Table 13, Continued
Item Quantity Cost Notes
Microtox Reagent and 40 ml 560.00Reconstitutlon Solution
Diluent 2 x 500 ml 70.50
Osmotic Adjustment Solution 50 ml 25.00
Cuvettes 2 x 360 72.00
Color Correction Cuvettes 4 50.00
Pipette tips
1-200 uL 1000 42.00250-500 pL 1000 42.00
SUPPLIES SUB-TOTAL 894.50
EQUIPMENT AND SUPPLIES TOTAL $11,644.50
1. 1983 dollars.
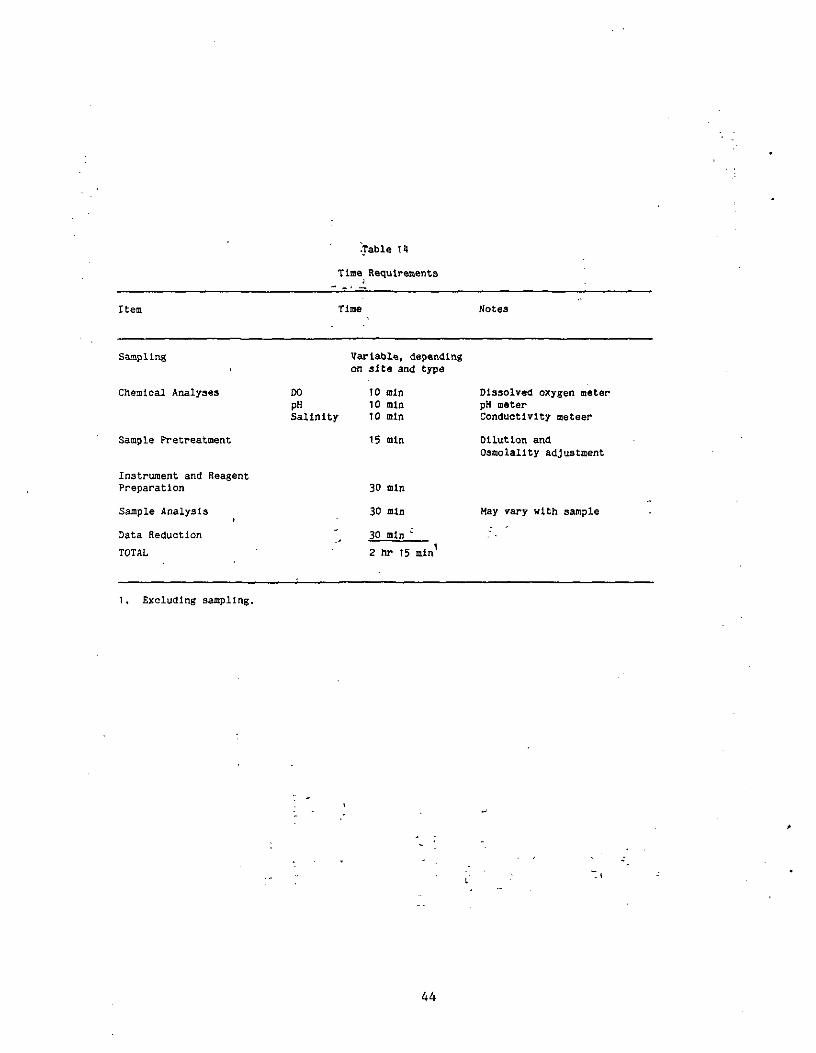
Table U
Tine Requirements
Item Time Notes
Sampling
Chemical Analyses
Sample Pretreatment
Instrument and ReagentPreparation
Sample Analysist
Data Reduction
TOTAL
Variable, dependingon site and type
DO 10 mlnpH 10 mlnSalinity 10 mtn
15 nin
30 mln
30 min
30 mln "
Dissolved oxygen meterpH meterConductivity meteer
Dilution andOsmolallty adjustment
May vary with sample
2 hr 15 min
1. Excluding sampling.
44
Table 15
Estimated Direct Costa to Conduct a Single Mlcrotox Teat
Item Quantity
A. Capital cost to establish laboratory $21,0372
with one year'3 supplies
B. Technician, annual salary $15,000
C. Number of assays conducted 500
by one technician per year
D. Yearly supply coats $11,181
Cost per teat, assuming capital $72ia repaid during first year
t(A
E. Cost per teat after capital $52expense la repaid- [(B + D)/C]
1. Cost per test would be leaa if proportion of capital expenses assigned to each bioassaywaa distributed over more years. These costs exclude sampling.
2. Cost includes $10,750 equipment and supplies (40 testa) plus additional suppliea tocomplete 500 teats - $10,237.
3. Assumes ten tests per week for one year.4. Excluding interest.
45
XIII. References
Beckman, Inc., 1980, 'Microtox Model 2055 Toxicity Analyzer System1,Bulletin 6984, Beckman Instruments, Inc., 8 pp.
Beckman, Inc., 1982a, 'Microtox Application .Notes No.- M104:Toxicity Testing of Complex Effluents', Beckman Instruments, Inc.,2 pp. .
Beckman, Inc., 1982b, 'Microtox System Operating Manual1, BeckmanInstruments, Inc., 59 pp.
Beckman, Inc., 1983, 'Microtox Application Notes: MicrotoxReproducibility Data', Beckman Instruments, Inc., 1 p.
Bulich, Anthony A. and Green, Malbone W,, 1978, 'The Use ofLuminescent Bacteria for Biological Monitoring of Water Quality',Proceedings of the International Symposium on AnalyticalApplications ,of Bioluminescence and Chemoluminescence, pp. 193~211.
Bulich, Anthony A., Greeen, Malbone W., and Isenberg, Dan L., 1979,'The Reliability of the Bacterial Luminescence Assay for theDetermination of Toxicity of Pure Compounds and Complex Effluents',Submitted to Proceedings of the Fourth Annual Symposium on AquaticToxicology, American Society for Testing and Materials, 17 pp.
Chang, Jeng C., Taylor, Phyllis B., and Leach, Franklin R., 1981,'Use of the Microtox Assay System for Environmental Samples', Bull.Environmental Contam. Toxicol., 26, pp. 150-156.
Christensen, Eric R., 1983, "Dose-Response Functions in AquaticToxicity Testing and the Weibull Model", Water Res., 18:2, 213-221.
Curtis, Carolanne, Lima, Ann, Lozano, Stephan J., and Veith, GilmanD., 1982, 'An Evaluation of a Bacterial Bioluminescence Bioassay asa Method for Predicting Acute Toxicity of Organic Chemicals toFish', Aquatic Toxicology and Hazard Assessment: Fifth Conference,ASTM STP766, J. G. Pearson, R. B. Foster, W. E. Bishop, Editors,American Society for Testing and Materials, pp. 170-178.
Dutka, B. J. and Kwan, K. K., 1981, 'Comparison of Three MicrobialToxicity Screening Tests with the Microtox Test1, Bull.Environmental Contam. Toxicol., 27, pp. 753~757.
Indorato, A. M., Snyder, K. B., and Usinowicz, P. J., 1983,'Toxicity Screening Using Microtox', Submitted for inclusion in theProceedings of the First International Symposium on Toxicity TestingUsing Bacteria, The National Water Research Institute, Ontario,Canada, 22 pp.
46
Kavanagh, Frederick, 1947, 'Antiluminescent Activity ofAntibacterial Substances', Bull, of the Torrey Botanical Club, 74:5,•pp. 414-425.
Lebsack, M. E.,Anderson, A. D., De Graeve, G. M., and Bergman,H. L., 1981, 'Comparison of Bacterial Luminescence and Fish BioassayResults for Fossil-Fuel Process Waters and Phenolic Constituents',Aquatic Toxicology and Hazard Assessment: Fourth Conference, ASTMSTP737, D, R. Branson and K. L. Dickson, Editors, American Societyfor Testing and Materials, pp. '338-3*17.
Mallack, Frank P., and Brunker, Richard L., 1983, 'Determination ofthe Toxicity of Selected Metalworking Fluid Preservatives by Use ofthe Microtox System and an In Vitro Enzyme Assay1, Submitted forinclusion in the Proceedings of the First International Symposium onToxicity Testing Using Bacteria, The National Water ResearchInstitute, Ontario, Canada, 19 pp.
Neiheisel, Timothy W., Horning, William B., Petrasek, Albert C.,Asberry, Vivian R., Jones, Debbe A., Marcum, Ronda L., and Hally,Christopher T., 1982, 'Effects on Toxicity of Priority PollutantsAdded to a Conventional Wastewater Treatment System' ProjectSummary, United States Environmental Protection Agency, Office ofiesearch and Development, Environmental Monitoring and SupportLaboratory, 18 pp.
Nealson, K. H., and Hastings, J. W., 1979, 'BacterialBioluminescence: Its Control and Ecological Significance1,Microbial Reviews, 43:4, pp. 496-518.
Peltier, William and Weber, Cornelius I., 1980, 'Comparison of theToxicity of Effluents to Fish, Invertebrates and Microtox', UnitedStates Environmental Protection Agency, Biological Methods Branch,Environmental Monitoring and Support Laboratory, 5 pp.
Plotkin, Stephen, and Ram, Neil, 1983a, 'Acute Toxicity Tests:General Description and Materials and Methods Manual. I. Fish',University of Massachusetts Environmental Engineering Publication . •Env. E. 72-83-3.
Plotkin, Stephen, and Ram, Neil, 1983b, 'Acute Toxicity Tests:General Description and Materials and Methods Manual. II.Daphnia', University of Massachusetts Environmental EngineeringPublication Env. E. 73-83~4.
Qureshi, A. A., Flood, K. W., Thompson, S. R., Janhurst, S. M.,Inniss, C. S., and Rokosh, D. A., 1980, 'Comparision of aLuminescent Bacterial Test wiof the Fifth Annual Symposium on Aquatic Toxicology,American Society for Testing and Materials.
47
Rake, Geoffrey, Jones, Helen, and McKee, Clara M.,'Antiluminescent Activity and Antibiotic Substances,' Proceedings ofthe Society of Experimental Biology and Medicine, 52, pp. 136-138.
Samak, Q. M. and Noiseux, R., 1980, 'Acute Aquatic ToxicityMeasurement by the Beckman Microtox', Presented at the 7th AnnualAquatic Toxicity Workshop, Montreal, Canada, 18 pp.
Serat, William F., Kyono, Jordan, and Mueller, Peter K., 1969,'Measuring the Effect of Air Pollutants on Bacterial Luminescence:A Simplified Procedure,1 in Atmospheric Environment, Pergamon Press,3, pp. 303-309.
Strehler, Berhard L., 1968, 'Bioluminescence Assay: Principles andPractice', Methods of Biochemical Analysis, 16, pp. 99~181.
Strosher, M. T., Younkin, W. E. and Johnson, D. L., 1980,'Environmental Assessment of the Terrestrial Disposal of WasteDrilling Muds in Alberta', Pre-print copy, Canadian PetroleumAssociation, pp. 8-58-8-67.
Toxicity Screening Procedures Using Bacterial Systems, In Print,Proceedings of the First International Symposium on Toxicity TestingUsing Bacteria, B. J. Dutka and D. Liu, Editors, Marcel Dekker,Inc., New York.
United States Environmental Protection Agency, 1981,'Interlaboratory Comparison Acute Toxicity Testing Set,1 EPA 600/3-82-005, 26 pp.
Vasseur, P., Fernard, J. F., Rast, C. and Lurbaigt, G., In Print,'Interest in Luminescent Marine Bacteria in Ecotoxicity ScreeningTests of Complex Effluents and Comparison with Daphnlamagna',Proceedings of the First International Symposium on ToxicityTesting Using Bacteria, B, J. Dutka and D. Liu, Editors, MarcelDekker, Inc., New York.
48 .
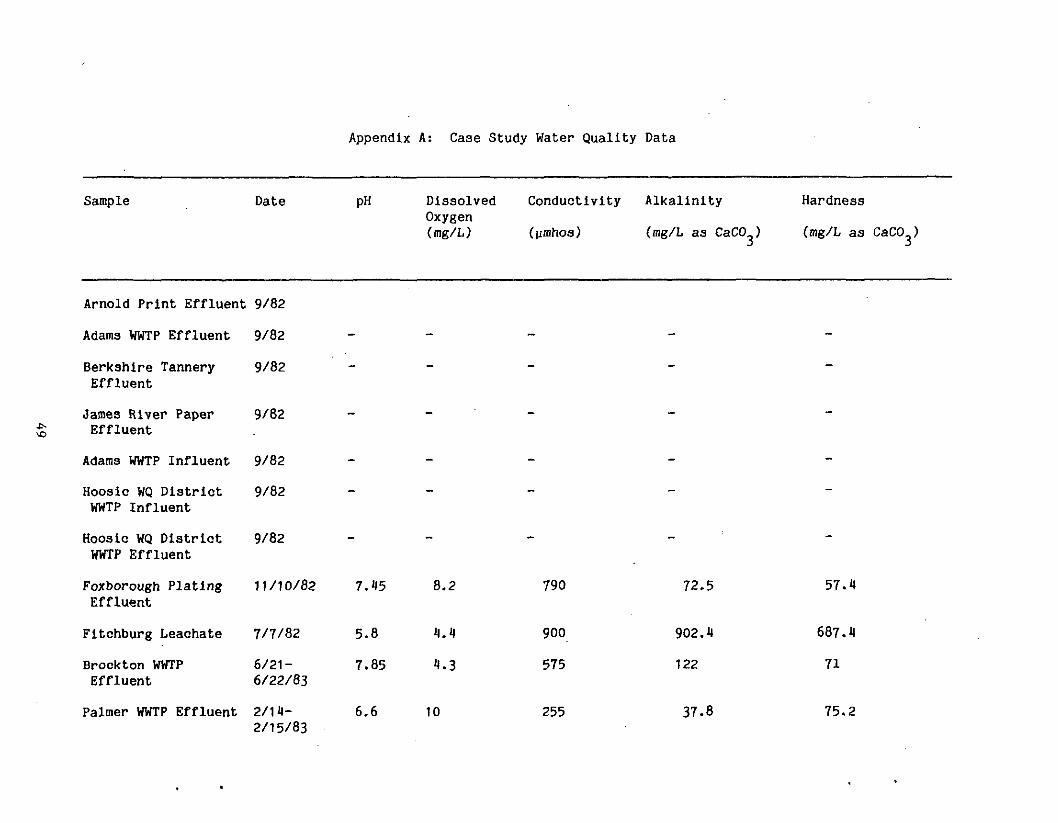
Appendix A: Case Study Water Quality Data
Sample
Arnold Print Effluent
Adams WWTP Effluent
Berkshire TanneryEffluent
James River PaperEffluent
Adams WWTP Influent
Hoosic WQ DistrictWWTP Influent
Hoosic WQ DistrictWWTP Effluent
Foxborough PlatingEffluent
Fitchburg Leachate
Brockton WWTPEffluent
Palmer WWTP Effluent
Date pH Dissolved Conductivity Alkalinity HardnessOxygen(mg/L) (iimnos) (mg/L as CaCO ) (mg/L as CaCO )
9/82
9/82 -
9/82 -
9/82 ' -
9/82 -
9/82 -
9/82 - _
11/70/82 7.15 8.2 790 72,5 57*4
7/7/82 5.8 4.4 900 902.4 687.4
6/21- 7.85 4.3 575 122 716/22/83
2/14- 6.6 10 255 37.8 75.22/15/83
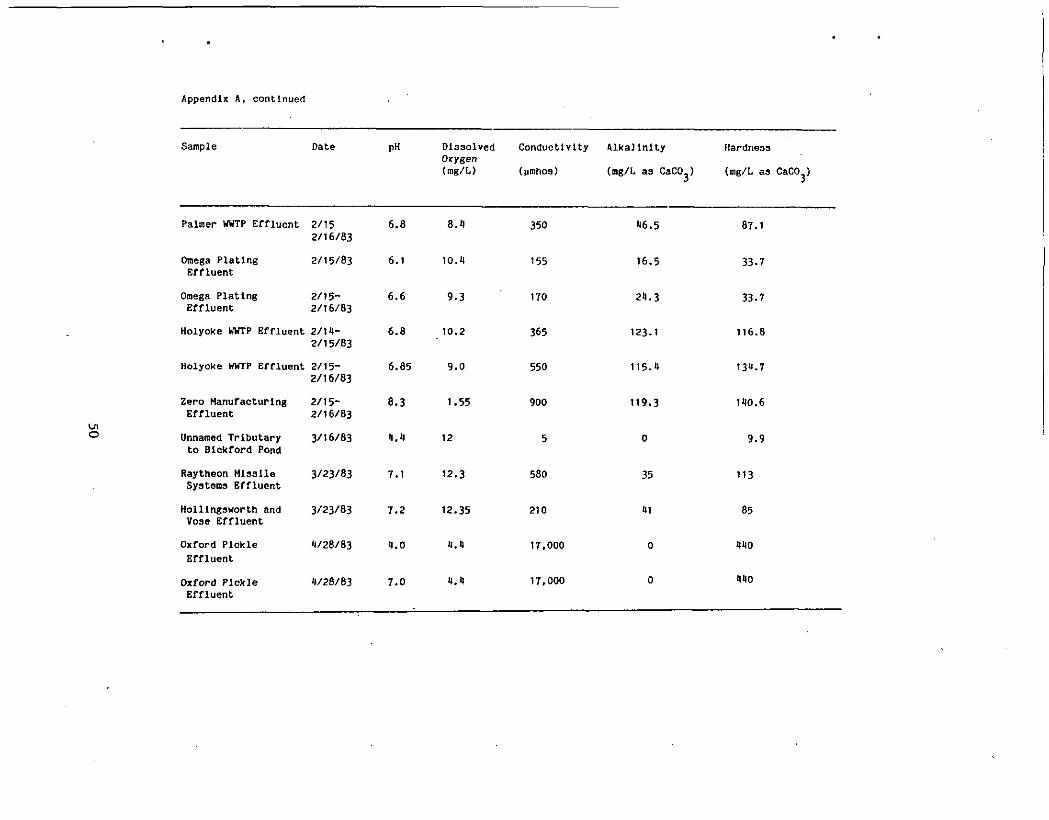
Appendix A, continued
Sample
Palmer WWTP Effluent
Omega PlatingEffluent
Omega PlatingEffluent
Holyoke WHIP Effluent
Holyoke HWTP Effluent
Zero ManufacturingEffluent
Unnamed Tributaryto Bickford Pond
Raytheon MissileSystems Effluent
Holllngsworth andVose Effluent
Oxford PickleEffluent
Oxford PickleEffluent
Date
2/152/16/83
2/15/83
2/15-2/16/83
2/14-2/15/83
2/15-2/16/83
2/15-2/16/83
3/16/83
3/23/83
3/23/83
4/28/83
4/28/83
pH
6.8
6.1
6.6
6.8
6.85
8.3
4.4
7.1
7.2
4.0
7.0
DissolvedOxygen(mg/L)
8.4
10.4
9.3
10.2
9.0
1.55
12
12.3
12.35
4.4
4.4
Conductivity Alkalinity
(ymhos) (mg/L as CaCO,)
350 46.5
155 16.5
170 24.3
365 123-1
550 115.4
900 119.3
5 0
580 35
210 41
17.000 0
17,000 0
Hardness
(mg/L aa CaCO )
87.1
33-7
33.7
116.8
134.7
140.6
9.9
113
85
440
4HO
APPENDIX B
Studies on the Enhancement of the Microtox BioluminescentToxicity Test Using Two, Three and Four Component Chemical Systems
by
Neil M. Ram, PhDAssistant Professor of Civil Engineering
Kevin C. SheehanResearch Engineer
and
Richard EarlsGraduate Research Assistant
51
Table of Contents
Page
Introduction 56
Methods 56
Chemical Interactions 58
Results and Discussion 61
Conclusions 74
52
List of Tables
Table Title Page
1 Organic Chemicals Tested 57
2 Determination of Chemical Interactions 59
3 EC50 Values for Single Components at 1 5°C 63
H EC50 Values for Test Components plus 6612 mg/L Achromycin at 15 C
5 EC50 Values for Test Components plus 670.727 mg/L Methylene Blue at 15°C
6 EC50 Values for Test Components plus 55 mg/L 68Chloramphenicol at 15 C
7 Percent Light Remaining for Phenol (7.27 mg/L) 73and Chloroform (27 mg/L) Combined with EitherMethylene Blue, Chloramphenicol, NaASO orNaASCv, to Form a 3-Component System, T5°C
8 Percent Light Remaining Values of Four 75Component Mixtures containing 7.27 mg/L Phenolplus Three Additional Compounds at 15 C
54
List of Figures
Number Title Page
1 Graphical Determination of Light Diminution 62for Two Component Solute Mixture from SingleSolute Data
2 Log Percent Light Remaining after Exposure of 695 and 15 Minutes to 11 mg/L Achromycin, Phenol,and Phenol plus 11 mg/L Achromycin
3 Log Percent Light Remaining after Exposure of 705 and 15 minutes to 0.723 mg/L Methylene Blue,Acetone, and Acetone plus 0.723 mg/L MethyleneBlue
4 Log Percent Light Remaining after Exposure of 715 and 15 minutes to 55 mg/L Chloramphenicol,Phenol, and Phenol plus 55 mg/L Chloramphenicol
5 Percent Light Remaining after Exposure to 729.69 mg/L Chloroform, 23 mg/L Achromycin,72 mg/L Phenol, 5*4.5 mg/L Chloramphenicol,and 0.727 mg/L Methylene Blue
55
Introduction
The Microtox toxicity assay is a method to assess the toxicityof an aqueous sample using lyopholized and reconstituted luminousmarine bacteria. Upon exposure to a toxicant the amount of lightemitted by these luminous bacteria is diminished in directproportion to the toxicant concentration. The test is simple,accurate and reproducible and has therefore been suggested as ascreening procedure to evaluate toxicity prior to the utilization ofconventional fish or daphnid bioassays. One weakness of theMicrotox assay, however, is that it is not as sensitive to sometoxicants as are fish or daphnid bioassays. Many compounds testedto date exhibit an EC50 value (toxicant concentration resulting in a50 percent light diminution in the specified time interval) equal toor less than corresponding fish or daphnid LC50 values (seeLiterature Review), the utility of the Microtox determination wouldbe enhanced if the test could be modified to be more sensitive tosuch chemical toxicants. Possible modifications include the use ofa more sensitive mutant bacterial strain, change in the testconditions, or co-exposure of the toxicant to a synergisticchemical. The objective of this study.was to investigate severalchemicals for their potential to exhibit a synergistic response witha few selected toxicants. The study used the Microtoxbioluminescent test to assess the relationship between the toxicityexerted by chemical components singly, and in combinations of two,three and four chemicals. Co-exposure of a synergistic chemical anda toxicant under examination would result in greater lightdiminution during the Microtox assay and resulting enhanced.sensitivity.
Methods
ALL tests were performed using a Beckman Instruments Microtox
toxicity analyzer. Experiments were carried out at 15 C accordingto the procedures described by the manufacturer (Beckman, 1982b).Several organic compounds, shown in Table 1, were selected for thestudy. These substances are known chemical toxicants which havebeen found in point source discharges. Additionally, single soluteEC50 values have been previously determined for these chemicals.Three additional compounds (two antibiotic drugs, and onemacromolecular dye) were selected to determine if they exhibit asynergistic response with the six other organic compound shown inTable 1. All toxicants were diluted in one percent phosphate buffer(pH = 6.9) and adjusted to two percent salinity by weight with NaCl.EC50 values were determined for single solute systems as well as fortwo, three and four component systems using the Microtox toxicityanalyzer within three hours of dilution in the phosphate buffer.All reagents were of reagent grade, or were commercialpharmaceutical preparations. Both single and combined solutesystems were analyzed in parallel to decrease variations
56
Table 1. Organic Chemicals Tested
Compound Grade Supplier
Group 1: Known Chemical Toxicant
1. Phenol reagent Fisher Scientific Co., Inc.
2. Acetone reagent Fisher Scientific Co., Inc.
3. Chloroform reagent Fisher Scientific Co., Inc.
4. Endrin analytical U. S. Environmentalreference Protection Agencystandard
5. Toluene reagent Fisher Scientific Co., Inc.
6. Dimethyl reagent Fisher Scientific Co., Inc.' formamide (DMF)
-Group 2: Compounds Tested For Synergistic Response
1. Methylene blue 88 percent dye Fisher Scientific Co., Inc.
2. Achromycin Pharmaceutical Supply
3. Choramphenicol reagent Aldrich Chemical Co., Inc.
57
attributable to solute volatility or reagent variability. Toxicitywas evaluated by observing light diminution at a constant toxicantconcentration over time or by measuring light diminution after 5,15f and 30 minutes of exposure over a toxicant concentration range.In all tests, light diminution was measured relative to the standardMicrotox control.
Chemical Interactions
Several possible types of chemical interactions can occur inmixed solute systems:
1. Simple additive interaction in which the toxicity of thecombined toxicants is merely equal to the sum of theirindividual toxic effects;
2. Synergistic interaction in which the toxicity of thecombined toxicant solution is greater than the sum oftheir individual toxic effects; and
3. Antagonistic interaction in which the toxicity of thecombined toxicant solution is less than the sum of theirindividual toxic effects.
A mathematical model was therefore developed (Cristensen, 1983) topredict light diminution of solutions containing toxicant mixturesassuming simple additive (no interaction) toxicity. The type ofchemical interaction was then determined by comparing the observedresponse with that predicted by the model as shown in Table 2. Toconstruct the additive model it is assumed that light remaining
after exposing the Microtox reagent to a combination of toxicants TT
Y is the same as light remaining after a sequential exposure to eachsingle solute (Y ). If we let Y designate the fraction of light
^remaining at a stated time, t, then the above assumption can bestated mathematically as:
iTT Y = (Y ) (Y ) ... (Y ) (1)
iwhere TT Y = Fraction of light remaining after exposure of
n=1Microtox reagent to i chemicals in solution,
Y = Fraction of light remaining after exposure of3
Microtox reagent to single toxicant atconcentration, X..
58
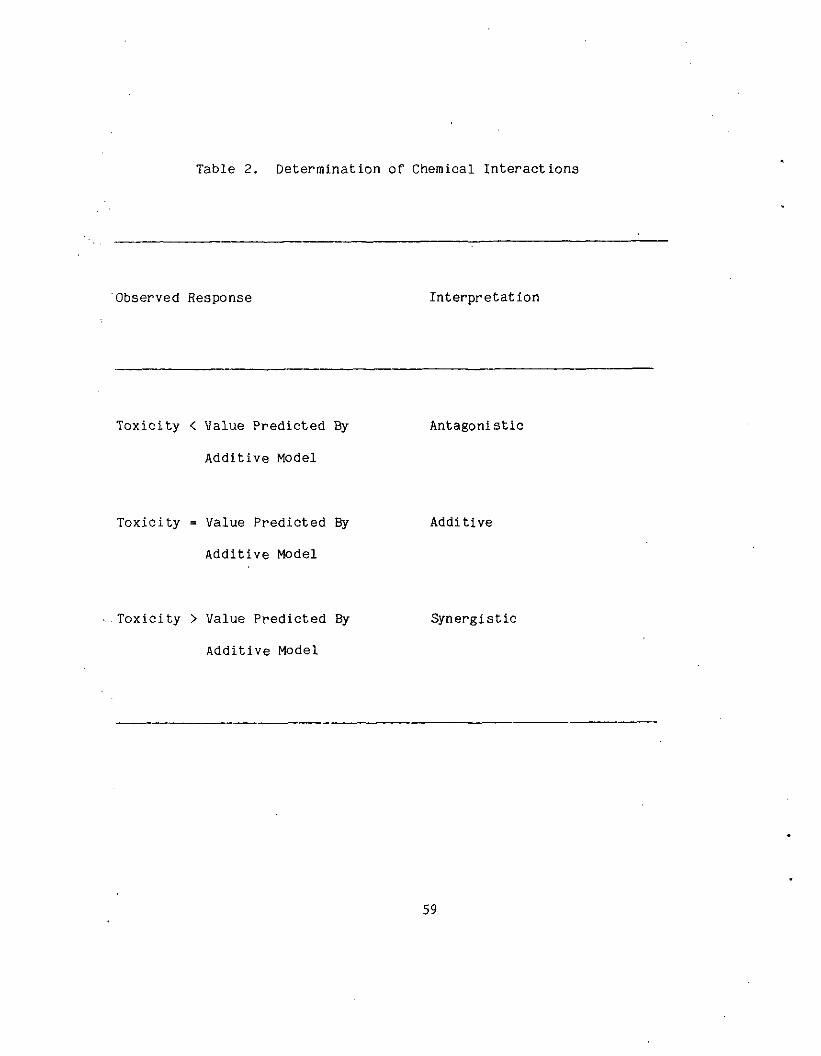
Table 2. Determination of Chemical Interactions
Observed Response Interpretation
Toxicity < Value Predicted By
Additive Model
Antagonistic
Toxicity = Value Predicted By
Additive Model
Additive
Toxicity > Value Predicted By
Addi t ive Model
Synergistic
59
Light diminution of the Microtox reagent often follows a first orderrate of decay with time as well as with increasing toxicantconcentration. We can therefore represent the relationship betweenthe fraction of light remaining (Y) and time (t) at a given toxicantconcentration (X.) as:
Y = Ae"Zt ' . (2)
Y = Ae H)IP «« {$j
where Y. and Y? are the values for the fraction of l.ight remaining
at time, t, for toxicant X and X?, respectively. A is a constant
which is equal to 1 (100 percent light output at t - 0). Combiningequations 1-3 to obtain the light remaining for a mixture oftoxicants X and X?, assuming an additive (no interaction) effect
one obtains equation 4:
~* (w + z 51Y3 = n-1 " W
where w and z are the rate decay constants for the single solutespecies.
Similarly, one can derive the relationship between the fractionght remaining (Y) and toxicant conce;
constant time by the following equations:
of light remaining (Y) and toxicant concentration (X ) at some
-zx= Ae (5)
-wx= Ae * (6)
2 -(ZX + WX )Y_ = Y. = Ae ' * (7)J n = 1 1
Equation 7 represents the light remaining at some exposure time to amixture of two toxicants, having concentration of X. and Xp,
60
respectively and Z and W are the concentration decay constants. Itassumes a simple additive (no interaction) relationship. Equation 7can be expanded into:
-ZXY = Ue
-WX,) (Ae (8)
This represents the product of the light remaining at some time fortoxicant X and toxicant X . Thus the light remaining for a mixture
of "n" toxicants can simply be obtained by multiplying by thepercent light remaining for each single solute toxicant forn solutes in solution. This approach gives the 'predicted* lightremaining for a solution containing n toxicants, assuming simpleadditive interaction.
Equations 2-8 are only valid if light diminution follows afirst order rate of decay with time or toxicant concentration. Themodel can be expanded to predict light diminution of toxicantmixtures which do not obey this first order decay, using thegraphical approach shown in Figure 1. The decay pattern forcompound !B' is graphically subtracted from the decay pattern forcompound 'A1 to obtain the predicted light decay pattern for themixture of compound A + B, assuming an additive interaction. Thisis performed by superimposing the light decay pattern for compound Bfrom data points located on the light decay pattern for compound Aand then transposing the light decay pattern for compound A ontothat for compound B. An example of this is shown in Figure 1. Thepercent differences in predicted vs. observed values for themixtures were calculated using equation 9.
Percent =Difference
Predicted %ils. .remaining
Observed %lightremaining
Predicted %lightremaining
]-x 100
(9)
A negative value indicated that the observed toxicity was less thanthat predicted by simple additive interaction (antagonism) while apositive value indicated a synergistic interaction.
Results and Discussion
Table 3 presents EC50 values for single components at 15 C, forvarious exposure times, reported as mg/L and moles/L. Some of theobserved EC50 values were in close agreement with previouslyreported values (phenol, acetone), while others were significantlyhigher (chloroform) or lower (toluene, DMF), Dutka and Kwan (1981)reported intra and inter-laboratory analysis variability of up to 65
61
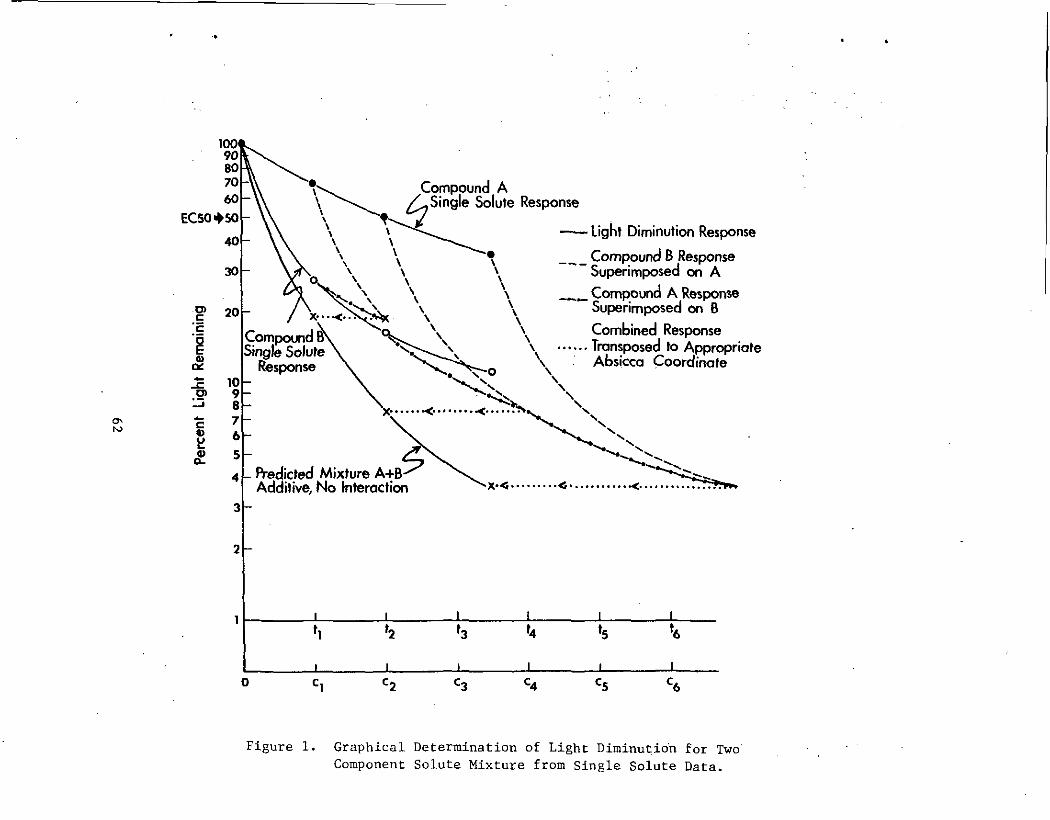
^Compound A'Single Solute Response
o>c'c
<D
0>O-
20
CompoundBSingle Solufe
Response109876
5
4
—— Light Diminution Response
Compound B Response"*~ Superimposed on A
_^_ Compound A ResponseSuperimposed on B
Combined ResponseTransposed to AppropriateAbsicca Coordinate
4A+B"^"^_ FVedicted Mixture
Additive, No Interaction
Figure 1. Graphical Determination of Light Diminution for TwoComponent Solute Mixture from Single Solute Data.
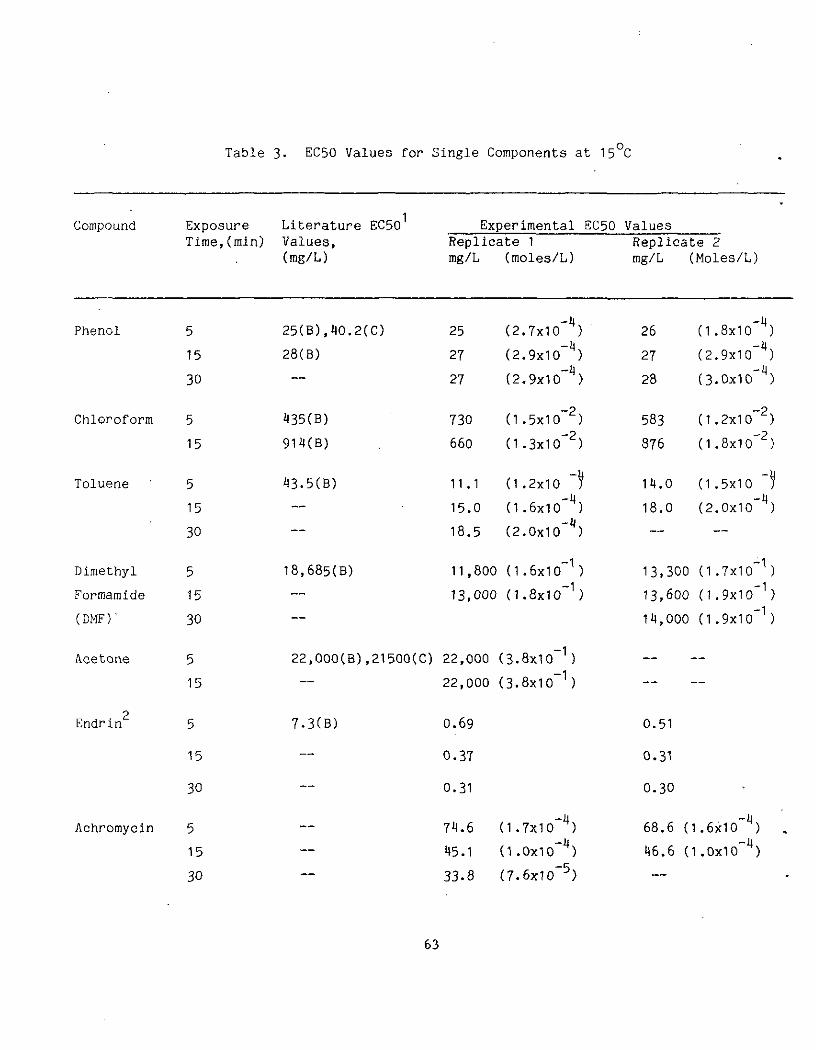
Table 3- EC50 Values for Single Components at 15 C
Compound Exposure Literature EC50 Experimental EC50 ValuesTime,(min) Values, Replicate 1
(mg/L) mg/L (moles/L)
Phenol
Chloroform
Toluene
Dimethyl
Formamide
(DMF)'
Acetone
2Endrin
Achromycin
5
15
30
5
15
5
15
30
5
15
30
5
15
5
15
30
5
15
30
25(B),40.2(C) 25
28(B) 27
27
435(B) 730
914(B) , 660
43.5CB) 11.1
15.0
18.5
18,685(8) 11,800
13,000
—
22,000(B),21500(C) 22,000
22,000
7.3CB) 0.69
0.37
0.31
74.6
45. 1
33.8
(2.7x10 )
(2.9x10~ )
(2.9x10-il)
(1.5x10~2)
(1.3x10~2)
(1 .2x10 ~—4
(1.6x10 )
(2.0x10~ )
(1.6x10~1)
(1.Sx10~1)
(3.8x10~1)
(3.8x10~1)
(1.7X10"11)
(1 .0x10 )
(7.6x10~5)
Replicate 2mg/L (Moles/L)
26 (1.8X10'4)
27 (2.9x10 )
28 (3.0x10' )
583 (1.2x10~2)
876 (1.8x1o"2)
14.0 (1 .5x10 ~!-4
18.0 (2.0x10 )
—
13,300 (1.7X10"1)
13,600 (1.9x10~1 )
14,000 (1.9x10~1)
— —
—
0.51
0.31
0.30
68.6 (1.6X10*11) ,
46.6 (l.oxio"11)
—
63
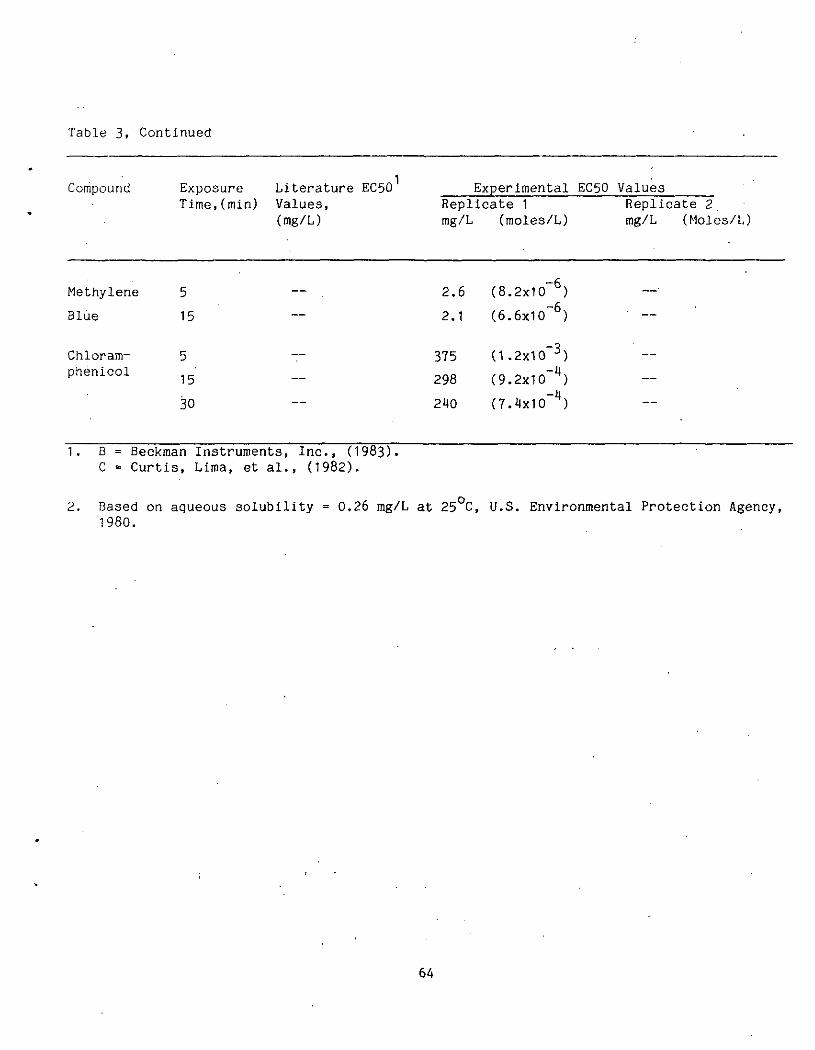
Table 3, Continued
Compound
Methylene
Blue
Chloram-phenicol
Exposure Literature EC50Time, (min) Values,
(mg/L)
5
15
5
15
30
ExperimentalReplicate 1mg/L (moles/L)
2.6 (8.2x10~6)
2.1 (6.6x10~6)
375 (1.2x10~3)
298 (9.2xlO~ )
2UO (7.4x10 )
EC50 ValuesReplicate 2mg/L (Moles/L)
—
1. B = Beckman Instruments, Inc., (1983).C = Curtis, Lima, et al., (1982).
2. Based on aqueous solubility = 0.26 mg/L at 25 Ct U.S. Environmental Protection Agency,1980.
64
percent for the Microtox test. Beckman Incorporated (1983)additionally reported an 11 percent coefficient of variation forrepresentative analyses. The observed discrepancy with somepreviously reported EC50 values, therefore, seems reasonable inlight of the observed variability of the test data. Suchvariability may be attributable to slight time variations, pipettingprecision, variations in Microtox reagent, and in some cases, solutevolatility. In addition, variances in data reported for thisresearch can be attributed to different periods of data generation.
Tables 4, 5, and 6 present observed and predicted EC50 valuesfor systems of test compounds combined with 12 mg/L achromycin,0.723 mg/L methylene blue, and 55 mg/L chloramphenicol,respectively. Predicted EC50 values were calculated using theadditive graphical approach described earlier. The data is furtherillustrated in Figures 2-4. Percent differences values indicateeither synergistic (+ value) or antagonistic (- value) interactions.These values however, were almost all less than five percent, withthe exception of chloroform which displayed a ten percent value(antagonistic) after 30 minutes of exposure with chloramphenicol.Considering the precision and accuracy reported by Beckman (1983)(and Dutka and Kwan (1981), the percent differences are most likelyinsignificant, indicating that the toxicity of the two component.systems are additive for the concentration tested. Figures 2, 3 and4 clearly illustrate the finding that none of the three * Group 2*compounds tested (Table 1) displayed a synergistic response incombination with the tested chemical toxicants. Instead, a simpleadditive response was observed. While the addition ofchloramphenicol, achromycin or "methylene blue failed to enhance thesensitivity of the Microtox test for the chemicals tested, the datadid verify the additive graphical mathematical model developed topredict light diminution of solutions containing toxicant mixturesassuming simple additive (no interaction) toxicity for toxicantmixtures which do not obey first order decay.
In addition to examining the relationship between lightdiminution and toxicant concentration, the study investigated thetime dependency of light diminution for single toxicant solutions.Figure 5 shows the effect of increasing exposure time on microbialbioluminescence for 9.69 mg/L chloroform, 23 mg/L achromycin, 72mg/L phenol, 54.6 mg/L chloramphenicol and 0.727 mg/1 methyleneblue. Chloroform resulted in a rapid decline in bioluminescence inthe first five minutes followed by a slight recovery. Achromycinshowed a steady decline in bioluminescence over the entire 30 minuteexposure period while methylene blue, chloramphenicol, and phenolresulted in the greatest percent light diminution during the firstfive minutes of exposure and was fairly constant, thereafter. Thesedata emphasize the importance of measuring light diminution atseveral periods of exposure.
Several three and four component mixtures were tested todetermine the types of interaction within such systems. Table 7
65
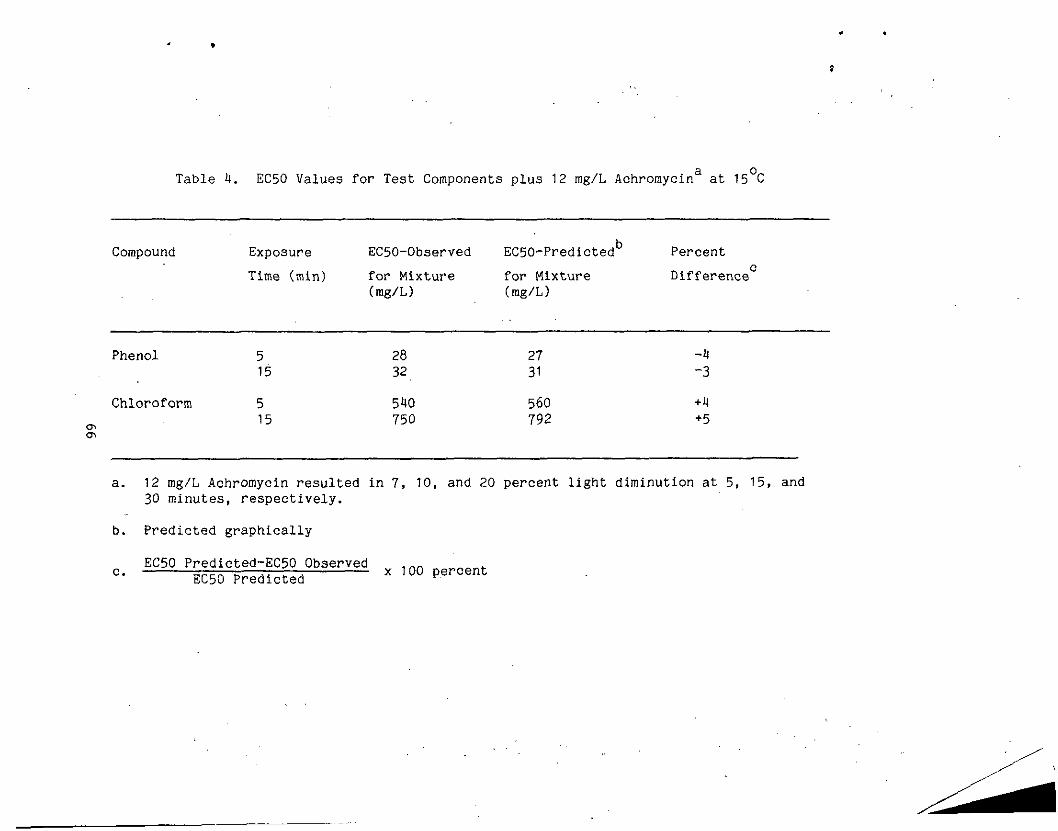
Table 4. EC50 Values for Test Components plus 12 mg/L Achromycin3 at 15 C
Compound
Phenol
Chloroform
Exposure
Time (min)
515
515
EC50-Observed
for Mixture(mg/L)
2832
540750
EC50-Predicted PercentQ
for Mixture Difference(mg/L)
27 -431 -3
560 +4792 +5
a.
b.
c.
12 mg/L Achromycin resulted in 7, 10, and 20 percent light diminution at 5, 15, and30 minutes, respectively.
Predicted graphically
EC50 Predicted-EC50 ObservedEC50 Predicted x 100 percent
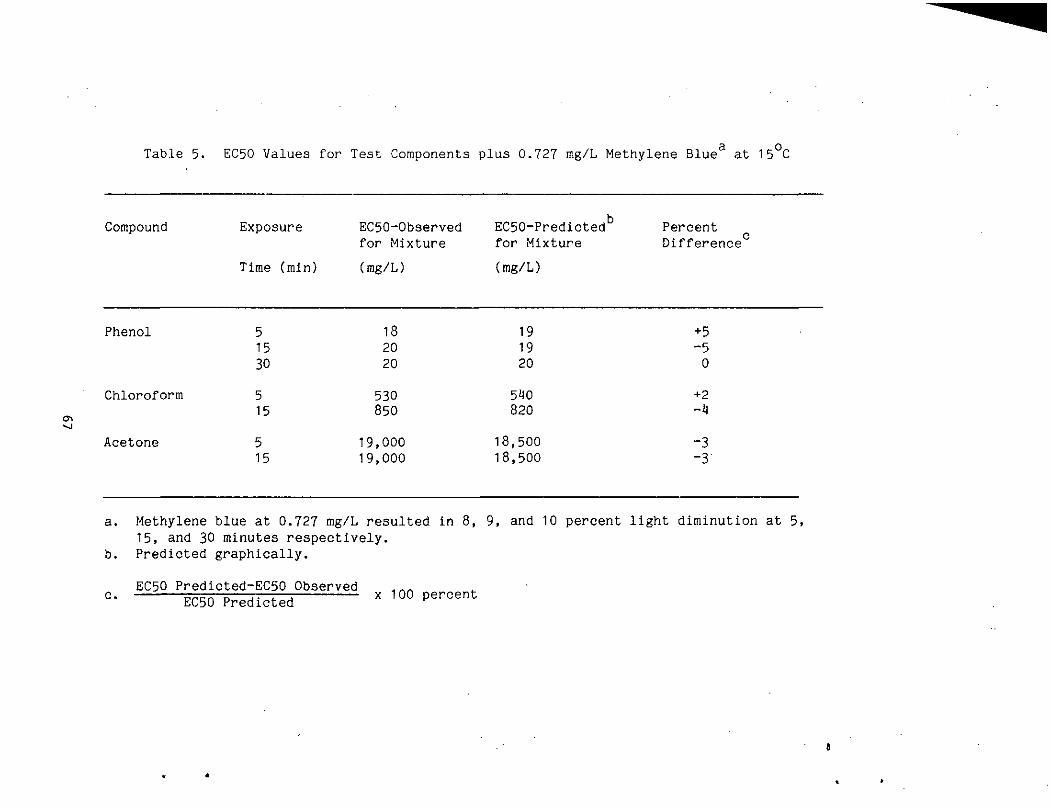
Table 5. EC50 Values for Test Components plus 0.727 mg/L Methylene Blue3 at 15°C
Compound Exposure
Time Crnin)
EC50-Observedfor Mixture
(mg/L)
EC50-Predictedfor Mixture
(mg/L)
PercentDifference
Phenol
Chloroform
Acetone
51530
515
515
182020
530850
19,00019,000
191920
540820
18,50018,500
+5-50
+2-U
-3-3
a.
b.
c.
Methylene blue at 0.727 mg/L resulted in 8, 9, and 10 percent light diminution at 5,15, and 30 minutes respectively.Predicted graphically.
EC50 Predicted-EC50 ObservedEC50 Predicted x 100 percent
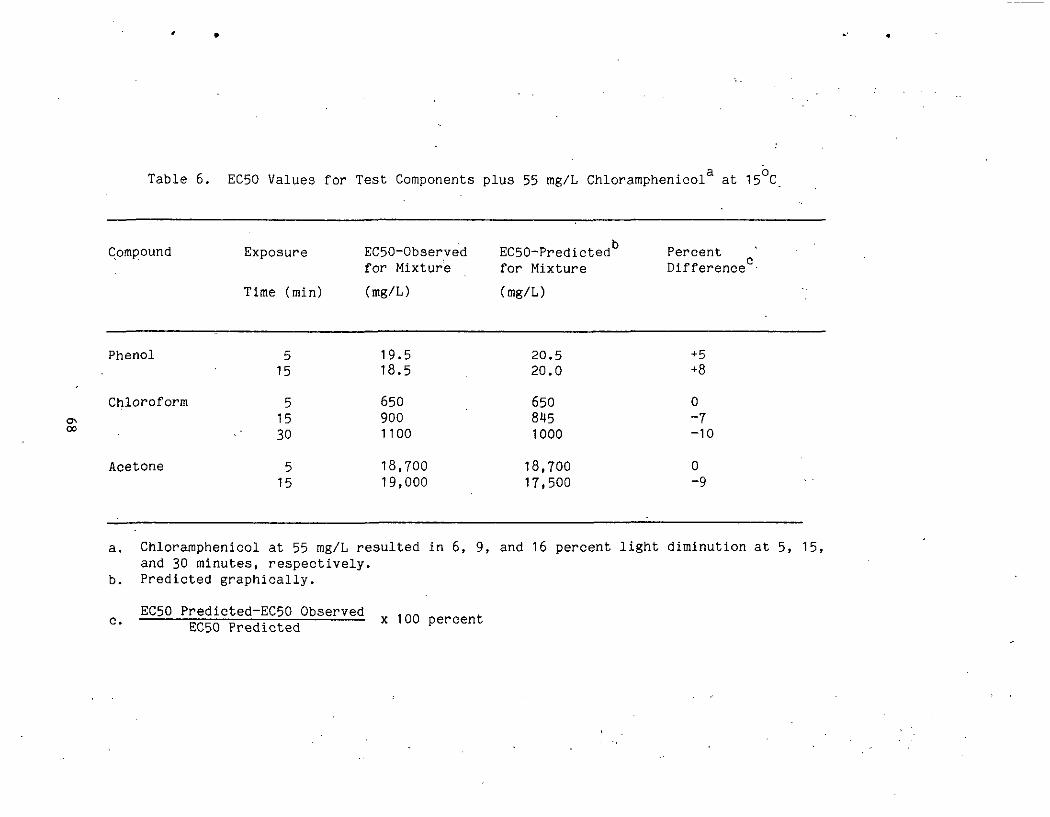
Table 6. EC50 Values for Test Components plus 55 mg/L Chloramphenicol3 at 15°C
Compound Exposure
Time (rain)
EC50-Obseryedfor Mixture
(mg/L)
EC50-Predictedfor Mixture
Cmg/L)
PercentDifference1
cr>oo
Phenol
Chloroform
Acetone
515
51530
515
19.518.5
6509001100
18,70019,000
20.520.0
6508M51000
18,70017,500
+5+8
0~7-10
0-9
Chloramphenicol at 55 mg/L resulted in 6, 9, and 16 percent light diminution at 5, 15,and 30 minutes, respectively.Predicted graphically.
a.
b.
c. EC5Q Predicted-EC50 ObservedEC50 Predicted
x 100 percent
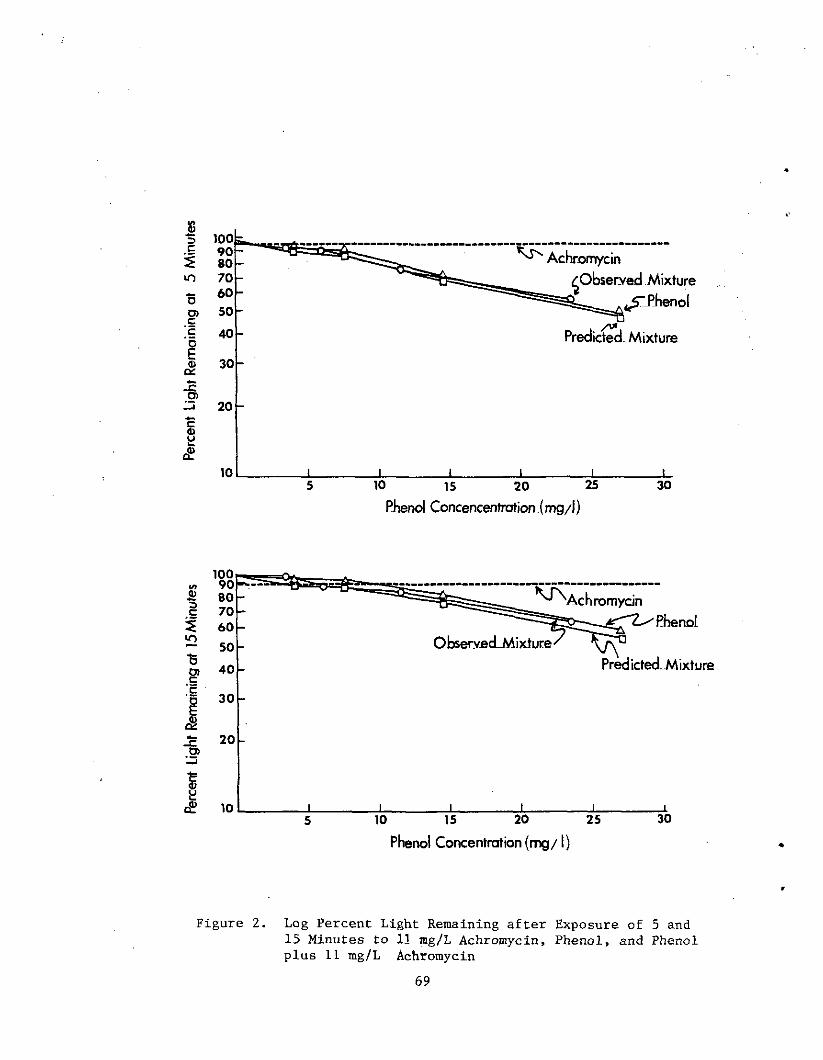
J8=>C
510BD)c'c'5
•o
I
10090807060
50
40
30
20
10
•omycin
Observed Mixture
Predicted Mixture
10 is 20 25
Phenol Concencentration (mg/l)
30
Si3
if
10090807060
Z 50
D) 40
'I 30
J= 20O)
10
Observed-Mixture -Predicted-Mixture
10 15 20 25 30
Phenol Concentration (mg/1)
Figure 2. Log Percent Light Remaining after Exposure of 5 and15 Minutes to 11 mg/L Achromycin, Phenol, and Phenolplus 11 mg/L Achromycin
69
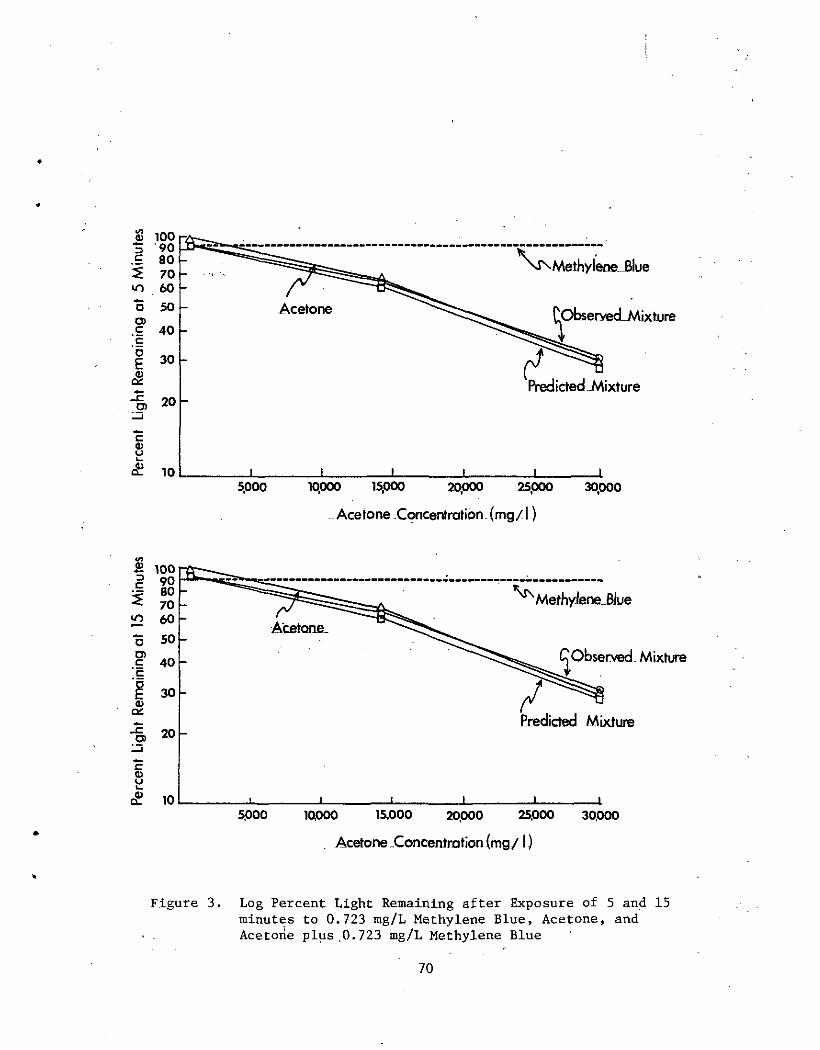
8 1003 90.£ 805 70m 60
o 50CO.= 40
1 300)
O) 20
10
Acetone
Meihylene_Blue
tobservecLMixture
Predicted .Mixture
5,000 10,000 15,000 20,000 25000 30,000
Acetone Concentration_(mg/l)
^Observed- Mixture
Predicted Mixture
5,000 1QOOO 15,000 20,000 25,000 30,000
. Acetone -Concentration (mg/1)
Figure 3. Log Percent Light Remaining after Exposure of 5 and 15minutes to 0.723 mg/L Methylene Blue, Acetone, andAcetone plus.0.723 mg/L Methylene Blue
70
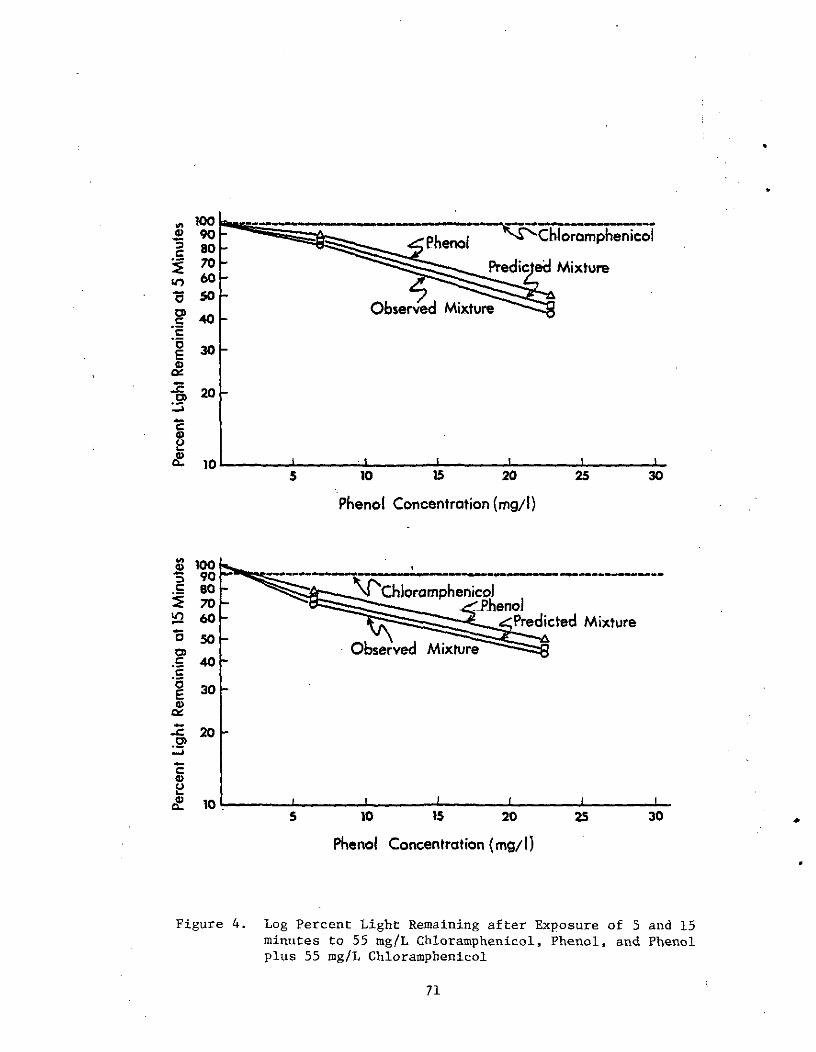
10090807060
50
40
30
•§ 20
Observed Mixture
10 15 20
Phenol Concentration (mg/I)
25 30
q> 1003 90£ 60
701 60
"c"6
50
40
30
-s 2°
10
JM Chioramphenicolr-PhenoJ
[Predicted Mixture_^2-
Observed Mixture"
5 10 15 20
Phenol Concentration (mg/l)
30
Figure 4. Log Percent Light Remaining after Exposure of 5 and 15minutes to 55 mg/L Chioramphenicol, Phenol, and Phenolplus 55 mg/L Chioramphenicol
71
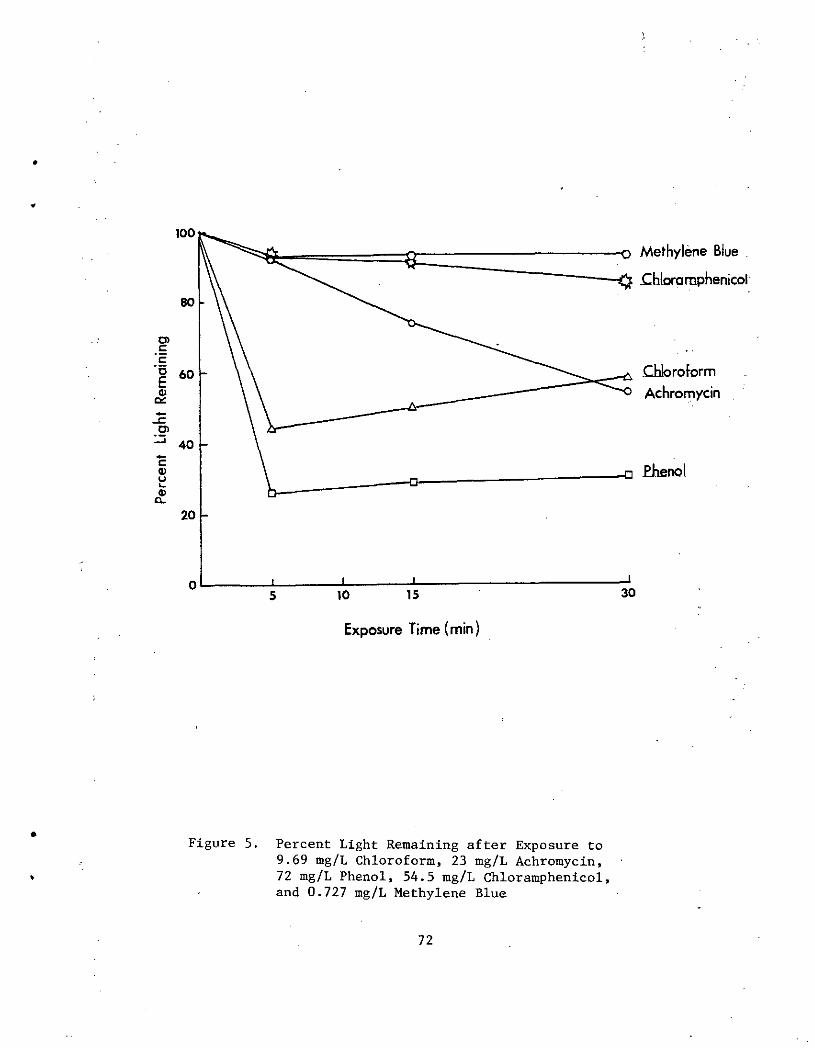
100
10 15
Exposure Time-(min)
Mefrhylene Blue .
-Chloramphenicol
Chloroform
Achromycin
Phenol
Figure 5. Percent Light Remaining after Exposure to9.69 mg/L Chloroform, 23 mg/L Achromycin,72 mg/L Phenol, 54.5 mg/L Chloramphenicol,and 0.727 mg/L Methylene Blue
72
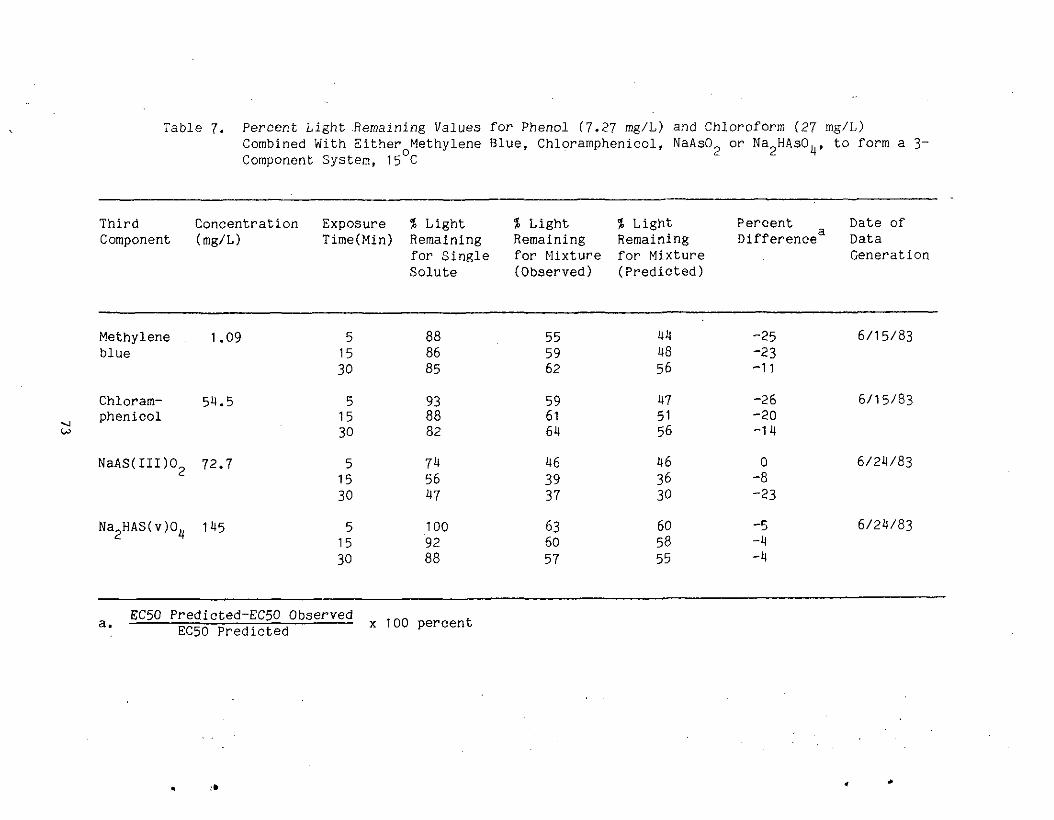
Table 7. Percent Light .Remaining Values for Phenol (7.27 rog/L) and Chloroform (27Combined With Either Methylene Blue, Chloramphenicol, NaAsO or Na HAsCv, to form a 3-Component System, 15 C
Third ConcentrationComponent ( mg/L)
Methylene . 1 .09blue
Chloram- 54.5phenicol
NaAS(III)0_ 72.72
Na0HAS(v)0, 1452 4
ExposureTime(Min)
51530
51530
51530
51530
% LightRemainingfor SingleSolute
888685
938882
745647
1009288
% LightRemainingfor Mixture(Observed)
555962
596164
463937
636057
% LightRemainingfor Mixture(Predicted)
444856
475156
463630
605855
Percenta
Difference
-25-23-11
-26-20-14
0-8-23
-5-4-4
Date ofDataGeneration
6/15/83
6/15/83
6/24/83
6/24/83
EC50 Predicted-EC50 Observed „„„a i i- .... ... , ,, v 1 HO not" oonr
EC50 Predicted
indicates the light remaining at varying exposure intervals for athree component system consisting of phenol ( 7 * 2 7 mg/L) andchloroform (27 mg/L) plus either methylene blue (1.09 mg/L) ,chloramphenicol (5^.5 mg/L), arsenic + III (72.7 mg/L) , or arsenic +V C 1 45 mg/L) . The three component mixtures displayed antagonisticinteractions at almost all exposure periods, with methylene blue andchloramphenicol resulting in the greatest antagonistic response.The percent difference for the methylene blue-phenol-chloroform andchloramphenicol-phenol-chloroform mixtures, for example were -25percent and -26 percent, respectively at five minutes, and -23percent and -20 percent, respectively, after 15 minutes of exposure.The arsenic (+ V)-methylene blue-phenol mixture displayed onlyslight antagonism with percent differences ranging from -4 to -5percent. The arsenic (+ III) - methylene blue-phenol mixturedisplayed variable interactions with a zero percent difference(additive) at five minutes and a -23 percent difference(antagonistic) at 30 minutes. Only percent differences greater than15 percent were considered to represent antagonistic (-) orsynergistic (+) Interactions because of Beckman's (1983) previouslyreported 11 percent coefficient of variation for representativeanalyses.
Table 8 indicates the light remaining at varying exposureintervals for a four component system consisting of phenol (7.27mg/L) plus combinations of three of the following compounds:chloroform (271 mg/L) , acetone (5,710 mg/L) , DMF (*J,300 mg/L),achromycin (21.8 mg/L) , methylene blue (1.09 mg/L) or N
(1^5 mg/L) . Both antagonistic and synergistic interaction wereobserved. Synergistic responses were observed only in the fourcomponent system containing arsenic ( + V ) . Noteworthy was thepronounced antagonistic interaction (-85 percent) for the methyleneblue-chloramphenicol-achromycin-phenol mixture after 30 minutes ofexposure.
Conclusions
The toxic effects exerted by single solute systems on Microtoxbioluminescence were additive for all two component mixturesexamined. The interaction of constituents within mixtures of threeor four chemical components was variable. The three componentmixtures tested displayed antagonistic interaction while fourcomponent mixtures displayed either antagonistic or synthergisticinteraction. The interaction of mixtures is therefore dependentupon the chemical properties of the constituent components. EC50values for the toxicants listed varied over f ive orders of magnitudewith endrin being most toxic (5EC50 = 0.7 mg/L) and acetone beingleast toxic (5EC50 = 22,000 mg/L).
The compounds tested additionally demonstrated varying timedependency on bioluminescent diminution. None of the three
Ui
Table 8. Percent Light Remaining Values of Four Component Mixtures Containing 7.27 mg/L Phenol plus
Three Additional Compounds at 15 C
Phenol
plus
ChloroformAcetoneDMF
Methylene BlueChloramphenicolAchromycin
AS(V)ChloroformAchromycin
AS(V)ChloroformMethylene Blue
Concentration
(mg/L)
27157104300
1 .0954.521.8
14527121.8
1452711.09
% Light
Remainingfor SingleSoluteAfter5/10/15Minutes of
Exposure
74/81/8592/94/9476/77/76
89/85/8491/88/8590/66/38
100/91/8876/79/8998/84/60
100/91/8876/79/8994/95/94
Exposure
Time ofFourComponentMixture(Min.)
51530
51530
51530
51530
% Light
Remainingfor Mixture(Observed)
444851
544437
524646
585148
% Light
Remainingfor Mixture(Predicted)
394547
443620
555139
545663
Percent
Difference
-13-7-9
-23-22-85
+5+ 10-18
-7+9+24
The chloroform/acetone/DMF and methylene blue/chloramphenicol/achromycin single solute values weregenerated on 6/23/83 while the AS(v)/chloroform/achromycin and AS(v)/chloroform/methylene blue singlesolute values were generated on 6/4/83.EC50 Predicted-EC50 Observed
EC50 Predictedx 100 percent
compounds investigated (chloramphenicol, methylene blue, achromycin)enhanced the sensitivity of the Microtox test via synergisticinteraction with the test compounds.
76