Embed Size (px)
Citation preview
Vol. 61 590 OTTO H. MULLER AND J. PERCY BAUMBERGER
formation of 20@) hydroxy compounds even mineral acids. when the reduction is done in the presence of STATE COLLEGE, PENNA. RECEIVED NOVEMBER 21,1938
[CONTRIBUTION FROM THE DEPARTMENT OF PHYSIOLOGY, STANFORD UNIVERSITY]
The Keto-Enol Tautomerism of Pyruvate Ion Studied Polarographically*
BY OTTO H. MULLER AND J. PERCY BAUMBERGER
Introduction Pyruvate ion holds a key position in practically
all schemes of carbohydrate metabolism in the intermediary steps of which the enol form is often postulated. The only evidence for this enol form has been spectroscopic‘ as the usual methods for its determination have failed in this particular case.
In this paper, we present data regarding the keto/enol + enolate ratio and polymerization of pyruvic acid and of pyruvate ion in relation to PH, and determine the apparent reduction po- tential of both forms of pyruvate ion a t different PH. These determinations are made electro- chemically, using the polarographic method.
Method Materials.-The pyruvate used in these experiments
was kindly given to one of us (J. P. B.) by Dr. H. Bor- sook of Pasadena in the form of solid lithium pyruvate of great purity. All other chemicals were c. P. products. The McIlvane series of buffers was used for pH 2.2-8.0 and Clark and Lubs HC1-KCl for PH 1.0-2.2. The pH was checked by means of the glass electrode. The tempera- ture a t which these experiments were carried out was 25 * 0.1” maintained in a water thermostat.
General Description of Polarographic Method.-The method makes use of a dropping mercury electrode as half- cell connected to a calomel half-cell by an agar bridge satu- rated with potassium chloride. A battery, slide wire potentiometer, and galvanometer are also in the circuit so that the voltage applied to the system may be varied and the resulting current measured. The procedure de- pends upon the fact that many compounds may be reduced at the surface of mercury dropping slowly from a capillary when the voltage applied is sufficiently negative. The re- sulting current is a function of the concentration of re- ducible substance, while the potential a t which the reduc- tion occurs is characteristic of the compound reduced. This principle has been incorporated into a very convenient apparatus, the polarograph, in which the current and volt- age are automatically graphically coordinated on photo- graphic paper to give a current-voltage curve, called a polarogram. J. Heyrovskjr and his schoolz are responsible
(*) Original manuscript received November 26, 1937. (1) V. Henri and C. Fromageot, Bull. soc. chim., [4137, 846 (1925). (2) J. Heyrovskq, “Polarographie,” in W. Bbttger, “Physikalische
Methoden der analytischen Chemie,” Akademische Verlagsgesell- schaft, Leipzig, 1936, Vol. 11, pp. 260-322.
for this development. On such a polarogram, the voltage is indicated by abscissas, and changes in current appear as waves.
Apparatus.-Our experiments were carried out with a Nejedlg polarograph Model VI11 and a Nejedljl galva- nometer with a sensitivity of 2.3 X 10-0 amp./mm./m. A special shunt permitted the modification of this sensi- tivity to any desired fraction, while critical damping was maintained.
The apparatus was so adjusted that the distance between two abscissas on the polarogram corresponded to 200 mv.
The dropping mercury electrode was made according to instructions given by Heyrovskjrz; its drop time in distilled water was six seconds when the mercury reservoir was 60 cm. above the capillary.
As oxygen is also reducible at the dropping mercury electrode, hydrogen gas was bubbled through all solutions before each experiment to remove the dissolved oxygen.
Instead of using a large layer of mercury a t the bottom of the electrolysis vessel as non-polarizable anode, as is customary in polarographic work, we made use of a satu- rated calomel electrode with a large surface which was connected to the test solution by an agar bridge, saturated with potassium chloride. The potential of this separate electrode is constant* and its value is known, thus eliminat- ing the troublesome measurement of the anode potential. All polarograms reproduced in this paper, therefore, show automatically the applied e. m. f. referred to the saturated calomel electrode.
For the plotting of graphs, liquid junction potentials have been neglected, while corrections for the iR dropa have been made in calculations of the half-wave poten- tials4 which are all referred to the normal hydrogen elec- trode as zero. The accuracy of these values is *20 mv., which seems sufficient for the present treatment. As we have shown8 polarographic potentials may be read with an accuracy of * 1 mv. if proper precautions are taken.
Keto-Enol Tautomerism This attempt to determine the concentration
of keto and enol pyruvate ion was the direct out- growth of the work on the coupled oxidation-re- duction potential of pyruvate lactate, carried out in this Laborato~$.~ (3) 0. H. Muller and J. P. Baumberger, Trans. Electrochem. Soc.,
(4) J. Heyrovskg and D. IlkoviP, Coll. Cscchosloo. Chcm. Comm., 7, 71, 181 (1937).
198 (1935).
Physiol., 16, 961 (1933). (5) J. P. Baumberger, J. J. Jlirgensen, and K. Bardwell, J . Cen.
March, 1939 KETO-ENOL TAUTOMERISM OF PYRWATE ION 591
PI .I. .U 1 s Ijb .%. b/l 5x s.w m sm ** #.w 6.w s‘a 686 106 r*r 7 s m* m
. / / , , -.-A -, , ~ ~~- ~~- -2- -,’..l’>--L- -~< --..’ _._: i- ~_,’
0.4 0.4 0.6 0.6 0.6 0.8 0.8 0.6 0.8 0.8 0.6 0.6 0.8 0.8 0.8 0.8 0.8 0.8 0.8 0.81.01.21.4
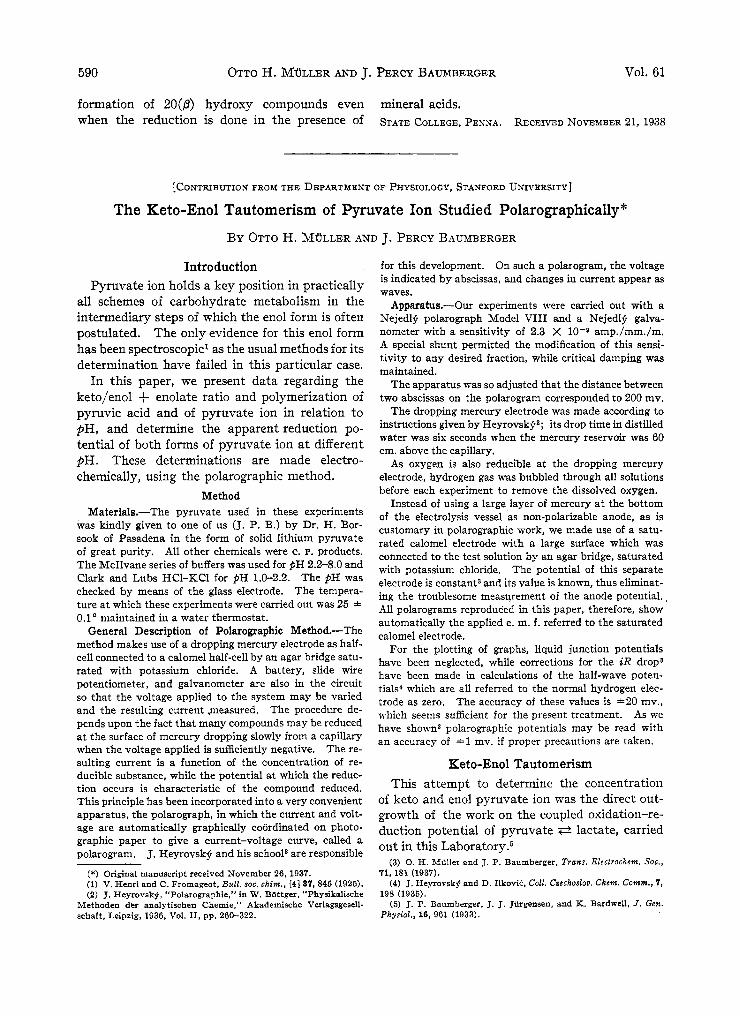
Volts. Fig. 1.-Polarograms of pyruvate reduction at different PH. The initial applied voltage for each curve is indi-
cated: abscissas are 0.2 v. apart and promessivelv more negative. The applied voltage at the half-wave io indicated . . in each case
The reduction of pyruvic acid a t the dropping mercury electrode seemed to present a satisfactory method for analytical determination, especially as several authors had mentioned such a reac- tion!,’ However, closer investigation showed that the polarogram of pyruvate really involves three waves and that the voltage a t which each occurs is shifted by pH. This has not been rec- ognized previously as no systematic study has been made. We therefore carried out a series of experiments in buffered solutions of different pH. Lithium pyruvate was used when i t was found to give identical results with freshly distilled py- ruvic acid.
We found it most convenient to use solutions of low concentration, because the iR correction would be small and there would be a minimum of polymerization. Figure 1 is a reproduction of three polarograms pieced together showing curves due to the reduction of 0.001 M pyruvate in buf- fers of different PH. We see that as the pH in- creases, the single wave a t pH 4.14 becomes smal- ler and another wave appears. In the rest of this paper, these two waves are called keto and “enol” respectively, “enol” referring to the sum of enol and enolate pyruvate. It may be noticed that the sum total of the two waves (keto + “enol“) is a constant, proportional to the concentration of pyruvate present. A t pH 8 the keto wave has practically vanished and the “enol” wave is now as big as the original keto wave. The reduction of pyruvic acid is known to require two electrons per molecule6; from our curves we must conclude that this holds a t any pH, i. e., for pyruvate ion also and that the reduction goes to completion in a single step.8 The reason for the two different
(6) L. Schweer. Coll. Cuchoslm. Chrm. Comm.. 7.328 (1935). 171 A. Winkel sod G. Proskc. Bcr.. 69. 1917 11938).
waves must be that two distinctly different sub- stances are reduced which are in equilibrium with each other. This equilibrium changes with pH. The most logical cause for such an equilib- rium in the case of pyruvate ion is the keto-enol tautomerism which has been mentioned fre- quently in the literature but for which no defi- nite and conclusive evidence has so far been presented. It is our opinion that the first wave which we obtain on the more acid side is due to the reduction of the keto form of pyruvic acid or py- ruvate ion while the second wave is due to the “enol” form.
The basis of our opinion is the well established fact that only those acids and their ions are re- ducible a t the dropping mercury electrode which have conjugated double bonds. The pyruvate ion (I) has two -0 double bonds which are con- jugated. The enol (11) and the enolate (111) forms of the pyruvate ion have one C=C double bond and a C=O group which are also conju- gated. We may therefore expect them to be also reducible, although most likely a t a different potential.
(1) (11) (111)
II II CHrC-C-0- H%C-C--O- -0-C-C-O-
H E 0 /I
H C II II 0 0
The need for conjugation of double bonds elimi- nates the possibility that the two waves may rep- resent reductions of different hydrates of the py- ruvate.
As associated and dissociated acids are indis- E. Laqueur. Rec. Iran chim.. 66, 959 (193611. There with s change in OH aoofhtr wave appears which, however, never hecomes larger than one-half the orisinn1 WPYL This meam that et a ceneio *€I the reduction goell on in two steps. each requiting one electron per molreule, while et another pH the reduction goes to completion in one rfeo. each molecule addine two eleeUons at once. . . . . . . .
(8) In this fact we have P fundamental difference fmm the ins - mmiblr redvetions of benzaldehyde [M. Tokuoks. Coll. Cuchorla. Chrm. Conm., 7, 382 (193511 and bcnzophcoonc [H. Schwcitrer and elrctrde.
.. The rnrrriblr two-step oxidations and reduction+ are mother
entirely dinermt case of electro-reduction at the dropping mercury
tiuguishable froin each other polarographically, we cannot segregate the enol (11) from the enolate (111). We have therefore labelled our second wave “enol” to indicate that i t represents the reduction of the sum of the enol and enolate forms of pyruvate ion.
.-- 1.200.
I 1
I
- 1.300 1
- 1.400 2 4 6 8
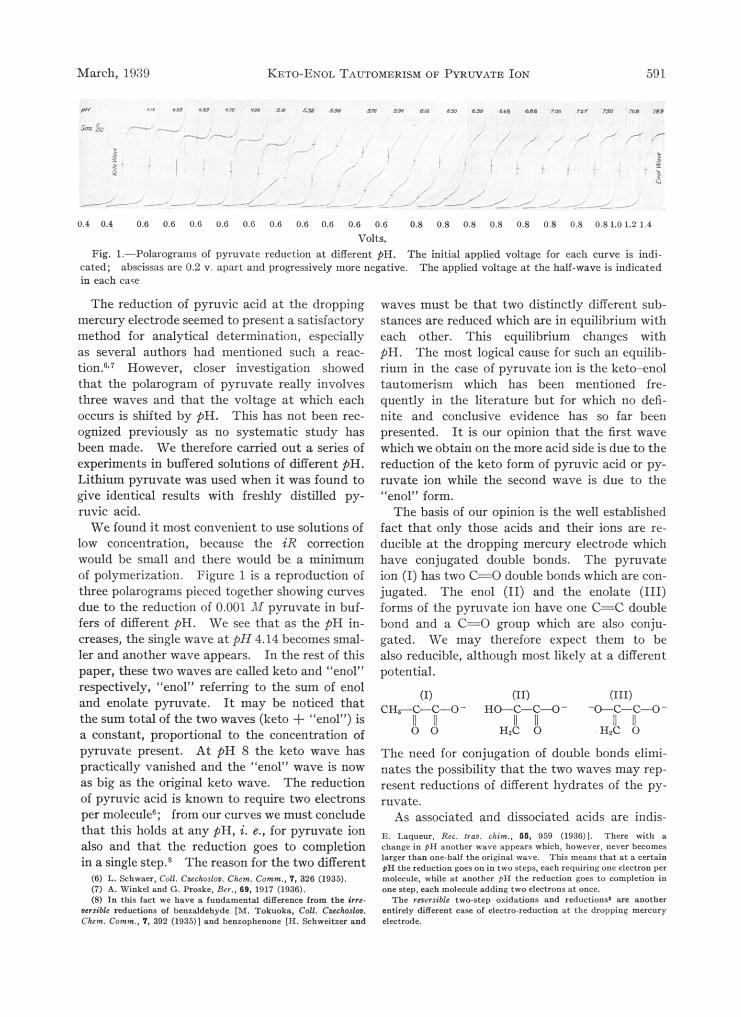
*gig. 2.-Apparent reduction potentials of pyruvic acid in its different forms a t different pH’s calculated from polarograms similar to and including those in Fig. 1 after making proper corrections.
PH.
In Fig. 2 we have plotted the changes of po- tential of keto and “enol” reductions against the changes in pH. We have only included the pH range from 1 to 8, as the “enol” wave loses its smooth “S” shape, which makes the potential measurements unreliable. The curves represent the values obtained when the half-wave method4 tsf measuring potentials was used. For the case of reversible organic electro-reductions we have established the significant value of this half-wave p~ ten t i a l .~ Although we no doubt deal with a fairly irreversible process we have preferred this method of measurement to others because of its relationship to the ‘(apparent reduction poten- tial” (A.R.P.) of Conantg as will be shown later on.
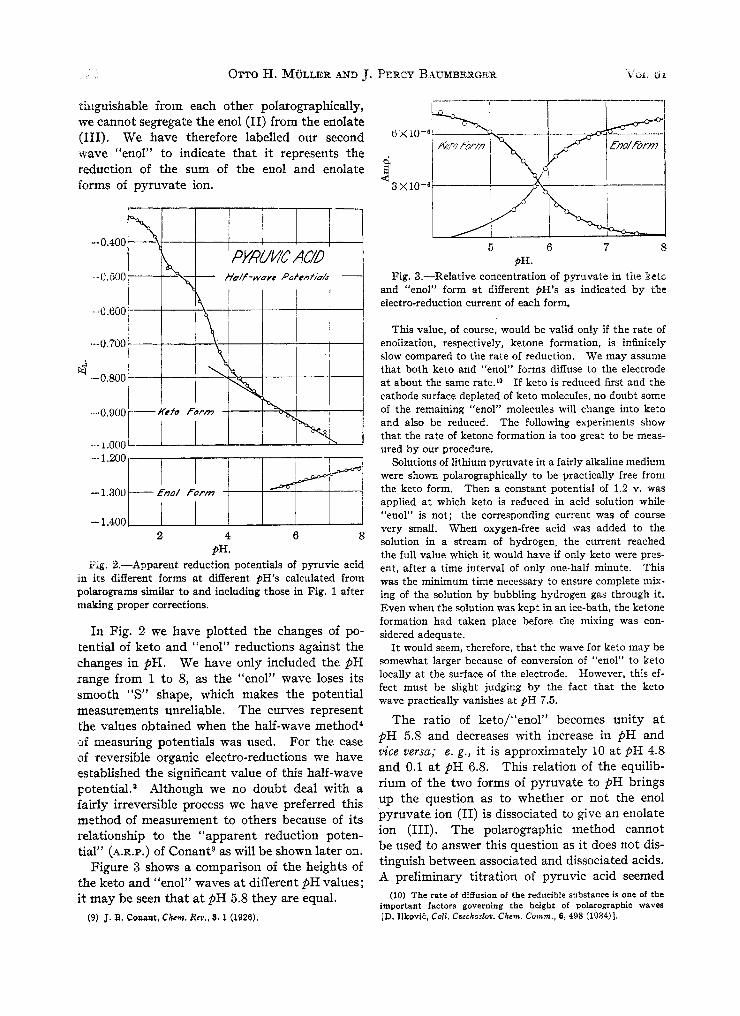
Figure 3 shows a comparison of the heights of the keto and “enol” waves a t different pH values; it may be seen that at pH 5.8 they are equal.
(9) J. 8. Coaaat, Chrm. Rev., 9, 1 (1926),
- €no/ foorm
6 6 7 8 p H .
Fig. 3.-Relative concentration of pyruvate in the kclu and “enol” form at different pH’s as indicated by the electro-reduction current of each form.
This value, of course, would be valid only if the rate of enolization, respectively, ketone formation, is infinitely slow compared to the rate of reduction. We may assume that both keto and “enol” forms diffuse to the electrode a t about the same rate.1° If keto is reduced first and the cathode surface depleted of keto molecules, no doubt some of the remaining “enol” molecules will change into keto and also be reduced. The following experiments show that the rate of ketone formation is too great to be meas- ured by our procedure.
Solutions of lithium pyruvate in a fairly alkaline medium were shown polarographically to be practically free from the keto form. Then a constant potential of 1.2 v. was applied a t which keto is reduced in acid solution whne “enol” is not; the corresponding current was of course very small. When oxygen-free acid was added to the solution in a stream of hydrogen, the current reached the full value which it would have if only keto were pres- ent, after a time interval of only one-half minute. This was the minimum time necessary to ensure complete mix- ing of the solution by bubbling hydrogen gas through it. Even when the solution was kept in an ice-bath, the ketone formation had taken place before the mixing was con- sidered adequate.
It would seem, therefore, that the wave for keto may be somewhat larger because of conversion of “enol” to keto locally a t the surface of the electrode. However, this ef- fect must be slight judging by the fact that the keto wave practically vanishes a t pH 7.5.
The ratio of keto/“enol” becomes unity a t pH 5.8 and decreases with increase in pH and vice versa; e . g., i t is approximately 10 a t PH 4.8 and 0.1 a t pH 6.8. This relation of the equilib- rium of the two forms of pyruvate to pH brings up the question as to whether or not the enol pyruvate ion (11) is dissociated to give an enolate ion (111). The polarographic method cannot be used to answer this question as i t does not dis- tinguish between associated and dissociated acids. A preliminary titration of pyruvic acid seemed
(IO) The rate of diffusion of the reducible substance is one of the important factors governing the height of polarographic waves [D. IlkoviE, Colt. Ceechoslov. Chen. Comm., 6, 498 (1934)l.
.i I I
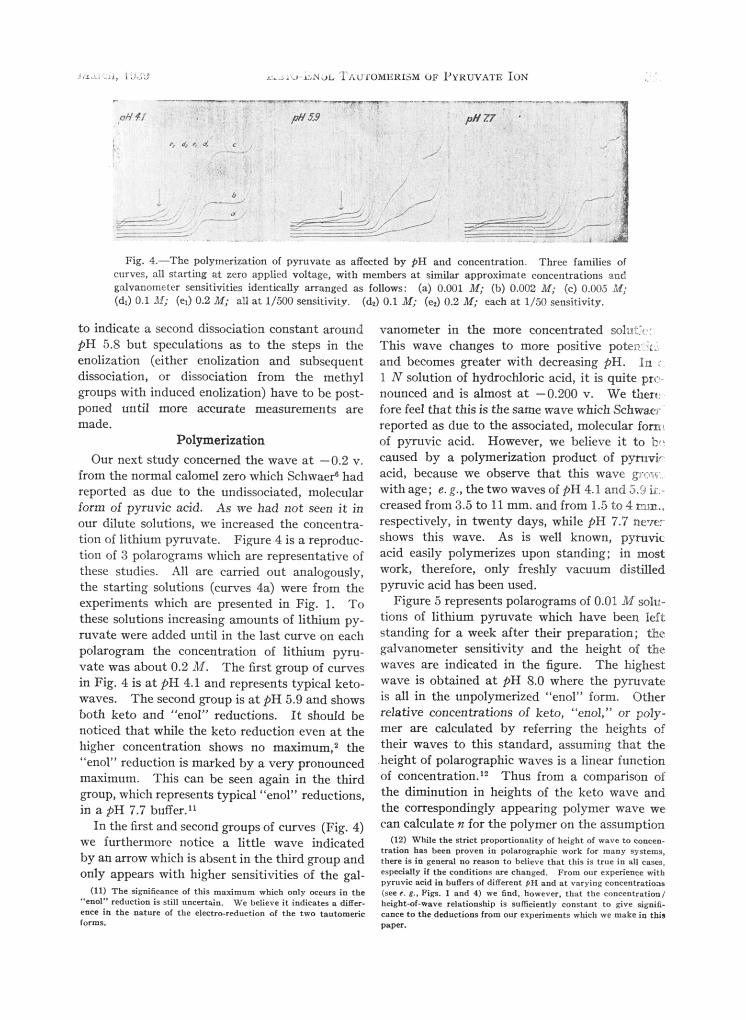
Fig. 4.-The polymerization of pyruvate BS affected by pH and concentration Three families of curves, all starting at zero applied voltage, with members at similar approximate concentrations anl galvanometer sensitivities identically arranged as follows: (a) 0.001 M; (b) 0.002 M; (c) 0.005 M; (dr) 0.1 11; (e,) 0.2 M; all at 1/5M) sensitivity. (a,) 0.1 M; (e,) 0.2 M; each at 1/50 sensitivity.
to indicate a second dissociation constant around pH 5.8 but speculations as to the steps in the enolization (either enolization and subsequent dissociation, or dissociation from the methyl groups with induced enolization) have to be post- poned until more accurate measurements are made.
Polymerization Our next study concerned the wave a t -0.2 v.
from the normal calomel zero which Schwaer‘ had reported as due to the undissociated, molecular form of pyruvic acid. As we had not seen it in our dilute solutions, we increased the concentra- tion of lithium pyruvate. Fimre 4 is a reproduc- tion of 3 polarograms which are representative of these studies. All are carried out analogously, the starting solutions (curves 4a) were from the experiments which are presented in Fig. 1. To these solutions increasing amounts of lithium py- ruvate were added until in the last curve on each polarogram the concentration of lithium pyru- vate was about 0.2 M. The first group of curves in Fig. 4 is a t pH 4.1 and represents typical keto- waves. The second group is a t pH 5.9 and shows both keto and “enol” reductions. It should be noticed that while the keto reduction even a t the higher concentration shows no maxirnum,l the “enol” reduction is marked by a very pronounced maximum. This can be seen again in the third group, which represents typical “enol” reductions, in a pH 7.7 buffer.“
In the first and second groups of curves (Fig. 4) we furthermorc notice a little wave indicated by an arrow which is absent in the third group and only appears with higher sensitivities of the gal-
(11) The significance of this maximum which only DECUII in the “Fool” reduction i9 still uneerfpin. We believe i t indicates s differ. e m e in the nature of the eieetro-reduction of the two tautomeric forms.
vanometer in the more concentrated solir’;~:: This wave changes to more positive poter.:r.l and becomes greater with decreasing pH. In i 1 N solution of hydrochloric acid, it is quite PIC. nounced and is almost at -0,200 v. We then: fore feel that this is the same wave which Schwaw reported as due to the associated, molecular form of pyruvic acid. However, we believe i t to b: caused by a polymerization product of pytuvir acid, because we observe that this wave g ~ m v . . with age; e. E., the two waves of pH 4.1 and 5.3 ir: creased from 3.5 to 11 mm. and from 1.5 to 4 nm.. respectively, in twenty days, while pH 7.7 never shows this wave. As is well known, pyruvic acid easily polymerizes upon standing: in most work, therefore, only freshly vacuum distilled pyruvic acid has been used.
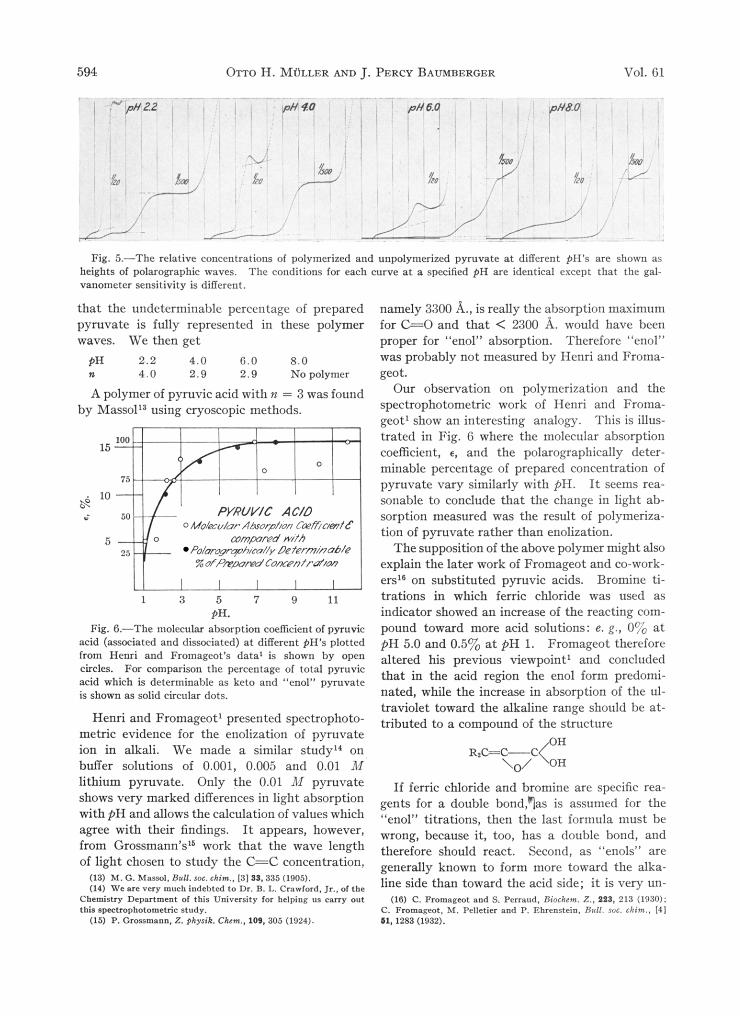
Figure 5 represents polarograms of 0.01 M sok- tions of lithium pyruvate which have been left standing for a week after their preparation; the galvanometer sensitivity and the height of the waves are indicated in the figure. The highest wave is obtained a t pH 8.0 where the pyruvate is all in the unpolymerized “enol” form. Other relative concentrations of keto, “enol,” or poly- mer are calculated by referring the heights of their waves to this standard, assuming that the height of polarographic waves is a linear function of concentration.12 Thus from a comparison of the diminution in heights of the keto wave and the correspondingly appearing polymer wave we can calculate It for the polymer on the assumption
(12) While the strict promionaiity of heisht of wave to eoncan. trstion he9 been pmvcn in polarographic work for mnoy systems, there is io generd no re-n to believe that thin ia true io nil e-. crpeeidlr if the conditions are ehnnged. From our experience rith pyruvic add in bvKm of dinereof 9 H Pod at varying concentratioas (seer. I.. Figs. 1 and 4 ) we find, however. that the eoncentration/ heiaht-of-wave rdationnhip i s sufficiently eoortaat to give signifi- C B ~ C C to the deductions from our experiments wbich we make ig thiv w e r .
594 OTTO H. MllLLER AND J. PERCY BAUMBERGER Vol. 61
~ . . .. _. . . . . . .. .. . . ... . ~~
6.1 oh 7 Y 'BO
$6 $0 - J -
1
Fig. 5.-The relative concentrations of polymerized and unpolymerized pyruvate at different pH's are shown as heights of polarographic waves. The conditions for each curve at a specified pH are identical except that the gal- vanometer sensitivity is different.
that the undeterminable percentage of prepared namely 3300 A,, is really the absorption maximum pyruvate is fully represented in these polymer for C=O and that < 2300 A. would have been waves. We then get proper for "enol" absorption. Therefore "enol"
2.2 4.0 6.0 8.0 was probably not measured by Henri and Froma- PH n 4.0 2.9 2.9 ~ o p a l y m e r geot. A polymer of pyruvic acid with 1z = 3 was found Our observation on polymerization and the
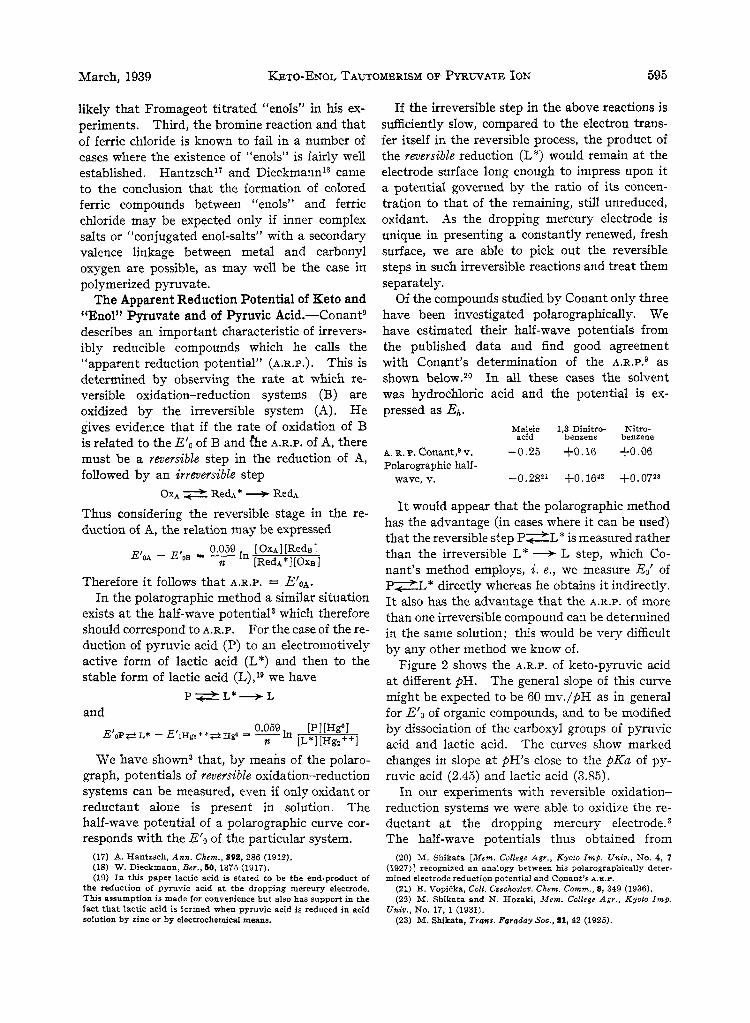
spectrophotometric work of Henri and Froma- geot' show an interesting analogy. This is illus- trated in Fig. G where the molecular absorption coefficient, e, and the polarographically deter- minable percentage of prepared concentration of pyruvate vary similarly with p H . I t seems rea- sonable to conclude that the change in light ab- sorption measured was the result of polymeriza- tion of pyruvate rather than enolization.
The supposition of the above polymer might also explain the later work of Fromageot and co-work- ers" on substituted pyruvic acids. Bromine ti-
1 3 5 7 9 1 1 trations in which ferric chloride was used as indicator showed an increase of the reacting com- pound toward more acid solutions: e. g., 0% at PH 5.0 and 0.5% a t PH 1. Fromageot therefore altered his previous viewPointi and concluded that in the acid region the enol form predomi- nated, while the increase in absorption of the ul- traviolet toward the alkaline range should be at- tributed to a compound of the structure
by M a s ~ o l ' ~ using cryoscopic methods.
15
& 10 i PYRUWC A C/O
o M~/W/OP AAwqim ~oe//&t& mmpmd w/fh
Po/orqqhoh/ca/% Defermhub/e %ofPmmdConcPntrrd/M
5
PH. Fig. 6.-The molecular absorption coefficient ofpyruvic
acid (associated and dissociated) at different PH's plotted from Henri and Fromageat's data' is shown by Open circles. For comparison the percentage of total pyruvic acid which is determinable as keto and "enol" pyruvate is shown as solid circular dots.
Henri and Fromageot' presented spectrophoto- metric evidence for the enolization of pyruvate ion in alkali. buffer solutions of 0.001. 0.005 and 0.01 M \d OH
We made a similar study" on R,c=c-c(oH
lithium pyruvate. Only the o.ol shows
pyruvate marked differences in light absorption
however?
If ferric chloride and bromine are specific rea- gents for a double bond,?= is assumed for the
wrong, because it, too, has a double bond, and with pH and allows the calculation of values which titrations, then the last formula must be
from Grossmann's" work that the wave length therefore should react, Second, as zcenols~~ are of light chosen to study the C - C concentration, generally known to form toward the &a.
with their findings. It
(13) M. G. Masrol. Bull. IDC. chin.. 131 3s. 335 (1905). (14) We are very much indebted to Dr. B. L. Crowford. Jr.. oi t h e
Chemistry Department of this University for helping us carry out this aprtmphotomctric study.
line side than un- (16) C. Promageat and S. Pcrraud. Biochmi. 2.. 92%. 213 (1830);
C. Fmmagwt, M. Pelletis nod P. Ehrcortcin. Ruil. roc. chim.. I41 81, 1283 (1932).
the acid side; it is
(15) P. Gro%%m.nn. 2. phyrik. Chrm.. 109.305 (1924).
March, 1939 KETO-ENOL TAUTOMERISM OF PYRWATE ION 595
likely that Fromageot titrated “enols” in his ex- periments. Third, the bromine reaction and that of ferric chloride is known to fail in a number of cases where the existence of “enols” is fairly well established. Hantzschl’ and Dieckmann18 came to the conclusion that the formation of colored ferric compounds between “enols” and ferric chloride may be expected only if inner complex salts or “conjugated enol-salts” with a secondary valence linkage between metal and carbonyl oxygen are possible, as may well be the case in polymerized pyruvate.
The Apparent Reduction Potential of Keto and “Enol” Pyruvate and of Pyruvic Acid.-Conantg describes an important characteristic of irrevers- ibly reducible compounds which he calls the “apparent reduction potential” (A.R.P. ) . This is determined by observing the rate a t which re- versible oxidation-reduction systems (B) are oxidized by the irreversible system (A). He gives evidence that if the rate of oxidation of B is related to the E‘o of B and &e A.R.P. of A, there must be a reversible step in the reduction of A, followed by an irreversible step
Thus considering the reversible stage in the re- duction of A, the relation may be expressed
OXA __ RedA* + RedA
Therefore i t follows that A.R.P . = E’oA. In the polarographic method a similar situation
exists a t the half-wave potential3 which therefore should correspond to A.R.P. For the case of the re- duction of pyruvic acid (P) to an electrornotively active form of lactic acid (L*) and then to the stable form of lactic acid (L),l9 we have
P - L * + L and
We have shown3 that, by means of the polaro- graph, potentials of reversible oxidation-reduction systems can be measured, even if only oxidant or reductant alone is present in solution. The half-wave potential of a polarographic curve cor- responds with the E‘o of the particular system.
(17) A. Hantzsch, Ann. Chem., S92, 286 (1912). (18) W. Dieckmann, Ber., 60, 1373 (1917). (19) In this paper lactic acid is stated to be the end-product of
the reduction of pyruvic acid at the dropping mercury electrode. This assumption is made for convenience but also has support in the fact that lactic acid is formed when pyruvic acid is reduced in acid
If the irreversible step in the above reactions is sufficiently slow, compared to the electron trans- fer itself in the reversible process, the product of the reversible reduction (L”) would remain a t the electrode surface long enough to impress upon it a potential governed by the ratio of its concen- tration to that of the remaining, still unreduced, oxidant. As the dropping mercury electrode is unique in presenting a constantly renewed, fresh surface, we are able to pick out the reversible steps in such irreversible reactions and treat them separately.
Of the compounds studied by Conant only three have been investigated polarographically. We have estimated their half-wave potentials from the published data and find good agreement with Conant’s determination of the A . R . P . ~ as shown below.20 In all these cases the solvent was hydrochloric acid and the potential is ex- pressed as Eh.
Maleic 1,3 Dinitro- Nitro- acid benzene benzene
A. R. P. Conant,Q v. -0.25 $0.16 +0.06 Polarographic half-
wave, v. -0.28’l +0.16’2 +0.07**
It would appear that the polarographic method has the advantage (in cases where it can be used) that the reversible step P z L * is measured rather than the irreversible L* + L step, which Co- nant’s method employs, i. e., we measure E,‘ of P s L * directly whereas he obtains i t indirectly. It also has the advantage that the A.R.P. of more than one irreversible compound can be determined in the same solution; this would be very difficult by any other method we know of.
Figure 2 shows the A.R.P. of keto-pyruvic acid a t different pH. The general slope of this curve might be expected to be 60 mv./pH as in general for E’Q of organic compounds, and to be modified by dissociation of the carboxyl groups of pyruvic acid and lactic acid. The curves show marked changes in slope a t pH’s close to the pKa of py- ruvic acid (2.45) and lactic acid (3.85).
In our experiments with reversible oxidation- reduction systems we were able to oxidize the re- ductant a t the dropping mercury ele~trode.~ The half-wave potentials thus obtained from (20) M. Shikata [Men. CoElege Agr. , Kyoto Imp. Uniw., No. 4, 7
(1927) I recognized an analogy between his polarographically deter- mined electrode reduction potential and Conant’s A.R.P. (21) E. Vopifka, Coll. CecchosZoo. Ckem. Comm., 8, 349 (1936). (22) M. Shikata and N . Horaki, Mem. College Agr., Kyoto Imp.
Univ.. No. 17. 1 (1931). ~. solution by zinc or by electrochemical means. (23j M. Shikata, T7ans. Faradoy SOC., 21,42 (1926).
596 LOUIS F. FIESER AND MARY FIESER Vol. 61
curves due to the anodic oxidation of reductant mere identical with those due to the cathodic reduction of the oxidant of the same system. ThB fact serves as a very convenient criterion to ~:kt~errriine the reversibility of an oxidation-re- diiclion system. For instance we were unable to oxidize lactic acid in a solution of nitric acid at the dropping mercury electrode, using the most positive potential available a t this electrode, ~G;Z.~ 2$, =: 4-0.65 v. This supports the view that the reversible step P L* is followed by an irreversible process I,* - L.
Using Conant’s method, BarmoreZ4 found that Imctic. acid could be oxidized in acid solution by potassiu:m permanganate which corresponded to an apparent oxidation potential (A. 0. P.) of Ej, I- 4-1.4 v. However, when he tried to de- teimine the A. R. P. of pyruvic acid by this method he failed, because the mast negative reagent he csiAcl ~rse, i. e., titanitup ,trichloride (Eh = -0.8 a.t +EI 7.2) was not negative enough to bring about a red.uction. For such systems, therefore, the ,polarographic method and Conant’s method sup- plement each other.
(!!fit) M. A. Barmore, “Electrometric Studies on Pyruvic Acid, imtic Acid, and Glyceric Aldehyde” (uupublished thesis), Stanford <. rtiwrsity Library, 1929.
This work was aided by a grant from the Rocke- feller Foundation.
Summary 1. The application of the polarographic method
to the study of keto-enol tautomerism, polymeri- zation and apparent reduction potential is de- scribed.
2. Evidence is presented in support of the following facts: (a) The ratio of keto/enol + eno- late forms of pyruvate ion becomes unity at pW 5.8 and decreases with increase in flH and vice versa. (b) Pyruvic acid polymerizes even in fairly dilute solutions and this polymerization in- creases with increase in acidity and with time. (c) The “polarographic half-wave potential” is equivalent to the “apparent reduction potential” of Conant and represents the E’o of the revers- ible step in an irreversible reaction. (d) The apparent reduction potentials of the various forms of pyruvic acid vary with PH.
An interpretation of the conflicting data in the literature concerning the keto-enol tautomer- ism of pyruvate ion is given on the basis of some new facts presented in this paper. STANFORD UNIVERSITY, CALIF.
3.
RECEXVED OCTOBER 27, 1938
[‘~OWTRIDWlXON FROM THE CHEMICAL LABORATORY OF HARVARD UNIVERSITY ]
Yhc Synthesis from pNaphthohydroquinone of a Tautomer of .l-Benzyl-l,Z-naphtho- quinone
BY LOUIS F. FIESER AND MARY FIESER
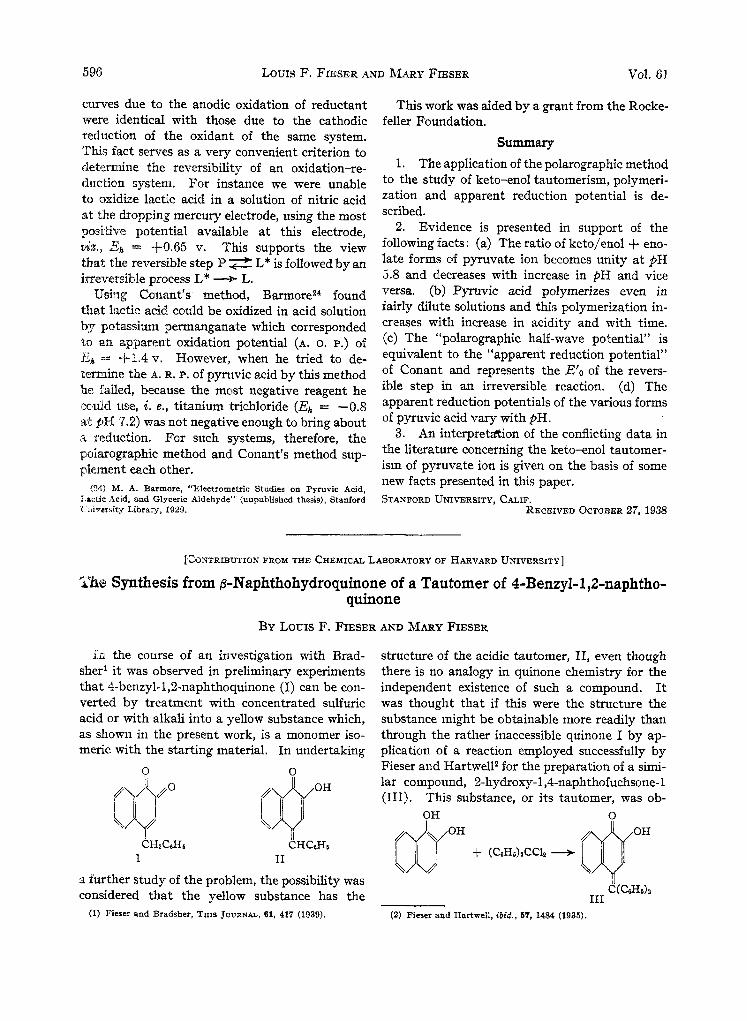
in the course of an investigation with Brad- sher’ i t was observed in preliminary experiments that 4-benzyl-l,2-naphthoquinone (I) can be con- verted by treatment with concentrated sulfuric acid or with alkali into a yellow substance which, as shown in the present work, is a monomer iso- meric with the starting material. In undertaking
0 0
I /I CH2CeH6 CHCKHE
I I1
ri further study of the problem, the possibility was considered that the yellow substance has the
(1) Fieser and Bradsher, THIS JOURNAL, 61, 417 (1939).
structure of the acidic tautomer, 11, even though there is no analogy in quinone chemistry for the independent existence of such a compound. It was thought that if this were the structure the substance might be obtainable more readily than through the rather inaccessible quinone I by ap- plication of a reaction employed successfully by Fieser and Hartwel12 for the preparation of a simi- lar compound, 2-hydroxy-1,4-naphthofuchsone-l (111). This substance, or its tautomer, was ob-
OH 0
111 (2) Fieser and Hartwell, ibid. , 67, 1484 (1935).