Embed Size (px)
Citation preview

United StatesDepartment ofAgriculture
A product of the NationalCooperative Soil Survey,a joint effort of the UnitedStates Department ofAgriculture and otherFederal agencies, Stateagencies including theAgricultural ExperimentStations, and localparticipants
Custom Soil ResourceReport forKern County,California,Southwest PartUnderwood Farms #1
NaturalResourcesConservationService
February 2, 2017
Alliance Ag Services, LLC

PrefaceSoil surveys contain information that affects land use planning in survey areas.They highlight soil limitations that affect various land uses and provide informationabout the properties of the soils in the survey areas. Soil surveys are designed formany different users, including farmers, ranchers, foresters, agronomists, urbanplanners, community officials, engineers, developers, builders, and home buyers.Also, conservationists, teachers, students, and specialists in recreation, wastedisposal, and pollution control can use the surveys to help them understand,protect, or enhance the environment.
Various land use regulations of Federal, State, and local governments may imposespecial restrictions on land use or land treatment. Soil surveys identify soilproperties that are used in making various land use or land treatment decisions.The information is intended to help the land users identify and reduce the effects ofsoil limitations on various land uses. The landowner or user is responsible foridentifying and complying with existing laws and regulations.
Although soil survey information can be used for general farm, local, and wider areaplanning, onsite investigation is needed to supplement this information in somecases. Examples include soil quality assessments (http://www.nrcs.usda.gov/wps/portal/nrcs/main/soils/health/) and certain conservation and engineeringapplications. For more detailed information, contact your local USDA Service Center(https://offices.sc.egov.usda.gov/locator/app?agency=nrcs) or your NRCS State SoilScientist (http://www.nrcs.usda.gov/wps/portal/nrcs/detail/soils/contactus/?cid=nrcs142p2_053951).
Great differences in soil properties can occur within short distances. Some soils areseasonally wet or subject to flooding. Some are too unstable to be used as afoundation for buildings or roads. Clayey or wet soils are poorly suited to use asseptic tank absorption fields. A high water table makes a soil poorly suited tobasements or underground installations.
The National Cooperative Soil Survey is a joint effort of the United StatesDepartment of Agriculture and other Federal agencies, State agencies including theAgricultural Experiment Stations, and local agencies. The Natural ResourcesConservation Service (NRCS) has leadership for the Federal part of the NationalCooperative Soil Survey.
Information about soils is updated periodically. Updated information is availablethrough the NRCS Web Soil Survey, the site for official soil survey information.
The U.S. Department of Agriculture (USDA) prohibits discrimination in all itsprograms and activities on the basis of race, color, national origin, age, disability,and where applicable, sex, marital status, familial status, parental status, religion,sexual orientation, genetic information, political beliefs, reprisal, or because all or apart of an individual's income is derived from any public assistance program. (Notall prohibited bases apply to all programs.) Persons with disabilities who require
2
Alliance Ag Services, LLC

alternative means for communication of program information (Braille, large print,audiotape, etc.) should contact USDA's TARGET Center at (202) 720-2600 (voiceand TDD). To file a complaint of discrimination, write to USDA, Director, Office ofCivil Rights, 1400 Independence Avenue, S.W., Washington, D.C. 20250-9410 orcall (800) 795-3272 (voice) or (202) 720-6382 (TDD). USDA is an equal opportunityprovider and employer.
3
Alliance Ag Services, LLC

ContentsPreface.................................................................................................................... 2How Soil Surveys Are Made..................................................................................5Soil Map.................................................................................................................. 8
Soil Map................................................................................................................9Legend................................................................................................................10Map Unit Legend................................................................................................ 11Map Unit Descriptions.........................................................................................11
Kern County, California, Southwest Part.........................................................13312—Vineland-Bakersfield complex, 0 to 1 percent slopes, drained.......... 13
Soil Information for All Uses...............................................................................16Suitabilities and Limitations for Use....................................................................16
Land Classifications........................................................................................ 16California Revised Storie Index (CA)...........................................................16
References............................................................................................................21
4
Alliance Ag Services, LLC

How Soil Surveys Are MadeSoil surveys are made to provide information about the soils and miscellaneousareas in a specific area. They include a description of the soils and miscellaneousareas and their location on the landscape and tables that show soil properties andlimitations affecting various uses. Soil scientists observed the steepness, length,and shape of the slopes; the general pattern of drainage; the kinds of crops andnative plants; and the kinds of bedrock. They observed and described many soilprofiles. A soil profile is the sequence of natural layers, or horizons, in a soil. Theprofile extends from the surface down into the unconsolidated material in which thesoil formed or from the surface down to bedrock. The unconsolidated material isdevoid of roots and other living organisms and has not been changed by otherbiological activity.
Currently, soils are mapped according to the boundaries of major land resourceareas (MLRAs). MLRAs are geographically associated land resource units thatshare common characteristics related to physiography, geology, climate, waterresources, soils, biological resources, and land uses (USDA, 2006). Soil surveyareas typically consist of parts of one or more MLRA.
The soils and miscellaneous areas in a survey area occur in an orderly pattern thatis related to the geology, landforms, relief, climate, and natural vegetation of thearea. Each kind of soil and miscellaneous area is associated with a particular kindof landform or with a segment of the landform. By observing the soils andmiscellaneous areas in the survey area and relating their position to specificsegments of the landform, a soil scientist develops a concept, or model, of how theywere formed. Thus, during mapping, this model enables the soil scientist to predictwith a considerable degree of accuracy the kind of soil or miscellaneous area at aspecific location on the landscape.
Commonly, individual soils on the landscape merge into one another as theircharacteristics gradually change. To construct an accurate soil map, however, soilscientists must determine the boundaries between the soils. They can observe onlya limited number of soil profiles. Nevertheless, these observations, supplementedby an understanding of the soil-vegetation-landscape relationship, are sufficient toverify predictions of the kinds of soil in an area and to determine the boundaries.
Soil scientists recorded the characteristics of the soil profiles that they studied. Theynoted soil color, texture, size and shape of soil aggregates, kind and amount of rockfragments, distribution of plant roots, reaction, and other features that enable themto identify soils. After describing the soils in the survey area and determining theirproperties, the soil scientists assigned the soils to taxonomic classes (units).Taxonomic classes are concepts. Each taxonomic class has a set of soilcharacteristics with precisely defined limits. The classes are used as a basis forcomparison to classify soils systematically. Soil taxonomy, the system of taxonomicclassification used in the United States, is based mainly on the kind and characterof soil properties and the arrangement of horizons within the profile. After the soil
5
Alliance Ag Services, LLC

scientists classified and named the soils in the survey area, they compared theindividual soils with similar soils in the same taxonomic class in other areas so thatthey could confirm data and assemble additional data based on experience andresearch.
The objective of soil mapping is not to delineate pure map unit components; theobjective is to separate the landscape into landforms or landform segments thathave similar use and management requirements. Each map unit is defined by aunique combination of soil components and/or miscellaneous areas in predictableproportions. Some components may be highly contrasting to the other componentsof the map unit. The presence of minor components in a map unit in no waydiminishes the usefulness or accuracy of the data. The delineation of suchlandforms and landform segments on the map provides sufficient information for thedevelopment of resource plans. If intensive use of small areas is planned, onsiteinvestigation is needed to define and locate the soils and miscellaneous areas.
Soil scientists make many field observations in the process of producing a soil map.The frequency of observation is dependent upon several factors, including scale ofmapping, intensity of mapping, design of map units, complexity of the landscape,and experience of the soil scientist. Observations are made to test and refine thesoil-landscape model and predictions and to verify the classification of the soils atspecific locations. Once the soil-landscape model is refined, a significantly smallernumber of measurements of individual soil properties are made and recorded.These measurements may include field measurements, such as those for color,depth to bedrock, and texture, and laboratory measurements, such as those forcontent of sand, silt, clay, salt, and other components. Properties of each soiltypically vary from one point to another across the landscape.
Observations for map unit components are aggregated to develop ranges ofcharacteristics for the components. The aggregated values are presented. Directmeasurements do not exist for every property presented for every map unitcomponent. Values for some properties are estimated from combinations of otherproperties.
While a soil survey is in progress, samples of some of the soils in the area generallyare collected for laboratory analyses and for engineering tests. Soil scientistsinterpret the data from these analyses and tests as well as the field-observedcharacteristics and the soil properties to determine the expected behavior of thesoils under different uses. Interpretations for all of the soils are field tested throughobservation of the soils in different uses and under different levels of management.Some interpretations are modified to fit local conditions, and some newinterpretations are developed to meet local needs. Data are assembled from othersources, such as research information, production records, and field experience ofspecialists. For example, data on crop yields under defined levels of managementare assembled from farm records and from field or plot experiments on the samekinds of soil.
Predictions about soil behavior are based not only on soil properties but also onsuch variables as climate and biological activity. Soil conditions are predictable overlong periods of time, but they are not predictable from year to year. For example,soil scientists can predict with a fairly high degree of accuracy that a given soil willhave a high water table within certain depths in most years, but they cannot predictthat a high water table will always be at a specific level in the soil on a specific date.
After soil scientists located and identified the significant natural bodies of soil in thesurvey area, they drew the boundaries of these bodies on aerial photographs and
Custom Soil Resource Report
6
Alliance Ag Services, LLC

identified each as a specific map unit. Aerial photographs show trees, buildings,fields, roads, and rivers, all of which help in locating boundaries accurately.
Custom Soil Resource Report
7
Alliance Ag Services, LLC

Soil MapThe soil map section includes the soil map for the defined area of interest, a list ofsoil map units on the map and extent of each map unit, and cartographic symbolsdisplayed on the map. Also presented are various metadata about data used toproduce the map, and a description of each soil map unit.
8
Alliance Ag Services, LLC

9
Custom Soil Resource ReportSoil Map
3889
700
3889
800
3889
900
3890
000
3890
100
3890
200
3890
300
3890
400
3890
500
3890
600
3890
700
3890
800
3890
900
3891
000
3891
100
3889
700
3889
800
3889
900
3890
000
3890
100
3890
200
3890
300
3890
400
3890
500
3890
600
3890
700
3890
800
3890
900
3891
000
328000 328100 328200 328300 328400 328500 328600 328700 328800 328900 329000
328000 328100 328200 328300 328400 328500 328600 328700 328800 328900 329000
35° 8' 53'' N11
8° 5
3' 1
8'' W
35° 8' 53'' N
118°
52'
35'' W
35° 8' 6'' N
118°
53'
18'' W
35° 8' 6'' N
118°
52'
35'' W
N
Map projection: Web Mercator Corner coordinates: WGS84 Edge tics: UTM Zone 11N WGS840 300 600 1200 1800
Feet0 100 200 400 600
MetersMap Scale: 1:7,010 if printed on A portrait (8.5" x 11") sheet.
Soil Map may not be valid at this scale.
Alliance Ag Services, LLC

MAP LEGEND MAP INFORMATION
Area of Interest (AOI)Area of Interest (AOI)
SoilsSoil Map Unit Polygons
Soil Map Unit Lines
Soil Map Unit Points
Special Point FeaturesBlowout
Borrow Pit
Clay Spot
Closed Depression
Gravel Pit
Gravelly Spot
Landfill
Lava Flow
Marsh or swamp
Mine or Quarry
Miscellaneous Water
Perennial Water
Rock Outcrop
Saline Spot
Sandy Spot
Severely Eroded Spot
Sinkhole
Slide or Slip
Sodic Spot
Spoil Area
Stony Spot
Very Stony Spot
Wet Spot
Other
Special Line Features
Water FeaturesStreams and Canals
TransportationRails
Interstate Highways
US Routes
Major Roads
Local Roads
BackgroundAerial Photography
The soil surveys that comprise your AOI were mapped at1:24,000.
Warning: Soil Map may not be valid at this scale.
Enlargement of maps beyond the scale of mapping can causemisunderstanding of the detail of mapping and accuracy of soilline placement. The maps do not show the small areas ofcontrasting soils that could have been shown at a more detailedscale.
Please rely on the bar scale on each map sheet for mapmeasurements.
Source of Map: Natural Resources Conservation ServiceWeb Soil Survey URL:Coordinate System: Web Mercator (EPSG:3857)
Maps from the Web Soil Survey are based on the Web Mercatorprojection, which preserves direction and shape but distortsdistance and area. A projection that preserves area, such as theAlbers equal-area conic projection, should be used if moreaccurate calculations of distance or area are required.
This product is generated from the USDA-NRCS certified data asof the version date(s) listed below.
Soil Survey Area: Kern County, California, Southwest PartSurvey Area Data: Version 7, Sep 12, 2016
Soil map units are labeled (as space allows) for map scales1:50,000 or larger.
Date(s) aerial images were photographed: May 7, 2010—Jun21, 2010
The orthophoto or other base map on which the soil lines werecompiled and digitized probably differs from the backgroundimagery displayed on these maps. As a result, some minorshifting of map unit boundaries may be evident.
Custom Soil Resource Report
10
Alliance Ag Services, LLC

Map Unit Legend
Kern County, California, Southwest Part (CA691)
Map Unit Symbol Map Unit Name Acres in AOI Percent of AOI
312 Vineland-Bakersfield complex,0 to 1 percent slopes, drained
202.2 100.0%
Totals for Area of Interest 202.2 100.0%
Map Unit DescriptionsThe map units delineated on the detailed soil maps in a soil survey represent thesoils or miscellaneous areas in the survey area. The map unit descriptions, alongwith the maps, can be used to determine the composition and properties of a unit.
A map unit delineation on a soil map represents an area dominated by one or moremajor kinds of soil or miscellaneous areas. A map unit is identified and namedaccording to the taxonomic classification of the dominant soils. Within a taxonomicclass there are precisely defined limits for the properties of the soils. On thelandscape, however, the soils are natural phenomena, and they have thecharacteristic variability of all natural phenomena. Thus, the range of someobserved properties may extend beyond the limits defined for a taxonomic class.Areas of soils of a single taxonomic class rarely, if ever, can be mapped withoutincluding areas of other taxonomic classes. Consequently, every map unit is madeup of the soils or miscellaneous areas for which it is named and some minorcomponents that belong to taxonomic classes other than those of the major soils.
Most minor soils have properties similar to those of the dominant soil or soils in themap unit, and thus they do not affect use and management. These are callednoncontrasting, or similar, components. They may or may not be mentioned in aparticular map unit description. Other minor components, however, have propertiesand behavioral characteristics divergent enough to affect use or to require differentmanagement. These are called contrasting, or dissimilar, components. Theygenerally are in small areas and could not be mapped separately because of thescale used. Some small areas of strongly contrasting soils or miscellaneous areasare identified by a special symbol on the maps. If included in the database for agiven area, the contrasting minor components are identified in the map unitdescriptions along with some characteristics of each. A few areas of minorcomponents may not have been observed, and consequently they are notmentioned in the descriptions, especially where the pattern was so complex that itwas impractical to make enough observations to identify all the soils andmiscellaneous areas on the landscape.
The presence of minor components in a map unit in no way diminishes theusefulness or accuracy of the data. The objective of mapping is not to delineatepure taxonomic classes but rather to separate the landscape into landforms orlandform segments that have similar use and management requirements. Thedelineation of such segments on the map provides sufficient information for thedevelopment of resource plans. If intensive use of small areas is planned, however,
Custom Soil Resource Report
11
Alliance Ag Services, LLC

onsite investigation is needed to define and locate the soils and miscellaneousareas.
An identifying symbol precedes the map unit name in the map unit descriptions.Each description includes general facts about the unit and gives important soilproperties and qualities.
Soils that have profiles that are almost alike make up a soil series. Except fordifferences in texture of the surface layer, all the soils of a series have majorhorizons that are similar in composition, thickness, and arrangement.
Soils of one series can differ in texture of the surface layer, slope, stoniness,salinity, degree of erosion, and other characteristics that affect their use. On thebasis of such differences, a soil series is divided into soil phases. Most of the areasshown on the detailed soil maps are phases of soil series. The name of a soil phasecommonly indicates a feature that affects use or management. For example, Alphasilt loam, 0 to 2 percent slopes, is a phase of the Alpha series.
Some map units are made up of two or more major soils or miscellaneous areas.These map units are complexes, associations, or undifferentiated groups.
A complex consists of two or more soils or miscellaneous areas in such an intricatepattern or in such small areas that they cannot be shown separately on the maps.The pattern and proportion of the soils or miscellaneous areas are somewhat similarin all areas. Alpha-Beta complex, 0 to 6 percent slopes, is an example.
An association is made up of two or more geographically associated soils ormiscellaneous areas that are shown as one unit on the maps. Because of presentor anticipated uses of the map units in the survey area, it was not consideredpractical or necessary to map the soils or miscellaneous areas separately. Thepattern and relative proportion of the soils or miscellaneous areas are somewhatsimilar. Alpha-Beta association, 0 to 2 percent slopes, is an example.
An undifferentiated group is made up of two or more soils or miscellaneous areasthat could be mapped individually but are mapped as one unit because similarinterpretations can be made for use and management. The pattern and proportionof the soils or miscellaneous areas in a mapped area are not uniform. An area canbe made up of only one of the major soils or miscellaneous areas, or it can be madeup of all of them. Alpha and Beta soils, 0 to 2 percent slopes, is an example.
Some surveys include miscellaneous areas. Such areas have little or no soilmaterial and support little or no vegetation. Rock outcrop is an example.
Custom Soil Resource Report
12
Alliance Ag Services, LLC
Kern County, California, Southwest Part
312—Vineland-Bakersfield complex, 0 to 1 percent slopes, drained
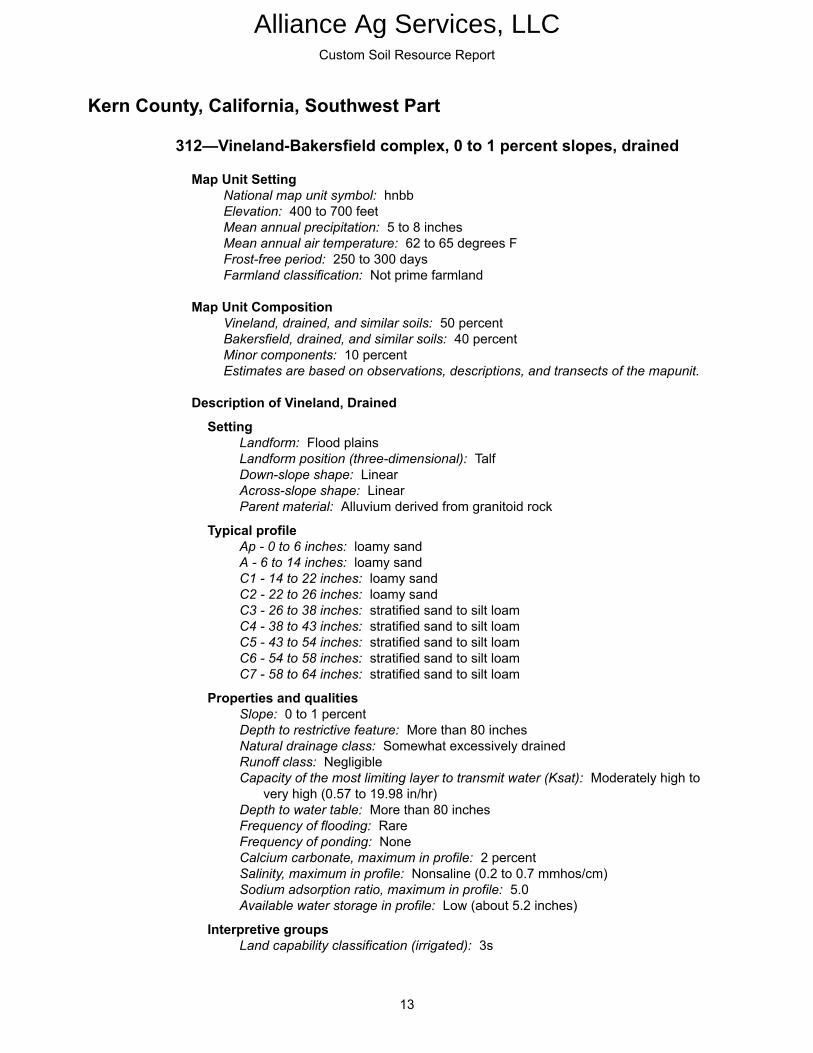
Map Unit SettingNational map unit symbol: hnbbElevation: 400 to 700 feetMean annual precipitation: 5 to 8 inchesMean annual air temperature: 62 to 65 degrees FFrost-free period: 250 to 300 daysFarmland classification: Not prime farmland
Map Unit CompositionVineland, drained, and similar soils: 50 percentBakersfield, drained, and similar soils: 40 percentMinor components: 10 percentEstimates are based on observations, descriptions, and transects of the mapunit.
Description of Vineland, Drained
SettingLandform: Flood plainsLandform position (three-dimensional): TalfDown-slope shape: LinearAcross-slope shape: LinearParent material: Alluvium derived from granitoid rock
Typical profileAp - 0 to 6 inches: loamy sandA - 6 to 14 inches: loamy sandC1 - 14 to 22 inches: loamy sandC2 - 22 to 26 inches: loamy sandC3 - 26 to 38 inches: stratified sand to silt loamC4 - 38 to 43 inches: stratified sand to silt loamC5 - 43 to 54 inches: stratified sand to silt loamC6 - 54 to 58 inches: stratified sand to silt loamC7 - 58 to 64 inches: stratified sand to silt loam
Properties and qualitiesSlope: 0 to 1 percentDepth to restrictive feature: More than 80 inchesNatural drainage class: Somewhat excessively drainedRunoff class: NegligibleCapacity of the most limiting layer to transmit water (Ksat): Moderately high to
very high (0.57 to 19.98 in/hr)Depth to water table: More than 80 inchesFrequency of flooding: RareFrequency of ponding: NoneCalcium carbonate, maximum in profile: 2 percentSalinity, maximum in profile: Nonsaline (0.2 to 0.7 mmhos/cm)Sodium adsorption ratio, maximum in profile: 5.0Available water storage in profile: Low (about 5.2 inches)
Interpretive groupsLand capability classification (irrigated): 3s
Custom Soil Resource Report
13
Alliance Ag Services, LLC

Land capability classification (nonirrigated): 7eHydrologic Soil Group: BHydric soil rating: Yes
Description of Bakersfield, Drained
SettingLandform: Flood plainsLandform position (three-dimensional): TalfDown-slope shape: LinearAcross-slope shape: LinearParent material: Alluvium derived from granitoid
Typical profileAp1 - 0 to 3 inches: fine sandy loamAp2 - 3 to 10 inches: fine sandy loamA - 10 to 16 inches: fine sandy loamC1 - 16 to 29 inches: stratified sand to loamC2 - 29 to 45 inches: stratified sand to loamCk - 45 to 51 inches: loamC'1 - 51 to 58 inches: stratified sandy loam to silt loamC'2 - 58 to 66 inches: stratified sand to loam
Properties and qualitiesSlope: 0 to 1 percentDepth to restrictive feature: More than 80 inchesNatural drainage class: Somewhat poorly drainedRunoff class: NegligibleCapacity of the most limiting layer to transmit water (Ksat): Moderately high to
high (0.57 to 1.98 in/hr)Depth to water table: More than 80 inchesFrequency of flooding: RareFrequency of ponding: NoneCalcium carbonate, maximum in profile: 3 percentSalinity, maximum in profile: Nonsaline to slightly saline (1.0 to 5.0 mmhos/cm)Sodium adsorption ratio, maximum in profile: 12.0Available water storage in profile: High (about 9.9 inches)
Interpretive groupsLand capability classification (irrigated): 6sLand capability classification (nonirrigated): 7sHydrologic Soil Group: BHydric soil rating: Yes
Minor Components
ExcelsiorPercent of map unit: 6 percentLandform: Alluvial fansLandform position (three-dimensional): TalfHydric soil rating: No
GranosoPercent of map unit: 3 percentLandform: Flood plainsLandform position (three-dimensional): TalfHydric soil rating: No
Custom Soil Resource Report
14
Alliance Ag Services, LLC

Unnamed, channelPercent of map unit: 1 percentLandform: ChannelsLandform position (three-dimensional): TalfHydric soil rating: Yes
Custom Soil Resource Report
15
Alliance Ag Services, LLC

Soil Information for All Uses
Suitabilities and Limitations for UseThe Suitabilities and Limitations for Use section includes various soil interpretationsdisplayed as thematic maps with a summary table for the soil map units in theselected area of interest. A single value or rating for each map unit is generated byaggregating the interpretive ratings of individual map unit components. Thisaggregation process is defined for each interpretation.
Land Classifications
Land Classifications are specified land use and management groupings that areassigned to soil areas because combinations of soil have similar behavior forspecified practices. Most are based on soil properties and other factors that directlyinfluence the specific use of the soil. Example classifications include ecological siteclassification, farmland classification, irrigated and nonirrigated land capabilityclassification, and hydric rating.
California Revised Storie Index (CA)
The Revised Storie Index is a rating system based on soil properties that govern thepotential for soil map unit components to be used for irrigated agriculture inCalifornia.
The Revised Storie Index assesses the productivity of a soil from the following fourcharacteristics:
- Factor A: degree of soil profile development
- Factor B: texture of the surface layer
- Factor C: steepness of slope
- Factor X: drainage class, landform, erosion class, flooding and ponding frequencyand duration, soil pH, soluble salt content as measured by electrical conductivity,and sodium adsorption ratio
16
Alliance Ag Services, LLC
Revised Storie Index numerical ratings have been combined into six classes asfollows:
- Grade 1: Excellent (81 to 100)
- Grade 2: Good (61 to 80)
- Grade 3: Fair (41 to 60)
- Grade 4: Poor (21 to 40)
- Grade 5: Very poor (11 to 20)
- Grade 6: Nonagricultural (10 or less)
The components listed for each map unit in the accompanying Summary by MapUnit table in Web Soil Survey or the Aggregation Report in Soil Data Viewer aredetermined by the aggregation method chosen. An aggregated rating class isshown for each map unit. The components listed for each map unit are only thosethat have the same rating class as the one shown for the map unit. The percentcomposition of each component in a particular map unit is given to help the userbetter understand the extent to which the rating applies to the map unit.
Other components with different ratings may occur in each map unit. The ratings forall components, regardless the aggregated rating of the map unit, can be viewed bygenerating the equivalent report from the Soil Reports tab in Web Soil Survey orfrom the Soil Data Mart site. Onsite investigation may be needed to validate theseinterpretations and to confirm the identity of the soil on a given site.
Custom Soil Resource Report
17
Alliance Ag Services, LLC

18
Custom Soil Resource ReportMap—California Revised Storie Index (CA)
3889
700
3889
800
3889
900
3890
000
3890
100
3890
200
3890
300
3890
400
3890
500
3890
600
3890
700
3890
800
3890
900
3891
000
3891
100
3889
700
3889
800
3889
900
3890
000
3890
100
3890
200
3890
300
3890
400
3890
500
3890
600
3890
700
3890
800
3890
900
3891
000
328000 328100 328200 328300 328400 328500 328600 328700 328800 328900 329000
328000 328100 328200 328300 328400 328500 328600 328700 328800 328900 329000
35° 8' 53'' N11
8° 5
3' 1
8'' W
35° 8' 53'' N
118°
52'
35'' W
35° 8' 6'' N
118°
53'
18'' W
35° 8' 6'' N
118°
52'
35'' W
N
Map projection: Web Mercator Corner coordinates: WGS84 Edge tics: UTM Zone 11N WGS840 300 600 1200 1800
Feet0 100 200 400 600
MetersMap Scale: 1:7,010 if printed on A portrait (8.5" x 11") sheet.
Soil Map may not be valid at this scale.
Alliance Ag Services, LLC

MAP LEGEND MAP INFORMATION
Area of Interest (AOI)Area of Interest (AOI)
SoilsSoil Rating Polygons
Grade 1 - Excellent
Grade 2 - Good
Grade 3 - Fair
Grade 4 - Poor
Grade 5 - Very Poor
Grade 6 - Nonagricultural
Not rated
Not rated or not available
Soil Rating LinesGrade 1 - Excellent
Grade 2 - Good
Grade 3 - Fair
Grade 4 - Poor
Grade 5 - Very Poor
Grade 6 - Nonagricultural
Not rated
Not rated or not available
Soil Rating PointsGrade 1 - Excellent
Grade 2 - Good
Grade 3 - Fair
Grade 4 - Poor
Grade 5 - Very Poor
Grade 6 - Nonagricultural
Not rated
Not rated or not available
Water FeaturesStreams and Canals
TransportationRails
Interstate Highways
US Routes
Major Roads
Local Roads
BackgroundAerial Photography
The soil surveys that comprise your AOI were mapped at1:24,000.
Warning: Soil Map may not be valid at this scale.
Enlargement of maps beyond the scale of mapping can causemisunderstanding of the detail of mapping and accuracy of soilline placement. The maps do not show the small areas ofcontrasting soils that could have been shown at a more detailedscale.
Please rely on the bar scale on each map sheet for mapmeasurements.
Source of Map: Natural Resources Conservation ServiceWeb Soil Survey URL:Coordinate System: Web Mercator (EPSG:3857)
Maps from the Web Soil Survey are based on the Web Mercatorprojection, which preserves direction and shape but distortsdistance and area. A projection that preserves area, such as theAlbers equal-area conic projection, should be used if moreaccurate calculations of distance or area are required.
This product is generated from the USDA-NRCS certified data asof the version date(s) listed below.
Soil Survey Area: Kern County, California, Southwest PartSurvey Area Data: Version 7, Sep 12, 2016
Soil map units are labeled (as space allows) for map scales1:50,000 or larger.
Date(s) aerial images were photographed: May 7, 2010—Jun21, 2010
The orthophoto or other base map on which the soil lines werecompiled and digitized probably differs from the backgroundimagery displayed on these maps. As a result, some minorshifting of map unit boundaries may be evident.
Custom Soil Resource Report
19
Alliance Ag Services, LLC

Table—California Revised Storie Index (CA)
California Revised Storie Index (CA)— Summary by Map Unit — Kern County, California, Southwest Part (CA691)
Map unit symbol Map unit name Rating Component name(percent)
Acres in AOI Percent of AOI
312 Vineland-Bakersfieldcomplex, 0 to 1percent slopes,drained
Grade 2 - Good Vineland, drained(50%)
202.2 100.0%
Totals for Area of Interest 202.2 100.0%
Rating Options—California Revised Storie Index (CA)
Aggregation Method: Dominant Condition
Component Percent Cutoff: None Specified
Tie-break Rule: Lower
Custom Soil Resource Report
20
Alliance Ag Services, LLC

ReferencesAmerican Association of State Highway and Transportation Officials (AASHTO).2004. Standard specifications for transportation materials and methods of samplingand testing. 24th edition.
American Society for Testing and Materials (ASTM). 2005. Standard classification ofsoils for engineering purposes. ASTM Standard D2487-00.
Cowardin, L.M., V. Carter, F.C. Golet, and E.T. LaRoe. 1979. Classification ofwetlands and deep-water habitats of the United States. U.S. Fish and WildlifeService FWS/OBS-79/31.
Federal Register. July 13, 1994. Changes in hydric soils of the United States.
Federal Register. September 18, 2002. Hydric soils of the United States.
Hurt, G.W., and L.M. Vasilas, editors. Version 6.0, 2006. Field indicators of hydricsoils in the United States.
National Research Council. 1995. Wetlands: Characteristics and boundaries.
Soil Survey Division Staff. 1993. Soil survey manual. Soil Conservation Service.U.S. Department of Agriculture Handbook 18. http://www.nrcs.usda.gov/wps/portal/nrcs/detail/national/soils/?cid=nrcs142p2_054262
Soil Survey Staff. 1999. Soil taxonomy: A basic system of soil classification formaking and interpreting soil surveys. 2nd edition. Natural Resources ConservationService, U.S. Department of Agriculture Handbook 436. http://www.nrcs.usda.gov/wps/portal/nrcs/detail/national/soils/?cid=nrcs142p2_053577
Soil Survey Staff. 2010. Keys to soil taxonomy. 11th edition. U.S. Department ofAgriculture, Natural Resources Conservation Service. http://www.nrcs.usda.gov/wps/portal/nrcs/detail/national/soils/?cid=nrcs142p2_053580
Tiner, R.W., Jr. 1985. Wetlands of Delaware. U.S. Fish and Wildlife Service andDelaware Department of Natural Resources and Environmental Control, WetlandsSection.
United States Army Corps of Engineers, Environmental Laboratory. 1987. Corps ofEngineers wetlands delineation manual. Waterways Experiment Station TechnicalReport Y-87-1.
United States Department of Agriculture, Natural Resources Conservation Service.National forestry manual. http://www.nrcs.usda.gov/wps/portal/nrcs/detail/soils/home/?cid=nrcs142p2_053374
United States Department of Agriculture, Natural Resources Conservation Service.National range and pasture handbook. http://www.nrcs.usda.gov/wps/portal/nrcs/detail/national/landuse/rangepasture/?cid=stelprdb1043084
21
Alliance Ag Services, LLC

United States Department of Agriculture, Natural Resources Conservation Service.National soil survey handbook, title 430-VI. http://www.nrcs.usda.gov/wps/portal/nrcs/detail/soils/scientists/?cid=nrcs142p2_054242
United States Department of Agriculture, Natural Resources Conservation Service.2006. Land resource regions and major land resource areas of the United States,the Caribbean, and the Pacific Basin. U.S. Department of Agriculture Handbook296. http://www.nrcs.usda.gov/wps/portal/nrcs/detail/national/soils/?cid=nrcs142p2_053624
United States Department of Agriculture, Soil Conservation Service. 1961. Landcapability classification. U.S. Department of Agriculture Handbook 210. http://www.nrcs.usda.gov/Internet/FSE_DOCUMENTS/nrcs142p2_052290.pdf
Custom Soil Resource Report
22
Alliance Ag Services, LLC

7/9/2015 10/27/2015
Discharge, Psi 5 16.5
Discharge head, feet 11.6 38.1
Standing Water Level, Feet 479.1 469.8
Gallons per minute flow 1973 1920
Gallons per foot of drawdown 79.9 69.1
Drawdown, feet 24.7 27.8
Pumping water level, feet 503.8 497.6
Total Pumping head, feet 515.4 535.7
Acre feet pumped per 24 hours 8.717 8.484
KW input to motor 249.7 262.7
HP input to motor 334.6 352
Motor load, % BHP 91.6 96.4
Measured speed of pump, RPM 1785 n/a
Customer Meter, GPM 1924 n/a
KWH per acre foot 687.5 743.1
Overall Plant efficiency in % 76.7 73.8
Cost per Acre Foot $125.33 $135.47
Cost/KW $0.18 $0.18
New WellAlliance Ag Services, LLC

7/10/2015 2/25/2016
Discharge, Psi 1.5 13
Discharge head, feet 3.5 30
Standing Water Level, Feet 474.5 440.7
Gallons per minute flow 913 1238
Gallons per foot of drawdown n/a 51.3
Drawdown, feet n/a 24.1
Pumping water level, feet n/a 464.8
Total Pumping head, feet n/a 494.8
Acre feet pumped per 24 hours 4.036 5.469
KW input to motor 177.8 167.4
HP input to motor 238.2 224.3
Motor load, % BHP 109.6 103.2
Measured speed of pump, RPM 1778 1781
Customer Meter, GPM 933 n/a
KWH per acre foot 1057.1 734.6
Overall Plant efficiency in % n/a 68.9
Cost per Acre Foot $186.15 $129.37
Cost/KW $0.18 $0.18
Old WellAlliance Ag Services, LLC

Alliance Ag Services, LLC

Alliance Ag Services, LLC

Alliance Ag Services, LLC

Alliance Ag Services, LLC

Alliance Ag Services, LLC

Alliance Ag Services, LLC

Alliance Ag Services, LLC


![State-of-the-art premium touchscreen balance series with ... · Analytical balance KERN AET Analytical balance KERN AET [d] 0,01 mg Precision balance KERN PET Industry scale KERN](https://img.pdfslide.us/doc/110x75/5f8e84abb20c024b62363ed0/state-of-the-art-premium-touchscreen-balance-series-with-analytical-balance.jpg)