Embed Size (px)
Citation preview

KENYA LIVESTOCK MARKET SYSTEMS ACTIVITY EXPANDING AND DIVERSIFYING ECONOMIC OPPORTUNITIES
Landscape Assessment and Analysis:
Capital Supply and Demand in Northern Kenya
November 2018

1
ACKNOWLEDGEMENTS
The research and writing of this report was led by Venny Mayaka, ACDI/VOCA’s Director of Agribusiness and Investment for the USAID Feed the Future Livestock Market Systems (LMS) project based in Nairobi, Kenya, and Heather Bateman, Director, Catalyzing Investment at ACDI/VOCA based in Washington, DC. The authors are grateful for the technical advisory and support of Jean-Frederic Beauchesne (ACDI/VOCA), Kavita Chambery (ACDI/VOCA), Ian Schneider (ACDI/VOCA), Elijah Lwevo (ACDI/VOCA), Catherine Gitonga (Smart Regional Consultants), and the entire LMS Associate Award 1 (AA1) technical staff. Finally, a special thanks to each financial institution, group, individual, and entity that was interviewed and generously shared information, which significantly contributed to the findings of this report.

2
TABLE OF CONTENTS
ACKNOWLEDGEMENTS.......................................................................................................................1
TABLE OF CONTENTS..........................................................................................................................2
ACRONYMS...............................................................................................................................................3
EXECUTIVE SUMMARY........................................................................................................................4
1. INTRODUCTION................................................................................................................................6
2. LITERATURE REVIEW.....................................................................................................................9
Overview..................................................................................................................................................9
Government of Kenya Initiatives for Development...................................................................................9
Kenya’s Arid and Semi-Arid Lands (ASALs)............................................................................................10
Financial Sector in Kenya........................................................................................................................12
3. RESEARCH METHODOLOGY AND PROCESS..........................................................................14
4. FINDINGS AND ANALYSIS............................................................................................................17
1. Sample Statistics..................................................................................................................................17
2. Supply Analysis: Descriptive Statistics of Lender and Investor Interviews............................................18
3. Supply: Lender and Investor Analysis..................................................................................................19
3.1.A. Financial Institution Representatives based in LMS Target Counties.......................................19
3.1.B. Financial Institution Representatives based in Nairobi............................................................24
3.2. Customer Exit Interviews.......................................................................................................27
3.3. Public and Non-Commercial Financial Providers....................................................................28
3.4 The BOMA Project’s Rural Entrepreneur Access Project (REAP)..........................................30
4. Demand Analysis: Access and Use of Finance among Communities in Northern Kenya......................31
4.1. Mobile phone service providers, mobile agents, and/or agency banking.................................31
4.2. Business owners/managers based in LMS target counties in Northern Kenya.........................34
4.3. Livestock farming households and traders based in LMS target counties in Northern Kenya.........41
5. KEY FINDINGS AND RECOMMENDATIONS FOR DESIGN INTERVENTIONS..............44
5.1 Key Findings...............................................................................................................................44
5.2 Recommendations for Design Interventions and Follow-up Research.........................................47
6. REFERENCES...................................................................................................................................51
ANNEX 1. THE BOMA PROJECT REAP GROUPS..........................................................................53

3
ACRONYMS AA1 USAID Livestock Market Systems Associate Award One AFC Agricultural Finance Corporation APA Leading Insurance Company in Kenya ARDF Arid-Lands Development Focus ASALs Arid and Semi-Arid Lands B2B Business to Business B2C Business to Consumer CDF Constituency Development Fund CIC CIC Insurance Group Limited CIDP County Integrated Development Plan CIFA Community Initiative Facilitation and Assistance CRS Catholic Relief Services CV Curriculum Vitae EFT Electronic Funds Transfer FCB First Community Bank FI Financial Institution FtF Feed the Future GDP Gross Domestic Product GoK Government of Kenya IMF International Monetary Fund IWASCO Isiolo Water and Sewerage Company KCB Kenya Commercial Bank KIIG Key Informant Interview Guide KRA Kenya Revenue Authority K-RAPID Kenya Resilient Arid Lands Partnership for Integrated Development KWFT Kenya Women Microfinance Bank LAPSSET Lamu Port- South Sudan- Ethiopia Transport LMA Livestock Management Association LMS USAID Feed the Future Livestock Market System Project LPO Legal Process Outsourcing MFI Micro-Finance Institution MSME Micro, Small, and Medium Enterprise NBFI Non-Bank Financial Institution NGO Non-Governmental Organization PACIDA Pastoralist Community Initiative and Development Assistance PREG Partnership for Resilience and Economic Growth REAP Rural Entrepreneur Access Program SACCO Savings and Credit Cooperative Organization SDGs Sustainable Development Goals SME Small and Medium Enterprise USAID United States Agency for International Development

4
EXECUTIVE SUMMARY
USAID’s Feed the Future-funded Kenya Livestock Market Systems (LMS) Activity, implemented by ACDI/VOCA (2017–2022) and its partners Mercy Corps, The BOMA Project, and Smart Regional Consultants, aims to increase sustainable economic opportunities and improve resilience in five counties in Kenya’s northern arid and semi-arid lands (ASALs): Isiolo, Marsabit, Garissa, Wajir, and Turkana counties. LMS’ design is based on the theory of change that if, through collective, sequenced, and layered actions, we expand viable economic opportunities both within and beyond the livestock market system, strengthen formal and informal institutions, systems, and governance to manage vital resources and attract additional investment, and improve human capital to take advantage of increased stability and economic opportunities, then we can sustainably strengthen people’s resilience in the face of shocks and stresses and reduce the prevalence and depth of poverty, household hunger, and chronic undernutrition in Northern Kenya. The role of LMS’ associate award, Expanding and Diversifying Economic Opportunities Associate Award (AA1), in the context of the LMS theory of change is to (1) facilitate a more competitive, commercialized livestock value chain for pastoralists that are moving up in the livestock sector; (2) facilitate viable, diversified livelihood opportunities for those that are “moving/stepping out” into other value chains; and (3) improve the enabling environment for inclusive economic growth. A key component to achieving these objectives is analyzing, improving, and expanding access to finance and investment for enterprises and households working in and around the livestock market system to help them acquire the capital they need to “move up” into more commercialized and sustainable livelihoods. Purpose of Report Aligned with these objectives, during AA1’s first year ACDI/VOCA conducted a financial landscape assessment to analyze the use of, supply to, and demand for capital (debt, equity, and mezzanine products, all various ranges and sizes) within its five target counties. The purpose of this analysis was two-fold:
(1) To provide a clearer picture of challenges, opportunities, and the overall current state of finance and investment, financial service needs, and preferences in and to Isiolo, Marsabit, Garissa, Wajir, and Turkana counties, disaggregated by age and gender where possible, as most existing research focuses on national level studies or data analysis from other counties.
(2) To help identify and inform future partnerships and activities, effective product designs, and/or delivery channels for AA1 support that would address key challenges and leverage opportunities for enterprises and households to access and use finance to accelerate enterprise growth and diversify livelihoods.
This report summarizes the study’s findings, which included a literature review, landscape analysis, and survey of 147 firms and 353 individuals conducted in June and July 2018 through key informant interviews, focus group discussions with key stakeholders, and consultative meetings to inform and vet findings. In addition, this report provides information on key financial sector actors, USAID Partnership for Resilience and Economic Growth (PREG) partners, and other organizations that LMS could potentially collaborate with and leverage investments from to increase the impact of project interventions on its beneficiaries.

5
Summary of Key Findings The research and data collected and synthesized for this report generated a number of interesting and surprising findings, particularly knowing the research questions and hypotheses established at the initial concept of this study (see pages 7 and 8). Overall, our findings indicate that while the formal financial sector in Northern Kenya is significantly less saturated than other parts of Kenya, evidence shows that there are significant opportunities for investment that some entities are already capitalizing on. In addition, our research also shows that the landscape of formal financial actors is deeper than may otherwise be the perception from news, media, or other research. Our key findings include:
• An overwhelming sense of optimism among both financial sector entities (supply-side) as well as enterprise owners and individuals (demand-side) regarding future business and investment growth prospects in Northern Kenya. At an aggregate, the vast majority of respondents believed that the opportunities for investment in Northern Kenya would improve or significantly improve over the next five years. When disaggregated by county, respondents from Wajir and Garissa counties on average showed the lowest sense of optimism.
• Formal financial sources (commercial banks, microfinance institutions, SACCOs, or mobile money) comprised 70 percent of borrowing among those interviewed. However, customer exit interviews from commercial banks show that the vast majority of customers use banks for savings products over borrowing.
• Medium-term working capital financing is #1 reason why businesses seek financing across all LMS target counties.
• Many Kenyan public/government funds exist to provide start-up funding for new businesses, including for youth and women, but the majority of consumers are not aware of such offerings or how to access them.
• Mobile money products and services are generally widely used and in high demand, noting that places with poor network connectivity have lower usage rates. Many respondents noted improving levels of network availability, though.
• The on-the-ground presence of MFIs in Northern Kenya is surprisingly lacking, particularly knowing the expansive networks some MFIs have in other parts of the country and demand for products and services among individuals and business owners that are often serviced by MFIs in other contexts.
• Several banks cited significant plans for increased investment and expansion in Northern Kenya over the next five years, totaling an estimated Ksh 1.23 billion (US$12.3 million).
• While the overall financial market in Northern Kenya is clearly not as crowded compared to the financial market nationwide, FIs considering expanding into Northern Kenya at this time may not be the “first movers” they may have otherwise thought.
Section 4, Findings and Analysis, as well as Section 5, Key Findings and Recommendations for Design Interventions, provide details and evidence for these findings.

6
1. INTRODUCTION USAID’s Feed the Future Kenya Livestock Market Systems (LMS) Activity, implemented by ACDI/VOCA (2017–2022), aims to increase sustainable economic opportunities and improve resilience in five counties in Kenya’s northern arid and semi-arid lands (ASALs): Isiolo, Marsabit, Garissa, Wajir, and Turkana counties. LMS’ design is based on the theory of change that if, through collective, sequenced, and layered actions, we expand viable economic opportunities both within and beyond the livestock market system, strengthen formal and informal institutions, systems, and governance to manage vital resources and attract additional investment, and improve human capital to take advantage of increased stability and economic opportunities, then we can sustainably strengthen people’s resilience in the face of shocks and stresses and reduce the prevalence and depth of poverty, household hunger, and chronic undernutrition in Northern Kenya. The role of LMS’ first associate award, Expanding and Diversifying Economic Opportunities Associate Award (AA1), in the context of this theory of change is to (1) facilitate a more competitive, commercialized livestock value chain for pastoralists that are moving up in the livestock sector; (2) facilitate viable, diversified livelihood opportunities for those that are “moving/stepping out” into other value chains; and (3) improve the enabling environment for inclusive economic growth. A key component to achieving these objectives is analyzing, improving, and expanding access to finance and investment for enterprises and households working in and around the livestock market system to help them acquire the capital they need to “move up” into more commercialized and sustainable livelihoods. Purpose of Report Aligned with these objectives, during AA1’s first year, ACDI/VOCA conducted a financial landscape assessment to analyze the use of, supply to, and demand for capital (debt, equity, and mezzanine products, all various ranges and sizes) within its five target counties. The purpose of this analysis was two-fold:
(1) To provide a clearer picture of challenges, opportunities, and the overall current state of finance and investment, financial service needs, and preferences in and to Isiolo, Marsabit, Garissa, Wajir, and Turkana counties, disaggregated by age and gender where possible, as most existing research focuses on national level studies or data analysis from other counties.
(2) To design activities and inform future partnerships, create/recommend effective product designs, and/or delivery channels for AA1 to support that would address key challenges and leverage opportunities for enterprises and households to access and use finance to accelerate enterprise growth and diversify livelihoods.
Further, one ancillary purpose of this assessment was to better gauge households, enterprises, and Kenyan financial institutions’ perceptions of future economic change in the ASALs, framed as their opinion of whether opportunities for investment in the ASALs will improve, worsen, or stay the same over the next five years. The purpose of capturing this information is to generate a snapshot in time of their hope for their future livelihoods and business opportunities in the ASALs, which can be used to influence business and investment perceptions for the future.

7
Finally, this research helped identify and prioritize key institutions that LMS can co- “invest” with as it strives to accelerate business growth and economic development in the five target northern counties. This report summarizes the findings from the study, which included a literature review, landscape analysis, and survey of 147 firms and 353 individuals conducted in June and July 2018 through key informant interviews, focus group discussions with key stakeholders, and consultative meetings to inform and vet findings. In addition, this report provides information on key financial sector actors, USAID PREG partners, and other organizations that LMS could potentially collaborate with and leverage investments from to increase the impact of project interventions on its beneficiaries. Research Questions and Key Hypotheses Key research questions considered for this study fall along categories of exploring the supply of and demand for finance and investment in Kenya’s northern counties in the ASALs. A need to better understand the nuanced, contextualized financial flows, both formal and informal, that are currently moving within LMS AA1’s target counties provided the impetus for this research. This research serves to help pinpoint leverage points that can increase access to finance and accelerate financial flows to key market actors and businesses within the livestock market system—particularly since similar, current existing research focuses more on Kenya’s country-wide financial systems or on other counties. Aligned with this context, the research questions posed for this assessment, as well as their accompanying hypotheses developed among ACDI/VOCA staff prior to undertaking the study, are the following: Demand
1. How are enterprises, households, and individuals in the ASALs currently accessing finance for their livelihoods? Ø Hypothesis: Enterprises and households in the ASALs are accessing finance from a
variety of sources, most of which are informal. 2. Are the current financial products, services, and channels meeting their needs? Why or why
not? Ø Hypothesis: Products, services, and channels of finance are not fully meeting their overall
needs due to a lack of volume of financing and lack of understanding of the market. Supply
3. Which formal suppliers of finance are currently supplying products and services to the ASALs? For ones that do, how are they doing so, and to what extent? Ø Hypothesis: Some formal suppliers of finance do operate in the ASALs, but the
proportion is quite small when compared to the number of formal financial providers that operate nationally and when compared to the volume of transactions occurring in other regions/counties.
4. What challenges do financial institutions (FIs) perceive regarding providing financial products
and services to the ASALs?

8
Ø Hypothesis: FIs perceive many challenges, the largest of which are insecurity and the perception of a lack of viable opportunities.
5. What opportunities do financial institutions perceive regarding providing financial products
and services to the ASALs? Ø Hypothesis: FIs view the ASALs as having numerous opportunities in livestock.
Quasi-measure for resilience
6. Do business owners, market actors, and individuals believe the opportunities for investment in Northern Kenya over the next five years will improve, worsen, or stay the same? Ø Hypothesis: Answers from enterprises and households located in the ASALs will vary
from a range of significantly worsen to significantly improve depending on their livelihood or personal circumstances.

9
2. LITERATURE REVIEW Overview From the early days of its independence, Kenya has been recognized as a land of abundant natural resources, fertile soils, and communities that are receptive and active for development. However, over the past several decades, some regions of the country economically accelerated faster than others for a variety of reasons—namely, varying access to and use of resources due to climatic differences in natural resources; distance and connection, whether physical or perceived, to the national government in Nairobi; and domestic or cross-border political disputes. Thus, while Kenya’s economy overall accelerated dramatically over the past several years, its internal imbalance in poverty rates, access to social amenities, and economic strength of different regions is evidence of vastly different rates of growth. In 2009, the Government of Kenya designated the ASALs as a highly vulnerable region, characterized by weak economic integration, a challenging natural environment known for its deserts and prone to droughts and flooding, as well as social inequalities within the region, particularly with respect to women and minority groups. Government of Kenya Initiatives for Development Process of devolution: The 2010 constitution of Kenya established a two-level government structure, comprising of the national government and 47 county governments. The pursuant process of devolution, or partial transfer of government authority in resources from the centralized national government to county governments, is aimed at improving public service delivery and government responsiveness to the needs of its citizens at a more localized level. It also seeks to enhance public participation and to make access to, and use of, public resources more equitable, efficient, and transparent. Further, it aims to accelerate social and economic development in ways that are county-specific, through County Integrated Development Plans (CIDPs), and enable more easily accessible public services throughout Kenya.1 Government of Kenya’s Vision 2030: Kenya Vision 2030 aims to create “a globally competitive and prosperous country with a high quality of life by 2030” by transitioning Kenya into a middle income country by 2030.2 The initiative focuses on promoting economic growth through six priority sectors: agriculture and livestock, financial services, trade, manufacturing, tourism, wholesale and retail, and business process offshoring and IT-enabled services. Key priorities in Vision 2030 for the financial services sector include:
• Improve regulations around financing for micro, small, and medium enterprises (MSMEs) • Encourage development of non-bank financial institutions (NBFIs) to deepen capital
markets and increase access to a diversified array of financial services, particularly for MSMEs
• Further develop the insurance sector and improve regulation • Promote initiatives to improve financial literacy and education • Expand financial services coverage and outreach, particularly in rural areas • Improve the legal infrastructure to promote and enforce the rule of law in commercial and
financial transactions, and improve good governance by promoting transparency, accountability, participation, and predictability
1 Issue 10, No. 3 | January - March 2018 17 Policy Monitor 2 Making Kenya Vision 2030. Visit Vision2030.go.ke for further details.

10
• Establish a single register of securities and collaterals to improve transparency and encourage registration of non-traditional securities
The Big Four Agenda: The Big Four Agenda is a set of four key government priorities to accelerate economic development, create jobs, and address social issues. The administration of President Uhuru Kenyatta established the agenda after his inauguration in August 2017. The four pillars of the agenda are to address improving nutrition and food security, developing affordable housing, enhancing manufacturing, and establishing universal healthcare. In particular, the strategy aims to ensure 100 percent food security for all Kenyans by nearly doubling agricultural production in rice, maize, and potatoes over the next five years, and to promote policies that enable small and
medium enterprises (SMEs) to grow by 20 percent annually over the same period.3 Lamu Port-South Sudan-Ethiopia Transport (LAPSSET) corridor development: A flagship piece of Kenya’s Vision 2030, the LAPSSET corridor, is a large-scale infrastructure development project that will create a second transportation corridor through Kenya. The project will link the Lamu port to South Sudan and Ethiopia through its northern counties, notably omitting Nairobi and fostering hubs at Garissa (Garissa county), Isiolo (Isiolo county), Nakodok (Turkana county), and Moyale (Marsabit county). LAPSSET’s goal is to improve trade and transportation linkages between South Sudan and Ethiopia and promote economic development in Northern Kenya. Since the completion of the Isiolo-Moyale highway in July 2017 (see Figure 1), residents have already noted increased traffic and reduced insecurity. The government anticipates completing the remaining sections of the LAPSSET corridor by the end of 2018.4
Kenya’s Arid and Semi-Arid Lands (ASALs) As seen in Figure 2, Kenya’s vast ASALs cover more than 83 percent of the country’s land mass, or approximately 185,000 square miles (298,000 square kilometers).5 While some of Kenya’s ASALs include areas like the Rift Valley and eastern provinces, the vast majority of the country’s ASALs are located in Northern Kenya. The ASALs are home to about 36 percent of the Kenyan population, 70 percent of the national livestock herds, and 90 percent of wildlife.6
3Micah Pkopus Powon, CBS Principal Secretary: State Department for ASAL, Ministry of Devolution and ASAL, 23rd May 2018. 4 “Construction of the LAPPSET Corridor Almost Complete.” Trademark East Africa. 3 May 2016. Found at <https://www.trademarkea.com/news/construction-of-the-lappset-corridor-almost-complete> 5 Key statistics on the drylands of Kenya, Uganda, and Ethiopia. REGLAP Secretariat, October 2012. Found at <http://www.fao.org/fileadmin/user_upload/drought/docs/Key%20Statistics%20on%20drylands%20of%20Kenya,%20Uganda%20and%20Ethiopia_October_%202012.pdf> 6 Kenyan Ministry of Devolution Report, 2017.
Figure 1. Map of the LAPSSET Corridor, currently under development

11
Kenya’s ASALs: Economy: According to the Kenya Economic Survey 2018, the percent of those living below the Kenyan national poverty line has decreased to 36 percent country-wide, but when disaggregated, remains high in the arid northern counties—79 percent of the population of Turkana, 66 percent of the population of Garissa, 64 percent of Marsabit, 63 percent of Wajir, and 52 percent of Isiolo live below the national poverty level.7 To achieve Kenya’s country-wide goal to accelerate growth and investment and to fulfill the Vision 2030 objectives, the Kenyan government is refocusing its support to ASAL counties. Many communities that live in the ASALs have practiced pastoralism as their main livelihood for generations, although recent studies show that households engage in several livelihood activities to help mitigate against shocks and ensure income streams across seasons, including the sale of household goods, basketry, and beadwork, grocery businesses, electronics sales, and clothes among others.8 Livelihoods that include pastoralism most commonly include livestock trading and communal management of natural resources. Kenya’s ASALs: Climate: Global climate change presents a distinct set of challenges to the ASALs. Climate change has intensified shocks and stresses on all fauna, flora, and water resources, negatively affecting the pastoralism-led economy and pastoralists’ ability to find food and water for their livestock and further increasing vulnerability and poverty. Other socio-economic repercussions of climate change include sharp demographic changes of both humans and wild animals, leading to human-animal conflicts, loss of livestock, and interclan skirmishes due to competition over scarce resources, as well as deforestation, leading to low vegetative cover, encroachment into fragile ecosystems, and reduced rainfall and reliable water sources. Despite these challenges, there are opportunities for economic-resilient ventures, such as investing in human capital, enabling sustainable and climate-smart business opportunities, agricultural technologies such as high-tech irrigation schemes, and empowering businesses through linkages to larger domestic and international market systems.
7 Kenya Economic Survey 2018. 8 Ibid.
Figure 2. Map of Kenya All ASALs highlighted in blue; LMS target counties are labeled and in light blue.

12
Financial Sector in Kenya According to statistics collected by Financial Sector Deepening Kenya in 2015, there are 44 commercial banks in Kenya (13 foreign-owned, 31 locally-owned). Locally-owned financial institutions comprise of three banks with significant shareholding by the Government of Kenya and state corporations, 27 commercial banks, and one mortgage finance institution.9 Figure 3 provides further information on the current numbers and types of financial institutions operating in Kenya. Figure 3. Number of financial service providers by institution type, 2015 Sources: Central Bank of Kenya; SACCO Societies Regulatory Authority (SASRA) Financial institution type Number of providers Commercial Banks 44 Money Remittance Providers 14 Forex Bureaus 86 Credit Reference Bureaus 3 Microfinance Banks (deposit taking) 12 Microfinance Institutions (Non-deposit taking/non-regulated credit only MFIs)
30
Mobile money operators 5 Insurance providers 53 Number of registered SACCOs 199 In 2014, the Central Bank of Kenya initiated an interest rate ceiling of 400 basis points (4 percent) on the cost of capital to commercial banks, effectively creating a 14 percent interest rate cap for SME end customers across all segments of the economy. While the purpose of the ceiling was to set cheaper financing rates for SMEs and to promote business growth, and was well received by SMEs, the ceiling has made SME lending from registered financial institutions difficult due to challenges in covering capital costs at this rate. Due to these challenges, private sector credit growth slowed from a 13.5 percent growth rate in 2016 to 2.8 percent in April 2018.10 A move to repeal the law was introduced to the Kenyan Parliament in early 2018 but the parliament voted to retain the ceiling in August 2018, despite recommendations from the International Monetary Fund (IMF) and other global organizations for its repeal.11 Pending relevant legislation. At the time of this report, the Kenyan parliament is considering two pieces of legislation with implications for parts of Kenya’s financial sector, particularly microfinance institutions and SACCOs. These are: Ø Amendment to SACCO bill, 2018: This proposed amendment to current policies regarding the
governance of SACCOs aims to ensure that individuals with criminal records or under investigation for financial crimes, such as corruption, counterfeiting, embezzlement, or fraud, are barred from participating in board governance roles of Kenyan SACCOs. SACCOs in Kenya
9 Information from https://informationcraddle.com/kenya/directory/banks-in-Kenya. 10 Herbling, David and Bella Genga. “Kenya Will Repeal Interest-Rate Cap That Curbed Bank Lending.” Bloomberg. Published June 14, 2018. Accessible at <https://www.bloomberg.com/news/articles/2018-06-14/kenya-to-repeal-section-of-banking-law-that-caps-interest-rates> 11 “Parliament approves retaining interest rate cap against IMF wishes.” By Reuters, re-printed in The Star, Kenya on August 30, 2018. Accessible at <https://www.the-star.co.ke/news/2018/08/30/parliament-approves-retaining-interest-rate-cap-against-imf-wishes_c1811182>

13
hold over US$5 billion of Kenyan individuals’ savings.12 If passed, the amendment will strengthen corporate governance within SACCOs and the financial sector. Kenya’s National Treasury is promoting the proposed amendment that seeks to streamline SACCOs’ operations.
Ø Amendment to microfinance bill and regulations, 2018. The Central Bank of Kenya has proposed amendments to current legislation governing the microfinance sector to boost corporate governance in the sector and enhance minimum capital requirements for MFIs to enable them build resilience against financial downturns and enhance consumer protection. In light of the increasing sophistication of cyber-crime, the bill proposes guidelines to enhance mitigation against cyber risk, business continuity planning, and management. As of December 2017, there were 13 licensed MFIs with 114 branches in Kenya, with total assets of Ksh 69.17 billion (US$680 million).13
Financial services in the ASALs: Some research cites the challenges that many rural enterprises and communities face when accessing finance, further hampering small business development. According to a speech given at the Kenya Bankers Association annual conference in 2017 by Patrick Ngugi Njoroge, the head of the Central Bank of Kenya, a quarter of the Kenyan population faces major challenges accessing and using basic financial services. The reasons highlighted for poor access to banking services include a lack of tailored services to suit customers’ cash flows and banking needs, a lack of transparency and information disclosure to customers, particularly regarding interest rates, fees, and bank charges; and access to banking services in remote areas, some of which have low network coverage.14 However, as previously stated, this report aims to provide an analysis of the landscape and use of financial services in the ASALs, specifically LMS’ target counties, Turkana, Marsabit, Isiolo, Wajir, and Garissa. The information resulting from this report will be used to better ascertain the current state of financial products and services, and to inform future planning to attract investment and improve financial inclusion.
12 The SACCO Societies (Amendment) Bill, 2018. The Credit Information Sharing Association of Kenya (CIS Kenya). Accessible at <www.ciskenya.co.ke/press-release/ssa-amendment-bill> 13 Consultative Paper on the Review of Microfinance Legislations. Central Bank of Kenya. February 23, 2018. Accessible at <http://www.central bank.go.ke/2018/02/23/consultative-paper-review-microfinance-legislations> 14 Pathways to Resilience in Semi-Arid Economies (PRISE). Accessible at <prise.odi.org/wp-content/uploads/2016/01Low-Res_Kenya-CSA.pdf>

14
3. RESEARCH METHODOLOGY AND PROCESS Study design: The study used a non-probabilistic research design, meaning that sampling for this research was not conducted through random selection or probability sampling. LMS structured questionnaires for each category of respondents. Trained enumerators administered the questionnaires with respondents who were identified through meetings with LMS county-based staff and community leaders. In addition, LMS conducted a customer exit interview survey for customers leaving branches of financial institutions identified in each county, and led focus group discussions with key informants to retrieve information. Study area: LMS conducted this assessment in the five target counties of Isiolo, Marsabit, Turkana, Wajir, and Garissa. LMS also conducted interviews in Nairobi with financial institutions and investors. Target population and sample procedure: Enumerators sampled all 29 registered financial institutions operating within the five counties, 56 groups supported by The BOMA Project (BOMA) in two counties (Marsabit and Turkana counties), 147 individuals running various types of business, and 33 agencies providing Mpesa services and agency banking. The total sample size included 628 individuals. Enumerators also sampled 181 livestock farming households, primarily concentrated around livestock markets, to determine their economic activities, their source of capital to run businesses, how they sustain economic activities, and their ability to access financial services to help advance their ideas. Instrument used in data collection: Enumerators collected most of the data through primary research using key informant interviews, focus group discussions, and exit interviews that included interview schedules and questionnaires. The team also collected some information through secondary research using secondary data analysis and a literature review. The report notes secondary research with citations and includes a full list of references in section 6. Figure 4. Research process
Through a competitive process, LMS contracted the Tegemeo Institute of Agricultural Policy and Development at Egerton University in early June 2018 to complete this research and hypothesis validation. The Tegemeo Institute conducted demand-side and county-based supply-side interviews based on surveys developed by ACDI/VOCA, compiled collected data, recorded results in statistical analysis software, and provided initial outputs from data analysis. The Tegemeo Institute also collaborated with ACDI/VOCA and LMS partners, project staff, and Washington, DC-based technical advisory staff to create surveys that would capture information from participants in the most accurate, unbiased, and unproblematic ways possible. After developing the surveys, LMS held a multi-day workshop to train enumerators about the purpose of each survey, key questions and takeaway points, and cultural, gender, and age-sensitive implications. LMS also sought feedback on
June 2018: Research and survey
firm contracted by USAID LMS; surveys
developed
June-July 2018: Field surveys
conducted in USAID LMS target counties
July 2018: Surveys conducted in Nairobi with financial
institusions and supply-side actors
August-October 2018: Analysis conducted and report written

15
survey composition, adjusted the surveys where appropriate, and guided enumerators to conduct practice surveys. Focus group guides and key informant interview guides (KIIGs): 1. KIIG for financial institutions (commercial banks and MFIs) and non-bank financial institutions
(investors) operating in Northern Kenya 2. KIIG for financial institutions and non-bank financial institutions that previously operated in
Northern Kenya but no longer do 3. KIIG for financial institutions and non-bank financial institutions not currently operating in
Northern Kenya, but whose current portfolio, current/future strategy/plans, or values/mission show potential alignment to initiate operations in the ASALs
4. KIIG for national and county government funds 5. KIIG for mobile phone service providers, mobile agents, and/or agency banking 6. KIIG for livestock farming households/livestock-related business owners based in LMS target
counties in Northern Kenya 7. KIIG for non-livestock-related business owners/managers based in LMS target counties in
Northern Kenya 8. KIIG for financial institutions customers (customer exit interviews) 9. Focus group discussion guide for BOMA groups Enumerators conducted the above field surveys in Turkana, Marsabit, Isiolo, Garissa, and Wajir counties over a four-week period in June and July of 2018. AA1 County Program Managers and other county-based field staff worked with enumerators associated with the contracted research firm to set up meetings and interviews, provide context-specific guidance on their county’s economic and government dynamics, and to help increase the enumerators’ sample size. A research and evaluation firm compiled the data via statistical analysis software and provided initial outputs from the analysis to the LMS team in late July 2018. ACDI/VOCA’s Director for Catalyzing Investment traveled to Nairobi in July 2018 to complete supply-side interviews in Nairobi, where most investors and financial institutions maintain offices. The staff member conducted interviews with investors and financial institutions and supported the AA1 Director of Agribusiness and Investment to conduct national interviews, provide initial data analysis, synthesize findings, and compile initial recommendations. The Agribusiness Investment Director and Director for Catalyzing Investment completed the remaining report writing and analysis in Washington, DC. Key risks and possible data shortfalls: Prior to presenting the findings and outputs from this assessment, it is important to note possible risks and data shortfalls from the survey and data collection processes.
1. The sample size of supply-side data is small as a result of the research team’s dependence on the availability and willingness of investors, financial institutions, and other supply-side firms to participate, which could skew results and findings.
2. Researchers contacted supply-side firms to participate in the study using a preexisting list of contacts developed by the AA1 project and its partners, rather than identifying contacts through an open random sample, which could present some bias in the results.

16
3. Enumerators for demand-side research did not always speak the native language of county-level participants in interview and were not always of the same cultural group. Therefore, data from demand-side surveys may be limited due to language or cultural barriers.
4. Overall, researchers did not collect data through random sampling, which may present bias in responses or skew data more positively or more negatively than would have occurred through random sampling.
5. Some survey responses from financial institutions and customers during exit interviews omitted data on respondents’ sex and age group; yielding incomplete data.
6. Some of the financial institutions did not fully respond to questions due to the sensitivity of customers’ information.
17
4. FINDINGS AND ANALYSIS 1. Sample Statistics AA1 conducted its landscape assessment in all five target counties in the ASALs (Turkana, Marsabit, Isiolo Garissa, and Wajir) in June and July 2018. Enumerators surveyed and interviewed a total of 628 individuals for this assessment. Figure 5 outlines the supply-side interviews (KIIG 1 through 3) conducted with financial institutions (including MFIs), alternative investors, NBFIs, and other funds and financial services, both with representatives from Nairobi-based head offices and representatives based in LMS’ target counties in the ASALs. The team conducted demand-side interviews (KIIGs 4 through 9) with a total of 587 respondents, of which 40 percent were women and 60 percent were men. Figures 6 and 7 below show the distribution of respondents disaggregated by county and by gender. Figure 5. Financial institutions, NBFIs, and other funds interviewed
Entity Name Type of entity Number of staff interviewed Men Women
Agricultural Finance Corporation (AFC) Government 5 2 3
AHL Ventures NBFI 1 1 0 Barclays Bank 2 1 1 Consolidated Bank Bank 1 0 1 Cooperative Bank Bank 1 0 1 Equity Bank Bank 3 3 0 Faulu Microfinance MFI 2 1 1 First Community Bank (FCB) Bank 4 4 0
GroFin NBFI 1 1 0 Gulf African Bank Bank 1 1 0 Kenya Commercial Bank (KCB) Bank 7 5 2
KCB Foundation NBFI 1 1 0 Kenya Women Microfinance Bank (KWFT) MFI 5 5 0
Lundin Foundation NBFI 2 1 1 National Bank Bank 2 2 0 Platinum Credit MFI 1 1 0 Postbank Bank 1 0 1 Sidian Bank Bank 1 1 0 Stanbic Bank Bank 3 2 1 Takaful Insurance Insurance 2 0 2 Youth Enterprise Development Fund Government 2 2 0
Totals 21 48 34 14 Percentages 71% 29%

18
2. Supply Analysis: Descriptive Statistics of Lender and Investor Interviews One of LMS’ key components is to help improve access to finance and financial services for enterprises in Northern Kenya in order to help improve business opportunity, incomes, and resilience in the ASALs. As LMS considers ways to help financial institutions and other formal investors overcome challenges to providing financial services in Northern Kenya, the project wanted to collect more detailed information on:
(1) Which financial actors are currently operating in LMS’ target counties, and details regarding the products and services they offer
(2) The challenges that formal financial providers face or perceive to face when operating in Northern Kenya
(3) Opportunities they identify for increasing or expanding their operations in LMS’ target counties to help identify leverage points for future work
For the supply-side research for this financial sector landscaping assessment, LMS conducted field-based interviews with 29 county-based representatives from 12 finance suppliers (commercial banks and/or commercial MFIs), and conducted interviews with 20 Nairobi-based representatives from 11 finance suppliers (commercial banks, MFIs, government entities, alternative investors, and insurance providers). In total, LMS interviewed 41 individuals representing 21 unique finance suppliers covering debt, equity, and mezzanine capital. Figure 8 below provides a summary of the landscape of types of capital providers interviewed that actively operate in at least one of LMS’ target counties, and their coverage across LMS target counties in Northern Kenya. Figure 8. Table of suppliers of capital that have offices in, provide active coverage to, or have active investment holdings in LMS AA1’s target counties in the ASALs
County Entity Turkana Marsabit Isiolo Garissa Wajir
Figure 6. Total number of respondents, by gender (n=587)
Figure 7. Total number of respondents, by gender, by county (n=587)

19
Commercial Banks Barclays ●● ●● Consolidated Bank ●● Cooperative Bank ●● ●● ●● ●● Equity Bank ●● ●● ●● ●● ●● First Community Bank (FCB) ●● ●● ●● Gulf African Bank ●● Kenya Commercial Bank (KCB) ●● ●● ●● ●● ●● National Bank ●● Postbank ●● Sidian Bank ●● Microfinance Institutions Faulu Microfinance ● ● ● ● ● Kenya Women Microfinance Bank (KWFT) ●● ●● ●● Platinum Credit ●● Alternative Investors Lundin Foundation ●● Insurance Providers Takaful Insurance ● ● ● ● ●● Government Entities Agricultural Finance Corporation (AFC) ●● ●● ●● ●● ●● Women Enterprise Fund ●● ●● ●● ●● ●● Youth Enterprise Development Fund ●● ●● ●● ●● ●● �� = Operates with branch office � = Covers the region remotely The following sections provide more detailed analysis of coverage, services, products, challenges, and opportunities regarding supplying finance, investment, and capital in Northern Kenya. 3. Supply: Lender and Investor Analysis Data collected from each of LMS’ target counties on the supply of financial services among business owners, households, and communities is organized along the following segments: 3.1. Private financial institution representatives (commercial banks and MFIs)
A. Based in LMS target counties B. Based in Nairobi
3.2. Commercial bank and MFI customer exit interviews 3.3. Public and non-commercial financial providers 3.1.A. Financial Institution Representatives based in LMS Target Counties This section of the landscape assessment sought to identify the financial institutions and investors operating in LMS’ five target counties and the financial products and services they offer to actors in

20
the livestock market system, and to determine key information regarding their operations such as average number of clients per financial institution, average loan sizes, and more. In total researchers interviewed 29 county-based representatives from 12 commercial banks and/or commercial MFIs. Types of financial products and services offered: To provide a clearer landscape of the competition in the financial marketplace and the breadth and depth of services currently on the market in LMS’ five target counties, interviewees at financial entities’ county-level offices in the ASAL provided information on the types of financial services available at their branches. Figure 9 below displays this information by county and by service segment. Based on the data in Figure 9, Turkana county offers the overall greatest competition in the marketplace compared to the other four counties, with five entities providing SME or cooperative lending, four entities providing micro or group lending products, three entities providing insurance products, three entities providing business advisory services, and two providing corporate lending services. Isiolo county has the second-largest marketplace, followed closely by Marsabit. According to the data in Figure 9, Wajir county demonstrates the least competitive financial sector marketplace, with only one entity providing micro and group lending, business advisory services, and corporate lending.
Estimated number of clients at commercial banks: In their interviews with bank representatives based in LMS target counties, surveyors requested the estimated number of clients served by the respective bank branches. Overall, bank representatives hesitated to share such information due to business sensitivities. Those willing to share data provided rough, potentially biased estimates. In total, the number of clients at all commercial banks interviewed across LMS’ five target counties came to approximately 117,000, but further research is required to better clarify the accuracy of this figure. Loan terms: While interest rates cited among respondents for all types of loan products ranged from 1 percent to 22 percent, the vast majority of representatives from financial institution stated that their average interest rate for agriculture or livestock-related enterprises is 13.5 to 14 percent. This range is in line with rates across Kenya per the Central Bank of Kenya’s agriculture interest rate
Figure 9. Top financial services offered by county Analysis of competition and breadth/depth (n=29)

21
Figure 10. Percent of commercial bank loan portfolios that are Shariah-compliant Self-reported data from FI representatives (n=29)
cap instituted in 2016. Working capital loans typically have a tenor of 2 years or less, short term loans have tenors of 2 to 5 years, and long-term loans range from 5 to 10 years. Islamic banking and Shariah compliance: The team interviewed five financial institutions that stated that they offer Shariah-compliant products and services in LMS’ target counties: Kenya Commercial Bank Barclays, National Bank, First Community Bank, and Gulf Bank of Africa. Figure 10 below displays responses bank branch representatives in LMS target counties on the percent of their portfolios that are Shariah-compliant. According to bank branch representatives’ responses, First Community Bank and Gulf Bank of Africa offer products that create portfolios that are 100 percent Shariah-compliant, whereas only 10 percent of Barclays and National Bank portfolios are Shariah-compliant. Shariah-compliant products are often branded under different names depending on the institution. For example, KCB brands its Shariah-compliant products and services under its Sahl Banking line, Barclays offers a Shariah-compliant line of products and services called “La Riba,” and others use murabahah, which includes a variety of financing models that use profit-sharing rather than interest rates. Security and collateral: All the interviewed financial institutions require some type of security or collateral for loans, which depends on the type and value. Examples of such securities include insurance coverage for animals owned by individuals or enterprises in the livestock industry, proof of current salary levels for salary or scheme-based lending, and title deeds or other physical assets for short and long-term loans. In interviews, several bank representatives mentioned an increase in potential customers seeking loan products that will accept a wider variety of potential collateral items, such as electronics, refrigerators, or air purifiers as collateral for SMEs, or considering the animal itself as collateral for livestock-related loans rather than the animal’s insurance policy. Mobile and digital products: All financial institution representatives based at branches located in Northern Kenya stated that they offer a number of mobile and digital tools and services to their clients, including:
• M-Pesa services to pay bills and purchase goods (see text box on page 22) • Mobile banking services under a variety of brand names, depending on the institution • Market information, financial literacy support, and mobile payment and transfer services for
agricultural clients via Mobigrow, a market information service offered by KCB • Payment services for M-KOPA, a solar energy provider in Kenya • Pesalink, a product that allows digital money transfers between banks

22
• General online and internet-based banking
While researchers did not capture exact figures, representatives interviewed also stated that youth, employed people, and business people are the primary users of digital banking services. On average, bank representatives stated that they see mobile money and digital services as an enabler to expand lending in the ASALs, despite the fact that 74 percent of interviewed representatives mentioned that network coverage limitations slowed down penetration to more remote areas. Representatives cited Merti and Garbatula in Isiolo; Merille, Sololo, Burat, Kinisa, and North Horr in Marsabit; Namorputh, Elima, Napetet, Kangatotha, and Lomopus in Turkana; and parts of Griftu in Wajir as the areas with the worst network coverage. Insurance products: In addition, LMS also sought information on the type and availability of insurance services offered by financial institutions operating in the target counties. Of the institutions interviewed, 86 percent confirmed that they provide direct insurance services or serve as agents for insurance companies such as APA, Britam, CIC, and Heritage. The available insurance services include:
• Motor vehicle • Medical • Insurance coverage for collateral • Livestock coverage, charged at 5 percent of the total assessed value of the livestock
On average, financial institution representatives stated that agent relationships with insurance companies helped mitigate bank losses, contributed to branch profitability and investment return, and helped contribute to the greater uptake of insurance products. All interviewed representatives
Selected Mobile Money Products and Services in Kenya
M-Pesa is a mobile phone-based money transfer service started by Safaricom, the largest mobile network operator in Kenya. M-Pesa allows users to deposit money into an account stored on their phone and transfer money to other users, including individuals and enterprises, using SMS text messages. Nearly all financial institutions operating in Kenya allow transfers to and from M-Pesa accounts to bank accounts, drastically improving financial inclusion to formal accounts since its introduction to the market in 2007. M-Pesa has also established M-Chama (microsavings groups) accounts to improve chama members’ security and transparency through cashless savings and transactions. As of June 2018, M-Pesa had 23 million subscribers and controlled an estimated 81 percent of Kenya’s mobile money market. M-Shwari is a mobile finance product that enables anyone with an M-Pesa account to open a Commercial Bank of Africa (CBA) account to deposit money or access loans without visiting a branch. It was launched in November 2012 by CBA in partnership with Safaricom. For deposits and microsavings accounts, customers do not require a minimum balance, are not charged for transacting to and from the account, and can earn up to 6.65 percent per annum. For loans, borrowers can borrow from Ksh 100 to Ksh 50,000 (US$1 to 500) and are charged a one-time 7.5 percent fee on the value of each loan rather than charged interest. Loan limits are determined based on the previous transaction history on M-Pesa and deposits in M-Shwari accounts. In addition to offering savings and lending, products such as M-Shwari help customers build a credit history.Sources: Kivuva, Elizabeth. “M-Pesa maintains top slot of mobile money space.” The Star, Kenya, March 23, 2018: https://www.safaricom.co.ke/personal/M-Pesa; Safaricom website, M-Pesa: https://www.safaricom.co.ke/personal/M-Pesa; Safaricom website, M-Pesa, Do More with M-Pesa: https://www.safaricom.co.ke/personal/M-Pesa/do-more-with-M-Pesa/loans-and-savings.

23
projected that their insurance products and service lines would grow over the next five years due to the increased demand for loans, increased access to insurance information through existing bank channels, increased understanding of the benefits of insurance coverage, and the increased probability of drought due to climate change. Current incentives, guarantees, or risk coverage mechanisms to operating in Northern Kenya: Some financial institutions mentioned that they have received or are party to mechanisms that enable them to better cover their risk and incentivize them to operate in Northern Kenya. For example, Equity Bank supports implementation of the Hunger Safety Net Program, a cash-transfer program for individuals and families living in poverty, which allows them to expand their footprint in Northern Kenya. Kenya Commercial Bank issues government payments for the elderly, and Islamic Relief, a global charity, provides loan guarantees to First Community Bank to lend to specific communities and regions in Northern Kenya. Perceptions of the future environment for business and investment: Out of the 29 financial institution representatives from LMS target counties that were interviewed, 93 percent believe Northern Kenya’s business growth and investment environment would improve or significantly improve over the next five years. Their reasons for this belief included the following:
• Continued positive effects of devolution on resource use and allocation • Favorable government policies, such as the Access to Government Procurement
Opportunities (AGPO) program, which helps youth, women, and persons with disabilities increase access to government procurement opportunities so that they comprise at least 30 percent of all national government procurement
• Visible growth of SMEs in the region • Improved security in the region • Technological advancement and penetration in the region • Improving network coverage in more remote areas • General increase in population and market size • Improved saving behaviors and habits • Major infrastructure projects such as the LAPSSET corridor investment • Investments in the oil industry in Turkana
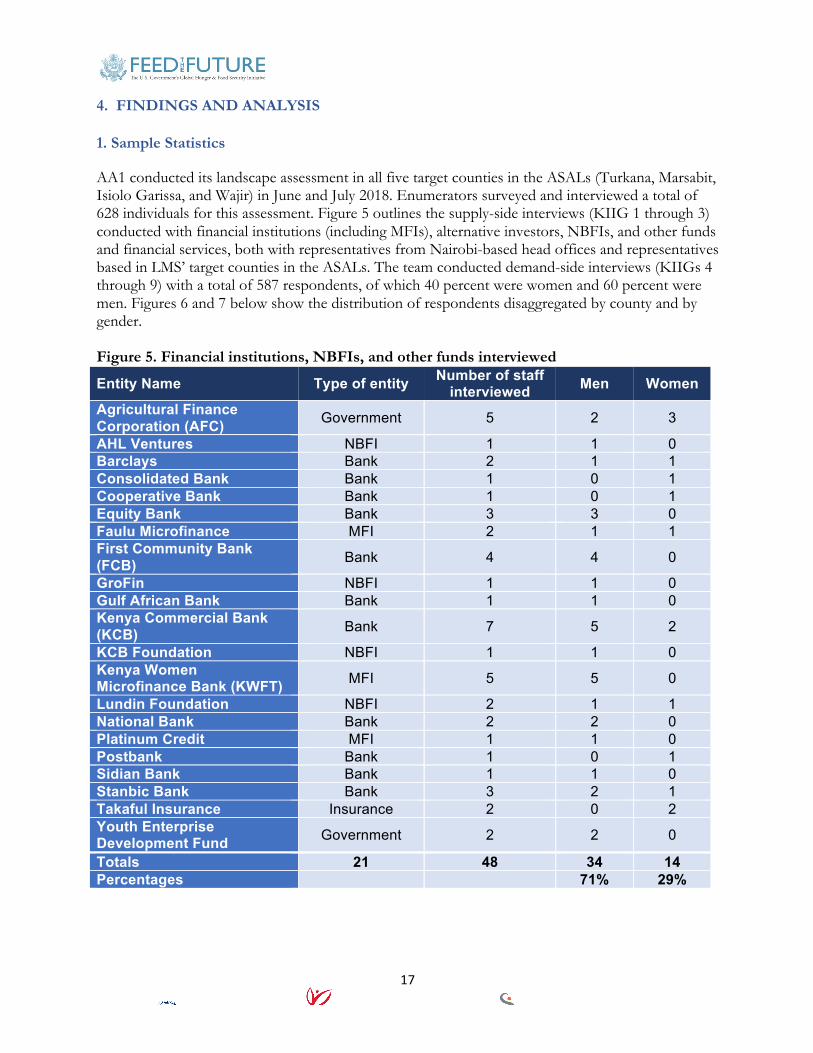
Financial institutions listed specific regions as priority areas for expansion and investment, including Kakuma and Lodwar in Turkana county; Merti, Garbatula, Modogashe, and Kina in Isiolo county; Sololo in Marsabit county; and Habaswen in Wajir County. While not all financial institutions were open to sharing information, Figure 11 shows the anticipated amount of investment that would be generated if various financial institutions expand their operations in Northern Kenya over the next five years based on representatives’ interview responses.
24
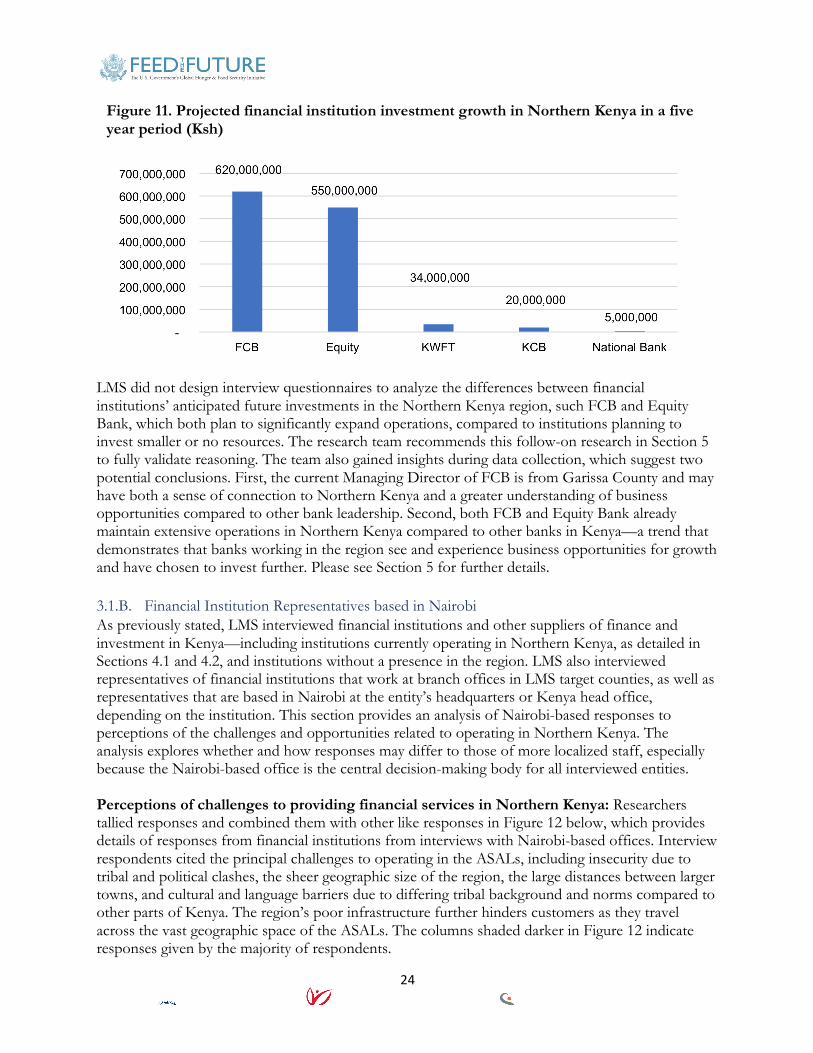
LMS did not design interview questionnaires to analyze the differences between financial institutions’ anticipated future investments in the Northern Kenya region, such FCB and Equity Bank, which both plan to significantly expand operations, compared to institutions planning to invest smaller or no resources. The research team recommends this follow-on research in Section 5 to fully validate reasoning. The team also gained insights during data collection, which suggest two potential conclusions. First, the current Managing Director of FCB is from Garissa County and may have both a sense of connection to Northern Kenya and a greater understanding of business opportunities compared to other bank leadership. Second, both FCB and Equity Bank already maintain extensive operations in Northern Kenya compared to other banks in Kenya—a trend that demonstrates that banks working in the region see and experience business opportunities for growth and have chosen to invest further. Please see Section 5 for further details. 3.1.B. Financial Institution Representatives based in Nairobi As previously stated, LMS interviewed financial institutions and other suppliers of finance and investment in Kenya—including institutions currently operating in Northern Kenya, as detailed in Sections 4.1 and 4.2, and institutions without a presence in the region. LMS also interviewed representatives of financial institutions that work at branch offices in LMS target counties, as well as representatives that are based in Nairobi at the entity’s headquarters or Kenya head office, depending on the institution. This section provides an analysis of Nairobi-based responses to perceptions of the challenges and opportunities related to operating in Northern Kenya. The analysis explores whether and how responses may differ to those of more localized staff, especially because the Nairobi-based office is the central decision-making body for all interviewed entities. Perceptions of challenges to providing financial services in Northern Kenya: Researchers tallied responses and combined them with other like responses in Figure 12 below, which provides details of responses from financial institutions from interviews with Nairobi-based offices. Interview respondents cited the principal challenges to operating in the ASALs, including insecurity due to tribal and political clashes, the sheer geographic size of the region, the large distances between larger towns, and cultural and language barriers due to differing tribal background and norms compared to other parts of Kenya. The region’s poor infrastructure further hinders customers as they travel across the vast geographic space of the ASALs. The columns shaded darker in Figure 12 indicate responses given by the majority of respondents.
Figure 11. Projected financial institution investment growth in Northern Kenya in a five year period (Ksh)
25
Together, the top three challenges—insecurity, vast geographic spaces, and cultural and language differences—collectively create higher service costs, a greater threat of physical harm, and overall higher systematic risks for financial institutions. This background information, as well as the perspective of a bank or formal financial institution, helps illustrate why financial inclusion in Northern Kenya is lower than most other areas of Kenya. However, programs such as LMS can affect change by helping financial institutions consider some of these challenges and opportunities for increased business, ultimately increasing financial inclusion and access to finance for rural enterprises and communities. Mobile financial technology and agent banking models, for example, already deepened financial markets in Kenya, and further support or incentives could help financial institutions overcome challenges in customer acquisition due to the vast geography and distance between urban centers in the North. See Section 5 for further recommendations. LMS also wanted to highlight the current and future opportunities available to financial entities operating in Northern Kenya. Such information could be used as leverage points to help increase financial flows from entities currently operating in Northern Kenya and help attract new entrants to the market. Figure 13 displays a summary of the opportunities identified by Nairobi-based financial sector representatives regarding operations in Northern Kenya. While the number of identified opportunities is less than the number of challenges listed in Figure 12, financial representatives consider the most significant opportunity to be capturing market share as one of the first movers in the market. Interestingly, financial institutions did not mention opportunities for expanding lending outside of those in livestock and agriculture value-addition in Northern Kenya, even though demand for lending is high and the significant lack of customers utilizing lending products from most institutions (see page 38, Figure 31). Further, 40 percent of respondents cited a “first mover” or
Figure 12. What challenges does your entity face, or what challenges has your entity heard of, regarding operating in Northern Kenya? (n=11)

26
“early mover” advantage to operating in Northern Kenya now, despite the fact that several financial institutions already operate in the region. See Section 5 for further analysis.
Interviewers asked Nairobi-based representatives of financial institutions in Kenya whether they believed the opportunities for investment in Northern Kenya would improve, worsen, or stay the same over the next five years. Interestingly, as shown in Figure 14A, all respondents in this group stated that they believe opportunities would improve. Furthermore, a majority believes there will be significant improvement, regardless of whether their institution has stated plans to expand in Northern Kenya to capitalize on opportunities in the near future (see Figure 11). When asked to explain their predictions in Figure 14B, half of respondents stated that they believed the Kenyan government’s policies and movement toward devolution in county governments would continue to create economic opportunity and an improved business environment. Respondents also referenced the Government of Kenya’s “Big Four” agenda numerous times as proof of significant government emphasis and investment in the region, which respondents believe will create lasting effects on the economy. Respondents also cited recent oil discoveries in Turkana county and new investments in infrastructure, particularly roads.
Figure 13. What opportunities does your entity see to operate in Northern Kenya? (n=11)
Figure 14A. Over the next five years, do you believe that the opportunities for investment in Northern Kenya will improve, worsen, or stay the same? (n=11)

27
3.2. Customer Exit Interviews LMS sampled 54 customers who were departing one of the commercial banks or MFIs listed earlier in Figure 8 to collect real-time information on their use of products and services, as well as feedback on experiences at financial institutions operating in Northern Kenya. Figures 15 and 16 compile responses from customers who were interviewed regarding their use of savings and lending products offered at their respective financial institutions. The data illustrates that customers utilize savings products such as savings accounts more frequently than loan products. Those who use savings deposits stated an average deposit rate of return of 7.5 percent.
Figure 14B. What are your reasons for thinking this? (n=11)
Figure 15. Do you utilize savings products offered at this financial institution? (n=54)

28
Out of the 54 customers interviewed, 80 percent affirmed that the quality and diversity of financial services improved over the past five years (see Figure 17). Customers mentioned several reasons for this improvement, including better access to and understanding of savings products, the ability to use simple and time-saving mobile and online banking for transactions, improved customer service, the increased availability of ATM services to withdraw money, and the increased access to banking due to more bank agents, particularly in remote communities. Sixty-two percent of customers interviewed also use mobile banking services in conjunction with their financial institution to transfer money and pay bills.
3.3. Public and Non-Commercial Financial Providers Knowing the prevalence of aid organizations, donor-funded programs, and government funds in Northern Kenya, LMS also mapped the public and non-commercial financial providers offering financing and funding to enterprises and individuals in Northern Kenya at the time of this assessment. Figure 18 displays a map of the organizations and initiatives encountered during a survey in LMS’ target counties, with Figure 19 providing a summary of services offered in their respective counties and spheres of work. Note that the programs and organizations listed in the figures below are current as of the time of this report; projects and donors frequently change in
Figure 16. Do you utilize loan products offered at this financial institution? (n=54)
Figure 17. Over the past five years, have services from this institution improved, worsened, or remained the same? (n=54)

29
Northern Kenya, as is common in many other markets. Continuous research is required to maintain up-to-date information.
Figure 19. Summary of public and non-commercial sources of funding Entity Type Funding Action Aid NGO Offers grants to micro-ventures to support livelihood
diversification and micro-irrigation schemes ARDF NGO Offers revolving funds to women’s groups CARITAS NGO Offers loans to people living in poverty; provides
training on group saving and lending Child Fund NGO Provides sponsorship to children from needy families Garissa County Office of Trade and Industry
County Government
Offers revolving funds to residents to start or expand businesses, or any other income-generating activity
Figure 18. Map of public and non-commercial financing sources Information as of time of finalization of assessment in October 2018 Note: the Youth Enterprise Development Fund and Women Enterprise Fund, funded by the Government of Kenya, operate in all counties.

30
Islamic Relief NGO Purchases in-kind materials and equipment for enterprises operating in target communities
Kenya Red Cross NGO Provides cash transfers to households living in poverty
Ministry of Agriculture
National Government
Offers loans to agriculture and livestock-related enterprises
Ministry of Trade National Government
Offers a revolving fund that provides loans to traders at 0% interest; provides training on financial services
PACIDA NGO Provides cash transfers to women and youth to begin enterprises; funds school programs
SIFA NGO Offers grants to micro-ventures to support livelihood diversification
Turkana County of Cooperatives
County Government
Lends to cooperative entities such as SACCOs to finance enterprises
USAID RAPID Donor Project Offers start-up kits for small businesses and water infrastructure for communities
Women Enterprise Fund
National Government
Offers loans and financial services to female entrepreneurs
World Bank Climate Smart Agriculture Project
Donor Project Offers farmers agricultural financing for farming schemes and projects that are climate-smart
Youth Enterprise Development Fund
National Government
Offers loans and financial services to youth entrepreneurs
3.4 The BOMA Project’s Rural Entrepreneur Access Project (REAP) The BOMA Project (BOMA) is a sub-implementing partner to ACDI/VOCA on its implementation of LMS. BOMA establishes and implements high-impact programs for ultra-poor women in drought-affected arid lands in Africa, including in Kenya’s ASALs. Through its Rural Entrepreneur Access Project (REAP) model, BOMA facilitates the establishment of selected groups of women through community consultation and provides two years of hands-on mentoring and coaching on business management, gender-focused life skills, and human rights. BOMA also provides conditional cash transfers for women to launch and sustain enterprises. Participating women are considered to have “graduated” from extreme poverty when they meet six mandatory criteria exhibiting resilience, including no child going to bed hungry in the last month, accessing more than one source of income, having a minimum of Ksh 8,000 (US$80) in savings, and having all eligible girl children in participants’ households attend primary school. As a part of this research and landscaping assessment, LMS conducted interviews and focus groups with BOMA REAP group participants to better understand their specific flows of, uses of, and needs for financing. For the purposes of this report, we classified BOMA under the “supply-side” of capital as a unique financial provider to micro-entrepreneurs and ultra-poor communities. Knowing that BOMA’s holistic REAP model provides more than finance, though, and may not provide as clear of a comparison to other financial providers in Northern Kenya, we have reported these findings separately in Annex 1 of this report. Please see Annex 1 for further details.

31
4. Demand Analysis: Access and Use of Finance among Communities in Northern Kenya Data collected from each LM’ target county on the demand for and use of financial services among business owners, households, and communities is organized along the following segments: 4.1. Mobile phone service providers, mobile agents, and/or agency banking 4.2. Business owners/managers based in LMS target counties in Northern Kenya 4.3. Livestock farming households and traders based in LMS target counties in Northern Kenya 4.1. Mobile phone service providers, mobile agents, and/or agency banking Background: Agent banking is business model that allows banks to take banking services to the unbanked and underbanked at cheaper rates. Banks identify, vet, and train agents who engage in basic banking services on behalf of the bank, typically on a commission basis per value of transaction or service provided. Banks in Kenya must be licensed to engage in agent banking. The licensing process entails submitting an application to the Central Bank of Kenya that estimates the projected number of agents per county that the bank would have over three years, a report of the bank’s due diligence policy and procedures for vetting and training agents, a description of services that agents would provide on behalf of the bank, a template agency contract, policies, procedures, internal controls, and technology the bank would require its agents to use and follow, risk management and mitigation policies, and a description of market channels and business growth strategies.15 For this financial landscape assessment, LMS explored whether, how, and the extent to which agent banking services are available and used in the five counties. In total, researchers identified and interviewed 33 agents (9 women, 24 men) over the course of field surveying (13 in Garissa, 3 in Isiolo, 11 in Marsabit, 4 in Turkana, and 2 in Wajir). Becoming a bank agent: In interviews, agents noted that to become agents they are required to be licensed, a process that requires the following:
• Pay a one-time, nonrefundable fee of KSH 1,000 (US$10) to the Central Bank of Kenya for registration and vetting
• Submit a copy of an identification card, Curriculum Vitae (CV), and Kenya Revenue Authority (KRA) PIN number
• Provide a summary of business activity the agent carried out for the last 18 months
• Submit a letter of good conduct • Submit a description of the banking
services that the agent will handle on behalf of the bank • Submit a letter of confirmation from a senior member of the prospective bank stating that
the prospective agent meets the minimum required qualifications
15Guideline on Agent Banking – CBK/PG/15. Central Bank of Kenya. Accessible at <https://www.centralbank.go.ke/images/docs/legislation/GUIDELINE%20ON%20AGENT%20BANKING-CBK%20PG%2015.pdf>
Perspectives from Bank and Mobile Money Agents
Our research shows that agency and/or mobile banking services recently gained popularity in the ASALs. However, some agents still find challenges in expanding their services due to confusion on how bank agents or mobile banking operate. One agent stated, “Some people don’t understand how their money will be at the bank, while at the same time be with the agents. For some, trust is an issue because they feel that it’s easy for them to be robbed of their money.”

32
Bank agent presence: The following banks and financial service providers have agent networks in at least one of the five LMS target counties: Figure 20. County disaggregation of agent banking services in LMS target counties
Financial Institution County with Agent Banking Services Turkana Marsabit Isiolo Garissa Wajir
Equity Bank ● ● ● ● ● Kenya Commercial Bank ● ● ●
Cooperative Bank ● ● ● Commercial Bank of Africa ●
While the majority of interviewed agents work for one service provider, about one-third of the interviewed agents work for two or more service providers, demonstrating the ability per Kenyan regulations to work as an agent for more than one bank, and the strategies that some agents employ to increase customer traffic for their agency services. Figures 21 and 22 below show the various types of banks and other service providers that agents work for, as well as the breakdown of agents working for one or more provider.
Customer profiles and preferences: Agents estimated that an average of 75 percent of their customers are men and at least half are under the age of 35. Agents offer the following services, listed in descending order of frequency:
• Cash withdrawal and deposit services
• Loan repayments • Mobile banking services,
including M-Pesa and M-Shwari (see text box on page 22)
• Bill payment • Salary payment • Funds transfer • Balance inquiry
Figure 21. Number of agents working for each service provider (n=33)
Figure 22. Agents working for multiple providers

33
• Document collection for debit and credit cards • Loan applications and account opening forms • Checkbook requests • Collection of bank correspondence and mail
During interviews, some agents noted that they work with the banks listed above because they offer M-Shwari services, which they cited as growing in demand among their customers. Further, agents mentioned that customers often trust banks like Kenya Commercial Bank more than others since the Kenyan government holds shares in the bank, indicating financial stability. The study’s findings from agents interviewed noted that despite the significant growth of agency banking, significant challenges inhibit even faster growth. Challenges differed among agents interviewed, but generally included agent rights advocacy, accessing start-up capital for licensing and registration, stringent government regulations, low literacy levels, lack of customers in more remote areas, limited access to float, low returns/low commissions, high taxes, poor network coverage, registration processing times, securing premises for agencies, access to necessary equipment such as POS terminals, and fear of being robbed. Despite these challenges, the vast majority of bank agents believe that the opportunity to provide such services will improve in the future, with all respondents from Turkana, Garissa, and Wajir indicating this optimism. The agents in Isiolo, with its southern proximity to Nairobi and more saturated market compared to other counties, demonstrated the least optimism about future opportunities likely due to an already more competitive environment, with 33 percent of respondents predicting that opportunities for agent banking would remain the same over the next five years. See Figure 23 for further details.
Some respondents shared locations where they thought strong opportunities for agent banking services exist. Agents identified Bubisa, the Ethiopian border, North Horr, and Logologo in Marsabit as potential locations for expanding agency banking. In Isiolo, agents mentioned Archers Post and the Isiolo livestock market, Madogo and Odha in Garissa, and Loima and Lodwar town in Turkana.
Figure 23. Over the next five years, do you believe the opportunities for agent banking will improve, worsen, or remain the same?

34
Perceptions of opportunities: The majority of the interviewed agents believed that opportunities for agent banking in Northern Kenya will improve over the next five years for the following reasons:
• Customers increasingly find agent banking to be an easier and more convenient way to make transactions
• Infrastructure improvements, particularly along the relatively new Isiolo-Marsabit-Moyale highway, created opportunities for doing more business through central Northern Kenya and Ethiopia, helping to facilitate the growth of business opportunities, new rural towns, and multiplying needs for banking services
• Increased digital literacy among those who use mobile agent banking services • A ready market of elderly residents utilizing cash transfer programs • Increase in network coverage and reliability • Increased confidence in the security of using financial services for larger transactions
4.2. Business owners/managers based in LMS target counties in Northern Kenya Sample statistics: LMS interviewed a sample of 147 businesses owners and/or managers among the five target counties in Northern Kenya. Interviewed businesses include electronic appliance and electronics retailers, farm inputs and animal health equipment retailers, basketry sellers, bookstores, cosmetics and beauty product retailers, butcheries, furniture retailers, grocery shops, hardware retailers, hotels, livestock sellers, M-Pesa service providers, milk distributers, poultry product sellers, general retail shops, and transportation service providers. Figures 24 and 25 below disaggregate the businesses by type and county. Figure 24. Businesses interviewed, total, by business type (n=147)
8 4 4
5 5 5
9 11
12 12
14 18
40
0 5 10 15 20 25 30 35 40 45
Other Bookstore
Grocery Poultry products and services
Transport services M-Pesa services Livestock trading
Hotel Agrovet/Chemist
Butchery Spare parts
Beauty & Cosmetics General Retail

35
Figure 25. Businesses interviewed, by type, by county (n=147)
Business operations: Survey results showed that over 95 percent of interviewed businesses operate in rented premises. Average rental rates range from Ksh 6,000/month (US$59) to Ksh 22,000/month (US$218), with Isiolo county charging the lowest rent for business owners. The chart below (Figure 26) shows average rental rates across counties according to collected data. In addition, data output indicated that men manage the vast majority of businesses interviewed across all LMS target counties, except for Isiolo county where 70 percent of business managers interviewed were women, indicating higher prevalence of female business management. According to the data collected in this study, men are more likely to manage livestock trade and other livestock-related businesses, while women are more likely to manage businesses like retail shops, grocery, and vegetable vending. The research team also asked business managers about the types of documents necessary to formally operate their businesses, including a business registration certificate, driver’s license for those in the transport industry, health code certification for hoteliers, business permit/trade license, tax filings, certification from the Kenya Bureau of Standards for businesses working in food processing and packaging, and land title deeds. Respondents noted that it is relatively easy to operate a business in Northern Kenya after obtaining the necessary documentation. However, some respondents noted a difficult and lengthy time commitment needed to acquire the documentation.
0 5 10 15 20 25 30 35 40 45
Other Bookstore
Grocery Poultry products and services
Transport services M-Pesa services Livestock trading
Hotel Agrovet/Chemist
Butchery Spare parts
Beauty & Cosmetics General Retail
Turkana Marsabit Isiolo Garissa Wajir
Figure 26. Average monthly business rental rate by county (Ksh)

36
Financing business operations: This assessment focused on determining how and why business owners acquire financing for their enterprises. Figure 27 below illustrates whether business owners received a loan or line of credit from any source, disaggregated by gender.
Researchers asked business owners and managers why their enterprises needed additional capital over the past two years and whether they received loans or financing from external sources. According to the findings in Figure 28 below, the overwhelming majority of business owners across all LMS target counties required working capital to better finance their current business lines or expand to greater capacity utilization within their current operations. See Figure 28 for more details.
Business managers who did take a loan or line of credit indicated that they finance their businesses from a variety of sources. Figure 29 shows responses by source and by county, and Figure 30 shows responses by type (commercial, public/NGO, or informal). Business owners received loans for amounts ranging from Ksh 10,000 to 150,000 (US$100 to $1,500). Significantly, as shown in Figure 30, 57 percent of respondents took loans from commercial entities (defined as banks, MFIs, or mobile money products and services) over the past five years, and 13 percent took loans from
Figure 27. Have you taken a loan or line of credit over the past 5 years? (n=138)
Figure 28. For what reasons have you sought additional capital for your business over the past two years? (n=123)

37
SACCOs—indicating that 70 percent of respondents utilize formal sources of financing. This data is counter to one of the original research hypotheses described in section 1.
Further, the majority of business managers explained that access to financial services increased significantly over the past several years due to more reliable network connectivity in the region, estimated to be 98 percent provided by Safaricom. Using data from interviews, we estimate that 79 percent of enterprises in LMS’ target counties are dependent on the availability of mobile phone networks to access finance and financial services for their businesses. Therefore, in regions with low network connectivity, access to financial services is usually also limited. However, interview participants cited challenges to accessing financial services, particularly for business expansion and start-up, including:
• Difficulty accessing unsecured loans and financing, even for smaller amounts • Lack of Shariah-compliant products • High interest rates, notably among M-Pesa loans from Kenya Commercial Bank • Lack of lending products tailored to the seasonal nature of agriculture and livestock farming • Lack of availability of emergency credit sources • Limited or lack of availability of larger loan sizes
Figure 29. If you did take a loan within the past 5 years, from where did you receive it? (by entity) (n=84)
Figure 30. If you did take a loan within the past 5 years, from where did you receive it? (by type of source) (n=84)

38
• Limited M-Pesa super agents that can provide larger and more frequent cash floats to other M-Pesa agents
• Long distance travel required to access agents or branches of financial institutions • Lack of understanding of loan application requirements and procedures • High taxes charged on loans
For business owners or managers that can access financing for their businesses, requirements for accessing loans included being an account holder/member of the financial institution, submitting copies of recent bank statements, submitting copies of business permits, licenses, and registrations, submitting proof of a credit reference bureau clearance, and providing appropriate documentation of collateral when borrowing from banks. Researchers also asked business owners whether they need types of financial services that are not, to their knowledge, currently offered by local providers. Business owners cited increased and more tailored loan products as the primary need, across nearly all counties. Business owners also highlighted increased access to Shariah-compliant loans and greater access to mobile money services as top services sought. Figure 31 provides more details and a breakdown of responses by county.
Despite these challenges, business owners also mentioned their ability to access several financing and financial advisory opportunities over the past three years, including:
• One business owner cited receiving a loan to secure cold chain facilities • One business manager received business advisory services to improve business operations,
strategy, and growth • One business owner referenced the benefits of using mobile banking services to pay bills
without needing to travel to bank agents or branches
Figure 31. Are there financial services you need that are not currently offered by local providers? If so, what are those services? (n=60)
39
• Other business owners referenced gaining a better understanding of privacy in financial transactions and earned interest on deposits
Overall business growth: Business owners cited geographic and sector-specific reasons to explain their predictions of future business growth, particularly wage job and income-generating opportunities, including the following:
Ø Turkana county: Oil discoveries increased general investment in the county, contributing to more money in circulation and a boom in the hotel industry.
Ø Mobile financial services providers: Increasing demand for M-Pesa services due to increased network connectivity and the need for business to business (B2B) and business to consumer (B2C) transactions.
Ø Motorcycle (“boda-boda”) drivers: Increased employment in the sector due to improved infrastructure and ease of traveling.
In addition, over the past five years, business owners cited significant business growth among their enterprises. Based on self-estimates from interviews, business revenue grew an average of 75 percent across LMS’ target counties over the past five years, or approximately 15 percent per year, for reasons that include:
• Increasing access to markets and growth in both size and demand from such markets • Improved security attributed to devolution • A more stable political environment • Availability of physical space to expand businesses • Greater availability of financial service providers • Increasing demand for electronics due to technology uptake in the region • Increasing cross-border trade • Infrastructure improvements that helped increase network connectivity and reduce
transportation times • Increasing literacy levels • Increased purchasing power and disposable income that allows for non-sustenance
purchases, such as beauty products Awareness of lenders and financial service providers: In addition to the private sources of capital listed in Figure 29 above, 65 percent of interviewed business owners mentioned that they are aware of several public sources of funds offered by the Kenyan national government or county governments to help improve livelihoods and secure financing for their businesses, often at lower rates than those available in the finance sector. For funds managed by national-level entities, such as the Youth Enterprise Development Fund or the Women Enterprise Fund, funding is available to businesses operating in all counties in Kenya. Figure 32 shows government-managed funds’ level of penetration in the remote counties in Northern Kenya.

40
A list of Kenyan national government financing opportunities and funds available in LMS target counties is detailed in Figure 33; also see Figures 18 and 19 on pages 29-30 for more details on sources of public financing. Figure 33. National and county government funding sources Name of Fund Brief Description Counties Available Youth Enterprise Development Fund
Provides start-up grants and other funding for youth-run enterprises All LMS target counties
Women Enterprise Fund Provides start-up grants and other funding for women-run enterprises All LMS target counties
Trade Finance Fund
Provides loans and other financial services (letters of credit, other business documentation, etc.) for enterprises involved in contract farming and export/import markets
All LMS target counties
Uwezo Fund Provides start-up grants and other funding for women and youth-run group enterprises
All LMS target counties; groups must be registered through social services
County Revolving Funds Provides capital through loan products and other financial services for businesses on a per-county basis
Each LMS target county has a County Revolving Fund available for businesses located in that county
Perspectives on business opportunity in Northern Kenya: Interviewers asked business owners about their perceptions of the business environment where they operate over the past five years, and whether they foresee it improving, worsening, or staying the same during the next five years. Figure 34 demonstrates findings from these questions, detailed by county.
Figure 32. Question: Are you aware of any government (national/county) financing opportunities available in this county? (n=147)

41
Notably, a healthy majority of business owners across all of LMS’ five target counties believe that the business environment improved in their county over the past five years and that it will continue to do so over the next five years. However, a more nuanced view shows that business owners from Wajir and Garissa counties collectively had the least positive perceptions of past and future business climates in their counties, with less than 70 percent of respondents feeling optimistic about their past and future business climates, compared to 100 percent of business owners interviewed in Marsabit county stating improvement over the past five years, and 92 percent of those interviewed in Isiolo county believing growth will continue in the future. When asked why interviewees thought that opportunities for finance and investment in their counties improved over the past five years, responses included the following:
• Improved access to loan facilities • Devolution’s positive effects on political stability, helping to increase the number of financial
service providers, improved networks, county-led investment initiatives, and generally better enabling government policies
• Increasing demand for camel meat • Increased number of SACCOs • New presence of insurance providers and products • Group lending products from financial institutions and SACCOs that make it easier for
smaller businesses to secure business financing 4.3. Livestock farming households and traders based in LMS target counties in Northern Kenya Sample statistics: LMS interviewed 181 livestock producers and traders over the course of data collection for this assessment with an approximately equal distribution among counties (see Figure 35). Producers interviewed keep sheep, goats, cattle, camels, and donkeys. In addition to livestock, producers also participate in other ventures, including hardware sales, general retail, grocery sales, providing transport via boda-boda, hotel management, clothing sales, milk vending, managing beauty boutiques, veterinary services, grain trading, textile weaving, basketry, and wholesaling to other retailers. Many producers in Turkana county also cited fish farming in addition to livestock farming due to the prevalence of fish such as tilapia in Lake Turkana.
Figure 34. Over the next 5 years, do you believe that the opportunities for finance/ investment in this county will improve, worsen, or remain the same? (n=147)

42
Livestock farming operations: Livestock production costs incurred by livestock owners include the following (see Figure 36 below):
• Drugs, vitamins, and medicines, such as multivitamins, de-wormers, vaccinations, and treatments for illnesses
• Herding (labor costs) • Food for fattening (typically an
amplified diet for several weeks before sale or slaughter)
• Costs for marketing and delivery of sale
Figure 36. Estimated costs of inputs for livestock production in Northern Kenya Type of Cost Average Annual Cost Per Livestock Animal Multivitamins Ksh 3,000 (US$30) De-wormers Ksh 8,000 (US$80) Vaccinations (per animal) Cattle: Ksh 100 (US$1) annually; Goats: Ksh
50 (US$0.50 annually); Camel Ksh 200 (US$2 annually); Sheep Ksh 50 (US$0.50) annually
Herding (labor costs): workers’ wages
Ksh 6,000-10,000 (US$60-100)
Transport for animal health services Ksh 500 (US$5) per trip However, the major cost for all producers is the regular, daily cost of feed and water, regardless of herd size or animal type. Knowing some of the inherent risks to livestock farming, including disease, drought, product perishability, and the seasonal nature of feed and inputs, livestock production can be costly and high-risk. To cover these costs, producers must have season-agnostic income sources, which further explains why producers often engage in multiple non-livestock ventures throughout the year. Several respondents also referenced using funds from government subsidy programs, remittances, receiving loans from family or friends, and using savings from merry-go-rounds or other types of savings groups to cover costs. Financing livestock farming: Livestock producers and their households often need loans and/or credit to supplement income and cover the costs detailed above, in addition to other household expenses such as school fees and healthcare expenses. Producers would benefit from longer, more patient loan terms in order to restock animals, expand their business, start up a new business, or improve infrastructure such as drilling boreholes. In Northern Kenya, the livestock producers interviewed for this assessment stated that they sought loans from a variety of sources. Figure 37 shows data on the percent of households that needed financing for livestock production—whether or not they obtained it—over the past five years.
Figure 35. Proportion of livestock producers and traders interviewed, by county (n=181)

43
The interviewed livestock farming households mentioned that they obtained financing from a variety of sources, including remittances from relatives (majority of respondents), cash charity from the third pillar of Islam, zakat, loans from informal savings groups (including BOMA REAP groups), county government funds (District Marketing Livestock Council, Livestock Marketing Councils); formal commercialized banks, MFIs, and mobile money operators (Equity Bank, KCB, KWFT M-Shwari), SACCOs in which households are members, selling livestock, and grants from aid organizations. Livestock producers confirmed that they are required to provide proof of the same materials and documents as non-livestock business owners and managers to secure a loan from a commercial bank. However, livestock producers also cited additional requirements, such as copies of employment contracts, documentation of shares held in various SACCOs, and a letter stating willingness to pay interest charged. Such additional paperwork is likely because financing livestock producers is seen as higher risk for a commercial bank than a non-livestock-related enterprise due to the inherent risks with livestock production detailed earlier in this section. Overall, most livestock producers stated that they normally try to negotiate loan terms that include a grace period of least six months to allow time for the birth of new animals to sell or allow time to fatten animals before sale, interest rates lower than 10 percent (or no interest rates in the case of Shariah-compliant clients), and a production-based credit facility that is repayable once their relationship with the bank is more mature and they are seen as more creditworthy. Despite these negotiations, respondents noted that usually the terms they wanted were not granted, a hurdle that pushed them to use off-the-shelf loan products that did not quite meet their needs or taking much lower loans than what they needed.
Figure 37. Over the past five years, have you needed external capital to support or grow your livestock farming? (n=181)

44
5. KEY FINDINGS AND RECOMMENDATIONS FOR DESIGN INTERVENTIONS 5.1 Key Findings QUESTION: How are enterprises, households, and individuals in the ASALs currently accessing finance for their livelihoods?
Ø Hypothesis: Enterprises and households in the ASALs are accessing finance from a variety of sources, most of which are informal.
FINDINGS: Based on the results and analysis from interviews, it is true that enterprises and households in the ASALs are accessing finance from a variety of sources. As demonstrated in Figures 29 and 30, which show the types of financing accessed from both formal and informal sources, it is clear that enterprises and livestock producers use a variety of sources of funding. They access known funding sources on the marketplace, and rely on connections that they have within their social networks. However, the assessment team learned the options for financial products and services from formal sources appears to be greater than what was originally thought prior to conducting interviews. While not massively extensive, particularly considering the breadth and depth of the Kenyan financial market on a national scale (see Figure 3), the presence of private, formalized banking options—commercial banks and agents, particularly Equity Bank, KCB, and Cooperative Bank—was greater than previously thought. Interviews with banks and follow-up desk research on their products and services show that commercial bank branches and the ASALs and bank agents offer Shariah-compliant products, various types of insurance, and microloan products, such as M-Shwari. Interestingly, based on customer exit interviews from banks, enterprises and households almost always use banks for deposits and savings (see Figure 15), but almost never for borrowing (Figure 16). This insight offers two opportunities. First, MFIs, government-funded loan programs, and other funds could increase their presence and networks for potential clients, especially since demand for loan products among enterprises was nearly twice that of any other product or service (see Figure 32). Secondly, commercial banks should better promote products that they do have, particularly Shariah-compliant products, as those products may meet customers’ needs. QUESTION: Are the current products, services, and channels of finance meeting their needs? Why or why not?
Ø Hypothesis: Products, services, and channels of finance are overall not fully meeting the needs of enterprises, households, and individuals in the ASALs due to a lack of volume of financing and lack of understanding of the market.
FINDINGS: Based on the results and analysis from interviews, enterprises, households, and individuals in the ASALs are accessing what they know of and can access in the financial marketplace and within their social networks in order to meet their business and household needs. However, such products and services do not meet their full set of needs. Demand for more borrowing options—particularly larger and longer-term loans and Shariah-compliant loans—is particularly high (see Figures 28 and 31). Knowing that the formal financial marketplace in the ASALs is fairly nascent, financial providers have a lot of room to grow their product offerings for such borrowing. In addition, there is also room for banks and financial providers currently on the

45
market to increase marketing and awareness of services already available in their counties to capture this latent demand. Moreover, the larger uptake in opening checking and savings accounts at banks compared to the very limited uptake in borrowing may be at least partially due to the amount of documentation and processing required to obtain a loan versus a bank account. Desk research shows that opening a bank account from banks currently on the market in the ASALs requires minimal documentation and paperwork—typically an ID is sufficient, and most accounts do not require a minimum balance—whereas borrowing requires additional documentation and capital assets for collateral. QUESTION: Which formal suppliers of finance are currently supplying products and services to the ASALs? For ones that do, how are they doing so, and to what extent?
Ø Hypothesis: Some formal suppliers of finance do operate in the ASALs, but the proportion is quite small when compared to the number of formal financial providers that operate nationally and when compared to the volume of transactions occurring in other regions/counties.
FINDINGS: Based on the results from surveys conducted in the ASALs and with bank offices in Nairobi, some formal suppliers of finance operate in the ASALs. However, it is true that the proportion is quite small when compared to the breadth and depth of financial providers operating nationally (see Figure 3). Figure 8 shows a table of the financial institutions, funds, and financial service providers actively operating in one of LMS’ five target counties. When responses are compared across interviews, it appears that Equity Bank has the largest market share among commercial banks. Their position as the primary bank in the region is almost certainly helped by their designation as the exclusive provider of the Government of Kenya Hunger Safety Net Program, a cash-transfer program for poor and vulnerable households in Northern Kenya accessible through a bank account and ATM card.16 Cooperative Bank and KCB appear to have the next largest market shares, followed by three to four other entities. Based on survey findings, enterprises and households generally access formal banking services through mobile money and/or through bank agents, who often operate mobile money products and services for them. With bank agents representing more than one bank at a time, basic banking services can expand much more rapidly than otherwise. This is particularly vital to expanding the formal financial services in Northern Kenya, given the large geographic size and substantial distances between population centers. Further, although some sizeable pockets of non-connectivity remain in LMS target counties affect mobile operators, strong connections are possible, and most survey respondents noted continuous improvements of mobile connectivity. Interestingly, survey responses demonstrated less presence and utilization of microfinance institutions than would otherwise be expected in a relatively ripe market for MFIs, with survey participants citing recent borrowing at $100-$1,500 per loan. Figure 29 shows that among all financing sources used by enterprises to obtain loans or credit over the past five years, respondents only mentioned two MFIs—Kenya Women’s Microfinance (KWFT) and Faulu Microfinance—which were the seventh and 13th most cited sources out of all options. SACCOs were the third most cited source of financing among survey participants, although participants accessed SACCOs
16 Details on the Hunger Safety Net Program’s cash transfers can be found at http://www.hsnp.or.ke/index.php/our-work/delivery-of-cash-transfers.

46
with many different membership types (for example, participants mentioned SACCOs based on county residence, sector, and gender, among others). QUESTION: What challenges do financial institutions perceive regarding providing financial products and services to the ASALs?
Ø Hypothesis: Financial institutions perceive many challenges, the largest of which are insecurity and the perception of a lack of viable opportunities.
FINDINGS: Based on survey responses from Nairobi-based banks, MFIs, and other fund representatives (see Figure 12), the majority of challenges cited included providing financial products and services including insecurity due to political and tribal tensions, working across a vast geographic space, cultural and language barriers due to differing tribal backgrounds and norms compared to other parts of Kenya, and poor infrastructure. Overall, these challenges create (1) high service costs due to increased travel times, poor infrastructure, difficulty accessing remote communities, and security coverage; (2) threats of physical harm to employees, buildings, and customers; and (3) overall higher systematic risk for banks and their investors, contributing to an increased cost of capital passed on to borrowers and customers if the cost of providing services is considered worth the investment. These perceived challenges from a financial institution’s perspective illustrate why financial inclusion and outreach in Northern Kenya is lower than in other parts of the country. Interestingly, few supply-side representatives stated outright that it was challenging to lend and invest in Northern Kenya due to a lack of viable enterprises to finance (see “low quality of businesses” in Figure 12). However, financial institutions mentioned other challenges, including a “handout mindset” and unclear business ownership among enterprises seeking capital. The perception of unclear ownership may cause financial institutions to doubt management’s understanding and capacity to repay loans, in addition to creating ambiguity when holding leaders accountable for defaults or investment losses. QUESTION: What opportunities do financial institutions perceive regarding providing financial products and services to the ASALs?
Ø Hypothesis: Financial institutions view the ASALs as having numerous opportunities in livestock.
FINDINGS: Survey responses among representatives from supply-side institutions show that financial institutions and funds see opportunities for greater investment in general rather than specifically in livestock. As shown in Figure 13, supply-side respondents cited two primary opportunities to operating in the ASALs—the opportunity to capture market share as an “early-mover” in the financial marketplace compared to most other banks in Kenya, and to serve the banking needs of county governments, particularly with devolution creating more control of funds and resources at the county level. Only 10 percent of supply-side survey participants cited opportunities in value addition for agriculture and livestock. Interestingly, though, as shown in Figure 12, financial institutions also stated the lack of market research about business opportunities in Northern Kenya as one of their top challenges, which may contribute to the perception of a general lack in financing and investment opportunities in Northern Kenya outside of serving county governments.

47
Further, financial institutions did not mention opportunities for expanding lending outside of those in livestock and agriculture value-addition in Northern Kenya, even though research shows that many other types of enterprises are in operation, demand for lending is high, and the vast majority of customers are not utilizing lending products from formal financial institutions (see Figures 16, 24, and 31). QUESTION: Do business owners, market actors, and individuals believe the opportunities for investment in Northern Kenya over the next five years will improve, worsen, or stay the same?
Ø Hypothesis: Answers from enterprises and households located in the ASALs will vary from a range of significantly worsen to significantly improve depending on their livelihood or personal circumstances.
FINDINGS: Based on survey responses, the vast majority of supply-side and demand-side actors for financing and investment in Northern Kenya believe that opportunities for investment will improve, if not significantly improve (see Figures 14A, 23, and 34). The most cited reasons for this optimistic outlook among respondents include devolution and its effects on greater authority in fund and resource allocation at the county level; recent oil discoveries specifically in Turkana county, which have potential to increase wealth and secondary economic opportunities significantly; and new, major infrastructure development, such as the LAPSSET corridor (Figure 1). When asked, the vast majority of respondents also reported an improved or significantly improved business environment over the past five years (see Figure 17), contributing to their optimism about the future. This is a good sign for positive developments in Northern Kenya’s business and financial markets, as financial markets often move on perception of future movements, which creates the reality. In particular, representatives from First Community Bank and Equity Bank referenced large initiatives to expand their services in Northern Kenya, investing at least 550 million Ksh (US$ 5.5 million) over the next five years. However, while findings indicate that the majority of respondents are still positive about the future investment environment when disaggregated by county, it is notable that responses from Wajir and Garissa counties demonstrated the highest number of neutral or negative perceptions on the future (30 to 40 percent of respondents) compared to the three other targeted counties (ranging from approximately 5 to 20 percent of respondents). Such responses may be due to higher levels of poverty in Wajir and Garissa counties compared to other LMS target counties, and a perceived “distance” from other parts of Kenya due to language and cultural differences. 5.2 Recommendations for Design Interventions and Follow-up Research Based on these key findings and analysis of the detailed data collected over the course of this assessment, we developed five areas of overarching recommendations for activities and research to help strengthen market systems and financial systems in Northern Kenya. These five areas are described below in greater detail. (1) Support efforts to help make information asymmetry more symmetrical As is detailed in this assessment, commercial banks, MFIs, SACCOs, and other loan funds currently operating in the ASALs offer various types of financial products and services, including many that are shown to be in high demand among consumers—for example, Shariah-compliant borrowing and
48
varieties of mobile banking. However, an apparent challenge is that consumers are not aware of these offerings, do not know how to access or use such products or services, and/or do not trust them, thereby shying away from their use. For example, consumers demonstrate a fairly low awareness of various national and county-level government funding opportunities (see Figure 32), yet they typically offer less expensive and more flexible financing terms than other financial institutions, which is what many consumers are demanding. Significantly increas ing information f lows to consumers on existing and available financial providers, products, and services could increase their awareness, understanding, and ultimately their use of financial services. For example, ideas to increase awareness could include:
• Regular finance and investment fairs for businesses in each county with strong representation from an array of financial providers (banks and bank agents, MFIs, SACCOs, and public funds)
• Creating intentional time and space for financial institution representatives to showcase products and services at livestock markets and fairs as ways to specifically target livestock-based households
• Working with banks to structure mini fee-for-demo services to incentivize bank agents to demonstrate product operation to potential customers, with the dual intention of increasing knowledge of the product or service and increasing customer acquisition
• In alignment with the previous idea, target and incentivize youth to be trained to be bank agents through scholarships to top applicants, and support youth through the agent licensing process with the Central Bank of Kenya to acquire specialized training on products and services with partner banks or insurance providers
• Co-fund radio and other media advertising with public funds to advertise application periods, eligibility, and how to apply for various funds
• Designate and train LMS business advisors at county-based business centers to be specifically knowledgeable on financing opportunities available in his/her respective county to help direct business owners toward several potential financial resources for their enterprises
Similarly, supply-side financial providers do not have the full extent of regular, reliable information on business opportunities and markets in Northern Kenya, including LMS target counties, limiting their ability to accurately analyze the opportunities or to consider how these opportunities could match their respective risk-return profiles. Therefore, increasing information f lows to f inancial providers is equally important for them to analyze such opportunities and contribute to possible plans to expand services in Northern Kenya. For example, as shown in Figure 11, commercial banks that already operate relatively extensively across the region or have firsthand knowledge of operations in particular counties (FCB and Equity Bank), with which we can deduce that they hold more market information than other FIs, indicated plans for significant expansion, deepening, and investment within Northern Kenya. If market information is more readily accessible and used by other FIs, we can infer this pattern may continue in the future. Ideas for helping to increase information flows to supply-side financial providers could include:
• Facilitating a greater volume of regular, high-quality economic and financial data and reports from market research firms to financial institutions. Relevant Kenyan banking and investment associations could provide subscription- or fee-based in-depth economic and financial research to their members through in-house market research services or by

49
contracting third-party providers, such as data on estimated market size by sector or by county, or information on new investments or major business transactions by sector or by county.
• Through relevant business, banking, and investment associations, set up regular, fee-based, well-curated trips tailored for specific segments of the financial sector to better assess the market on the ground, screen relevant business opportunities given their target lending/investment size or priority sectors, and meet with county officials and other public figures to explore possibilities for risk mitigation mechanisms such as loan guarantees.
(2) Support efforts to deepen channels and types of product/service offerings to consumers While financial providers do provide many of the products and services in demand by consumers, re-balancing existing information asymmetries alone will likely not fully improve access to finance for enterprises and communities in Northern Kenya. For financial providers that do see a business case to expand service offerings in northern counties, supporting their efforts to deepen their existing channels, particularly across the ASALs’ vast geography, as well as further diversifying product offerings could help to increase customer uptake. Specifically, these actions could include:
• Collaborating with interested FIs to create more tailored products for agriculture and livestock-related businesses to better align with seasonality, such as variable payment or revenue-based repayment models, and creating more diversified agriculture portfolios.
• Supporting the development of risk coverage initiatives to incentivize expanded lending and investing, such as loan guarantee programs for FIs, and first-loss capital mechanisms for angel or venture capital-like funds to incentivize increased investment to businesses in Northern Kenya. Explore collaborating with county-level governments to use county resources to create such risk buy-down products or guarantees.
• Using donor-funded programs to co-fund innovations to products, services, or business models to increase access to finance for enterprises and communities in Northern Kenya, such as providing matching funds to pilot new livestock value chain financing models for working capital, training programs for bank agents and mobile money agents, or asset financing models for equipment or facilities upgrades.
• Exploring possibilities of county government incentives for the financial sector to move into more places in northern Kenya, such as providing tax breaks, subsidies to cover operational set-up, or incentives for FIs that create a certain number of new jobs in the area.
(3) Support consumer financial literacy and understanding of financial products While some of the possible ideas for interventions listed above help support consumer financial literacy and understanding, the research in this assessment shows that more could likely be done to help increase financial literacy among potential consumers, even at basic levels. Possible ideas include fostering supply-side-provided promotional events and trainings on products and services to encourage understanding and uptake, guiding FIs and other supply-side entities on which products, services, or channels may be best for specific communities, and creating incentives for individuals to learn about particular financial products (particularly insurance products), such as through prizes or recognition. (4) Recommendations for additional research

50
The purpose of this report is to provide a survey of the current landscape of financial providers and consumer demand for financial products in Northern Kenya, and analyze insights and data collected to recommend opportunities and leverage points to help increase financial flows. Based on the findings through this research, however, there are several opportunities for additional in-depth research. These are:
• Research on remittance flows to Northern Kenya: Some findings suggested that remittance flows to Northern Kenya are relatively high, although this report does not explored the findings in great depth. Further research on the size of remittance flows, typologies of individuals, households, or enterprises that receive remittances, remittance origination points and patterns for future financing, and other subtopics would be interesting to explore and could hold insights for future interventions and government or development programs.
• The segment of “Shariah-compliant financial products and services” within Kenyan financial markets covers a wide array of products and services that could be further researched and segmented to better match consumer demand and understanding of existing products to their needs. In addition, further research and follow-up meetings with FIs offering various Shariah-compliant products and services in Northern Kenya may reveal interesting insights as to why the uptake of such products is low while demand is seemingly high.
• Further research into why some financial institutions have decided to pursue significant expansion and investment plans in Northern Kenya, and others have not. While we infer that such differences may be due to FIs’ current operations on the ground and inherent ability to absorb real-time market information on the region, as well as due to management interest, such differences could be interesting to further unpack through follow-up meetings and research.
• With a larger sample size, research could show interesting insights on the differences (or similarities) among MFIs, banks, and SACCOs’ perceptions of challenges and opportunities to servicing enterprises and communities in Northern Kenya. Such disaggregated insights would help to draw differences and tailor possible approaches to working with these subgroups of financial providers.

51
6. REFERENCES Beddington J., M. Asaduzzaman, M. Clark, A. Fernández, M. Guillou, M. Jahn, L. Erda, T. Mamo,
N. Van Bo, C.A. Nobre, R. Scholes, R. Sharma, J. Wakhungu. "Achieving food security in the face of climate change: Final report from the Commission on Sustainable Agriculture and Climate Change." Copenhagen, Denmark: CGIAR Research Program on Climate Change, Agriculture and Food Security (CCAFS), 2012. Retrieved from www.ccafs.cgiar.org/commission
Cochrane, L., G. Cundill, E. Ludi, M. New, R.J. Nicholls, P. Wester, … M.E. Landry. (2017). "A reflection on collaborative adaptation research in Africa and Asia." Regional Environmental Change 17, no 5 (2017): 1553–1561. Retrieved from https://doi.org/10.1007/s10113-017-1140-6
“Construction of the LAPPSET Corridor Almost Complete.” Trademark East Africa. 3 May 2016. Accessible at <https://www.trademarkea.com/news/construction-of-the-lappset-corridor-almost-complete>
Consultative Paper on the Review of Microfinance Legislations. Central Bank of Kenya. February 23, 2018. Accessible at <http://www.central bank.go.ke/2018/02/23/consultative-paper-review-microfinance-legislations>
GoK. Sessional Paper no. 10 1965: On African Socialism and its Application to Planning in Kenya. 1965.
GoK. Republic of Kenya Ministry of Devolution and Planning Draft Devolution Policy. Ministry of Devolution and Planning. 2015.
GoK. Brief on LAPSSET corridor project; Building transformative and game changer infrustructure for a seamless connected Africa. 2016. Retrieved from http://www.lapsset.go.ke/%0Ahttp://www.vision2030.go.ke/lib.php?f=lapsset-project-report-july-2016
GoK. MINISTRY OF DEVOLUTION AND ASAL AREAS National Policy for the Sustainable Development of Arid and Semi-Arid Lands ‘Unlocking Our Full Potential for the Realization of the Kenya Vision 2030. 2017a.
GoK. Ministry of Environment and Natural Resources Kenya Strategic Investment Framework for Sustainable Land Management. 2017b.
GOK. Kenya Vision 2030. 2007.
Guideline on Agent Banking – CBK/PG/15. Central Bank of Kenya. Accessible at < https://www.centralbank.go.ke/images/docs/legislation/GUIDELINE%20ON%20AGENT%20BANKING-CBK%20PG%2015.pdf>
Herbling, David and Bella Genga. “Kenya Will Repeal Interest-Rate Cap That Curbed Bank Lending.” Bloomberg. Published June 14, 2018. Accessible at <https://www.bloomberg.com/news/articles/2018-06-14/kenya-to-repeal-section-of-banking-law-that-caps-interest-rates>
KBS. Kenya Population and Housing Census. Nairobi, Kenya: Kenya National Bureau of Statistics, 2009.
"Key statistics on the drylands of Kenya, Uganda, and Ethiopia." REGLAP Secretariat, October 2012. Accessible at

52
<http://www.fao.org/fileadmin/user_upload/drought/docs/Key%20Statistics%20on%20drylands%20of%20Kenya,%20Uganda%20and%20Ethiopia_October_%202012.pdf>
Kimotho, Joseph W. "Determinants of digital innovations adoption by financial institutions in Kenya." Master's thesis, University of Nairobi, 2016.
KNBS. Economic Survey 2018. Nairobi, Kenya: National Bureau of Statistics, 2018.
Little, P. D., J McPeak, C.B. Barrett, and P. Kristjanson. "Challenging Orthodoxies : Understanding Poverty in Pastoral Areas of East Africa." Development and Change 39 (2008): 587-611.
Njoroge, P. “Intermediation towards Deepening of Financial Inclusion.” Key note address presented at the Kenya Bankers Association (KBA) Sixth Annual Research Conference, Nairobi, Kenya, September 2017.
Notenbaert, A. M. O., J. Davies, J. De Leeuw, M. Said, M. Herrero, P. Manzano, … S. Omondi. "Policies in support of pastoralism and biodiversity in the heterogeneous drylands of East Africa." Pastoralism 2, no 1 (2012): 1–17. Retrieved from https://doi.org/10.1186/2041-7136-2-14
Odhiambo, P., J. Gachanja, A. Gitonga-Karuoro, J. Nyangena, B. Munga, B. Kiriga, … N. Wathuge. "Realising the “Big Four” Agenda Through Energy as an Enabler." Policy Monitor 9, no 3 (2018). Retrieved from www.kippra.org
“Parliament approves retaining interest rate cap against IMF wishes.” By Reuters, re-printed in The Star, Kenya on August 30, 2018. Accessible at <https://www.the-star.co.ke/news/2018/08/30/parliament-approves-retaining-interest-rate-cap-against-imf-wishes_c1811182>
Pathways to Resilience in Semi-Arid Economies (PRISE). Accessible at <prise.odi.org/wp-content/uploads/2016/01Low-Res_Kenya-CSA.pdf>
Powon, Micah Pkopus. CBS Principal Secretary: State Department for ASAL, Ministry of Devolution and ASAL, 23rd May 2018.
"Realizing the Big Four Agenda Through Energy as an Enabler." Issue 10, No. 3 | January - March 2018, KIPPRA Policy Monitor. Accessible at <http://kippra.or.ke/wp-content/uploads/2017/05/Realizing-the-%E2%80%9CBig-Four%E2%80%9D-Agenda-through-Energy-as-an-Enabler-Issue-9-3-January-March-2018.pdf>
The SACCO Societies (Amendment) Bill, 2018. The Credit Information Sharing Association of
Kenya (CIS Kenya). Accessible at www.ciskenya.co.ke/press-release/ssa-amendment-bill
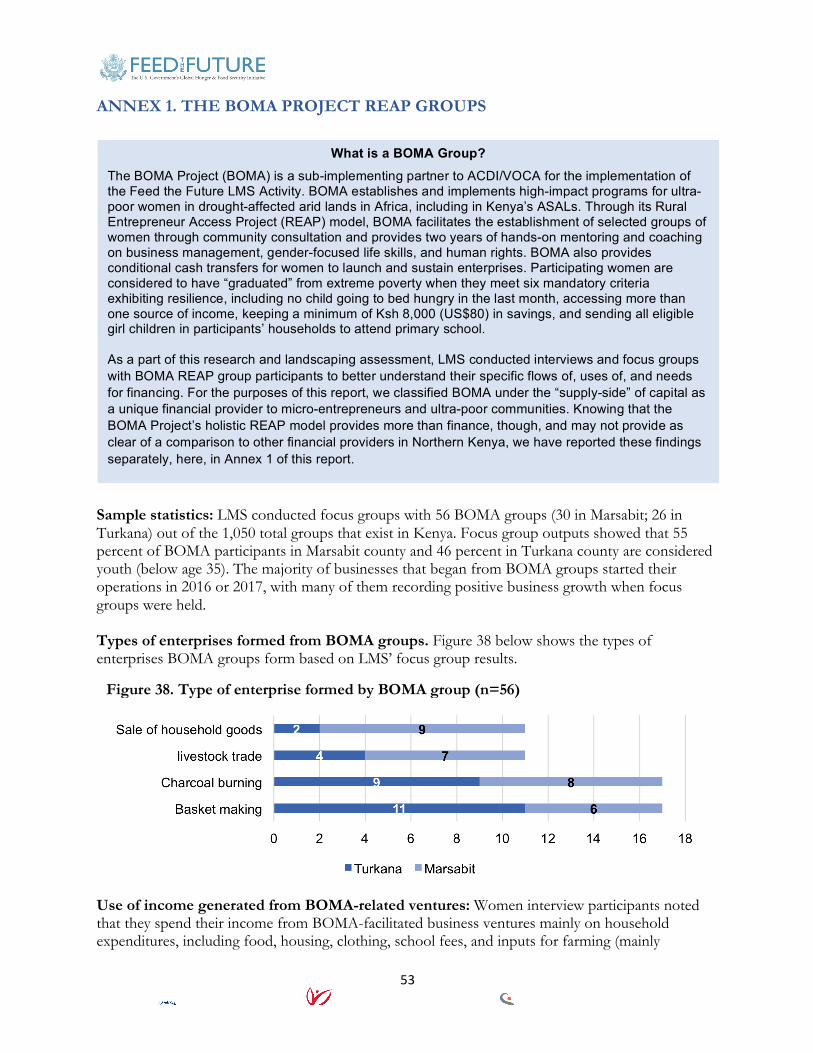
53
ANNEX 1. THE BOMA PROJECT REAP GROUPS
Sample statistics: LMS conducted focus groups with 56 BOMA groups (30 in Marsabit; 26 in Turkana) out of the 1,050 total groups that exist in Kenya. Focus group outputs showed that 55 percent of BOMA participants in Marsabit county and 46 percent in Turkana county are considered youth (below age 35). The majority of businesses that began from BOMA groups started their operations in 2016 or 2017, with many of them recording positive business growth when focus groups were held. Types of enterprises formed from BOMA groups. Figure 38 below shows the types of enterprises BOMA groups form based on LMS’ focus group results.
Use of income generated from BOMA-related ventures: Women interview participants noted that they spend their income from BOMA-facilitated business ventures mainly on household expenditures, including food, housing, clothing, school fees, and inputs for farming (mainly
Figure 38. Type of enterprise formed by BOMA group (n=56)
What is a BOMA Group?
The BOMA Project (BOMA) is a sub-implementing partner to ACDI/VOCA for the implementation of the Feed the Future LMS Activity. BOMA establishes and implements high-impact programs for ultra-poor women in drought-affected arid lands in Africa, including in Kenya’s ASALs. Through its Rural Entrepreneur Access Project (REAP) model, BOMA facilitates the establishment of selected groups of women through community consultation and provides two years of hands-on mentoring and coaching on business management, gender-focused life skills, and human rights. BOMA also provides conditional cash transfers for women to launch and sustain enterprises. Participating women are considered to have “graduated” from extreme poverty when they meet six mandatory criteria exhibiting resilience, including no child going to bed hungry in the last month, accessing more than one source of income, keeping a minimum of Ksh 8,000 (US$80) in savings, and sending all eligible girl children in participants’ households to attend primary school. As a part of this research and landscaping assessment, LMS conducted interviews and focus groups with BOMA REAP group participants to better understand their specific flows of, uses of, and needs for financing. For the purposes of this report, we classified BOMA under the “supply-side” of capital as a unique financial provider to micro-entrepreneurs and ultra-poor communities. Knowing that the BOMA Project’s holistic REAP model provides more than finance, though, and may not provide as clear of a comparison to other financial providers in Northern Kenya, we have reported these findings separately, here, in Annex 1 of this report.

54
subsistence farming). They also noted that they use income from BOMA ventures to pay back other loans, transport goods for household and business needs, and ultimately plough back remaining income toward business expansion. Financing business ventures: Funds from BOMA-facilitated savings groups: Women in BOMA groups noted that they actively use the funds from BOMA-facilitated savings groups to borrow and earn interest to invest in their enterprises. Women from focus groups use savings for:
• Enterprise expansion • Emergencies that may arise • Restocking livestock and shops • Lending to other BOMA group members at 10 percent interest • Covering household expenses such as buying food, paying school fees, paying medical bills,
and buying clothes • Buying fodder for livestock for emergencies during the dry season
Researchers also asked groups about their level of satisfaction with their levels of savings in BOMA groups. Figure 39 presents their responses. To continue improving their ability to save, the majority of women interviewed mentioned that they would be interested in additional training to increase the return on investment from their savings, learning additional avenues for reinvesting their money, and further support on proper recordkeeping to improve their ability to track money flows and investment income. Financing via BOMA cash transfers for enterprise development: At enterprise launch, 90 percent of BOMA groups stated that they initially started their business ventures solely with the cash transfer grants received from BOMA. The remaining 10 percent coupled this funding with funds from their spouses. To finance enterprise expansion, LMS found that nearly 77 percent of women in BOMA groups in Turkana county acquired money from outside their families to further finance their business ventures, the majority of which was sourced from women and households not related to them but who participate in other BOMA groups. In Marsabit county, LMS found that 30 percent of ventures later sought and received additional financial support from relatives to continue to expand their enterprises. Overall, these findings suggest that the BOMA cash transfer program significantly contributes to start-up capital for enterprises from women in BOMA groups in Turkana and Marsabit, without which most women interview participants noted that they would not have secured funding to start their ventures. Further, these findings also suggest that BOMA has significantly helped to facilitate
Figure 39. Are you satisfied with your level of savings at your BOMA Group? (n=56)

55
social and business networks and create another financing sources for communities that are often marginalized from most other forms of formal financing, as women are looking to women in other BOMA groups as a primary source of business financing. Financing from formal channels: In Turkana county, 100 percent of the BOMA groups interviewed stated that they do not use formal banking channels or mobile providers for saving, depositing, or transacting. In Marsabit county, 20 percent of groups interviewed reported using mobile services to carry out business transactions, but 80 percent remain fully unbanked. BOMA groups gave reasons for the lack of relationship with formal banking channels, including a lack of knowledge on using formal banking services, low literacy levels, the cost of traveling to access banking services, and a lack of collateral to borrow larger sums.


![Page 353[1]](https://img.pdfslide.us/doc/110x75/55a15d3f1a28ab4f6a8b466d/page-3531.jpg)