Embed Size (px)
Citation preview
Energy Systems: Vulnerability – Adaptation – Resilience (VAR) 2009 Regional Focus: sub-Saharan Africa
Kenya
Report written by: Email: Paul Kirai [email protected]
This project is supported in part with funding from: Mission d’Appui à l’Action internationale des Organisations non Gouvernementales
and
56, rue de Passy – 75016 Paris – France |Tel: (33) 1.42.24.51.48 | Fax: (33) 1.42.24.86.33
Email: [email protected] | www.helio-international.org
HELIO International/Kenya 2
Executive Summary Assessing the vulnerability, adaptation and resilience (VAR) of energy systems is of paramount importance in coping with the impacts of climate change, particularly in developing countries. HELIO International has initiated a series of country assessments aimed at identifying vulnerabilities of energy systems, with a view to improving their resilience to withstand climate shocks. These assessments review relevant climatic, social, economic and environmental information – in the context of the energy systems. Kenya is one of ten countries to be assessed. Kenya—on the east coast of Africa—has a rapidly growing population of 38 million (in 2008) and a GDP of USD 25billion. The country has experienced an increase in energy demand which is linked to the rising population and expanding economy; the latter which grew by 7% in 2007. However, only 16-18 % of the population has access to electricity. Over the last six years, electricity demand has increased by an average of 7% per annum. Sixty percent of the electricity is hydro generated and supply has not been able to meet the increased demand thus creating instability. The same case holds for biomass which is the primary energy source in Kenya and meets 68% of the country’s basic energy needs. The Kenyan economy is agricultural based however only 20% of the country is suitable for cultivation, while the rest is largely arid and semi-arid. Over-reliance on primary biomass energy has led to the widespread exploitation of forest resources with adverse environmental impacts. Forest cover in Kenya has diminished to 6%; substantially below the minimum recommended coverage of 10%. As a result, there has been a reduction in water levels in rivers and dams leading to inconsistent power supply and frequent power outages. The use of petroleum for power generation does not offer a lasting solution due to fluctuations in global market prices of crude oil, and the climate impacts of increased GHG emissions. Transportation of petroleum over long distances is also risky and contributes to increase in GHG emissions. Recent reforms in the institutional and legal framework for energy management have resulted in the creation of the Energy Regulation Commission and the Rural Electrification Authority. However the state continues to play a major role in electricity generation and distribution. The Ministry of Energy has introduced feed-in tariff policy to encourage the development of wind, biomass and mini-hydro power generation. Greater effort is needed to diversify energy sources, improve efficiency, and take climate change into consideration in energy planning and development. Many of the economic and human development indicators showed positive changes up until 2008 – when the country suffered election related disturbances. Climatic variability has had negative impacts on the water, agricultural, tourism and power sectors. Reduced rainfall has resulted in increased thermal generation and a rise in electricity costs. Flooding has disrupted energy transport systems and lead to an increase in water born and vector diseases in both human and livestock. Global warming will clearly have negative impacts on the Kenyan energy system and the economy in general. This calls for adequate preparation and awareness in several
HELIO International/Kenya 3
fronts in order to develop resilience in the energy systems to not only withstand climatic shocks but also to recover in a timely fashion. This report proposes a number of measures to improve resilience through improved environmental and energy governance, enhanced collection and analysis of climate data, and strengthening of the country’s social and economic systems. The report recommendations include: � Diversification of energy sources and reduce over-reliance on primary biomaas
and hydro power generation � Increased use of renewable energy, specially solar and wind � Greater use of agricultural waste for energy purpposes to reduce deforestation � Increase energy efficiency and conservation as a mitigation measure � Improved management of forestry resources and watersheds � Mobilisation of investment funds for new infrastructure and renewable energy � Increase capacity for planning and implementation of energy programmes � Engagement of stakeholders to adopt strategies that enhance Kenya’s overall
ability to cope with impacts of climate change – especially those relating to the energy systems.
HELIO International/Kenya 4
Table of Contents Executive Summary................................................................................................... 2 Table of Contents ...................................................................................................... 4 List of Acronyms....................................................................................................... 5 Reporter Biography ................................................................................................... 6 Country Overview – Current Situation....................................................................... 7 Country Description............................................................................................... 7 Socio-Economic Conditions of Kenya.................................................................... 9 Policy ................................................................................................................ 9 Economy............................................................................................................ 9 Education........................................................................................................... 9 Gender ............................................................................................................... 9 Environment .................................................................................................... 10 Country statistics.............................................................................................. 10 International Cooperation................................................................................. 11
Kenya’s Greatest Vulnerabilities.......................................................................... 11 Vulnerabilities by Sector.................................................................................. 12
Levels of Current Vulnerability............................................................................ 15 Environment .................................................................................................... 15 Economic......................................................................................................... 15 Technical ......................................................................................................... 16 Social............................................................................................................... 17 Civil................................................................................................................. 17
Current Energy Situation in Kenya .......................................................................... 17 Energy Sources .................................................................................................... 18 Energy Demand Issues......................................................................................... 18 Energy Supply Situation ...................................................................................... 20 Transmission System ....................................................................................... 21 Distribution System ......................................................................................... 21 Regional Interconnection ................................................................................. 22
Bilateral /International Government Cooperation on Energy ................................ 22 Legislative and Regulatory Frameworks .............................................................. 24 Current Impacts of Kenya’s Energy System ......................................................... 25
Vulnerability and Resilience of Kenya’s Energy System.......................................... 25 Energy System Vulnerability ............................................................................... 26 Energy System Resilience.................................................................................... 30
Recommendations ................................................................................................... 32 Strategies to Increase Energy System Resilience .................................................. 33 Proposed and Policy Measures............................................................................. 34 Environment .................................................................................................... 34 Economic......................................................................................................... 34 Technology...................................................................................................... 34 Social............................................................................................................... 35 Energy Governance.......................................................................................... 35
Bibliography............................................................................................................ 36 Annex 1: Climate Induced Impacts on Energy Systems and Related Vulnerabilities 39 Annex 2: Kenya Climate Profile..…………………………………………………….40
HELIO International/Kenya 5
List of Acronyms
AFREPREN Energy, Environment and Development Network for Africa
IES Integrated Energy Services Ltd.
AfDB African Development Bank IPCC Intergovernmental Panel on Climate Change
ASALs Arid and Semi-Arid Lands
IPP Independent Power Producers
BBL/DAY Barrel Per Day
ITDG Intermediate Technology Development Group
BBS Battery Based Systems
KENGEN Kenya Generating Company
CBS Central Bureau of Statistics
KPLC Kenya Power and Lighting Company
Cogen Cogeneration
KEBS Kenya Bureau of Standards
EAPCC East African Portland Cement Company
KPRL Kenya Petroleum Refinery Limited
EE/RE Energy Efficiency/ Renewable Energy
KW Kilowatt
ENSO El Nino Southern Oscillation
KWh Kilowatt hour
EPP Emergency Power Producers LTWP Lake Turkana Wind Power
ERB Energy Regulatory Board
MDG Millennium Development Goals
ERC Energy Regulatory Commission
MW Megawatt
ESRP Energy Sector Recovery Project
NEMA National Environment Management Authority
FSPPs Full-Scale Promotion Projects
NOCK National Oil Company Kenya
GDI Gender-related Development Index
REA Rural Electrification Authority
GDP Gross Domestic Product TOE Tonnes of Oil Equivalent
GEF Global Environment Facility
UNDP United Nations Development Programme
GW Gigawatt
UNEP United Nations Environment Programme
IAP Integrated Assessment and Planning

HELIO International/Kenya 6
Reporter Biography
Paul Kirai is a senior energy and environmental expert with MSc Environmental Mgt, and BSc degrees and over 18 years experience in government, private sector and United Nations organisations. Paul has extensive experience with climate change, environmental management, and energy covering policy, programmes, regulation, impact assessments, planning and
implementation. He is experienced in energy management, energy efficiency, and Clean Development Mechanisms (CDM). In 2001-2007 Paul was National Manager for the GEF-UNDP Climate Change project in Kenya. The project aimed at industry and government levels was hailed as an example of best practice by UNDP and GEF for its efforts to mainstream energy efficiency in industry and national institutions. Kirai has been a speaker in many forums on energy, environment and climate change and authored a number of publications on the same. Since 2007 he has been a UNDP Consultant/Team Leader supporting the East African Community to implement the modern energy services scale up strategy. He is currently the Director: ECM Centre Ltd - Environmental management, climate change and Clean Development Mechanisms (CDM) and Development Advisor: Integrated Energy Solutions (An Energy Service Company) – Energy efficiency and renewable energy ECM Centre P.O Box 10135-00100 Nairobi Kenya Phone: +254 20 2712999, Mobile: +254 733 637457 or +254 722 844950. Email: [email protected] or [email protected]
HELIO International/Kenya 7
Country Overview – Current Situation
Country Description The Republic of Kenya is situated in Eastern Africa and lies squarely on the equator between latitudes 5o North and 5 o South and between longitudes 34 o West and 42 o East. It covers an area of 582,648 km2 with lakes occupying about 2% of the total area. Kenya borders the Indian Ocean and has a coastline of about 500km. The altitude varies widely from sea level at the coast to about 5000 meters above sea level on the central highlands. Mount Kenya has a peak of 5119 metres and is capped with snow throughout the year. The country has varied physical and climatic features. Only about 20% of the total land is arable, which is where the majority of Kenya’s population lives. The rest of the land - 80% - is mainly arid and semi-arid. Kenya’s arid and semi-arid lands support more than 70 % of the national livestock which is estimated at about 9.7 million beef cattle, 3 million dairy cows, 9.6 million goats, 8.3 million sheep, 0.8 million camels 0.52 million donkeys, and 0.3 million pigs. Of the arable 20% land area, only 8% is used for crop and feed production with about 1,030 sq. km under irrigation. The major agricultural activities in Kenya are crop production, horticulture, dairy and livestock farming. Traditionally, the major foreign exchange earners have been tea and coffee. However, horticulture is currently the country’s leading foreign exchange earner netting in $1.12 billion, against $1.04 billion earned by tourism. Other products exported from Kenya are beef and dairy products, sisal, cashew nuts, pyrethrum, fruits and vegetables. The principal crops grown for local use are maize, wheat, sugarcane and rice. Kenya’s population is approximately 38,000,000 (2008 estimates) with an annual population growth rate of 2.76%. The population is unevenly distributed with populations patterns linked to agricultural land potential; there is an average of 230 persons per km2 in high potential areas with an average of three persons per km2 in arid areas. Kenya’s population is comprised of 99% native Africans who belong to one of the 42 ethnic groups present in the country. The rate of urbanisation in Kenya is one of the highest in the world, with an estimated annual growth rate of 3.9% for the period 2005-2010 (Central Bureau of Statistics, 2007). The average growth rate for most African cities is 3.31% as compared to 1.98% in the rest of the world. It is estimated that about 22 % of Kenya’s population lives in urban areas, while 78 % live in rural areas. The urban population is expected to increase exponentially by 2015, hence, narrowing the current gap. This migration is mainly due to higher pull factors existing in the urban areas as opposed to those in the rural areas. Kenya’s Human Development Index (HDI) has increased marginally in recent years from 0.520 in 2004 to 0.532 in 2005 (UNDP Human Development Report 2008). Nevertheless, a majority of Kenyans are still trapped in a deepening poverty. Kenya’s Human Poverty Index (HPI) for 2005 stood at 37% but income poverty levels stand at
HELIO International/Kenya 8
56 %. Regions with low HDI and GDI coincide with those with low potential as in Arid and Semi-Arid Lands (ASAL) areas and those that suffer environmental degradation. Conversely, the regions with high HDI are those that offer higher opportunities and with relatively better human security. (UNDP, HDR 2008) Kenya’s Gender-related Development Index (GDI) (which in 2005 stood at 0.547) follows the same pattern. Unavailability of suitable arable land, lack of access to water and land, and related social factors as well as practices of exclusion aggravate the tension as evidenced in the Northern parts of Kenya. Poor land productivity, particularly in ASALs areas, makes the case for a “Green Revolution” in Kenya. At present Kenya’s environment is under threat from several pressures. These pressures include inter alia, deforestation; soil erosion and desertification, poaching of wildlife, destruction of watersheds and increasing settlements in water catchment areas such as the Mau forest, Cherangani Hills, Aberdare forest as well the Mt. Kenya areas. Over the past decades Kenya’s climatic trends have experienced significant changes. The varied topography, proximity to the Indian Ocean and equatorial location influence the temperature profiles of Kenya which averaged at 23.44oC in the past decade (Cline 2007). Kenya’s average annual rainfall amounted to 738mm/year from 1960 to 1990 (Cline 2007). However, rainfall is unevenly distributed across space and time. Along Kenya’s coast a humid tropical climate predominates. By contrast, inland areas are largely arid with two thirds of the country receiving less than 500 mm of rainfall per year. There are two distinct rainy seasons: The Long Rains (March to May) and Short Rains (October to December). There is increasing observational evidence of changing precipitation patterns, including shifts in the timing and duration of the rainy season over parts of Kenya. The annual average rainfall between 2070 and 2099 is projected to increase to 2.19 mm/day (Cline 2007). However, precipitation gains are uneven across the country and future increases in temperature will also increase evaporation rates. The six major sectors, including tourism, agriculture, transport and telecommunication, finance and construction, are pivotal in fuelling Kenya’s economic growth. Currently, the agricultural sector is growing in strength and is slate to support the country’s economy by 2009. The high cost of energy remains one of the biggest bottlenecks to economic activity in the country (KIPPRA, 2005). The state owned KENGEN is the main power generator and controls all publicly owned power plants while the KPLC is in-charge of transmission and distribution. In 2008 KENGEN sold 30% of its shares to the public by listing in the Nairobi Stock Exchange
HELIO International/Kenya 9
Socio-Economic Conditions of Kenya
Policy Since the government of Kenya issued a cabinet directive to mainstream the Millennium Development Goals (MDGs) into national planning and budgeting process, all ministries and departments are now establishing institutions for incorporating MDG-related activities into their specific budgets. The outcome of this was reflected in the Budget Strategy Paper, 2005/06 to 2007/08.
Economy In 2003, under the new Economic Recovery Strategy, the economy registered a 2.8% growth, with a 4.3% increase in 2004 and a 5.8% increase in 2005. In 2007 the economy recorded a 7.0% growth rate. However, the growth rate in 2008 declined by approximately 4.5% as a result of political disturbances after disputed elections of 2007(Economic Survey, 2008). Kenya has taken measures to improve governance and create a better environment for development. The Government has enacted various legislations including:- the Anti-Corruption and Economic Crimes Act 2003; the Public Officer Ethics Act 2003; the Public Audit Act 2003; the Public Procurement and Disposal Act, the Privatisation Act and the Government Financial Management Act. It has also launched a “Strategy for Performance Improvement in the Public Service”, with the objective of introducing results-orientated management into the public sector to improve quality, efficiency. This has increased public pressure on government officer to deliver and has lead to some improvement in service delivery.
Education Since the introduction of the free primary education policy in 2003, primary school enrolment has increased by 7.9% from 7.6 millions pupils in 2006 to 8.2 million by 2007. Gross enrolment rate for boys and girls in 2007 was 110.7 % and 104.4% respectively (Economic Survey, 2008). Similarly, the secondary level has witnessed slight improvement in enrolment rising from a national GER of 32.2 % in 2006 to 36.8% in 2007. If Kenya maintain this current trend, it is likely to achieve the MDG of achieving universal primary education by the year 2015. It is also likely to achieve the goal of gender parity by 2015, since the enrolment, retention, completion and progression rates are almost equal for both genders in primary school. Recently, the Government lowered the cut-off points for female students to join public universities. The president has also declared a 30% quota of all public appointments be reserved for women.
Gender Kenya has made notable progress on gender issues in Kenya. However despite sustained campaigns, wide gender gaps still exist in access to and control of resources, economic opportunities and political voice. Overall, women continue to have less
HELIO International/Kenya 10
access to social services and productive resources than men. Women remain vastly underrepresented in parliament and local authorities and account for only 8.3% of the seats in the National Assembly. Malaria remains the leading cause of mortality and morbidity in Kenya accounting for 5 % of deaths and 30 % of morbidity. Out of Kenya’s population of over 37 million, 70% (20 million people) live in malaria prone areas and are at risk of infection.
Environment About 81% of the population has access to safe sanitary means, with 94.8% in urban areas and 76.6% in the rural areas. High levels of poverty negatively impact on the environment through land degradation leading to reduced productivity and hunger, and pollution of ground water table by both industry and chemical fertilisers. Pollution of drinking water sources is responsible for leukaemia in children and increased incidences of malaria, typhoid, cholera and other environmental diseases. Access to safe water is estimated at 89% in urban areas and 49% in rural areas with a national average of 57%. Sanitation access in urban areas is estimated at 94.8% compared to 76.6% in rural areas. Wood fuel is the main source of household energy. The high and increasing demand for wood-fuel poses a major threat to existing forest and other terrestrial ecosystem resources. For example, since 1930, Kenya has lost approximately 65% of its original standing wood groves. The challenge is how to reduce over-reliance on wood-fuel among the rural poor who have limited access to alternative sources of energy.
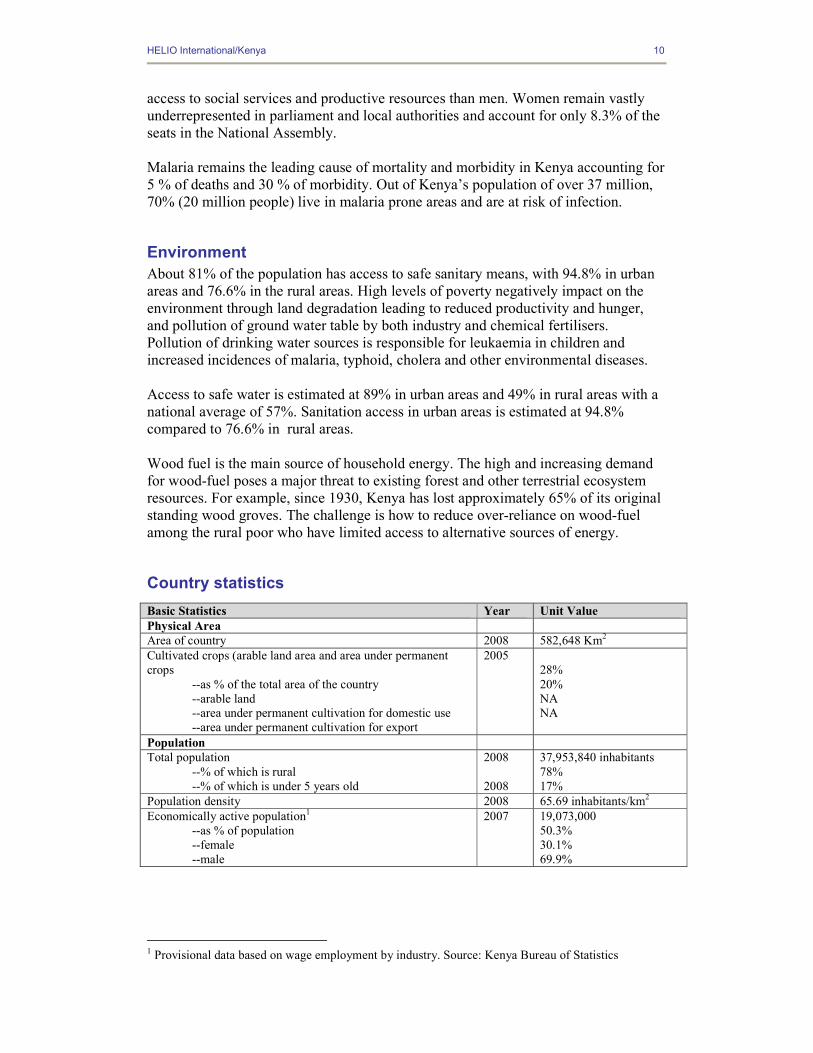
Country statistics
1 Provisional data based on wage employment by industry. Source: Kenya Bureau of Statistics
Basic Statistics Year Unit Value Physical Area Area of country 2008 582,648 Km2 Cultivated crops (arable land area and area under permanent crops
--as % of the total area of the country --arable land --area under permanent cultivation for domestic use --area under permanent cultivation for export
2005 28% 20% NA NA
Population Total population
--% of which is rural --% of which is under 5 years old
2008 2008
37,953,840 inhabitants 78% 17%
Population density 2008 65.69 inhabitants/km2 Economically active population1
--as % of population --female --male
2007 19,073,000 50.3% 30.1% 69.9%
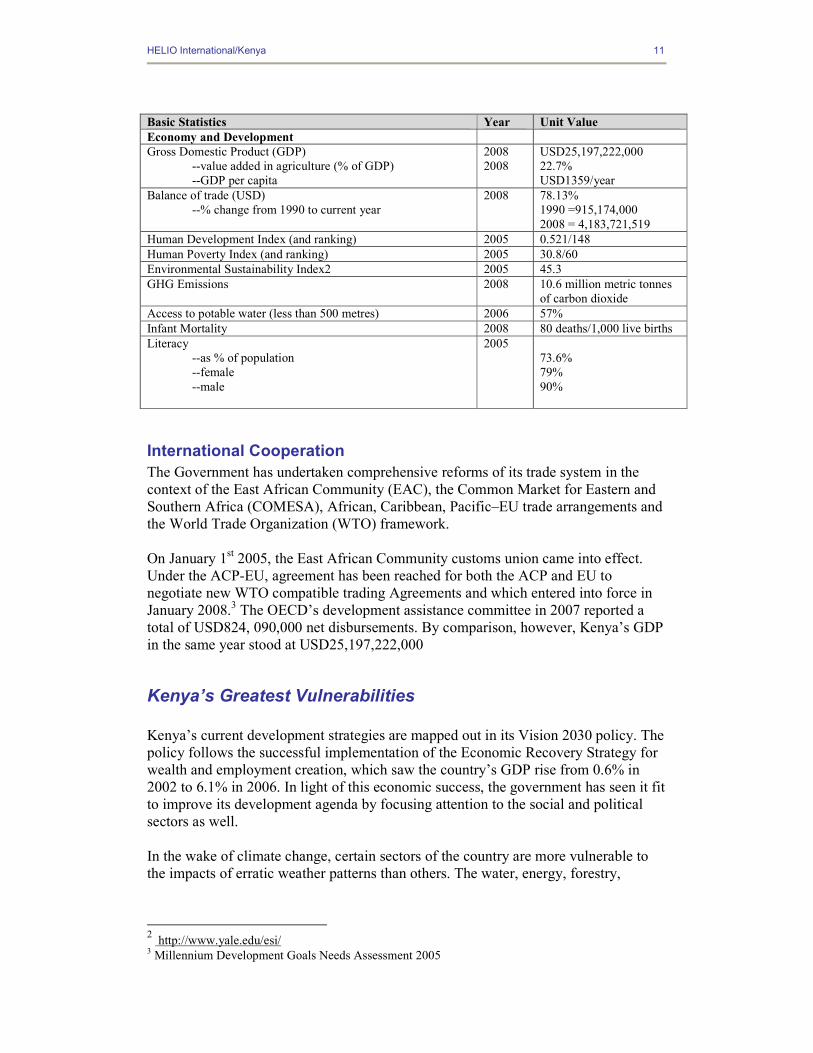
HELIO International/Kenya 11
International Cooperation The Government has undertaken comprehensive reforms of its trade system in the context of the East African Community (EAC), the Common Market for Eastern and Southern Africa (COMESA), African, Caribbean, Pacific–EU trade arrangements and the World Trade Organization (WTO) framework. On January 1st 2005, the East African Community customs union came into effect. Under the ACP-EU, agreement has been reached for both the ACP and EU to negotiate new WTO compatible trading Agreements and which entered into force in January 2008.3 The OECD’s development assistance committee in 2007 reported a total of USD824, 090,000 net disbursements. By comparison, however, Kenya’s GDP in the same year stood at USD25,197,222,000
Kenya’s Greatest Vulnerabilities Kenya’s current development strategies are mapped out in its Vision 2030 policy. The policy follows the successful implementation of the Economic Recovery Strategy for wealth and employment creation, which saw the country’s GDP rise from 0.6% in 2002 to 6.1% in 2006. In light of this economic success, the government has seen it fit to improve its development agenda by focusing attention to the social and political sectors as well. In the wake of climate change, certain sectors of the country are more vulnerable to the impacts of erratic weather patterns than others. The water, energy, forestry,
2 http://www.yale.edu/esi/ 3 Millennium Development Goals Needs Assessment 2005
Basic Statistics Year Unit Value Economy and Development Gross Domestic Product (GDP)
--value added in agriculture (% of GDP) --GDP per capita
2008 2008
USD25,197,222,000 22.7% USD1359/year
Balance of trade (USD) --% change from 1990 to current year
2008 78.13% 1990 =915,174,000 2008 = 4,183,721,519
Human Development Index (and ranking) 2005 0.521/148 Human Poverty Index (and ranking) 2005 30.8/60 Environmental Sustainability Index2 2005 45.3 GHG Emissions 2008 10.6 million metric tonnes
of carbon dioxide Access to potable water (less than 500 metres) 2006 57% Infant Mortality 2008 80 deaths/1,000 live births Literacy
--as % of population --female --male
2005 73.6% 79% 90%
HELIO International/Kenya 12
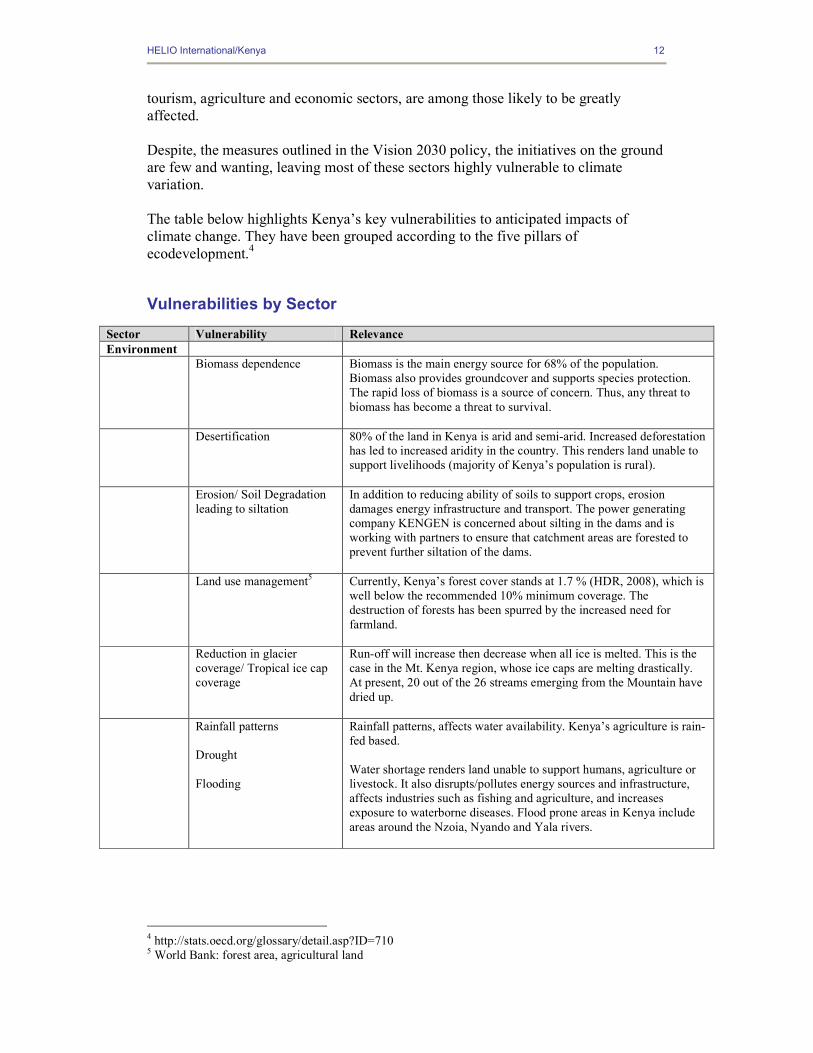
tourism, agriculture and economic sectors, are among those likely to be greatly affected. Despite, the measures outlined in the Vision 2030 policy, the initiatives on the ground are few and wanting, leaving most of these sectors highly vulnerable to climate variation. The table below highlights Kenya’s key vulnerabilities to anticipated impacts of climate change. They have been grouped according to the five pillars of ecodevelopment.4
Vulnerabilities by Sector
4 http://stats.oecd.org/glossary/detail.asp?ID=710 5 World Bank: forest area, agricultural land
Sector Vulnerability Relevance Environment Biomass dependence Biomass is the main energy source for 68% of the population.
Biomass also provides groundcover and supports species protection. The rapid loss of biomass is a source of concern. Thus, any threat to biomass has become a threat to survival.
Desertification 80% of the land in Kenya is arid and semi-arid. Increased deforestation has led to increased aridity in the country. This renders land unable to support livelihoods (majority of Kenya’s population is rural).
Erosion/ Soil Degradation leading to siltation
In addition to reducing ability of soils to support crops, erosion damages energy infrastructure and transport. The power generating company KENGEN is concerned about silting in the dams and is working with partners to ensure that catchment areas are forested to prevent further siltation of the dams.
Land use management5 Currently, Kenya’s forest cover stands at 1.7 % (HDR, 2008), which is well below the recommended 10% minimum coverage. The destruction of forests has been spurred by the increased need for farmland.
Reduction in glacier coverage/ Tropical ice cap coverage
Run-off will increase then decrease when all ice is melted. This is the case in the Mt. Kenya region, whose ice caps are melting drastically. At present, 20 out of the 26 streams emerging from the Mountain have dried up.
Rainfall patterns Drought Flooding
Rainfall patterns, affects water availability. Kenya’s agriculture is rain-fed based. Water shortage renders land unable to support humans, agriculture or livestock. It also disrupts/pollutes energy sources and infrastructure, affects industries such as fishing and agriculture, and increases exposure to waterborne diseases. Flood prone areas in Kenya include areas around the Nzoia, Nyando and Yala rivers.
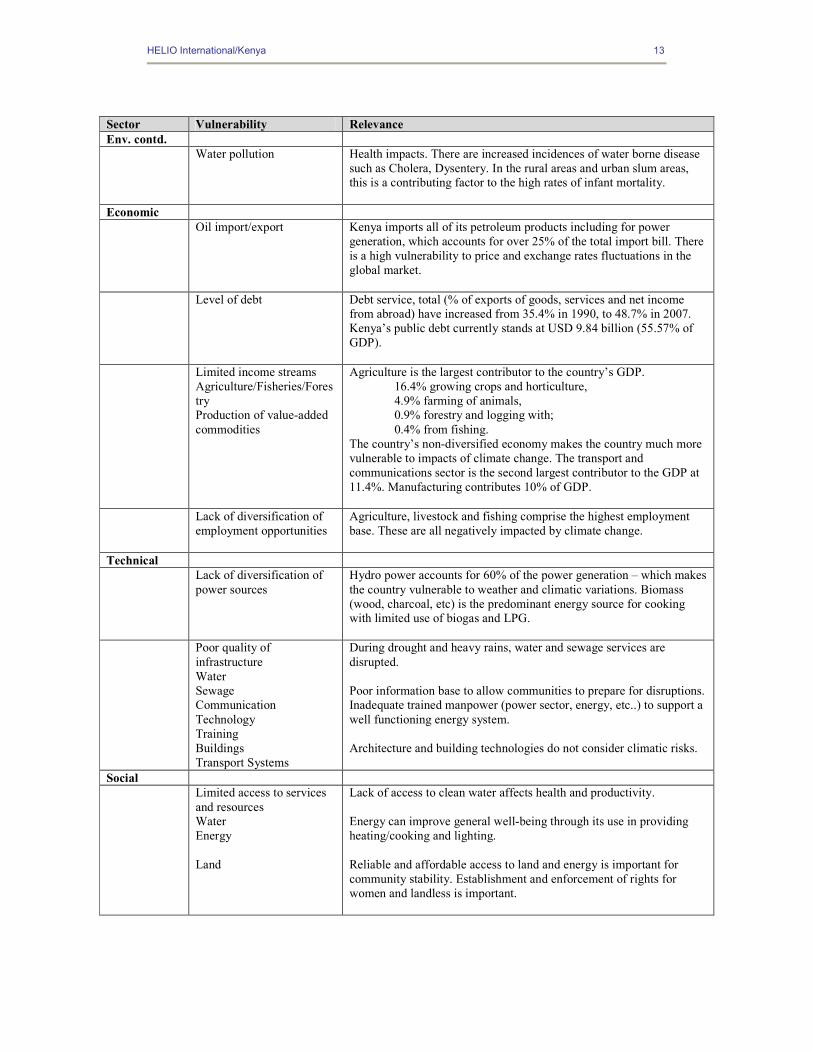
HELIO International/Kenya 13
Sector Vulnerability Relevance Env. contd. Water pollution Health impacts. There are increased incidences of water borne disease
such as Cholera, Dysentery. In the rural areas and urban slum areas, this is a contributing factor to the high rates of infant mortality.
Economic Oil import/export Kenya imports all of its petroleum products including for power
generation, which accounts for over 25% of the total import bill. There is a high vulnerability to price and exchange rates fluctuations in the global market.
Level of debt Debt service, total (% of exports of goods, services and net income from abroad) have increased from 35.4% in 1990, to 48.7% in 2007. Kenya’s public debt currently stands at USD 9.84 billion (55.57% of GDP).
Limited income streams Agriculture/Fisheries/Forestry Production of value-added commodities
Agriculture is the largest contributor to the country’s GDP. 16.4% growing crops and horticulture, 4.9% farming of animals, 0.9% forestry and logging with; 0.4% from fishing.
The country’s non-diversified economy makes the country much more vulnerable to impacts of climate change. The transport and communications sector is the second largest contributor to the GDP at 11.4%. Manufacturing contributes 10% of GDP.
Lack of diversification of employment opportunities
Agriculture, livestock and fishing comprise the highest employment base. These are all negatively impacted by climate change.
Technical Lack of diversification of
power sources Hydro power accounts for 60% of the power generation – which makes the country vulnerable to weather and climatic variations. Biomass (wood, charcoal, etc) is the predominant energy source for cooking with limited use of biogas and LPG.
Poor quality of infrastructure Water Sewage Communication Technology Training Buildings Transport Systems
During drought and heavy rains, water and sewage services are disrupted. Poor information base to allow communities to prepare for disruptions. Inadequate trained manpower (power sector, energy, etc..) to support a well functioning energy system. Architecture and building technologies do not consider climatic risks.
Social Limited access to services
and resources Water Energy Land
Lack of access to clean water affects health and productivity. Energy can improve general well-being through its use in providing heating/cooking and lighting. Reliable and affordable access to land and energy is important for community stability. Establishment and enforcement of rights for women and landless is important.
HELIO International/Kenya 14
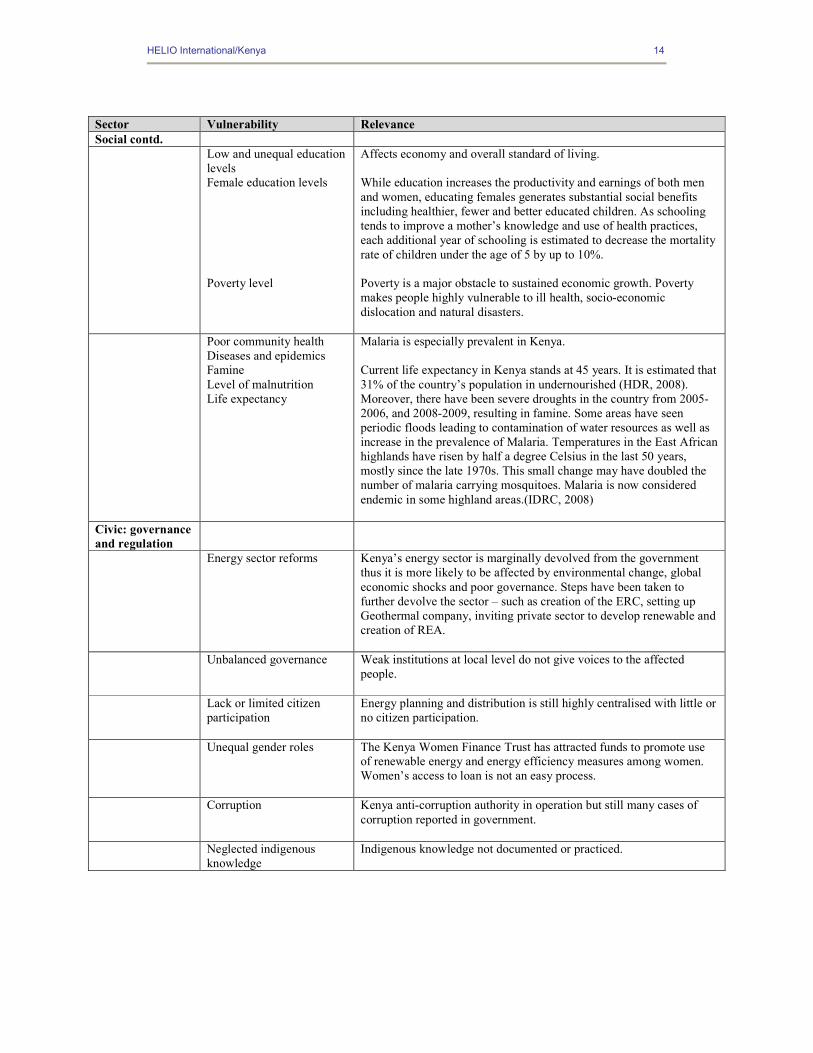
Sector Vulnerability Relevance Social contd. Low and unequal education
levels Female education levels Poverty level
Affects economy and overall standard of living. While education increases the productivity and earnings of both men and women, educating females generates substantial social benefits including healthier, fewer and better educated children. As schooling tends to improve a mother’s knowledge and use of health practices, each additional year of schooling is estimated to decrease the mortality rate of children under the age of 5 by up to 10%. Poverty is a major obstacle to sustained economic growth. Poverty makes people highly vulnerable to ill health, socio-economic dislocation and natural disasters.
Poor community health Diseases and epidemics Famine Level of malnutrition Life expectancy
Malaria is especially prevalent in Kenya. Current life expectancy in Kenya stands at 45 years. It is estimated that 31% of the country’s population in undernourished (HDR, 2008). Moreover, there have been severe droughts in the country from 2005-2006, and 2008-2009, resulting in famine. Some areas have seen periodic floods leading to contamination of water resources as well as increase in the prevalence of Malaria. Temperatures in the East African highlands have risen by half a degree Celsius in the last 50 years, mostly since the late 1970s. This small change may have doubled the number of malaria carrying mosquitoes. Malaria is now considered endemic in some highland areas.(IDRC, 2008)
Civic: governance and regulation
Energy sector reforms Kenya’s energy sector is marginally devolved from the government thus it is more likely to be affected by environmental change, global economic shocks and poor governance. Steps have been taken to further devolve the sector – such as creation of the ERC, setting up Geothermal company, inviting private sector to develop renewable and creation of REA.
Unbalanced governance Weak institutions at local level do not give voices to the affected people.
Lack or limited citizen participation
Energy planning and distribution is still highly centralised with little or no citizen participation.
Unequal gender roles The Kenya Women Finance Trust has attracted funds to promote use of renewable energy and energy efficiency measures among women. Women’s access to loan is not an easy process.
Corruption Kenya anti-corruption authority in operation but still many cases of corruption reported in government.
Neglected indigenous knowledge
Indigenous knowledge not documented or practiced.
HELIO International/Kenya 15
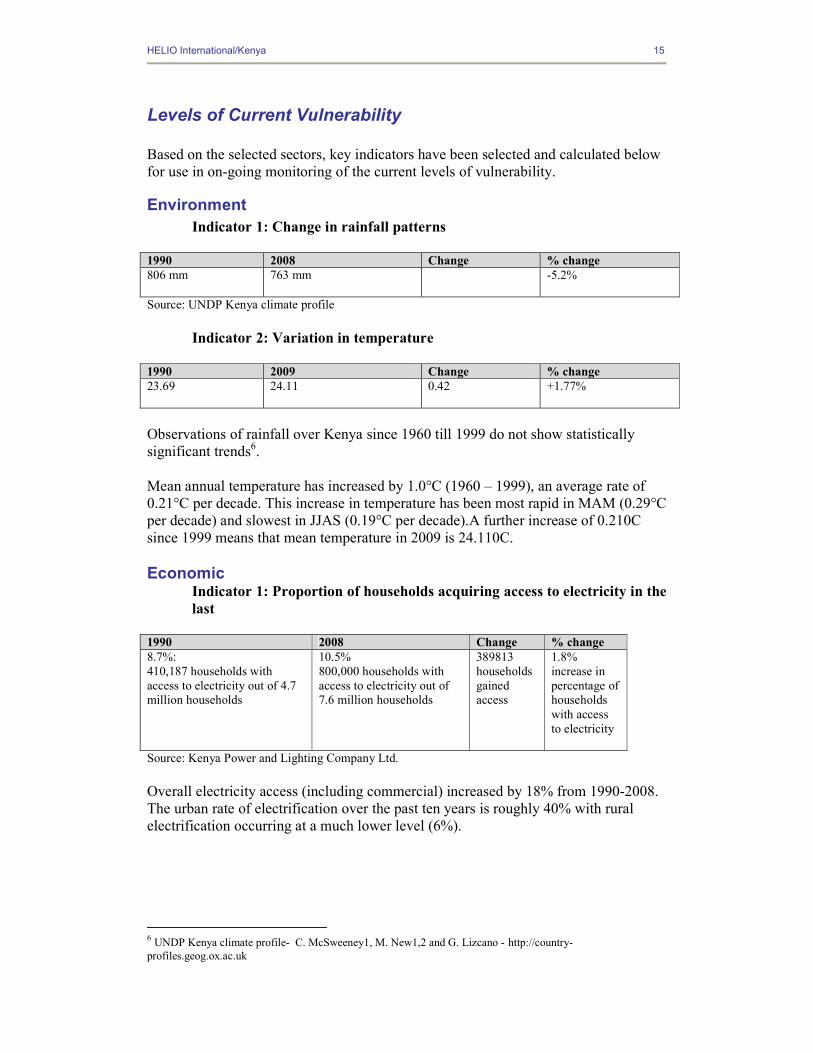
Levels of Current Vulnerability Based on the selected sectors, key indicators have been selected and calculated below for use in on-going monitoring of the current levels of vulnerability.
Environment Indicator 1: Change in rainfall patterns
1990 2008 Change % change 806 mm
763 mm -5.2%
Source: UNDP Kenya climate profile
Indicator 2: Variation in temperature 1990 2009 Change % change 23.69
24.11 0.42 +1.77%
Observations of rainfall over Kenya since 1960 till 1999 do not show statistically significant trends6. Mean annual temperature has increased by 1.0°C (1960 – 1999), an average rate of 0.21°C per decade. This increase in temperature has been most rapid in MAM (0.29°C per decade) and slowest in JJAS (0.19°C per decade).A further increase of 0.210C since 1999 means that mean temperature in 2009 is 24.110C. Economic
Indicator 1: Proportion of households acquiring access to electricity in the last
1990 2008 Change % change 8.7%: 410,187 households with access to electricity out of 4.7 million households
10.5% 800,000 households with access to electricity out of 7.6 million households
389813 households gained access
1.8% increase in percentage of households with access to electricity
Source: Kenya Power and Lighting Company Ltd. Overall electricity access (including commercial) increased by 18% from 1990-2008. The urban rate of electrification over the past ten years is roughly 40% with rural electrification occurring at a much lower level (6%).
6 UNDP Kenya climate profile- C. McSweeney1, M. New1,2 and G. Lizcano - http://country-profiles.geog.ox.ac.uk
HELIO International/Kenya 16
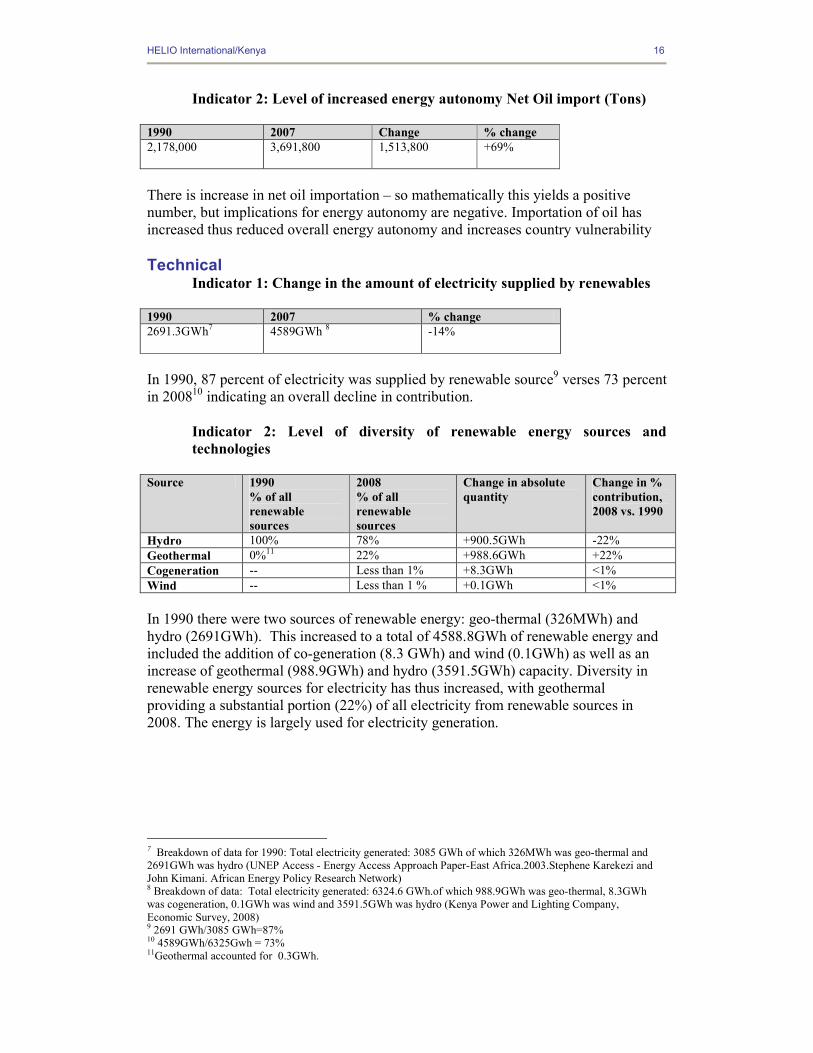
Indicator 2: Level of increased energy autonomy Net Oil import (Tons) 1990 2007 Change % change 2,178,000
3,691,800 1,513,800 +69%
There is increase in net oil importation – so mathematically this yields a positive number, but implications for energy autonomy are negative. Importation of oil has increased thus reduced overall energy autonomy and increases country vulnerability Technical
Indicator 1: Change in the amount of electricity supplied by renewables 1990 2007 % change 2691.3GWh7
4589GWh 8 -14%
In 1990, 87 percent of electricity was supplied by renewable source9 verses 73 percent in 200810 indicating an overall decline in contribution.
Indicator 2: Level of diversity of renewable energy sources and technologies
Source 1990
% of all renewable sources
2008 % of all renewable sources
Change in absolute quantity
Change in % contribution, 2008 vs. 1990
Hydro 100% 78% +900.5GWh -22% Geothermal 0%11 22% +988.6GWh +22% Cogeneration -- Less than 1% +8.3GWh <1% Wind -- Less than 1 % +0.1GWh <1% In 1990 there were two sources of renewable energy: geo-thermal (326MWh) and hydro (2691GWh). This increased to a total of 4588.8GWh of renewable energy and included the addition of co-generation (8.3 GWh) and wind (0.1GWh) as well as an increase of geothermal (988.9GWh) and hydro (3591.5GWh) capacity. Diversity in renewable energy sources for electricity has thus increased, with geothermal providing a substantial portion (22%) of all electricity from renewable sources in 2008. The energy is largely used for electricity generation.
7 Breakdown of data for 1990: Total electricity generated: 3085 GWh of which 326MWh was geo-thermal and 2691GWh was hydro (UNEP Access - Energy Access Approach Paper-East Africa.2003.Stephene Karekezi and John Kimani. African Energy Policy Research Network) 8 Breakdown of data: Total electricity generated: 6324.6 GWh.of which 988.9GWh was geo-thermal, 8.3GWh was cogeneration, 0.1GWh was wind and 3591.5GWh was hydro (Kenya Power and Lighting Company, Economic Survey, 2008) 9 2691 GWh/3085 GWh=87% 10 4589GWh/6325Gwh = 73% 11Geothermal accounted for 0.3GWh.
HELIO International/Kenya 17
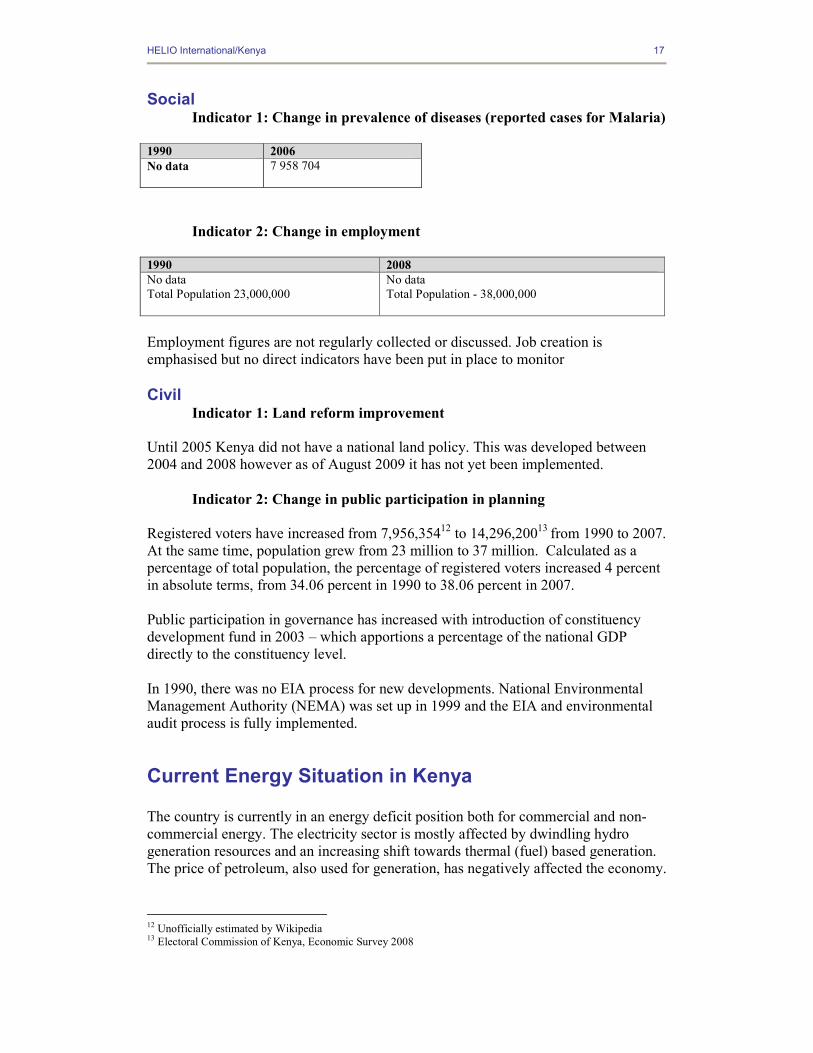
Social Indicator 1: Change in prevalence of diseases (reported cases for Malaria)
1990 2006 No data
7 958 704
Indicator 2: Change in employment 1990 2008 No data Total Population 23,000,000
No data Total Population - 38,000,000
Employment figures are not regularly collected or discussed. Job creation is emphasised but no direct indicators have been put in place to monitor Civil
Indicator 1: Land reform improvement Until 2005 Kenya did not have a national land policy. This was developed between 2004 and 2008 however as of August 2009 it has not yet been implemented.
Indicator 2: Change in public participation in planning Registered voters have increased from 7,956,35412 to 14,296,20013 from 1990 to 2007. At the same time, population grew from 23 million to 37 million. Calculated as a percentage of total population, the percentage of registered voters increased 4 percent in absolute terms, from 34.06 percent in 1990 to 38.06 percent in 2007. Public participation in governance has increased with introduction of constituency development fund in 2003 – which apportions a percentage of the national GDP directly to the constituency level. In 1990, there was no EIA process for new developments. National Environmental Management Authority (NEMA) was set up in 1999 and the EIA and environmental audit process is fully implemented.
Current Energy Situation in Kenya The country is currently in an energy deficit position both for commercial and non-commercial energy. The electricity sector is mostly affected by dwindling hydro generation resources and an increasing shift towards thermal (fuel) based generation. The price of petroleum, also used for generation, has negatively affected the economy.
12 Unofficially estimated by Wikipedia 13 Electoral Commission of Kenya, Economic Survey 2008
HELIO International/Kenya 18
On a positive note, efforts to find alternative energy sources – particularly renewable sources have increased.
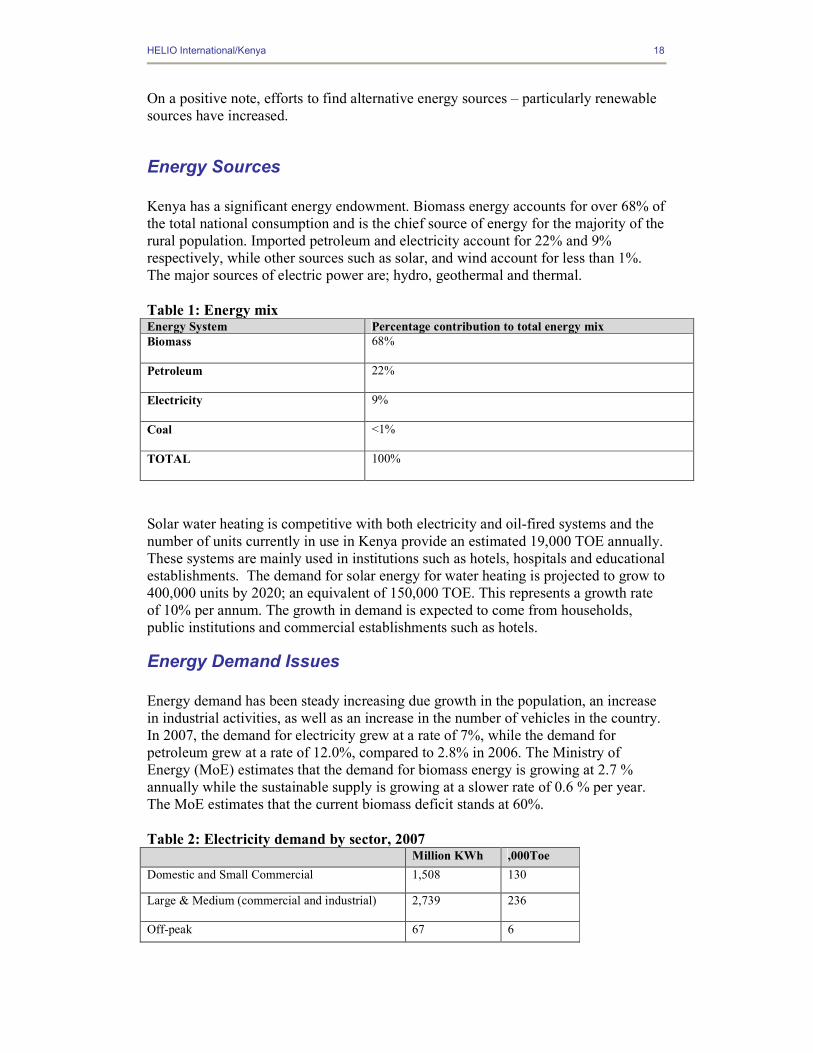
Energy Sources Kenya has a significant energy endowment. Biomass energy accounts for over 68% of the total national consumption and is the chief source of energy for the majority of the rural population. Imported petroleum and electricity account for 22% and 9% respectively, while other sources such as solar, and wind account for less than 1%. The major sources of electric power are; hydro, geothermal and thermal. Table 1: Energy mix Energy System Percentage contribution to total energy mix Biomass
68%
Petroleum
22%
Electricity
9%
Coal
<1%
TOTAL
100%
Solar water heating is competitive with both electricity and oil-fired systems and the number of units currently in use in Kenya provide an estimated 19,000 TOE annually. These systems are mainly used in institutions such as hotels, hospitals and educational establishments. The demand for solar energy for water heating is projected to grow to 400,000 units by 2020; an equivalent of 150,000 TOE. This represents a growth rate of 10% per annum. The growth in demand is expected to come from households, public institutions and commercial establishments such as hotels.
Energy Demand Issues Energy demand has been steady increasing due growth in the population, an increase in industrial activities, as well as an increase in the number of vehicles in the country. In 2007, the demand for electricity grew at a rate of 7%, while the demand for petroleum grew at a rate of 12.0%, compared to 2.8% in 2006. The Ministry of Energy (MoE) estimates that the demand for biomass energy is growing at 2.7 % annually while the sustainable supply is growing at a slower rate of 0.6 % per year. The MoE estimates that the current biomass deficit stands at 60%. Table 2: Electricity demand by sector, 2007 Million KWh ,000Toe
Domestic and Small Commercial 1,508 130
Large & Medium (commercial and industrial) 2,739 236
Off-peak 67 6
HELIO International/Kenya 19
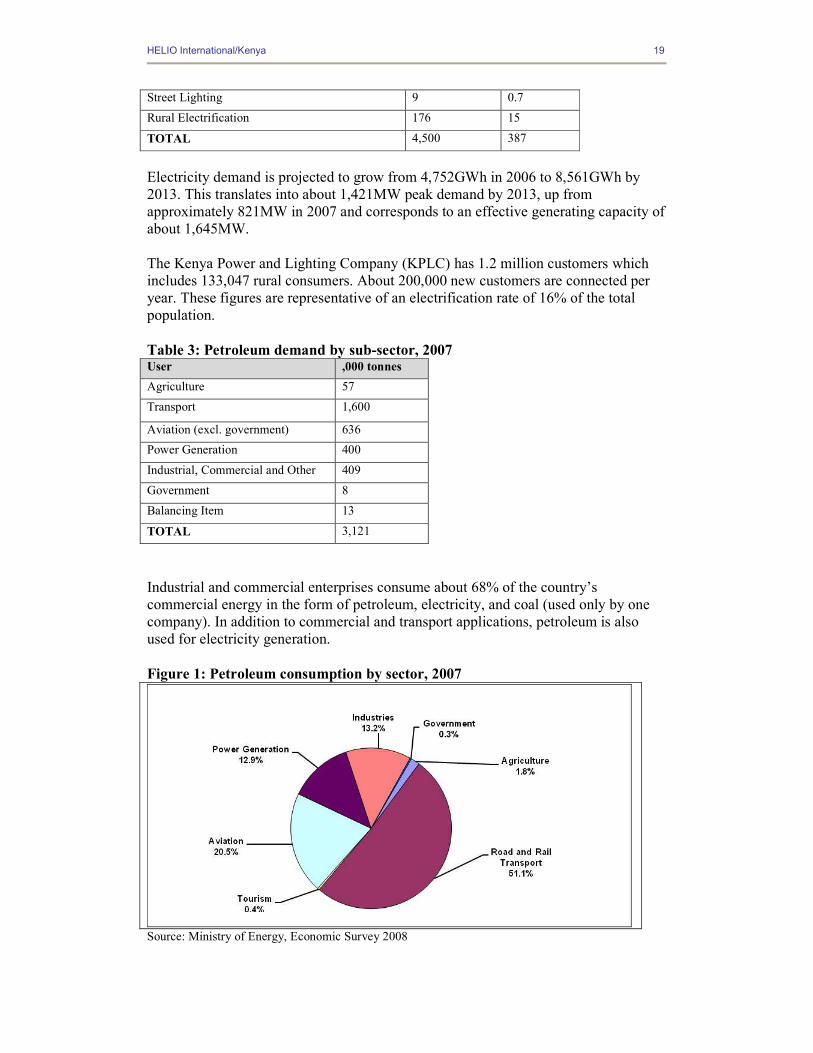
Street Lighting 9 0.7
Rural Electrification 176 15
TOTAL 4,500 387
Electricity demand is projected to grow from 4,752GWh in 2006 to 8,561GWh by 2013. This translates into about 1,421MW peak demand by 2013, up from approximately 821MW in 2007 and corresponds to an effective generating capacity of about 1,645MW. The Kenya Power and Lighting Company (KPLC) has 1.2 million customers which includes 133,047 rural consumers. About 200,000 new customers are connected per year. These figures are representative of an electrification rate of 16% of the total population. Table 3: Petroleum demand by sub-sector, 2007 User ,000 tonnes
Agriculture 57
Transport 1,600
Aviation (excl. government) 636
Power Generation 400
Industrial, Commercial and Other 409
Government 8
Balancing Item 13
TOTAL 3,121
Industrial and commercial enterprises consume about 68% of the country’s commercial energy in the form of petroleum, electricity, and coal (used only by one company). In addition to commercial and transport applications, petroleum is also used for electricity generation. Figure 1: Petroleum consumption by sector, 2007
Source: Ministry of Energy, Economic Survey 2008
HELIO International/Kenya 20
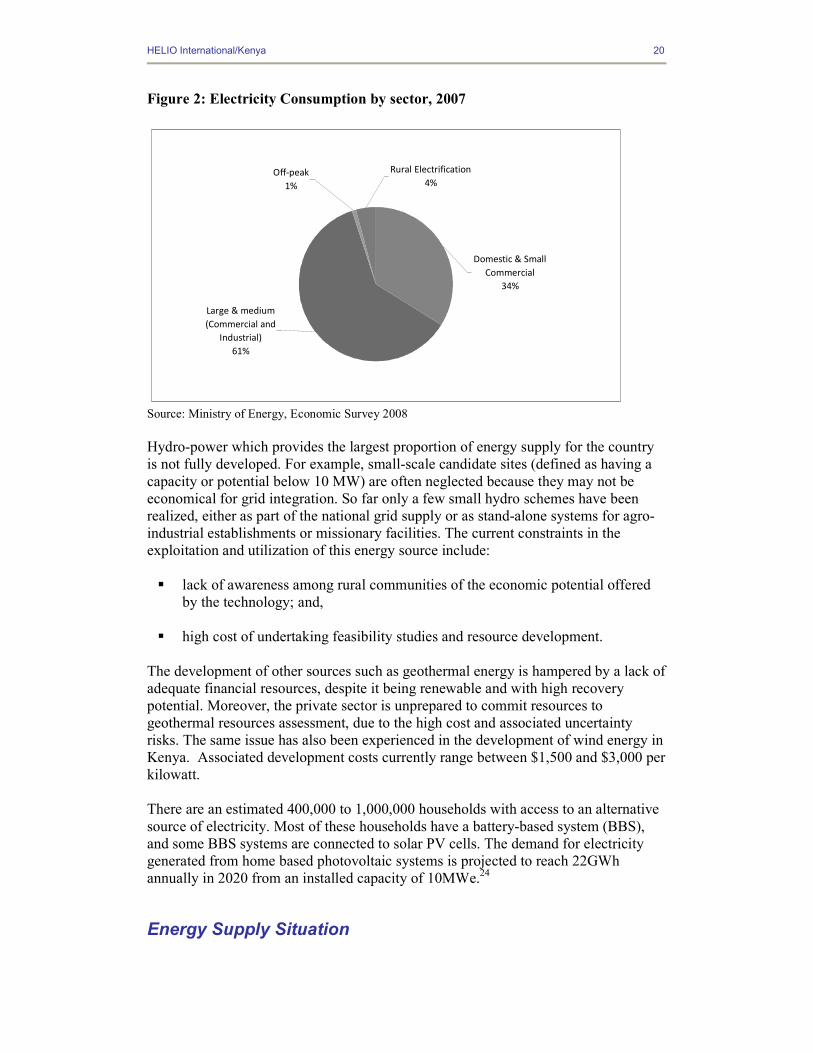
Figure 2: Electricity Consumption by sector, 2007
Domestic & Small Commercial
34%
Large & medium (Commercial and
Industrial)61%
Off-peak1%
Rural Electrification4%
Source: Ministry of Energy, Economic Survey 2008 Hydro-power which provides the largest proportion of energy supply for the country is not fully developed. For example, small-scale candidate sites (defined as having a capacity or potential below 10 MW) are often neglected because they may not be economical for grid integration. So far only a few small hydro schemes have been realized, either as part of the national grid supply or as stand-alone systems for agro-industrial establishments or missionary facilities. The current constraints in the exploitation and utilization of this energy source include: � lack of awareness among rural communities of the economic potential offered
by the technology; and, � high cost of undertaking feasibility studies and resource development.
The development of other sources such as geothermal energy is hampered by a lack of adequate financial resources, despite it being renewable and with high recovery potential. Moreover, the private sector is unprepared to commit resources to geothermal resources assessment, due to the high cost and associated uncertainty risks. The same issue has also been experienced in the development of wind energy in Kenya. Associated development costs currently range between $1,500 and $3,000 per kilowatt. There are an estimated 400,000 to 1,000,000 households with access to an alternative source of electricity. Most of these households have a battery-based system (BBS), and some BBS systems are connected to solar PV cells. The demand for electricity generated from home based photovoltaic systems is projected to reach 22GWh annually in 2020 from an installed capacity of 10MWe.24
Energy Supply Situation
HELIO International/Kenya 21
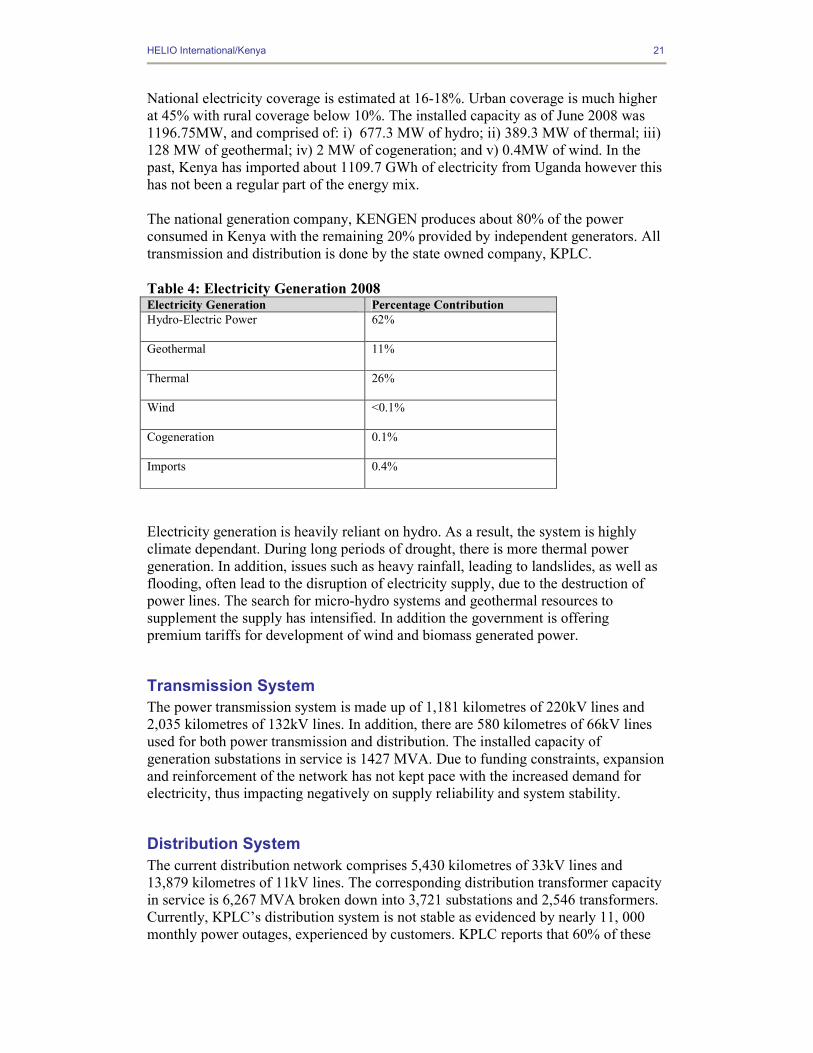
National electricity coverage is estimated at 16-18%. Urban coverage is much higher at 45% with rural coverage below 10%. The installed capacity as of June 2008 was 1196.75MW, and comprised of: i) 677.3 MW of hydro; ii) 389.3 MW of thermal; iii) 128 MW of geothermal; iv) 2 MW of cogeneration; and v) 0.4MW of wind. In the past, Kenya has imported about 1109.7 GWh of electricity from Uganda however this has not been a regular part of the energy mix. The national generation company, KENGEN produces about 80% of the power consumed in Kenya with the remaining 20% provided by independent generators. All transmission and distribution is done by the state owned company, KPLC. Table 4: Electricity Generation 2008 Electricity Generation Percentage Contribution Hydro-Electric Power
62%
Geothermal
11%
Thermal
26%
Wind
<0.1%
Cogeneration
0.1%
Imports
0.4%
Electricity generation is heavily reliant on hydro. As a result, the system is highly climate dependant. During long periods of drought, there is more thermal power generation. In addition, issues such as heavy rainfall, leading to landslides, as well as flooding, often lead to the disruption of electricity supply, due to the destruction of power lines. The search for micro-hydro systems and geothermal resources to supplement the supply has intensified. In addition the government is offering premium tariffs for development of wind and biomass generated power.
Transmission System The power transmission system is made up of 1,181 kilometres of 220kV lines and 2,035 kilometres of 132kV lines. In addition, there are 580 kilometres of 66kV lines used for both power transmission and distribution. The installed capacity of generation substations in service is 1427 MVA. Due to funding constraints, expansion and reinforcement of the network has not kept pace with the increased demand for electricity, thus impacting negatively on supply reliability and system stability.
Distribution System The current distribution network comprises 5,430 kilometres of 33kV lines and 13,879 kilometres of 11kV lines. The corresponding distribution transformer capacity in service is 6,267 MVA broken down into 3,721 substations and 2,546 transformers. Currently, KPLC’s distribution system is not stable as evidenced by nearly 11, 000 monthly power outages, experienced by customers. KPLC reports that 60% of these
HELIO International/Kenya 22
outages are as a result of tampered power lines. Hence the company has embarked on various aggressive initiatives to curb the vice.
Regional Interconnection The Kenyan power system is interconnected with the Ugandan system through a 132 kV double circuit from which 30MW of non-firm power is imported. Plans to interconnect with the East Africa Power Pool (EAPP) are at an advanced stage .This will enhance Kenya’s power supply security particularly during periods of severe droughts as well as assist the government in making prudent decisions on generation capacity additions. The challenge is therefore to pool adequate financial resources from domestic, bilateral and multilateral sources to ensure timely implementation of these regional power interconnection projects.
Bilateral /International Government Cooperation on Energy There have been several efforts by Kenya’s bilateral and multilateral partners to diversify as well as improve the planning, management and capacity of various energy sources in the country. The table below summaries these partnerships.
Bilateral/Multilateral Partner Project UNEP-Geneva, UNDP-Kenya, Government of Kenya through the Ministry of Planning and National Development (MOPND)
The Integrated Assessment and Planning (IAP) project was aimed at strengthening Kenya’s energy sector. The overall goal of the project was to develop institutional capacity for IAP, by assessing energy planning and energy policy in the country. The project highlighted critical linkages between increasing access to energy services and economic development.
World Bank - Government of Kenya & ITDG
This project was aimed at supporting the country’s energy sector through providing capacity building in the form of energy education and training. This project ran from 2006 to 2008, with 1.5 million Euros of funding from Finland.
World Bank (Ministry of Energy, KENGEN, KPLC and ERB on the Energy Sector Recovery Project (ESRP).
The project is scheduled to run from 2004 to 2011. It is aimed at enhancing the policy, institutional and regulatory environment for private sector participation and sector development. It will also aim to increase access to electricity in urban and peri-urban areas while improving the efficiency, reliability and quality of service to existing consumers. Providing support efficient expansion of power generation capacity to meet the economy's projected supply deficits by FY2006/07 is also an objective.
Global Environment Facility (GEF) In 2006, GEF awarded a USD$1 million grant to be directed towards the removal of market barriers to the adoption, by both institutions and small businesses in rural and urban areas, of sustainable biomass energy practices and technologies. --14 retrofit demonstration projects in six enterprises were successfully implemented through the project. There was at least a 20 percent reduction in GHGs and energy cost savings of between 10-40 percent. --By the end of 2005, the project had assisted Kenyan industries to save over US$ 22million in energy costs
HELIO International/Kenya 23
through improved --The estimated CO2 reduction over the project’s lifetime was 580,225 tonnes. GEF funding of US$ 3.19 million therefore achieved a US$ 5.50 per ton cost of CO2 reduction --establishment of a number of collaborative partnerships -- A number of new institutions, including an ESCO, and an awards system, and a Centre for Energy Efficiency and Conservation, (within the Kenyan Association of Manufacturers and with funding from the Ministry of Energy have been set up. A new Energy Bill includes a section on energy efficiency and conservation. -- The ESCO – Integrated Energy Services Ltd (IES) – was established in late 2005 and contracted by KAM in April 2006.
Global Environment Facility in 2006 GEF provided funding for the implementation of the Cogen for Africa Kenya project. The project is being co-implemented by UNEP & the African Development Bank (AfDB) and executed by the Nairobi-based AFREPREN/FWD - the Energy, Environment and Development Network for Africa. The aim is to increase efficient cogeneration capacity as full-scale promotion projects (FSPPs), It is expected to add an additional 40 MW of modern and efficient cogeneration capacity as full-scale promotion projects (FSPPs) over a 6 year period. By the end of the six years, Cogen for Africa is expected to have set the stage for accelerated cogen investments through the promotion projects. Another 20 MW of cogen projects will be directly supported through the provision of advice, services and training. Beyond the initial six-year phase, Cogen for Africa is expected to stimulate a total installation of an additional 200 MW of cogeneration capacity in the medium to long term.
HELIO International/Kenya 24
Legislative and Regulatory Frameworks Kenya’s energy sector is governed primarily by the Energy Act 2006, whose broad objective is to ensure adequate, quality, cost effective and affordable supply of energy to meet development needs, while protecting and conserving the environment. Its specific objectives are to: � provide sustainable quality energy services for development;
� utilise energy as tool to accelerate economic empowerment for urban and rural
development; � improve access to affordable energy services;
� provide an enabling environment for the provision of energy services;
� enhance security of supply;
� promote development of indigenous energy resources; and,
� promote energy efficiency and conservation as well as prudent environmental,
health and safety practices. The Act also recognizes the need for regulation in the biomass sector and highlights the need to ensure sufficient biomass supplies to meet demand on a sustainable basis while minimizing the associated environmental impacts. It also addresses the importance of renewable energy and energy efficiency. The MoE has published renewable energy feed-in tariffs policy for wind, small hydro and biomass. This policy is aimed at attracting private sector investments in electricity generation from renewable energy sources as a means of diversifying national power sources, enhancing national energy security, creating employment and income generation. There has been positive response to this policy by interested investors who are already carrying out site-specific feasibility studies as they seek to invest in the wind energy sector. Some of the potential investors include multinational conglomerates including General Electric and other foreign private entities. The 2006 Energy Act is a great improvement over the previous one which had little to say about renewable energy or energy efficiency. Moreover, it emphasises the need for environmental sustainability in development and transportation of energy resources. However, the policy does not expressly recognise the importance or significance of climate change in achieving its objective. In developing energy resources, economic, social and environmental considerations are taken into account but not climate change implications. This could expose the national energy system to vulnerability to climate change.
HELIO International/Kenya 25
Current Impacts of Kenya’s Energy System The continued high dependence biomass has contributed to unsustainable harvesting of biomass leading to negative impacts on the environment and climate vulnerability. The production of biomass for energy also creates land use challenges, and may contribute to a greater problem of food insecurity. Hydro power poses a different challenge. Though Kenya has a large hydro power potential up to 6000MW, (most of the large sites have been developed) overreliance on hydro power can lead to greater climate vulnerability. The country has experienced depressed rainfall over the past four years. In addition there are problems associated with hydro power development – displacement of large numbers of people, disruption in lifestyles etc. On the other hand, increased use of petroleum for power generation leads to increased GHG emissions, thus contributing to climate change. The need therefore arises to diversify energy sources that mitigate and adapt to climate change simultaneously.
Vulnerability and Resilience of Kenya’s Energy System As a result of the over-reliance on biomass and hydro power, climate change poses the single most important threat to Kenya’s energy system. A brief assessment of the likely impacts in relation to the energy system vulnerabilities shows how each impact is likely to affect the country’s energy system (See Annex 1). Changes in meteorological variables will have an impact on energy transmission and use regardless of how energy is produced. Extreme events increase the risk of destruction of transmission lines and reduction of electricity demand due to destruction of electricity-consuming entities. In the following sections, impacts of change of meteorological parameters are assessed for different energy production systems. They are grouped according to generation of energy and transport of the energy to the user. Although the country imports all of its crude oil and coal, the country has some commercial deposits of coal that have not yet been exploited. The utilisation of these fossil fuels in Kenya is not expected to be highly impacted by climate change. Hydro power is currently generated from both large and small hydro power plants in Kenya. The siting of these power plants is often based on multi-decadal river flow measurements. Changes in average precipitation will change river flows and will have an impact on hydro power production. While plants with large reservoirs can buffer river flow variability, run-of-the river plants are directly dependent on the actual river flow. The actual change in power production strongly depends on the flow regime and utilisation rate of river flow (Michaelowa et al, 2009).
HELIO International/Kenya 26
Biomass energy in Kenya is composed primarily of firewood, charcoal, and a small proportion of farm waste. Currently, there is some cogeneration from the sugar production process. Climate change will impact the availability of biomass in the country, sourced from forests and agricultural residues. Wind energy contributes less than 0.1% of the power mix. Over the next five years, this is expected to increase to 10% of current capacity. Expected temperature and windspeed increases are likely to result in increased electricity generation from wind. The current wind turbines and future installations are at 30m above sea level hence no significant destruction is expected from floods.
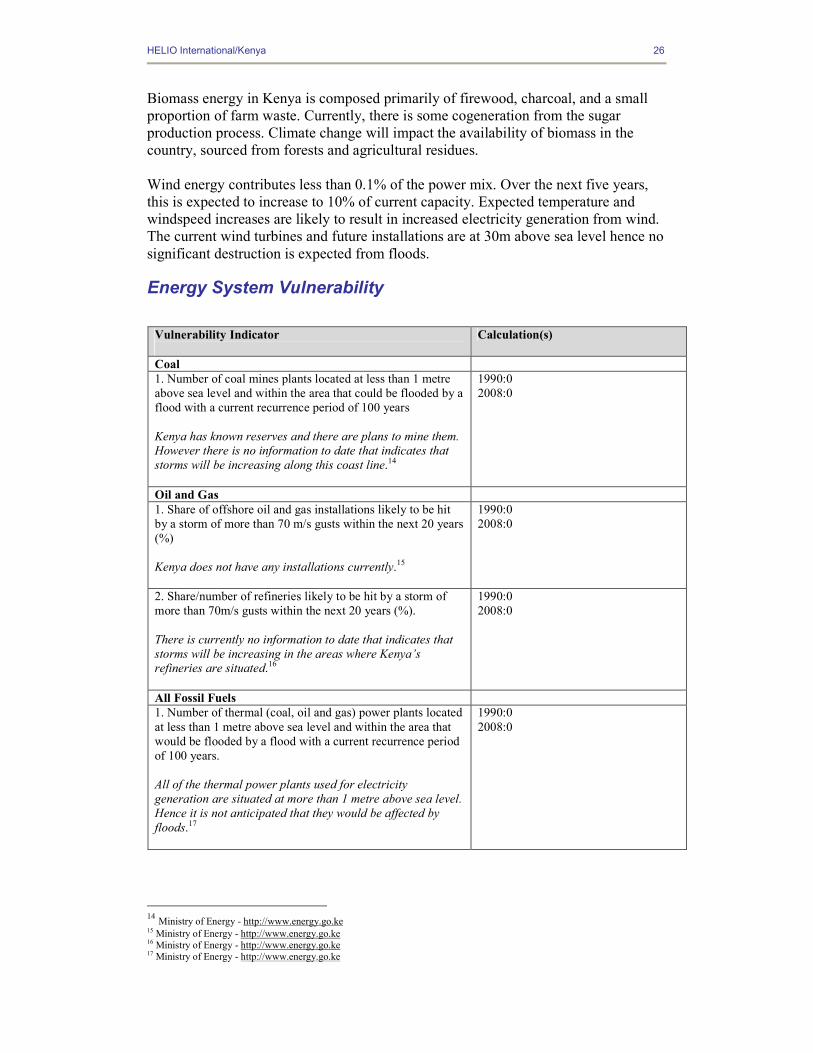
Energy System Vulnerability
14 Ministry of Energy - http://www.energy.go.ke 15 Ministry of Energy - http://www.energy.go.ke 16 Ministry of Energy - http://www.energy.go.ke 17 Ministry of Energy - http://www.energy.go.ke
Vulnerability Indicator
Calculation(s)
Coal 1. Number of coal mines plants located at less than 1 metre above sea level and within the area that could be flooded by a flood with a current recurrence period of 100 years Kenya has known reserves and there are plans to mine them. However there is no information to date that indicates that storms will be increasing along this coast line.14
1990:0 2008:0
Oil and Gas 1. Share of offshore oil and gas installations likely to be hit by a storm of more than 70 m/s gusts within the next 20 years (%) Kenya does not have any installations currently.15
1990:0 2008:0
2. Share/number of refineries likely to be hit by a storm of more than 70m/s gusts within the next 20 years (%). There is currently no information to date that indicates that storms will be increasing in the areas where Kenya’s refineries are situated.16
1990:0 2008:0
All Fossil Fuels 1. Number of thermal (coal, oil and gas) power plants located at less than 1 metre above sea level and within the area that would be flooded by a flood with a current recurrence period of 100 years. All of the thermal power plants used for electricity generation are situated at more than 1 metre above sea level. Hence it is not anticipated that they would be affected by floods.17
1990:0 2008:0
HELIO International/Kenya 27
18 Ministry of Energy - http://www.energy.go.ke 19 Ministry of Energy - http://www.energy.go.ke 20 UNDP: climate change country profiles - http://country-profiles.geog.ox.ac.uk 21 KPLC– http://www.kplc.co.ke/displayPageInside.asp?level_three_title_id=48&top_level_id=2&level_two_title_id=12 22 Nile Equatorial Lakes Subsidiary Action Program - http://nelsap.nilebasin.org
Vulnerability Indicator
Calculation(s)
Nuclear 1. Number of nuclear power plants located at less than 1 metre above sea level and within the area that would be flooded by a flood with a current recurrence period of 100 years. 18 Kenya has no existing nuclear power plants. Any existing plans to initiate development of these plants, is at the Ministerial level and as such, there is no data on future plans.
1990:0 2008:0
2. Number of incidents/accidents since the plant was built.19 Kenya has no existing nuclear power plants.
1990:0 2008:0
Hydro 1. Expected precipitation change over next 20 – 50 years (%)and/or probability of floods in each watershed Studies have shown that rainfall in Kenya is expected to reduce, it is projected that there has been a 2.6% decrease in rainfall per decade between 1960 and 200620.
1990: 2.6% decrease per decade 2050: 15.6% decrease in precipitation.
2. Number of multiple-use dams in the country today --Volume of water (m3) of each dam
2b. Describe what % of the water is used for:
--Agriculture --Power --Drinking
Unable to determine water volume and different usage in the dams
0 0
Transmission and Distribution Indicators 1. Length of in-country, above-ground transmission and distribution lines (km)
--High (transmission ) --Middle + low voltage lines (distribution)
The National grid as an integrated network, linked by a 220 kV and 132 kV transmission network, 66 kV feeder lines around Nairobi, and a distribution network of 33 and 11 kV medium-voltage lines.21
--transnational lines The transnational line between Uganda and Kenya is currently 249km and is a 220kV transmission line22
30404Km 220kV and 132kV 33 - 66kV and 11kV 249km
HELIO International/Kenya 28
23 Kenya Power and Lighting Company- http://www.kplc.co.ke 24 Ministry of Energy - Economic Survey 2008,Central Bureau of Statistics 25 GVEP Kenya -http://mirror.undp.org/kenya/GVEPKenyaEnergyRoadmap.pdf 26 UNDP Country Profiles - http://country-profiles.geog.ox.ac.uk
Vulnerability Indicator
Calculation(s)
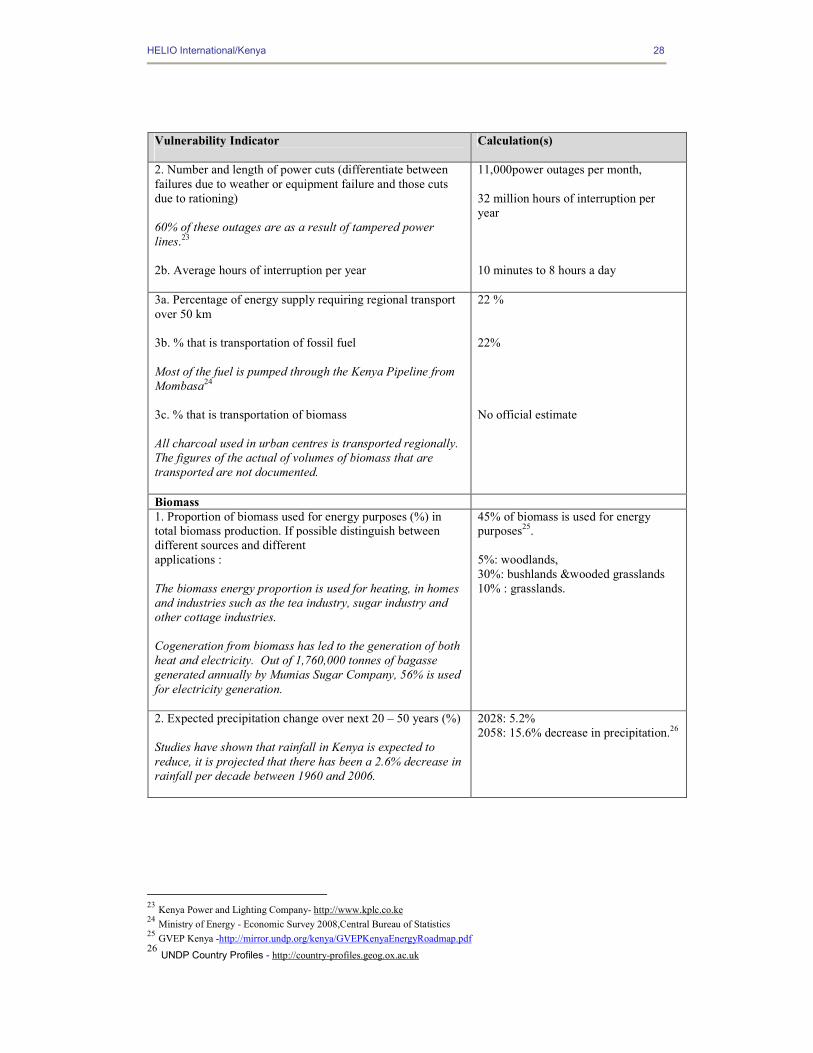
2. Number and length of power cuts (differentiate between failures due to weather or equipment failure and those cuts due to rationing) 60% of these outages are as a result of tampered power lines.23 2b. Average hours of interruption per year
11,000power outages per month, 32 million hours of interruption per year 10 minutes to 8 hours a day
3a. Percentage of energy supply requiring regional transport over 50 km 3b. % that is transportation of fossil fuel Most of the fuel is pumped through the Kenya Pipeline from Mombasa24 3c. % that is transportation of biomass All charcoal used in urban centres is transported regionally. The figures of the actual of volumes of biomass that are transported are not documented.
22 % 22% No official estimate
Biomass 1. Proportion of biomass used for energy purposes (%) in total biomass production. If possible distinguish between different sources and different applications : The biomass energy proportion is used for heating, in homes and industries such as the tea industry, sugar industry and other cottage industries. Cogeneration from biomass has led to the generation of both heat and electricity. Out of 1,760,000 tonnes of bagasse generated annually by Mumias Sugar Company, 56% is used for electricity generation.
45% of biomass is used for energy purposes25. 5%: woodlands, 30%: bushlands &wooded grasslands 10% : grasslands.
2. Expected precipitation change over next 20 – 50 years (%) Studies have shown that rainfall in Kenya is expected to reduce, it is projected that there has been a 2.6% decrease in rainfall per decade between 1960 and 2006.
2028: 5.2% 2058: 15.6% decrease in precipitation.26
HELIO International/Kenya 29
27 KenGen – http://www.kengen.co.ke 28 GVEP International -http://mirror.undp.org/kenya/GVEPKenyaEnergyRoadmap.pdf 29 Kenya’s Solar Energy Market Analysis- GTZ 2009 30 UNDP Country Profiles - http://country-profiles.geog.ox.ac.uk
Vulnerability Indicator Calculation(s)
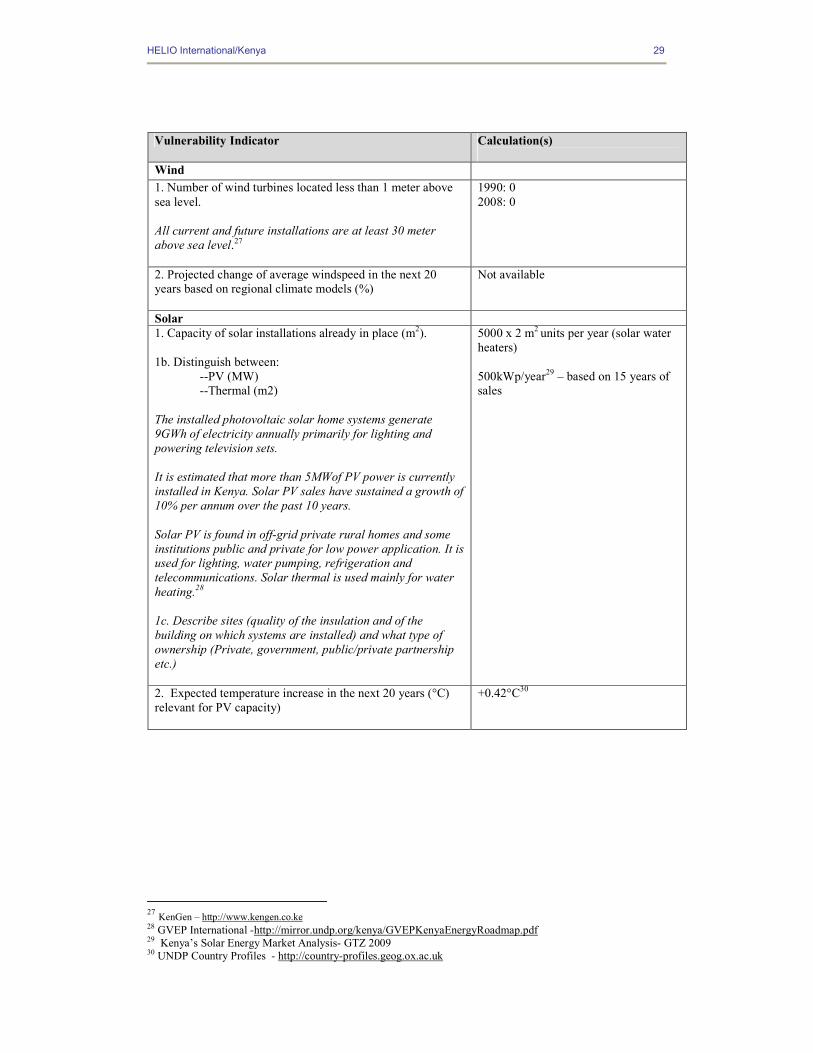
Wind 1. Number of wind turbines located less than 1 meter above sea level. All current and future installations are at least 30 meter above sea level.27
1990: 0 2008: 0
2. Projected change of average windspeed in the next 20 years based on regional climate models (%)
Not available
Solar 1. Capacity of solar installations already in place (m2). 1b. Distinguish between:
--PV (MW) --Thermal (m2)
The installed photovoltaic solar home systems generate 9GWh of electricity annually primarily for lighting and powering television sets. It is estimated that more than 5MWof PV power is currently installed in Kenya. Solar PV sales have sustained a growth of 10% per annum over the past 10 years. Solar PV is found in off-grid private rural homes and some institutions public and private for low power application. It is used for lighting, water pumping, refrigeration and telecommunications. Solar thermal is used mainly for water heating.28 1c. Describe sites (quality of the insulation and of the building on which systems are installed) and what type of ownership (Private, government, public/private partnership etc.)
5000 x 2 m2 units per year (solar water heaters) 500kWp/year29 – based on 15 years of sales
2. Expected temperature increase in the next 20 years (°C) relevant for PV capacity)
+0.42°C30
HELIO International/Kenya 30
Energy System Resilience Capacity Indicator
Indicator Calculation
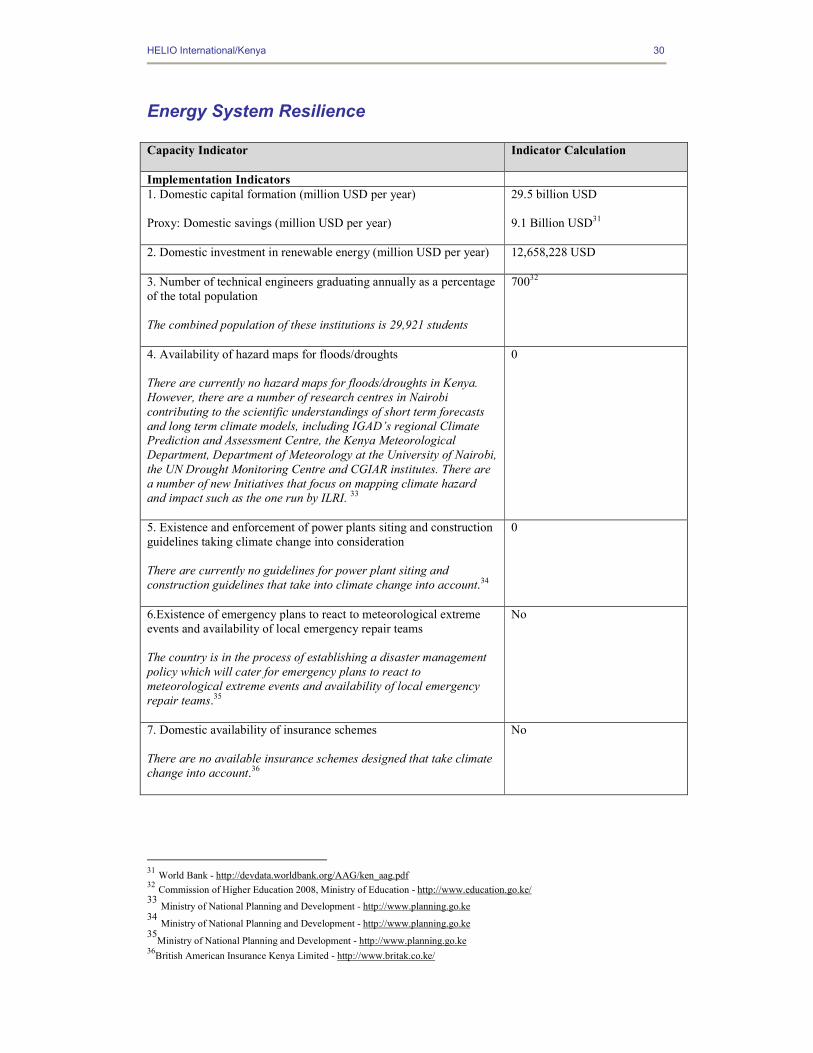
Implementation Indicators 1. Domestic capital formation (million USD per year) Proxy: Domestic savings (million USD per year)
29.5 billion USD 9.1 Billion USD31
2. Domestic investment in renewable energy (million USD per year)
12,658,228 USD
3. Number of technical engineers graduating annually as a percentage of the total population The combined population of these institutions is 29,921 students
70032
4. Availability of hazard maps for floods/droughts There are currently no hazard maps for floods/droughts in Kenya. However, there are a number of research centres in Nairobi contributing to the scientific understandings of short term forecasts and long term climate models, including IGAD’s regional Climate Prediction and Assessment Centre, the Kenya Meteorological Department, Department of Meteorology at the University of Nairobi, the UN Drought Monitoring Centre and CGIAR institutes. There are a number of new Initiatives that focus on mapping climate hazard and impact such as the one run by ILRI. 33
0
5. Existence and enforcement of power plants siting and construction guidelines taking climate change into consideration There are currently no guidelines for power plant siting and construction guidelines that take into climate change into account.34
0
6.Existence of emergency plans to react to meteorological extreme events and availability of local emergency repair teams The country is in the process of establishing a disaster management policy which will cater for emergency plans to react to meteorological extreme events and availability of local emergency repair teams.35
No
7. Domestic availability of insurance schemes There are no available insurance schemes designed that take climate change into account.36
No
31 World Bank - http://devdata.worldbank.org/AAG/ken_aag.pdf 32 Commission of Higher Education 2008, Ministry of Education - http://www.education.go.ke/ 33 Ministry of National Planning and Development - http://www.planning.go.ke 34 Ministry of National Planning and Development - http://www.planning.go.ke 35Ministry of National Planning and Development - http://www.planning.go.ke
36British American Insurance Kenya Limited - http://www.britak.co.ke/
HELIO International/Kenya 31
Capacity Indicator
Indicator Calculation
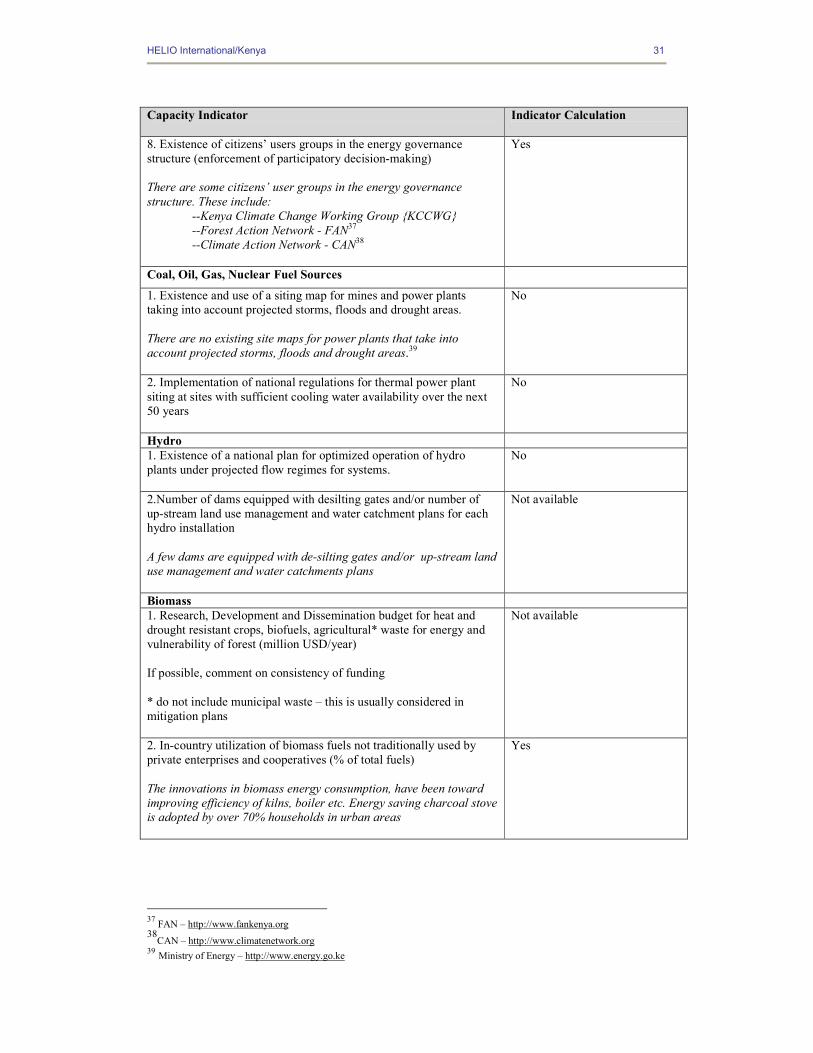
8. Existence of citizens’ users groups in the energy governance structure (enforcement of participatory decision-making) There are some citizens’ user groups in the energy governance structure. These include:
--Kenya Climate Change Working Group {KCCWG} --Forest Action Network - FAN37 --Climate Action Network - CAN38
Yes
Coal, Oil, Gas, Nuclear Fuel Sources
1. Existence and use of a siting map for mines and power plants taking into account projected storms, floods and drought areas. There are no existing site maps for power plants that take into account projected storms, floods and drought areas.39
No
2. Implementation of national regulations for thermal power plant siting at sites with sufficient cooling water availability over the next 50 years
No
Hydro 1. Existence of a national plan for optimized operation of hydro plants under projected flow regimes for systems.
No
2.Number of dams equipped with desilting gates and/or number of up-stream land use management and water catchment plans for each hydro installation A few dams are equipped with de-silting gates and/or up-stream land use management and water catchments plans
Not available
Biomass 1. Research, Development and Dissemination budget for heat and drought resistant crops, biofuels, agricultural* waste for energy and vulnerability of forest (million USD/year) If possible, comment on consistency of funding * do not include municipal waste – this is usually considered in mitigation plans
Not available
2. In-country utilization of biomass fuels not traditionally used by private enterprises and cooperatives (% of total fuels) The innovations in biomass energy consumption, have been toward improving efficiency of kilns, boiler etc. Energy saving charcoal stove is adopted by over 70% households in urban areas
Yes
37 FAN – http://www.fankenya.org 38CAN – http://www.climatenetwork.org
39 Ministry of Energy – http://www.energy.go.ke
HELIO International/Kenya 32
Capacity Indicator
Indicator Calculation
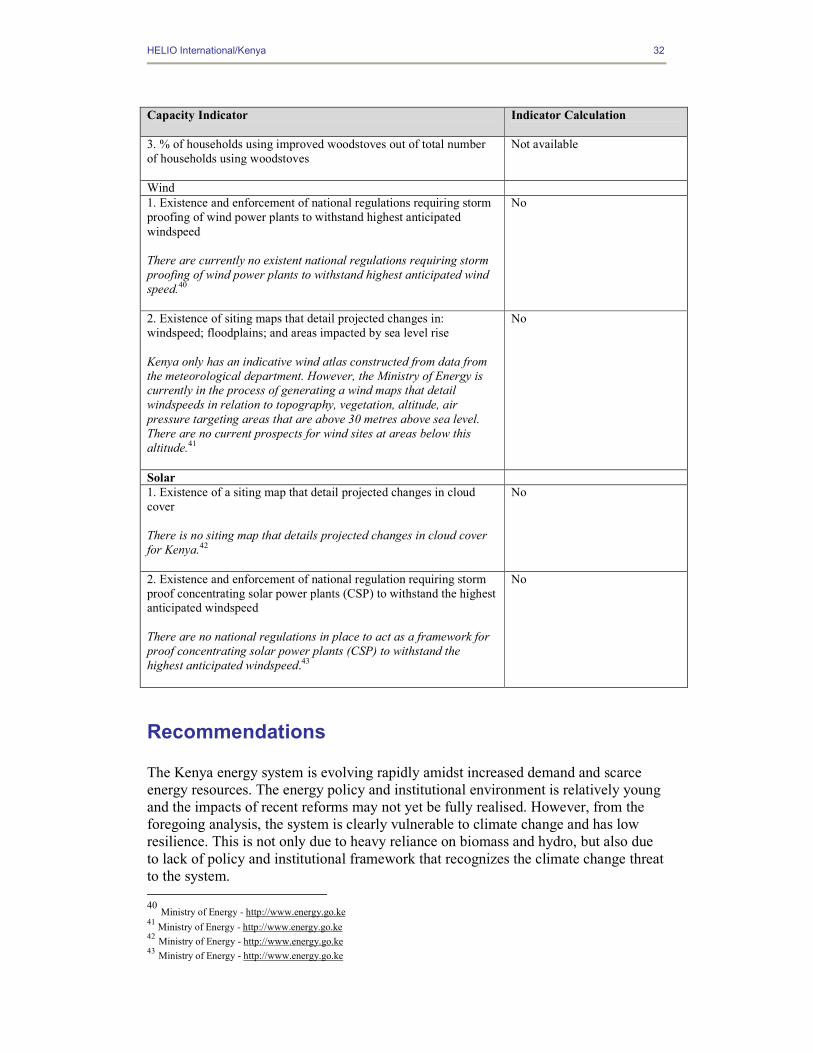
3. % of households using improved woodstoves out of total number of households using woodstoves
Not available
Wind 1. Existence and enforcement of national regulations requiring storm proofing of wind power plants to withstand highest anticipated windspeed There are currently no existent national regulations requiring storm proofing of wind power plants to withstand highest anticipated wind speed.40
No
2. Existence of siting maps that detail projected changes in: windspeed; floodplains; and areas impacted by sea level rise Kenya only has an indicative wind atlas constructed from data from the meteorological department. However, the Ministry of Energy is currently in the process of generating a wind maps that detail windspeeds in relation to topography, vegetation, altitude, air pressure targeting areas that are above 30 metres above sea level. There are no current prospects for wind sites at areas below this altitude.41
No
Solar 1. Existence of a siting map that detail projected changes in cloud cover There is no siting map that details projected changes in cloud cover for Kenya.42
No
2. Existence and enforcement of national regulation requiring storm proof concentrating solar power plants (CSP) to withstand the highest anticipated windspeed There are no national regulations in place to act as a framework for proof concentrating solar power plants (CSP) to withstand the highest anticipated windspeed.43
No
Recommendations The Kenya energy system is evolving rapidly amidst increased demand and scarce energy resources. The energy policy and institutional environment is relatively young and the impacts of recent reforms may not yet be fully realised. However, from the foregoing analysis, the system is clearly vulnerable to climate change and has low resilience. This is not only due to heavy reliance on biomass and hydro, but also due to lack of policy and institutional framework that recognizes the climate change threat to the system. 40 Ministry of Energy - http://www.energy.go.ke 41 Ministry of Energy - http://www.energy.go.ke 42 Ministry of Energy - http://www.energy.go.ke 43 Ministry of Energy - http://www.energy.go.ke
HELIO International/Kenya 33
The following recommendations are made with the aim of linking the energy system to climate change in the context of reducing vulnerability and improving resilience.
Strategies to Increase Energy System Resilience It is clear that hydro and biomass are the main sources of energy for the country. They are also the most vulnerable to climate change impacts and with the least resilience. Furthermore, the hydro sources are concentrated in one river basin causing major fluctuations in the power supple in the event of depressed rainfall in the region. The following recommendations are therefore made. 1. Need to diversify energy sources and reduce over-reliance on hydro and biomass
resources. 2. Develop mini-grids and mini-hydro power sources in diversified river basins, in
order to reduce reliance on the seven forks dams which account for over 50% of the current hydro power capacity.
3. Increase use of solar PV in off-grid facilities.
4. Look into new solar applications such as concentrated solar thermal technology
for power generation. 5. Promote use of solar energy for heating purposes to reduce consumption of
electricity or biomass for the same purposes. 6. Develop wind resources for power generation:
i. increase the number of wind power stations in the country; and, ii. develop and establish renewable energy fund to assist local companies
invest in wind, solar and other renewable energy. 7. Promote greater use of agricultural and wood waste as biomass for energy –
including bagasse, saw dust, coffee and rice husks. This will require investment in combustion research, co-generation, carbonization, and briquetting.
8. Implement the revised forestry act to promote sustainable biomass development
and exploitation. 9. Integrate climate proofing into new energy development plans – including
transmission and transport. 10. Increase energy efficiency and conservation as a mitigation measure.
HELIO International/Kenya 34
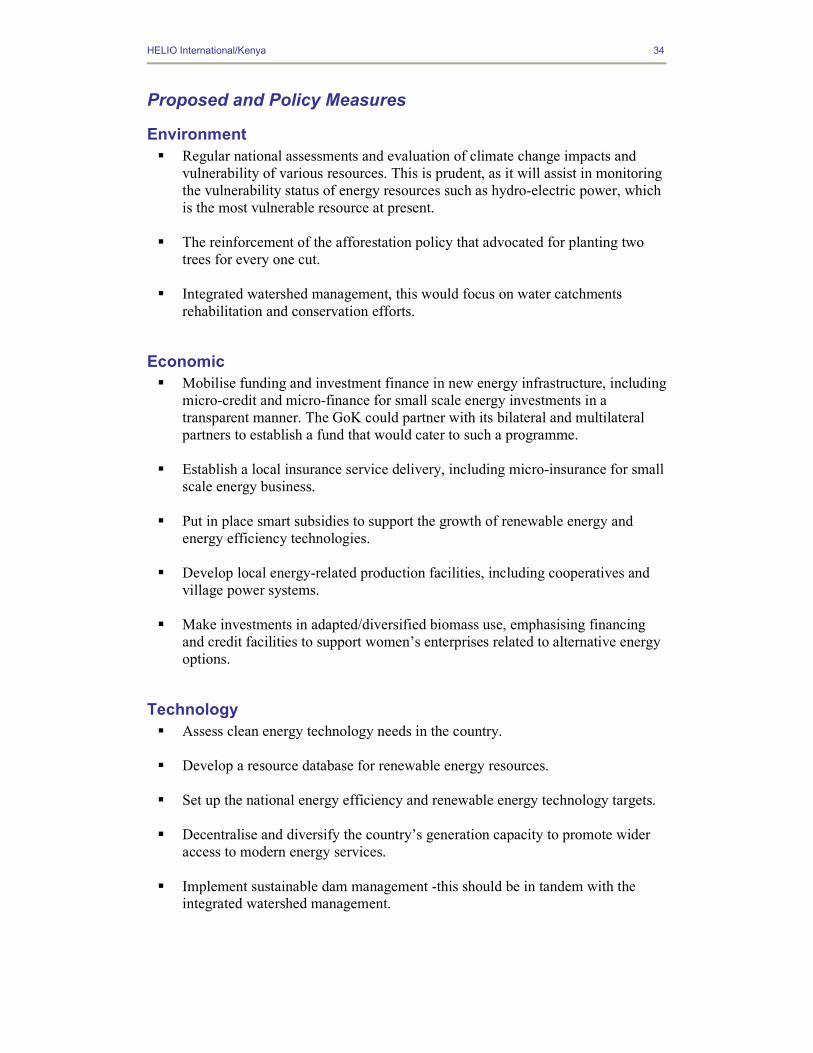
Proposed and Policy Measures
Environment � Regular national assessments and evaluation of climate change impacts and
vulnerability of various resources. This is prudent, as it will assist in monitoring the vulnerability status of energy resources such as hydro-electric power, which is the most vulnerable resource at present.
� The reinforcement of the afforestation policy that advocated for planting two
trees for every one cut. � Integrated watershed management, this would focus on water catchments
rehabilitation and conservation efforts.
Economic � Mobilise funding and investment finance in new energy infrastructure, including
micro-credit and micro-finance for small scale energy investments in a transparent manner. The GoK could partner with its bilateral and multilateral partners to establish a fund that would cater to such a programme.
� Establish a local insurance service delivery, including micro-insurance for small
scale energy business. � Put in place smart subsidies to support the growth of renewable energy and
energy efficiency technologies. � Develop local energy-related production facilities, including cooperatives and
village power systems. � Make investments in adapted/diversified biomass use, emphasising financing
and credit facilities to support women’s enterprises related to alternative energy options.
Technology � Assess clean energy technology needs in the country.
� Develop a resource database for renewable energy resources.
� Set up the national energy efficiency and renewable energy technology targets.
� Decentralise and diversify the country’s generation capacity to promote wider
access to modern energy services. � Implement sustainable dam management -this should be in tandem with the
integrated watershed management.
HELIO International/Kenya 35
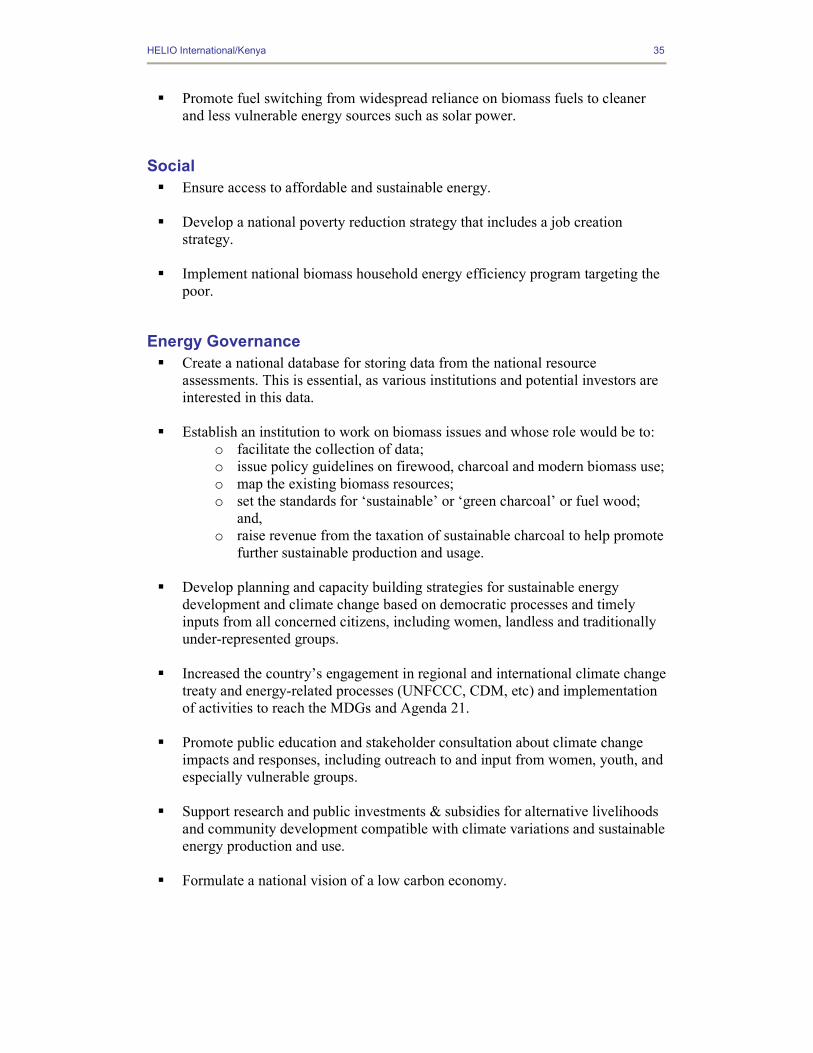
� Promote fuel switching from widespread reliance on biomass fuels to cleaner and less vulnerable energy sources such as solar power.
Social � Ensure access to affordable and sustainable energy.
� Develop a national poverty reduction strategy that includes a job creation
strategy. � Implement national biomass household energy efficiency program targeting the
poor.
Energy Governance � Create a national database for storing data from the national resource
assessments. This is essential, as various institutions and potential investors are interested in this data.
� Establish an institution to work on biomass issues and whose role would be to:
o facilitate the collection of data; o issue policy guidelines on firewood, charcoal and modern biomass use; o map the existing biomass resources; o set the standards for ‘sustainable’ or ‘green charcoal’ or fuel wood;
and, o raise revenue from the taxation of sustainable charcoal to help promote
further sustainable production and usage. � Develop planning and capacity building strategies for sustainable energy
development and climate change based on democratic processes and timely inputs from all concerned citizens, including women, landless and traditionally under-represented groups.
� Increased the country’s engagement in regional and international climate change
treaty and energy-related processes (UNFCCC, CDM, etc) and implementation of activities to reach the MDGs and Agenda 21.
� Promote public education and stakeholder consultation about climate change
impacts and responses, including outreach to and input from women, youth, and especially vulnerable groups.
� Support research and public investments & subsidies for alternative livelihoods
and community development compatible with climate variations and sustainable energy production and use.
� Formulate a national vision of a low carbon economy.
HELIO International/Kenya 36
Bibliography 1. Daily Nation (March 10, 2009) ‘Tender; Wind of change blows in energy
sector’. 2. Daily Nation (March 10, 2009) ‘Order on minimum stocks fuels anxiety in oil
industry’. 3. Daily Nation (March 1, 2009) ‘Policy on renewable energy spurs huge investor
interest’. 4. Economic and Social Affairs (2005-2010).United Nations Development
Programme, Available: https://www.esa.un.org/undp/P2KOdata.a.sp 5. Eriksen, S. et 9al 2005). The politics of adaptation to climate stress: household
responses to drought and conflict in Kitui and Turkana Districts in Kenya. Draft. 6. Electoral Commission of Kenya (2008). Economic Survey 2008 pp.252. 7. Export Processing Zone (2005). Meat Production in Kenya. 8. Government of Kenya, undated Kenya Second National Communication to
UNFCCC-NEMA, GoK. 9. Government of Kenya, undated Climate Change impacts/vulnerability
assessments and adaptation options NEMA, GoK. 10. GVEP Report (2006).Energy Road Map to Achieving MDG Targets Kenya
Sectoral Energy Requirements. 11. ICPAC (November, 2005). Climate Outlook for December 2005. USAID,
NOAA, WMO, IGAD. 12. Karanja, F.K. et al undated. Reducing the impact of environmental emergencies
through early warning and preparedness – the case of the El Nino-southern oscillation (ENSO) Kenya case study Project UoN/ICPAC.
13. Karanja, F.K., Hewitson, B. and Tadross, M. undated, Climate change scenarios
and vulnerability assessments for selected countries in eastern and southern Africa. Paper No.
14. Kenya Meteorological Department, 2006. The Prevailing Drought and Expected
Conditions in January and February. Press Release. 15. Kenya National Bureau of Statistics (2008). Economic Survey 2008. 16. Kenya National Bureau of Statistics (2008). Kenya Facts and Figures 2008. 17. Kenya Power and Lighting Comp: www.kplc.co.ke
HELIO International/Kenya 37
18. Kenya Power and Lighting Company (2008). Economic Survey 2008. 19. Kituyi, E. undated draft .Climate change adaptation and emerging challenges for
African institutions. Presented at COP11. 20. Human Development Report (2008). UNDP, Available:
http://hdrstats.undp.org/countries/country_fact_sheets/cty_fs_KEN.html 21. Maingi J.K. and Marsh, S.E. 2002. Quantifying hydrologic impacts following
dam construction along the Tana River, Kenya. Journal of Arid Environments, 50 (1); 53-79.
22. Michaelowa, A., Connor, H and Williamson, L.E. 2009. Indicators as a way of
Improving Communication on Energy Systems Vulnerability, Resilience and Adaptation to Climate Change. Science for Peace and Security Series C: Environmental Security - Weather/Climate Risk Management for the Energy Sector.
23. Ministry of Energy (2006). Energy Policy. 24. Muchemi, S.W. undated. Adaptation lessons learnt in Kenya on climate
variability and change. KMD. 25. Muchemi, S. RANET: initiative in dissemination of climate information
Presentation. 26. MWH, Kenya country study (2006).Linking Climate Change Adaptation to
Disaster Risk Management for sustainable poverty reduction. 27. MWH, Kenya country study (2006).Linking Climate Change Adaptation to
Disaster Risk Management for sustainable poverty reduction. 28. National Electrification Coverage Planning, (2007): Investment Costing
Estimation Model. World Bank and Columbia Earth Institute. 29. NEMA 2005 Presentation at UNFCCC Adaptation Side Event COP11 Montreal
Emily Ojoo-Massawa Coping with Drought and Climate Change in Kenya GEF Project.
30. Ochieng Rapuro (2008).Adaptation is predicting Malaria’s changing course,
Available: http://www.idrc.ca/en/ev-118958-201-1-DO_TOPIC.html (Accessed: February,25,2009).
31. Orindi, V.A. and Murray, L.A. (2005). Adapting to climate change in East
Africa: a strategic approach. IIED GateKeeper Series 117. 32. UNEP (2006). Global Environmental Outlook, Available:
http://www.unep.org/geo/yearbook/yb2006/009.asp (Accessed: March, 12, 2009).
HELIO International/Kenya 38
33. UNEP (2003) UNEP Access - Energy Access Approach Paper-East Africa.
Stephen Karekezi and John Kimani. African Energy Policy Research Network 34. UNDP country profiles. Available: http://country-profiles.geog.ox.ac.uk
(Accessed: February, 25, 2009). 35. UNDP Kenya climate profile- C. McSweeney1, M. New1,2 and G. Lizcano - http://country-
profiles.geog.ox.ac.uk 36. World Development Indicators (2008): Poverty data. World Bank.
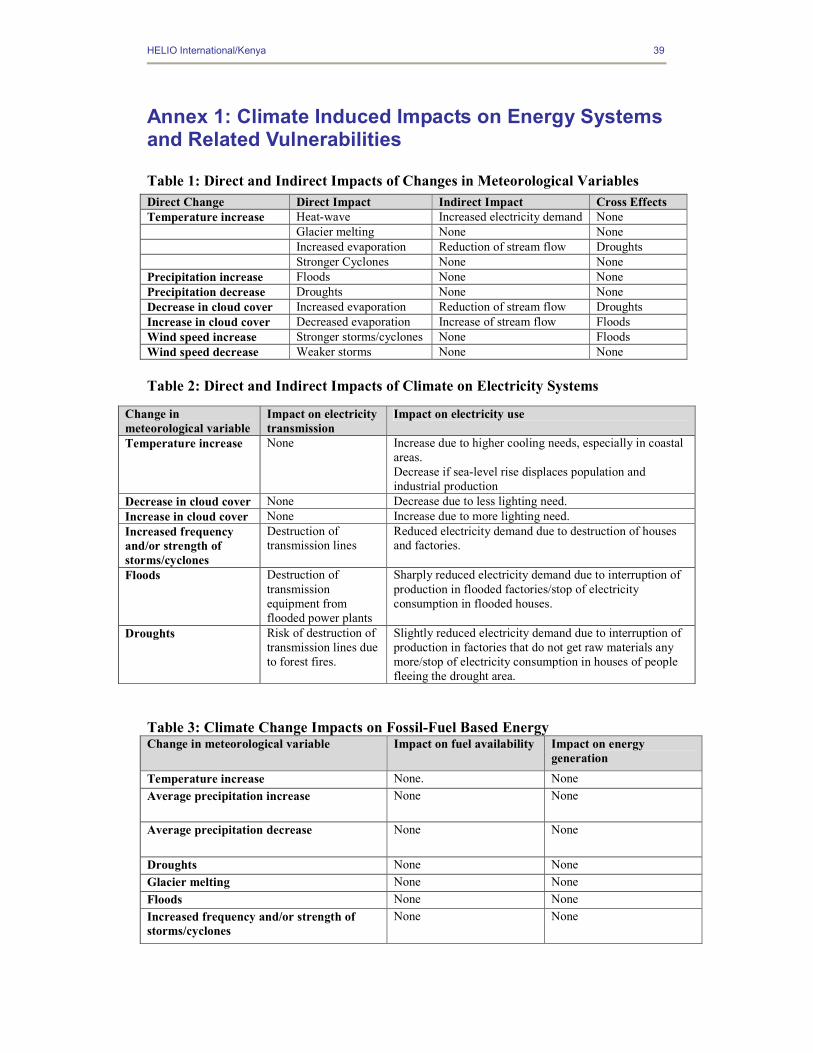
HELIO International/Kenya 39
Annex 1: Climate Induced Impacts on Energy Systems and Related Vulnerabilities Table 1: Direct and Indirect Impacts of Changes in Meteorological Variables
Table 2: Direct and Indirect Impacts of Climate on Electricity Systems
Table 3: Climate Change Impacts on Fossil-Fuel Based Energy Change in meteorological variable Impact on fuel availability Impact on energy
generation
Temperature increase None. None Average precipitation increase None None
Average precipitation decrease None None
Droughts None None Glacier melting None None Floods None None Increased frequency and/or strength of storms/cyclones
None None
Direct Change Direct Impact Indirect Impact Cross Effects Temperature increase Heat-wave Increased electricity demand None Glacier melting None None Increased evaporation Reduction of stream flow Droughts Stronger Cyclones None None Precipitation increase Floods None None Precipitation decrease Droughts None None Decrease in cloud cover Increased evaporation Reduction of stream flow Droughts Increase in cloud cover Decreased evaporation Increase of stream flow Floods Wind speed increase Stronger storms/cyclones None Floods Wind speed decrease Weaker storms None None
Change in meteorological variable
Impact on electricity transmission
Impact on electricity use
Temperature increase None Increase due to higher cooling needs, especially in coastal areas. Decrease if sea-level rise displaces population and industrial production
Decrease in cloud cover None Decrease due to less lighting need. Increase in cloud cover None Increase due to more lighting need. Increased frequency and/or strength of storms/cyclones
Destruction of transmission lines
Reduced electricity demand due to destruction of houses and factories.
Floods Destruction of transmission equipment from flooded power plants
Sharply reduced electricity demand due to interruption of production in flooded factories/stop of electricity consumption in flooded houses.
Droughts Risk of destruction of transmission lines due to forest fires.
Slightly reduced electricity demand due to interruption of production in factories that do not get raw materials any more/stop of electricity consumption in houses of people fleeing the drought area.
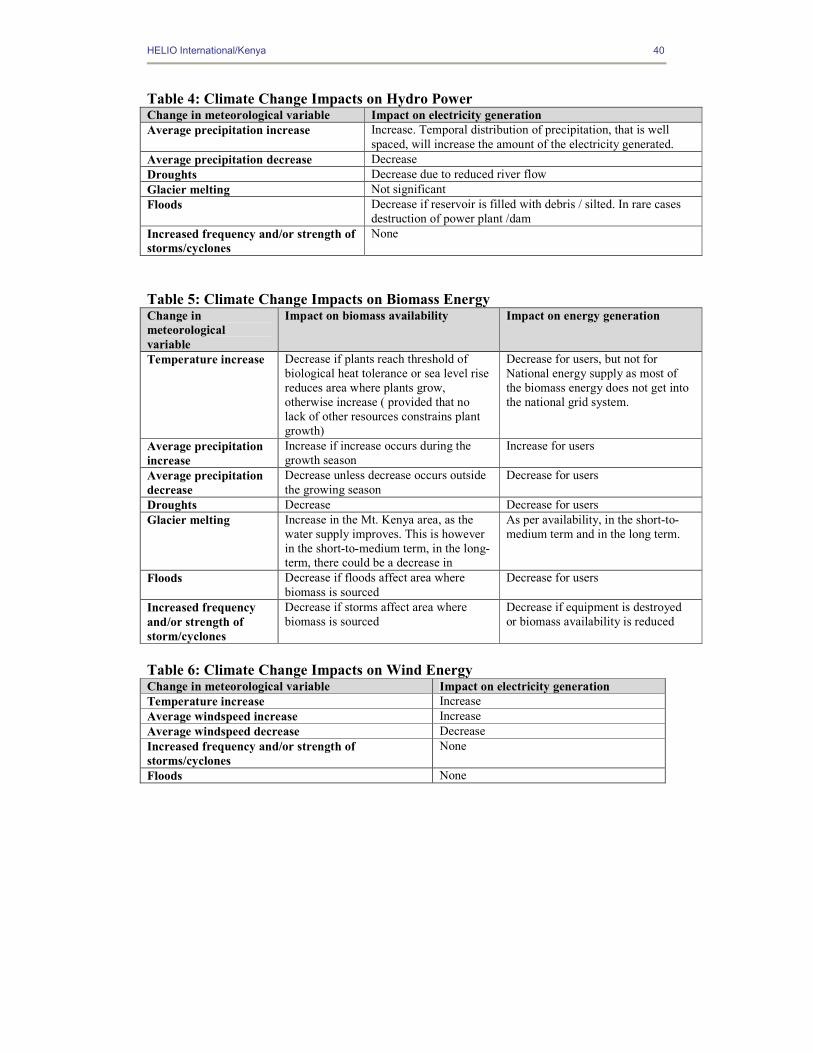
HELIO International/Kenya 40
Table 4: Climate Change Impacts on Hydro Power Change in meteorological variable Impact on electricity generation Average precipitation increase Increase. Temporal distribution of precipitation, that is well
spaced, will increase the amount of the electricity generated. Average precipitation decrease Decrease Droughts Decrease due to reduced river flow Glacier melting Not significant Floods Decrease if reservoir is filled with debris / silted. In rare cases
destruction of power plant /dam Increased frequency and/or strength of storms/cyclones
None
Table 5: Climate Change Impacts on Biomass Energy Change in meteorological variable
Impact on biomass availability Impact on energy generation
Temperature increase Decrease if plants reach threshold of biological heat tolerance or sea level rise reduces area where plants grow, otherwise increase ( provided that no lack of other resources constrains plant growth)
Decrease for users, but not for National energy supply as most of the biomass energy does not get into the national grid system.
Average precipitation increase
Increase if increase occurs during the growth season
Increase for users
Average precipitation decrease
Decrease unless decrease occurs outside the growing season
Decrease for users
Droughts Decrease Decrease for users Glacier melting Increase in the Mt. Kenya area, as the
water supply improves. This is however in the short-to-medium term, in the long-term, there could be a decrease in
As per availability, in the short-to-medium term and in the long term.
Floods Decrease if floods affect area where biomass is sourced
Decrease for users
Increased frequency and/or strength of storm/cyclones
Decrease if storms affect area where biomass is sourced
Decrease if equipment is destroyed or biomass availability is reduced
Table 6: Climate Change Impacts on Wind Energy Change in meteorological variable Impact on electricity generation Temperature increase Increase Average windspeed increase Increase Average windspeed decrease Decrease Increased frequency and/or strength of storms/cyclones
None
Floods None
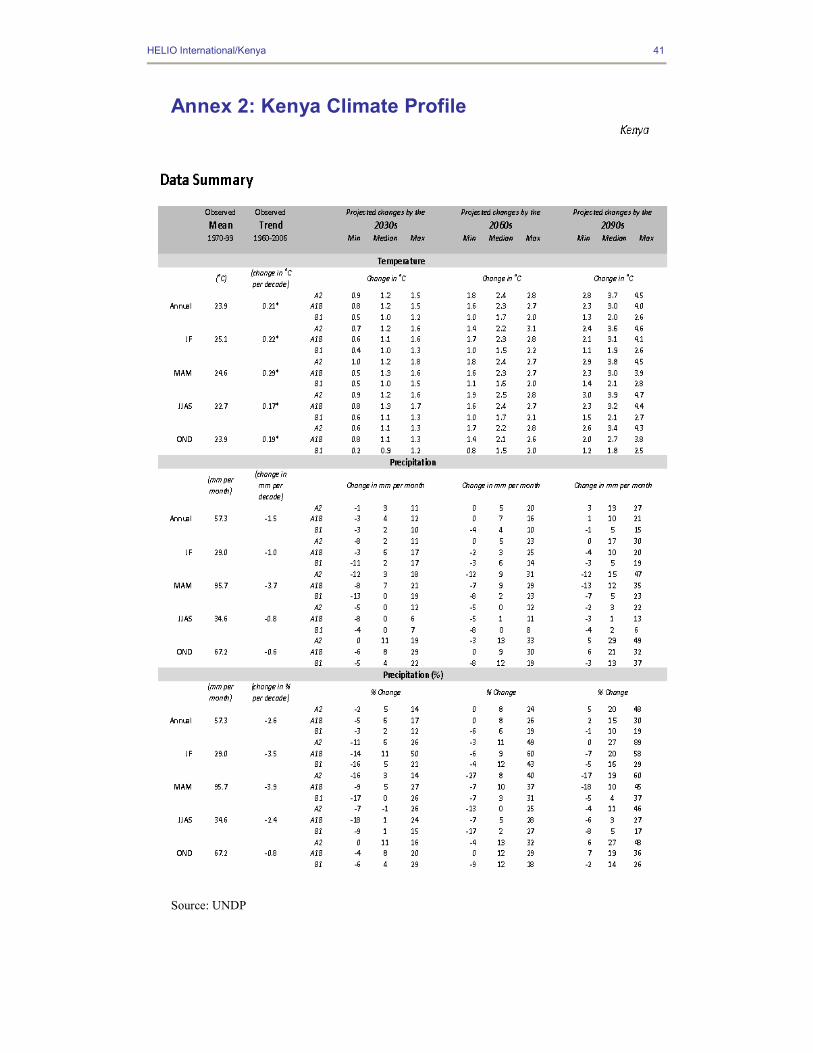
HELIO International/Kenya 41
Source: UNDP
Annex 2: Kenya Climate Profile