Embed Size (px)
Citation preview

Kentucky State University
Fact Book
2013-2014

Fact Book 2013-2014
Kentucky State University
At A Glance

At A Glance
Total Applied 7,365 ↑ Total Enrollment 2,533 ↑ Total Degrees 301 ↓Total Admitted 3,096 ↑ Undergraduate 2,370 ↑ Associate 45 ↓Total Enrolled 950 ↑ Graduate 163 ↓ Bachelor 206 ↓
Full‐Time 1,887 ↓ Master's 50 ↓Part‐Time 646 ↑
Percent Live In Dorms 31% ↓ Female 1,493 ↑Percent Accepted Any Aid 77% ↓ Male 1,040 ↓ Total Employee 623 ↓Retention Rate 52% ↑ Black, Non Hispanic 1,412 ↑ Faculty 184 ↑Graduation Rate 18% ↑ White, Non Hispanic 667 ↑ Instructional Faculty 162 ↓
Other Races 454 ↓ Staff 439 ↓In‐State 1,501 ↑ Full‐Time 524 ↓
First‐Time Freshmen 537 ↑ Out‐of‐State 1,032 ↓ Part‐Time 99 ↑First‐Time Transfer 173 ↓ Freshmen 848 ↑ Female 313 ↓Average ACT Comp 18 ↑ Sophomores 404 ↓ Male 310 ↓Average SAT Total 805 ↑ Juniors 368 ↓ Black, Non Hispanic 292 ↓
Seniors 511 ↑ White, Non Hispanic 262 ↑Master's 154 ↓ Other Races 69 ↑
Total Unduplicated Enrollment 3,185 ↓ Non Degree 248 ↑ Tenured Faculty 71 ↓Undergraduate 2,983 ↓ Age 24 and younger 1,914 ↑ Tenure Track Faculty 41 ↓Graduate 202 ↓ Age 25 and older 612 ↓ Non Tenured Faculty 72 ↑
Note:↑ Increased from last year ↓ Decreased from last year — No change from last year
First‐Time Enrollment
Employee
Unduplicated Enrollment (Summer‐Fall‐Spring)
Degrees Awarded Fall Enrollment Undergraduate Admission
Fall Student Characteristics
Office of Institutional Research Effectiveness
Fact Book 2013-2014
Kentucky State University
Campus

Campus
Campus Location
Kentucky State University (KSU) is located in Frankfort, the capital city of Kentucky. Frankfort is located astride a double curve in the Kentucky River in the
central portion of the state and is known for having one of the most beautiful buildings in the country. The city is located 54 miles east of Louisville and 29
miles west of Lexington. In 2009, according to the U.S. Census Bureau, Kentucky’s population was 4,269,245 and Frankfort’s population was 27,322.
KSU is truly unique among the state’s public universities. Now well into its 125 years of educational service to Kentucky and the nation, KSU continuously
seeks to become an even more vital educational entity and to achieve as a liberal studies institution that is second to none. KSU is located on 400 East Main
Street, was founded in 1886. Listed on the National Register are Hume and Jackson Halls, the latter with a public art gallery. Jackson Hall is home to the
Center of Excellence for the Study of African Americans, which hosts several exhibits each year.
Office of Institutional Research and Effectiveness

Campus
Main Campus Map
1 Academic Annex
2 Alumni House
10 Atwood Agric.Research Facility
12 Bell Health & Physical Ed. Bldg
13 Betty White Health Center
14 Blazer Library
15 Bradford Hall
16 Carroll Academic Service Building
17 Carver Hall
19 Chandler Hall
20 Combs Hall
21 Chappell Community Ed. Center
22 Cooperative Extension Building
23 Hathaway Hall
24 Hill Student Center
26 Hume Hall
27 Hunter Hall
28 Jackson Hall
29 Jones Field House
31 Jordan Maintenance & Warehouse Bldg
32 Kentucky Hall
33 McCullin Hall
37 Rosenwald Ctr for Fam. & Children
39 Shauntee Hall
40 The Halls
42 William Exum Center
43 Whitney M. Young Hall
44 QEP Building
46 Amphitheater
Office of Institutional Research and Effectiveness

Campus
South Campus Map
3 Alumni Stadium Grandstand
4 Alumni Stadium Athletic Facility
5 Aquaculture Hatchery Building
6 Aquaculture Classroom Building
7 Aquaculture Nutrition Laboratory
8 Aquaculture Pole Barn Office Bldg
9 Aquaculture Prod Technology Lab
25 Hilcrest (President's House)
38 Russell Court Apartments
45 Alumni Stadium Competition Field
47 Aquaculture Research Lagoons
48 Baseball
53 Football Practice Field
54 Historic Spring House
55 Tennis Courts
57 Track and Field Complex
60 Cross Campus Walk
Office of Institutional Research and Effectiveness

Campus
Research Farm Map
90 The Center for Sustainability of Farms
& Families
91 Farm Administrative Office/Tornado
Shelter
92 Research Greenhouses
93 Barns
94 Tornado Shelter
95 Stock Ponds
96 Pastures
97 Organic/Bt/Conventional Systems
Comparison
98 Apiary
99 Grapes Vineyard
## Organic Transitional Land
## Pawpaw Orchard
## Berries
## Runoff plots
Office of Institutional Research and Effectiveness

Campus
Land Holdings and Buildings
Land Holdings Acres
Main Campus 311.803
University Farm 296.574
Envir. Ed. Ctr. 306
Total Acres 914.377
Building Name Year Built Building Name Year Built Building Name Year Built
Soils & Lab Office 1986 Jordan Maint Bldg 1969 Amphitheater 1989
Agriculture Greenhouse 1986 Hathaway Hall 1967 Fish Hatchery Building 1984
Hume Hall 1909 Shauntee Hall 1971 Pole Barn/Aquaculture 1986
Atwood Ag Research 1935 W Dugout-Baseball Field 1978 Aquaculture Classroom 2004
Jackson Hall 1887 Hill Student Center 1971 Motorpool 1995
Blazer Library 1958 Hillcrest 1972 Chappell Community Ed Center 1999
McCullin Hall 1949 White Health Center 1971 Rosenwald Center For Families 2011
Jordan Shop/Warehouse 1939 Jonesfield House 1971 And Children
Cross Walk Tunnel -- E Dugout-Baseball Field 1978 Aquaculture Prod Tech Lab 2011
Carver Hall/Annex 1952 Press Building 1978 Maryland Warehouse 2010
Coop Ext Prog Facility 1993 Restroom/Storage Bldg 1978 Shop Barn/On Farm 1986
Nutrition Laboratory 1993 Whitney M. Young Jr. 2008 Silo 1986
Kentucky Hall 1929 QEP House 2009 Cattle Feed Shed/Auger 1986
Chandler Hall 1939 Academic Annex 1976 Aquaculture Ct. Shed 1986
Alumni House 1961 Boiler Plant Addn 1977 Corn Crib 1986
Combs Hall 1964 Alumni Stadium Dress Rm Bldg 1978 MPU Docking Station 2003
Hunter Hall 1964 Alumni Stadium 1978 Hay Storage Barn 2006
Rosenwald Building 1954 Old Federal Building 2009 Poultry Building 2007
Bradford Hall 1965 Barn 2009 Cafetaria Bldg 1985
Bell Health Building 1962 Chilled Water Plant 1981 Hill Student Ctr Add 2 2003
Russell Fac Apts 1967 Academic Service Building 1981 Center For Sustainability For- 2010
The Halls 1967 William Exum Center 1994 Farms And Families
Office of Institutional Research and Effectiveness
Fact Book 2013-2014
Kentucky State University
Library
Library
Paul G. Blazer Library
Blazer Library’s collection of more than 600,000 items includes extensive reference, periodical and circulating collections of materials such as books, videos,
microforms, sound recordings and others, to aid students in their course work and research. The university community is also encouraged to use Blazer
Library for personal enrichment and leisure reading.
The second floor of the library houses the Special Collections and the University Archives, which contain rare and historical documents and publications
relating to African American culture and history, Black Kentuckians, and University history.
The Education Lab on the ground floor, provide education curriculum materials for grades preschool through 12.
Blazer Library is a selective depository for United States Government Document Publications and houses a collection of federal and state documents.
Needed materials not available in the Library can be obtained via Inter Library Loan. Photocopy facilities are also available for student use.
Professional librarians and support personnel are available to assist students in using the library’s resources and facilities. Library information may be
obtained by asking library staff or by consulting the Library Handbook, available at any of the service desks throughout the library. Special library tours or
individualized instruction may be scheduled by contacting the Reference Desk.
Mission Statement
To support the information needs of the Kentucky State University community. Included in this goal is a commitment to promote student success by
enhancing information access and retrieval through technology, strengthening collections in support of the curricula for the University’s programs, and
assisting faculty in their quest for excellence in teaching, scholarship and service.
Office of Institutional Research and Effectiveness

Library
Blazer Library Collection Holdings
5-Year
2009 2010 2011 2012 2013 Change
Volumes (all printed materials) 452,246 469,289 472,468 345,014 346,399 -23.4%
Audio/Video/CDs/DVDs 5,469 7,017 7,160 4,867 4,888 -10.6%
Periodicals (include current paper titles, electronic, & others) 41,309 922 33,536 785 418 -99.0%
Microforms 328,101 328,458 328,449 328,575 328,572 0.1%
Ebook Collection (monographic, number of title) 20,088 20,199 20,145 23,426 23,412 16.5%
Total Library Holdings 847,213 825,885 861,758 702,667 703,689 -16.9%
* Based on data compiled for the ACRL Academic Library Survey-- to be submitted late April 2014subscriptions
**As supplemental information, the Library’s all-inclusive online access for journals (which includes the databases and open access titles) is 36,224 unique titles
(based on: Cox Journal Finder as of 4/18/2014)
As of April 24, 2014:
Office of Institutional Research and Effectiveness

Fact Book 2013-2014
Kentucky State University
Administration

Administration
Institution Name: Kentucky State University
Established: 1886
President: Dr. Mary Evans Sias
Address: 400 East Main Street, Frankfort, KY 40601
Telephone: (502) 597-6000
Institution Type: 4-year Public
Website: www.kysu.edu
Vision
Kentucky State University prepares today’s students as global citizens, lifelong learners and problem solvers.
To accomplish this, Kentucky State University must challenge itself and its students to be the best. It must recognize its strengths, expand and excel.
Notwithstanding, it must also welcome change and quality improvement. By doing so, KSU will gain widespread recognition as one of the region’s
strongest universities. As a university of distinction, Kentucky State University will create an environment where:
Students are first Students are taught how to obtain, evaluate and use information
Diversity is valued, understood and respected
Diverse, motivated and talented students, staff and faculty are actively recruited and retained
An intellectual environment conducive to leadership in teaching, research and community service is encouraged and supported
Effective teaching is promoted both inside and outside the classroom Effective and efficient fiscal management by the administration is the norm
Learning is lifelong
Collegiality is the norm, not the exception
Each person is a change agent
Excellence starts with me
Mission
Kentucky State University, building on its legacy of achievement as a historically black, liberal arts, and 1890 land-grant university, affords access
to and prepares a diverse student population of traditional and non-traditional students to compete in a multifaced, ever-changing global society
by providing student-centered learning while integrating teaching, research, and service through high•]quality undergraduate and select graduate
programs. Kentucky State University is committed to keeping relevant its legacy of service by proactively engaging the community in partnerships
on civic projects driven by the objective of positively impacting the quality of life of the citizens on the Commonwealth.
Office of Institutional Research and Effectiveness

Administration
Board of Regents
Attorney Ekumene M. Lysonge
Mr. Charles Whitehead
Mrs. Phyllis Williams
Dr. Karen Bearden, Chair
Atty. Mindy Barfield
Dr. Syamala H. K. Reddy
Mr. Travis E. Haskins, Staff Regent
Mr. Julian Jeter-Davis, Student Regent
Dr. Elgie McFayden, Faculty Regent
Atty. David J. Guarnieri
Dr. Lavaughn Henry
Office of Institutional Research and Effectiveness

Administration
Cabinet
Dr. Mary Evans Sias, President
Mr. Stephen A. Mason, Chief of Staff/Executive Assistant to the President
Dr. Lorenzo Esters, Vice President for Student Success and Enrollment Management
Mr. Hinfred McDuffie, Executive Vice President for Administration, External Relations and Development
Dr. Beverly Downing, Interim Provost/Vice President for Academic Affairs
Ms. Anita Lockridge, Vice President/CFO for Finance and Business Affairs
Attorney Lori Davis, General Counsel
Office of Institutional Research and Effectiveness

Administration
President's Senior Staff
Vacant, Director of Capital Planning and Construction
Mr. Harold Hayes, Director of Auxiliary Services
Vacant, Associate Provost, Academic Affairs
Dr. Denisha Hendricks, Director of Athletics
Dr. Mary Spor, Director, Grants & Sponsored Research
Donna Covington, Interim Dean, College of Business and Computer Science
Vacant, Assistant Vice President, Retention Management & Advising Affairs
Mr. William H. Wilson, Associate Vice President for Development and Major Gifts
Vacant, Director, Compliance & Risk Management/Interim Assistant VP, International Affairs/Director, Global Education
Dr. Teferi Tsegaye, Dean, College of Agriculture, Food Sciences and Sustainable Systems/Director of Land Grant
Vacant, Assistant Vice President, Student Engagement & Leadership Development
Ms. Felicia Lewis, Assistant Vice President of Communications & Publications
Dr. Vernell Bennett, Assistant Vice President for , Inclustion and Innovation
Ms. Deborah Martin, Associate Vice President of Business Operations
Ms. Ann Knotts, Director of Budget, Policy and Planning
Mr. James Berry, Director, University Safety and Security Affairs
Dr. Antonio Boyle, Associate Vice President of Enrollment Services
Mr. Eric Bergquist, Chief Information Officer
Dr. Sam Oleka, Dean, College of Arts & Sciences
Mr. Gary Meiseles, Director of Human Resources
Dr. Gashaw Lake, Dean, College of Professional Studies
Office of Institutional Research and Effectiveness

Fact Book 2013-2014
Kentucky State University
Accreditation

Accreditation
Accreditation and Institutional Memberships
Kentucky State University is accredited by the Commision on Colleges of the Southern Association of Colleges and Schools to award associate,
baccalaureate, and master's degrees. Credit earned at Kentucky State University are accepted by other accredited institutions of higher education
throughout the country for transfer credit, graduate study, professional placement, and employment opportunities. The University also holds full
membership in and/or accreditation from the following state, regional, and national educational or professional organizations:
American Alliance of Physical Education, Health, Recreation, Kentucky Council of Associate Degree Nursing
and Dance Kentucky Education Professional Standards Board
American Association for Higher Education Kentucky Honors Roundtable
American Association of Colleges for Teacher Education The Kentucky Institute for International Studies
American Association of Collegiate Registrars and Admissions Officers National Association for Equal Opportunity in Higher Education
American Association of State Colleges and Universities National Association for the Education of Young Children
American College Health Association National Association of College Deans, Registrars and Admissions Officers
American Council on Education National Association of Colleges and University Business Officers
American Library Association National Association of Schools of Music
Association for Institutional Research National Association of Schools of Public Affairs and Administration
Association for Student Judicial Affairs National Association of Student Affairs Professionals
Association of American Colleges and Universities National Association of Student Financial Aid Administrators
Association of College and University Auditors National Association of Student Personnel Administrators
Association of Collegiate Business Schools and Programs National Collegiate Athletic Association
Association of Gerontology in Higher Education National Collegiate Honors Council
Association of Governing Boards of Universities and Colleges National Council for Accreditation of Teacher Education
Association of Public and Land-Grant Colleges Universities National Council for Education Opportunity Associations
Association to Advance Collegiate Schools of Business (AACSB) National League for Nursing
The College Board National League for Nursing Accrediting Commission
The Cooperative Center for Study Abroad Professional and Organizational Development Network in Higher Education
Council for Adult and Experiential Learning Society for College and University Planning
Council for the Advancement and Support of Education South-East Consortium for International Development
Council of National Alumni Associations, Inc. Southern Association of College and University Business Officers
Council on Social Work Education Southern Association of Colleges and Schools
HBCU Library Alliance Southern Association of Collegiate Registrars and Admissions Officers
International Studies Association Southern Council of Collegiate Education for Nursing
Kentucky Academy of Science Southern Intercollegiate Athletic Conference
Kentucky Association of Baccalaureate and Higher Degree Programs Southern Regional Honors Council
Kentucky Association of Collegiate Registrars and Admissions Officers Southeastern Library Network
Kentucky Board of Nursing 1890 Land Grant and Tuskegee Library Director’s AssociationKentucky Council for International Education
Office of Institutional Research and Effectiveness

Fact Book 2013-2014
Kentucky State University
History

History
KSU History
Since its doors first opened on October 11, 1887, Kentucky State University has played a critical role in providing opportunities for students seeking
access to higher education in Kentucky. The school's founding is linked directly to a small cadre of teachers who were graduates of Berea College,
which at the time was the only institution of higher learning available for African Americans in the state. The teachers' vision embraced the ideal that
a school dedicated to the sole purpose of training teachers for the African-American school-age population was both needed and could have positive
and far-reaching effects. Led by John H. Jackson, a teacher in Lexington, the group petitioned legislators to lobby for a school. On May 17, 1886,
a majority of the legislators voted affirmatively and passed an act that authorized both a charter and funds for the school. Jackson later was selected
to become the school's first president.
The State Normal School for Colored Persons became only the second institution of higher learning approved to receive state-level financial support
from the commonwealth. Several cities competed for an opportunity to host the school. The offer made by the capital city of Frankfort was accepted
largely because it included the donation of a 24-acre tract of land on which the school could be built.
The journey from normal school to university spanned a period of 86 years, from 1886 to 1972, and included five name changes. In 1890, provisions
under the Second Morrill Act enabled State Normal to acquire land grant status. This represented the first shift in curriculum design. The departments
of agriculture, domestic economy, and mechanics and manual training were added along with a new emphasis on the creation of new knowledge and
public service. Gradually, in addition to offering the two-year teacher training program, the school expanded to include educational offerings targeting
primary- and secondary-level students.
The impact of Booker T. Washington's Tuskegee Institute philosophy, coupled with the broader progressive education movement, influenced Kentucky
legislators to adopt the industrial education model for the school. The State Normal School for Colored Persons became Kentucky Normal and Industrial
Institute in 1902. By the early 1930s, however, KNII began to re-emphasize a classical education. The institution transitioned to a four-year college in
1938, gained accreditation in 1939 through the Southern Association of Colleges and Schools and has since been approved for reaccreditation on a
continual basis. The institution finally acquired university status and began offering graduate programs in 1972.
Today, with President Mary Evans Sias at the helm as its 13th president, Kentucky State University has evolved into the most diverse institution in the
state. Moreover, KSU continues to embrace the ideals of its founders, a value for access to education and a commitment to service, along with its
land grant programs and a strong liberal studies core that prepares students well for life in a global community.
Office of Institutional Research and Effectiveness

History
KSU Presidents: Past and Present
John Jackson 1887-1898 W. A. Butts 1975-1982
James E. Givens 1898-1900 Raymond M. Burse 1982-1989
James S. Hathaway 1900-1907 Mary L. Smith, Interim 1989-1990
John H. Jackson 1907-1910 John T. Wolfe 1990
James S. Hathaway 1910-1912 Mary L. Smith 1990-1998
Green P. Russell 1912-1923 George W. Reid 1998-2002
Francis M. Wood 1923-1924 Paul E. Bibbins, Interim 2002
Green P. Russell 1924-1929 William Turner, Interim 2003-2004
Rufus B. Atwood 1929-1962 Mary E. Sias 2004-present
Carl M. Hill 1962-1975
John H. Jackson Mary E. Sias
KENTUCKY STATE UNIVERSITY1886-2014
Office of Institutional Research and Effectiveness

Fact Book 2013-2014
Kentucky State University
Admissions

Admissions
Undergraduate Admission
Fall 2009 Fall 2010 Fall 2011 Fall 2012 Fall 2013
5-Yr
Change
Applications Freshman 10,765 12,271 10,322 4,333 6,399 -40.6%
Transfer 597 725 502 389 709 18.8%
Non Degree 214 89 224 168 230 7.5%
Total Applications Received 11,576 13,085 11,048 4,890 7,338 -36.6%
Admitted Freshman 2,610 3,116 3,126 1,936 2,545 -2.5%
Transfer 215 232 223 255 316 47.0%
Non Degree 208 45 181 161 220 5.8%
Total Admitted 3,033 3,393 3,530 2,352 3,081 1.6%
Enrolled Freshman 540 635 558 471 537 -0.6%
Transfer 116 148 115 161 173 49.1%
Non Degree 65 26 40 145 210 223.1%
Total New Enrolled 721 809 713 777 920 27.6%
Fall 2009 Fall 2010 Fall 2011 Fall 2012 Fall 2013
5-Yr
Change
Freshman Admitted over Applied 24.2% 25.4% 30.3% 44.7% 39.8% 15.5%
Enrolled over Admitted 20.7% 20.4% 17.9% 24.3% 21.1% 0.4%
Transfer Admitted over Applied 36.0% 32.0% 44.4% 65.6% 44.6% 8.6%
Enrolled over Admitted 54.0% 63.8% 51.6% 63.1% 54.7% 0.8%
Non Degree Admitted over Applied 97.2% 50.6% 80.8% 95.8% 95.7% -1.5%
Enrolled over Admitted 31.3% 57.8% 22.1% 90.1% 95.5% 64.2%
Total Admitted over Applied 26.2% 25.9% 32.0% 48.1% 42.0% 15.8%
Enrolled over Admitted 23.8% 23.8% 20.2% 33.0% 29.9% 6.1%
Office of Institutional Research and Effectiveness

Admissions
Freshman Application Among Kentucky Public Institutions
Fall 2009 Fall 2010 Fall 2011 Fall 2012 Fall 2013
5-Yr
Change
Eastern Kentucky University 7,213 8,339 9,159 9,461 9,932 37.7%
Kentucky State University 10,765 12,271 10,322 4,333 6,399 -40.6%
Morehead State University 5,720 2,768 2,461 3,342 5,230 -8.6%
Murray State University 3,072 4,233 4,057 4,282 4,576 49.0%
Northern Kentucky University 6,887 7,202 7,202 7,330 7,064 2.6%
University of Kentucky 11,120 12,195 13,537 15,153 19,810 78.1%
University of Louisville 7,861 7,755 7,749 7,892 9,166 16.6%
Western Kentucky University 7,409 7,757 7,993 8,017 8,526 15.1%
Source: IPEDS
Freshman Admission Among Kentucky Public Institutions
Fall 2009 Fall 2010 Fall 2011 Fall 2012 Fall 2013
5-Yr
Change
Eastern Kentucky University 5,213 5,742 6,023 6,272 5,961 12.5%
Kentucky State University 2,610 3,116 3,126 1,936 2,415 -8.1%
Morehead State University 3,118 2,181 2,185 3,099 4,419 29.4%
Murray State University 2,629 3,108 3,305 3,566 3,760 30.1%
Northern Kentucky University 4,767 4,772 4,772 4,704 3,299 -44.5%
University of Kentucky 8,757 8,966 9,275 10,362 13,592 35.6%
University of Louisville 5,473 5,625 5,804 5,738 6,519 16.0%
Western Kentucky University 6,976 7,331 7,393 7,355 7,871 11.4%
Source: IPEDS (Data beyond Fall 2012 is not currently available.)
Office of Institutional Research and Effectiveness

Admissions
Freshman New Enrolled Among Kentucky Public Institutions
Fall 2009 Fall 2010 Fall 2011 Fall 2012 Fall 2013
5-Yr
Change
Eastern Kentucky University 2,495 2,564 2,593 2,421 2,306 -8.2%
Kentucky State University 558 575 558 471 506 -10.3%
Morehead State University 1,338 1,260 1,180 1,372 1,649 18.9%
Murray State University 1,311 1,391 1,390 1,536 1,626 19.4%
Northern Kentucky University 2,268 2,294 2,337 2,271 2,107 -7.6%
University of Kentucky 4,110 4,153 4,328 4,139 4,702 12.6%
University of Louisville 2,609 2,478 2,561 2,569 2,857 8.7%
Western Kentucky University 3,303 3,387 3,377 3,385 3,375 2.1%
Source: IPEDS (Data beyond Fall 2012 is not currently available.)
Undergraduate Applicants
Fall 2009 Fall 2010 Fall 2011 Fall 2012 Fall 2013
5-Yr
Change
Gender Female 6,367 6,759 6,019 2,971 4,361 -31.5%
Male 4,336 4,367 3,986 1,769 2,599 -40.1%
Declined to answer 873 1,959 1043 150 141 -83.8%
Race Nonresident Alien 3 2 11 7 3 0.0%
Black, Non Hispanic 2,978 929 2,925 2,729 5,467 83.6%
American Indian/Alaskan Native 32 30 9 4 12 -62.5%
Asian 32 11 14 22 44 37.5%
Hispanic 194 140 62 68 268 38.1%
White, Non Hispanic 1,152 889 1,316 511 664 -42.4%
Unknown 7,185 11,084 6,623 1,506 434 -94.0%
Two or More Races 0 0 78 37 205 --
Hawaiian/Pacific Islander 0 0 10 6 9 --
Residency In-State 3,827 3,753 3,410 1,503 1,973 -48.4%Out-of-State 7,749 9,332 7,638 3,387 5,050 -34.8%
Office of Institutional Research and Effectiveness

Admissions
Undergraduate Admission
Fall 2009 Fall 2010 Fall 2011 Fall 2012 Fall 2013
5-Yr
Change
Gender Female 1,825 2,020 2,074 1,424 1,957 7.2%
Male 1,147 1,266 1,224 854 1,081 -5.8%
Declined to answer 61 107 232 74 58 -4.9%
Race Nonresident Alien 0 0 11 7 1 --
Black, Non Hispanic 1,723 1,959 1,352 1,405 2,161 25.4%
American Indian/Alaskan Native 9 2 6 2 10 11.1%
Asian 26 14 4 12 27 3.8%
Hispanic 56 37 31 25 124 121.4%
White, Non Hispanic 453 317 197 322 512 13.0%
Unknown 766 1008 1889 556 176 -77.0%
Two or More Races 0 56 37 19 84 --
Hawaiian/Pacific Islander 0 0 3 4 1 --
Residency In-State 1,203 969 1015 822 1,029 -14.5%
Out-of-State 1,830 2,424 2,515 1,530 2,053 12.2%
Office of Institutional Research and Effectiveness

Admissions
Undergraduate New Enrollment
Fall 2009 Fall 2010 Fall 2011 Fall 2012 Fall 2013
5-Yr
Change
Gender Female 412 467 422 434 444 7.8%
Male 309 342 291 343 315 1.9%
Race Nonresident Alien 11 12 33 7 1 -90.9%
Black, Non Hispanic 411 482 373 415 499 21.4%
American Indian/Alaskan Native 0 0 4 0 4 --
Asian 4 0 0 6 3 -25.0%
Hispanic 22 8 10 11 16 -27.3%
White, Non Hispanic 113 133 79 217 138 22.1%
Unknown 160 156 207 114 67 -58.1%
Two or More Races 0 18 5 5 29 --
Hawaiian/Pacific Islander 0 0 2 2 2 --
Residency In-State 363 340 287 425 383 5.5%
Out-of-State 358 469 426 352 376 5.0%
0
100
200
300
400
500
600
700
800
900
Fall 2009 Fall 2010 Fall 2011 Fall 2012 Fall 2013
Male
Female
Applied by Gender
0
100
200
300
400
500
600
700
800
900
Fall 2009 Fall 2010 Fall 2011 Fall 2012 Fall 2013
Out-of-State
In-State
Applied by Residency
Office of Institutional Research and Effectiveness

Admissions
Test Scores
Number of Enrolled New Freshmen in Fall 2013 Submitted ACT Scores: 292 521
Percent of Enrolled New Freshmen in Fall 2013 Submitted ACT Scores: 97%
Number of Enrolled New Freshmen in Fall 2013 Submitted SAT Scores: 47 62
Percent of Enrolled New Freshmen in Fall 2013 Submitted SAT Scores: 12%
Fall 2009 Fall 2010 Fall 2011 Fall 2012 Fall 2013
5-Yr
Change
ACT English 25th percentile 13 13 14 14 14 7.7%
75th percentile 19 19 20 19 20 5.3%
Average 16 16 17 16 17 9.1%
ACT Math 25th percentile 15 15 15 15 15 0.0%
75th percentile 18 18 19 18 19 6.9%
Average 17 17 17 17 18 4.1%
ACT Comp 25th percentile 15 15 16 15 16 6.7%
75th percentile 19 19 20 19 20 5.3%
Average 17 17 18 17 18 6.3%
SAT Critical Reading 25th percentile 360 348 380 380 350 -2.8%
75th percentile 460 480 470 460 450 -2.2%
Average 409 408 426 419 410 0.2%
SAT Math 25th percentile 340 350 380 350 323 -5.1%
75th percentile 460 440 470 440 448 -2.7%
Average 403 410 425 405 395 -1.9%
SAT Total (CR+M) 25th percentile 720 710 770 740 683 -5.2%
75th percentile 920 920 960 910 880 -4.3%
Average 813 818 851 816 805 -1.0%
Office of Institutional Research and Effectiveness

Admissions
High School GPA
Number of First-Time Freshmen Submitted High School GPA: 537
Percent of First-Time Freshmen Submitted High School GPA: 100%
Fall 2009 Fall 2010 Fall 2011 Fall 2012 Fall 2013
5-Yr
Change
Percent who had GPA of 3.75 and higher 2% 3% 5% 3% 7% 5%
Percent who had GPA between 3.50 and 3.74 6% 4% 6% 4% 8% 2%
Percent who had GPA between 3.25 and 3.49 6% 6% 7% 5% 7% 1%
Percent who had GPA between 3.00 and 3.24 10% 12% 10% 10% 9% -1%
Percent who had GPA between 2.50 and 2.99 30% 26% 23% 25% 24% -6%
Percent who had GPA between 2.00 and 2.49 32% 36% 35% 33% 29% -3%
Percent who had GPA between 1.00 and 1.99 14% 13% 14% 21% 17% 3%
Percent who had GPA below 1.00 0% 0% 0% 0% 0% 0%
0%
5%
10%
15%
20%
25%
30%
35%
GPA of 3.75and higher
GPA between3.50 and 3.74
GPA between3.25 and 3.49
GPA between3.00 and 3.24
GPA between2.50 and 2.99
GPA between2.00 and 2.49
GPA between1.00 and 1.99
GPA below1.00
Fall 2009
Fall 2013
Office of Institutional Research and Effectiveness

Fact Book 2013-2014
Kentucky State University
Residence Halls

Residence Halls
Residence Halls Occupancy
Fall 2009 Fall 2010 Fall 2011 Fall 2012 Fall 2013 5 Year ChangeTotal Enrollment 2,834 2,851 2,746 2,524 2,533 ‐10.6%Halls Resident 983 990 948 853 796 ‐19.0%Percent Live In Campus 34.7% 34.7% 34.5% 33.8% 31.4% ‐3.3%Commuter 1,851 1,861 1,798 1,671 1,737 ‐6.2%Percent Commute 65.3% 65.3% 65.5% 66.2% 68.6% 3.3%
Halls Fall 2009 Fall 2010 Fall 2011 Fall 2012 Fall 2013 5 Year ChangeChandler Hall 111 108 110 89 104 ‐6.3%Combs Hall 101 106 106 98 93 ‐7.9%The Halls 303 295 254 212 207 ‐31.7%Hunter Hall 97 104 95 98 92 ‐5.2%Kentucky Hall 136 136 132 105 74 ‐45.6%McCullin Hall 92 97 91 84 86 ‐6.5%Young Hall 143 144 140 133 140 ‐2.1%Eastwood 0 0 20 34 0 ‐‐Total Halls Resident 983 990 948 853 796 ‐19.0%
Office of Institutional Research and Effectiveness

Residence Halls
Residency Halls Occupancy
Halls Gender Fall 2009 Fall 2010 Fall 2011 Fall 2012 Fall 2013 5 Year ChangeFemale 111 108 110 89 104 ‐6.3%MaleFemale 27 28 28 21 26 ‐3.7%Male 74 78 78 77 67 ‐9.5%Female 100 189 158 66 89 ‐11.0%Male 203 106 96 146 118 ‐41.9%Female 32 0 2 31 30 ‐6.3%Male 65 104 93 67 62 ‐4.6%Female 136 136 132 105 74 ‐45.6%MaleFemale 68 70 65 58 62 ‐8.8%Male 24 27 26 26 24 0.0%Female 79 75 71 74 78 ‐1.3%Male 64 69 69 59 62 ‐3.1%Female 0 0 16 16 0 ‐‐Male 0 0 4 18 0 ‐‐
McCullin Hall
Young Hall
Eastwood
Chandler Hall
Combs Hall
The Halls
Hunter Hall
Kentucky Hall
Office of Institutional Research and Effectiveness

Residence Halls
Residency Halls Occupancy
Halls Class Fall 2009 Fall 2010 Fall 2011 Fall 2012 Fall 2013 5 Year ChangeFreshman & Sophomore 104 100 107 77 87 ‐16.3%Other Classes 7 8 3 12 17 142.9%Freshman & Sophomore 87 92 99 89 82 ‐5.7%Other Classes 14 14 7 9 11 ‐21.4%Freshman & Sophomore 292 292 246 200 203 ‐30.5%Other Classes 11 3 8 12 4 ‐63.6%Freshman & Sophomore 91 99 92 94 86 ‐5.5%Other Classes 6 5 3 4 6 0.0%Freshman & Sophomore 112 109 111 88 58 ‐48.2%Other Classes 24 27 21 17 16 ‐33.3%Freshman & Sophomore 75 72 75 67 72 ‐4.0%Other Classes 17 25 16 17 14 ‐17.6%Freshman & Sophomore 86 95 109 97 100 16.3%Other Classes 57 49 31 36 40 ‐29.8%Freshman & Sophomore 0 0 1 12 0 ‐‐Other Classes 0 0 19 22 0 ‐‐
All full‐time freshmen and sophomore students, except veterans of at least two years’ active military service, students who commute from their parents legal guardians’ homes, married students, or students 21 years of age or older, are required to live in campus housing.
Kentucky Hall
McCullin Hall
Young Hall
Eastwood
Chandler Hall
Combs Hall
The Halls
Hunter Hall
Office of Institutional Research and Effectiveness
Residence Halls
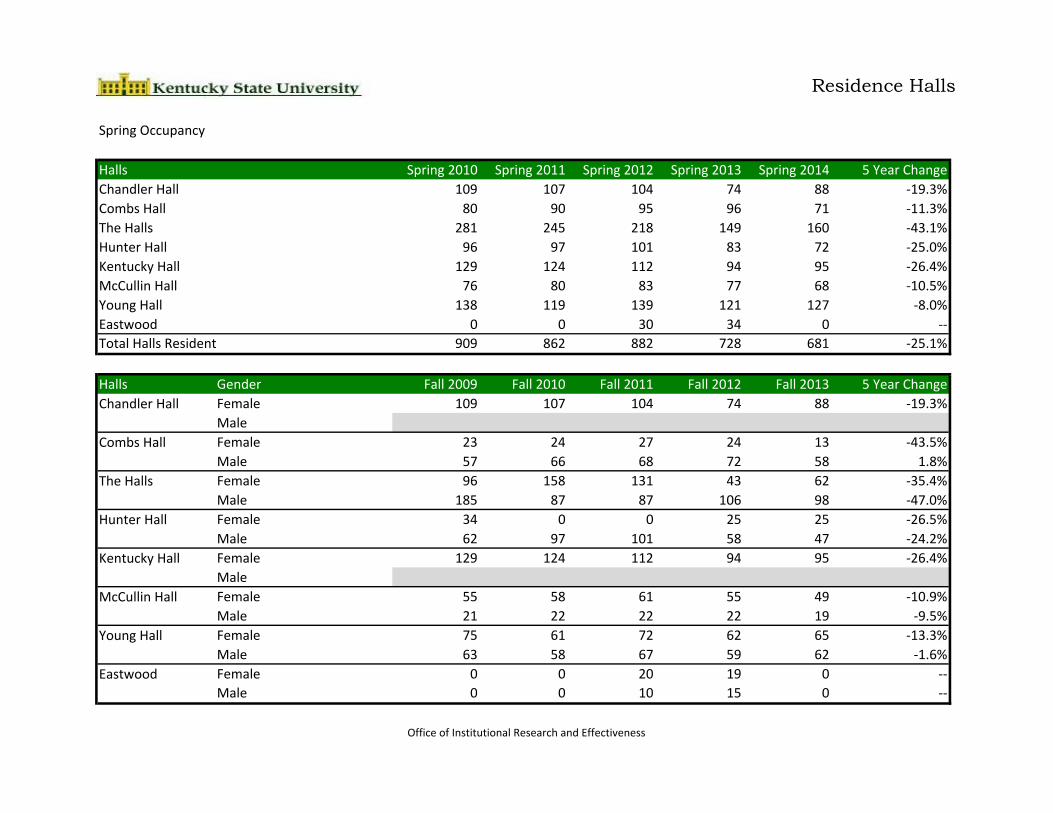
Spring Occupancy
Halls Spring 2010 Spring 2011 Spring 2012 Spring 2013 Spring 2014 5 Year ChangeChandler Hall 109 107 104 74 88 ‐19.3%Combs Hall 80 90 95 96 71 ‐11.3%The Halls 281 245 218 149 160 ‐43.1%Hunter Hall 96 97 101 83 72 ‐25.0%Kentucky Hall 129 124 112 94 95 ‐26.4%McCullin Hall 76 80 83 77 68 ‐10.5%Young Hall 138 119 139 121 127 ‐8.0%Eastwood 0 0 30 34 0 ‐‐Total Halls Resident 909 862 882 728 681 ‐25.1%
Halls Gender Fall 2009 Fall 2010 Fall 2011 Fall 2012 Fall 2013 5 Year ChangeFemale 109 107 104 74 88 ‐19.3%MaleFemale 23 24 27 24 13 ‐43.5%Male 57 66 68 72 58 1.8%Female 96 158 131 43 62 ‐35.4%Male 185 87 87 106 98 ‐47.0%Female 34 0 0 25 25 ‐26.5%Male 62 97 101 58 47 ‐24.2%Female 129 124 112 94 95 ‐26.4%MaleFemale 55 58 61 55 49 ‐10.9%Male 21 22 22 22 19 ‐9.5%Female 75 61 72 62 65 ‐13.3%Male 63 58 67 59 62 ‐1.6%Female 0 0 20 19 0 ‐‐Male 0 0 10 15 0 ‐‐
Kentucky Hall
McCullin Hall
Young Hall
Eastwood
Chandler Hall
Combs Hall
The Halls
Hunter Hall
Office of Institutional Research and Effectiveness
Fact Book 2013-2014
Kentucky State University
Financial Aid

Financial Aid
Financial Aid
Fall 2009 Fall 2010 Fall 2011 Fall 2012 Fall 2013 5‐Year ChangeTotal Undergraduate Enrolled 2,638 2,606 2,490 2,296 2,370 ‐10.2%
Accepted any Financial Aid 2,168 2,185 2,086 1,844 1,890 ‐12.8%Percent Accepted any Financial Aid 82.2% 83.8% 83.8% 80.3% 79.7% ‐2.4%Disbursed any Financial Aid 2,158 2,172 2,028 1,835 1,862 ‐13.7%Percent Disbursed any Financial Aid 81.8% 83.3% 81.4% 79.9% 78.6% ‐3.2%
Total Undergraduate Degree‐Seeking Enrolled 2,326 2,439 2,263 2,084 2,131 ‐8.4%Accepted any Financial Aid 2,060 2,134 2,054 1,832 1,878 ‐8.8%Percent Accepted any Financial Aid 88.6% 87.5% 90.8% 87.9% 88.1% ‐0.4%Disbursed any Financial Aid 2,053 2,121 2,001 1,824 1,851 ‐9.8%Percent Disbursed any Financial Aid 88.3% 87.0% 88.4% 87.5% 86.9% ‐1.4%
0
500
1,000
1,500
2,000
2,500
Fall 2009 Fall 2010 Fall 2011 Fall 2012 Fall 2013
Undergraduate Degree Seeking
Enrollment Accepted any Aid
70.0%
75.0%
80.0%
85.0%
90.0%
95.0%
100.0%
Fall 2009 Fall 2010 Fall 2011 Fall 2012 Fall 2013
Undergraduate Degree Seeking
Percent Accepted any Aid
Office of Institutional Research and Effectiveness

Financial Aid
Demographics of Undergraduate Degree Seeking Students Accepted any Financial Aid
Gender Race Fall 2009 Fall 2010 Fall 2011 Fall 2012 Fall 2013 5‐Year ChangeFemale Nonresident Alien 2 14 1 2 2 0.0%
Black, Non Hispanic 763 778 752 600 701 ‐8.1%American Indian/Alaskan Native 3 0 4 0 2 ‐33.3%Asian 3 1 1 4 5 66.7%Hispanic 8 11 15 12 14 75.0%White, Non Hispanic 285 293 265 204 241 ‐15.4%Unknown 130 176 199 241 152 16.9%Two or More Races ‐‐ 20 14 12 21 ‐‐Hawaiian or Pacific Islander ‐‐ 0 2 3 3 ‐‐Total Female 1,194 1,293 1,253 1,078 1,141 ‐4.4%
Male Nonresident Alien 4 12 3 3 2 ‐50.0%Black, Non Hispanic 582 528 482 444 475 ‐18.4%American Indian/Alaskan Native 0 0 1 0 2 ‐‐Asian 4 2 2 2 5 25.0%Hispanic 9 13 11 4 10 11.1%White, Non Hispanic 129 138 126 119 131 1.6%Unknown 138 135 161 174 95 ‐31.2%Two or More Races ‐‐ 11 14 7 16 ‐‐Hawaiian or Pacific Islander ‐‐ 2 1 1 1 ‐‐Total Male 866 841 801 754 737 ‐14.9%
Total Nonresident Alien 6 26 4 5 4 ‐33.3%Black, Non Hispanic 1,345 1,306 1,234 1,044 1,176 ‐12.6%American Indian/Alaskan Native 3 0 5 0 4 33.3%Asian 7 3 3 6 10 42.9%Hispanic 17 24 26 16 24 41.2%White, Non Hispanic 414 431 391 323 372 ‐10.1%Unknown 268 311 360 415 247 ‐7.8%Two or More Races ‐‐ 31 28 19 37 ‐‐Hawaiian or Pacific Islander ‐‐ 2 3 4 4 ‐‐Total Students 2,060 2,134 2,054 1,832 1,878 ‐8.8%
Office of Institutional Research and Effectiveness

Financial Aid
Total Dollar Amount of Financial Aid Accepted by Undergraduate Degree Seeking Students
Fall 2009 Fall 2010 Fall 2011 Fall 2012 Fall 2013 5‐Yr ChangeScholarships/Grants
Federal Scholarships/Grants 6,520,387 7,445,080 7,397,284 6,373,440 6,394,326 ‐1.9%State Scholarships/Grants 986,565 1,039,201 926,579 718,985 922,786 ‐6.5%Institutional Scholarships/Grants 2,641,947 3,140,827 2,881,348 2,978,318 4,217,466 59.6%External Scholarships/Grants 705,820 696,133 282,667 163,288 360,806 ‐48.9%Total Scholarships/Grants 10,854,718 12,321,242 11,487,878 10,234,031 11,895,385 9.6%
Self‐HelpStudent Loans 14,120,429 15,012,289 14,978,169 11,994,499 12,091,130 ‐14.4%Federal Work Study 551,267 816,316 348,437 351,200 499,314 ‐9.4%Employment 182,831 ‐‐ ‐‐ 167,274 184,268 0.8%Total Self‐Help 14,854,527 15,828,605 15,326,606 12,512,973 12,774,712 ‐14.0%
OtherParent Loans 2,174,027 2,276,856 3,836,074 1,278,088 1,844,344 ‐15.2%Tuition Waiver 167,894 228,002 120,193 118,885 121,153 ‐27.8%Athletic Awards 954,937 977,348 1,013,542 942,339 1,138,172 19.2%
Note: the dollar amount shown is the amount that students accepted, not necessarily disbursed.
Federal Scholarships/Grants23%
State Scholarships/Grants3%
Institutional Scholarships/Grants15%
External Scholarships/Grants1%
Student Loans44%
Federal Work Study2%
Employment1%
Parent Loans7%Tuition Waiver
0%
Athletic Awards4%
Fall 2013
Office of Institutional Research and Effectiveness

Financial Aid
Demographics of Undergraduate Degree Seeking Students Accepted any Athletic Aid
Gender Race Fall 2009 Fall 2010 Fall 2011 Fall 2012 Fall 2013 5‐Yr ChangeFemale Nonresident Alien 0 0 0 0 0 ‐‐
Black, Non Hispanic 35 40 30 26 42 20.0%Asian 0 0 0 0 0 ‐‐Hispanic 2 3 6 7 4 100.0%White, Non Hispanic 2 3 3 1 4 100.0%Unknown 5 7 10 13 5 0.0%Two or More Races ‐‐ 0 0 1 5 ‐‐Hawaiian or Pacific Islander ‐‐ 0 1 1 0 ‐‐Total Female 44 53 50 49 60 36.4%
Male Nonresident Alien 1 1 2 0 0 ‐100.0%Black, Non Hispanic 84 77 68 60 84 0.0%Asian 0 0 2 0 0 ‐‐Hispanic 2 3 1 1 ‐50.0%White, Non Hispanic 13 16 16 10 16 23.1%Unknown 18 16 35 37 20 11.1%Two or More Races ‐‐ 2 2 1 2 ‐‐Hawaiian or Pacific Islander ‐‐ 1 1 0 0 ‐‐Total Male 118 116 126 109 123 4.2%
Total Nonresident Alien 1 1 2 0 0 ‐100.0%Black, Non Hispanic 119 117 98 86 126 5.9%Asian 0 0 0 0 0 ‐‐Hispanic 4 6 8 8 5 25.0%White, Non Hispanic 15 19 19 11 20 33.3%Unknown 23 23 45 50 25 8.7%Two or More Races ‐‐ 2 2 2 7 ‐‐Hawaiian or Pacific Islander ‐‐ 1 2 1 0 ‐‐Total Students 162 169 176 158 183 13.0%
Note: Students was counted once. If she/he accepted athletic aid in multiple sports, she/he only be counted as one.
Office of Institutional Research and Effectiveness

Financial Aid
Total Dollar Amount of Athletic Aid Accepted by Undergraduate Degree Seeking Students
Fall 2009 Fall 2010 Fall 2011 Fall 2012 Fall 2013 5‐Yr ChangeFootball Number of Students 69 74 80 74 86 24.6%
Total Dollar Accepted 411,101 393,485 427,100 366,500 456,429 11.0%Average 5,958 5,317 5,339 4,953 5,307 ‐10.9%
Baseball Number of Students 21 12 24 18 18 ‐14.3%Total Dollar Accepted 52,543 41,514 71,801 71,700 74,311 41.4%Average 2,502 3,460 2,992 3,983 4,128 65.0%
Basketball Number of Students 27 25 28 27 27 0.0%Total Dollar Accepted 261,766 265,373 286,241 310,289 320,473 22.4%Average 9,695 10,615 10,223 11,492 11,869 22.4%
CC/Track Number of Students 30 37 24 24 30 0.0%Total Dollar Accepted 78,976 101,370 60,400 59,950 94,340 19.5%Average 2,633 2,740 2,517 2,498 3,145 19.5%
Golf Number of Students 5 9 5 1 8 60.0%Total Dollar Accepted 16,000 23,257 16,500 4,000 24,501 53.1%Average 3,200 2,584 3,300 4,000 3,063 ‐4.3%
Softball Number of Students 16 17 18 18 19 18.8%Total Dollar Accepted 55,800 77,850 70,900 82,400 83,538 49.7%Average 3,488 4,579 3,939 4,578 4,397 26.1%
Volleyball Number of Students 11 10 12 8 13 18.2%Total Dollar Accepted 78,750 74,500 80,600 47,500 84,580 7.4%Average 7,159 7,450 6,717 5,938 6,506 ‐9.1%
Note: the dollar amount shown is the amount that students accepted, not necessarily disbursed.
Office of Institutional Research and Effectiveness

Fact Book 2013-2014
Kentucky State University
Academic Majors
Academic Majors
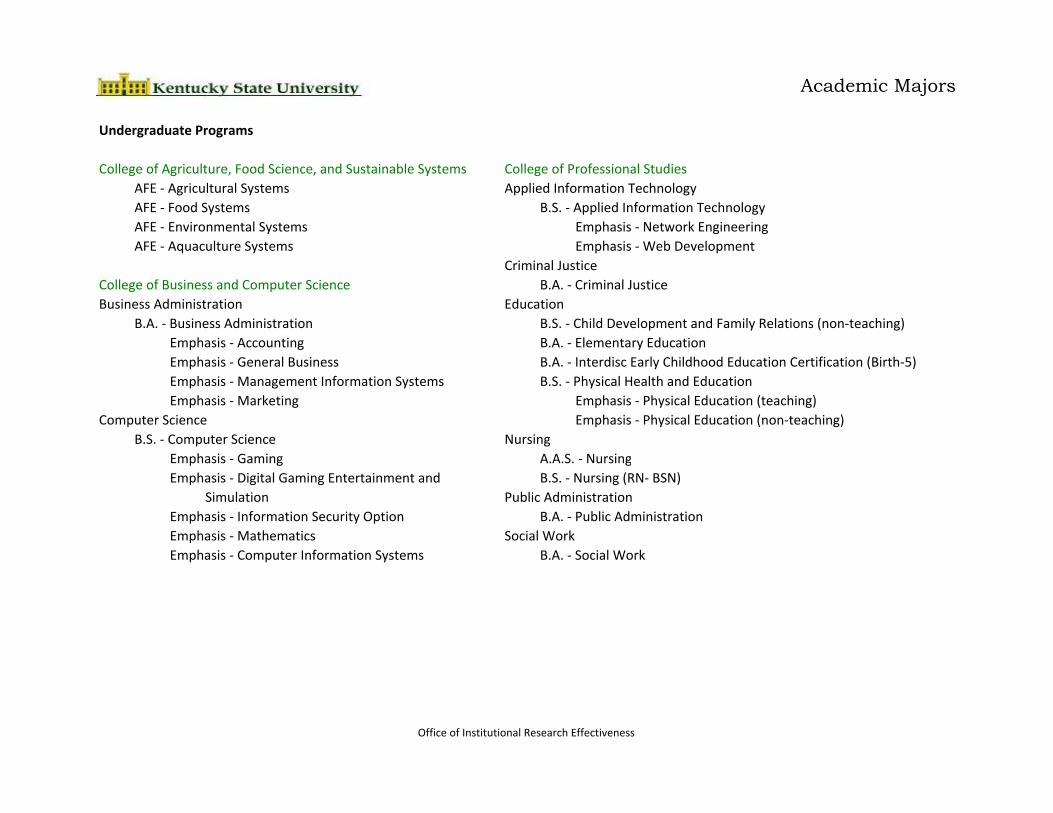
Undergraduate Programs
College of Agriculture, Food Science, and Sustainable Systems College of Professional StudiesAFE ‐ Agricultural Systems Applied Information TechnologyAFE ‐ Food Systems B.S. ‐ Applied Information TechnologyAFE ‐ Environmental Systems Emphasis ‐ Network EngineeringAFE ‐ Aquaculture Systems Emphasis ‐ Web Development
Criminal JusticeCollege of Business and Computer Science B.A. ‐ Criminal JusticeBusiness Administration Education
B.A. ‐ Business Administration B.S. ‐ Child Development and Family Relations (non‐teaching)Emphasis ‐ Accounting B.A. ‐ Elementary EducationEmphasis ‐ General Business B.A. ‐ Interdisc Early Childhood Education Certification (Birth‐5)Emphasis ‐ Management Information Systems B.S. ‐ Physical Health and EducationEmphasis ‐ Marketing Emphasis ‐ Physical Education (teaching)
Computer Science Emphasis ‐ Physical Education (non‐teaching)B.S. ‐ Computer Science Nursing
Emphasis ‐ Gaming A.A.S. ‐ NursingEmphasis ‐ Digital Gaming Entertainment and B.S. ‐ Nursing (RN‐ BSN)
Simulation Public AdministrationEmphasis ‐ Information Security Option B.A. ‐ Public AdministrationEmphasis ‐ Mathematics Social WorkEmphasis ‐ Computer Information Systems B.A. ‐ Social Work
Office of Institutional Research Effectiveness

Academic Majors
College of Arts and SciencesArt Mathematics
B.A. ‐ Studio Art B.A. ‐ MathematicsEmphasis ‐ Teacher Certification Emphasis ‐ Applied Pre‐Agricultural Engineering
Biology Emphasis ‐ Applied Pre‐Chemical EngineeringB.S. ‐ Biology Emphasis ‐ Applied Pre‐Engineering
Emphasis ‐ Teacher Certification Emphasis ‐ Mathematics and Computer ScienceEmphasis ‐ General Track Emphasis ‐ Teaching CertificationEmphasis ‐ Pre‐Professional Emphasis ‐ Mathematics
Chemistry MusicB.S. ‐ Chemistry B.A. ‐ Music
English Emphasis ‐ Music EducationB.A. ‐ English Concentration ‐ Instrumental
Emphasis ‐ Creative Writing Concentration ‐ KeyboardEmphasis ‐ Literature Concentration ‐ VocalEmphasis ‐ Certification Emphasis ‐ Music Performance
General Social Sciences Concentration ‐ InstrumentalB.A. ‐ General Social Sciences Concentration ‐ Keyboard and Instrumental
Emphasis ‐ History Concentration ‐ VocalEmphasis ‐ Social Studies EducationEmphasis ‐ Sociology
Mass Communication and Journalism Whitney Young School of Honors and Liberal StudiesB.A. ‐ Mass Communication and Journalism Africana Studies
Political Science B.A. ‐ Africana StudiesB.A. ‐ Political Science Liberal Studies
Psychology B.A. ‐ Liberal StudiesB.A. ‐ Psychology Emphasis ‐ Honors
Spanish Emphasis ‐ General StudiesB.A. ‐ Spanish Emphasis ‐ Student Designed
Office of Institutional Research Effectiveness
Academic Majors
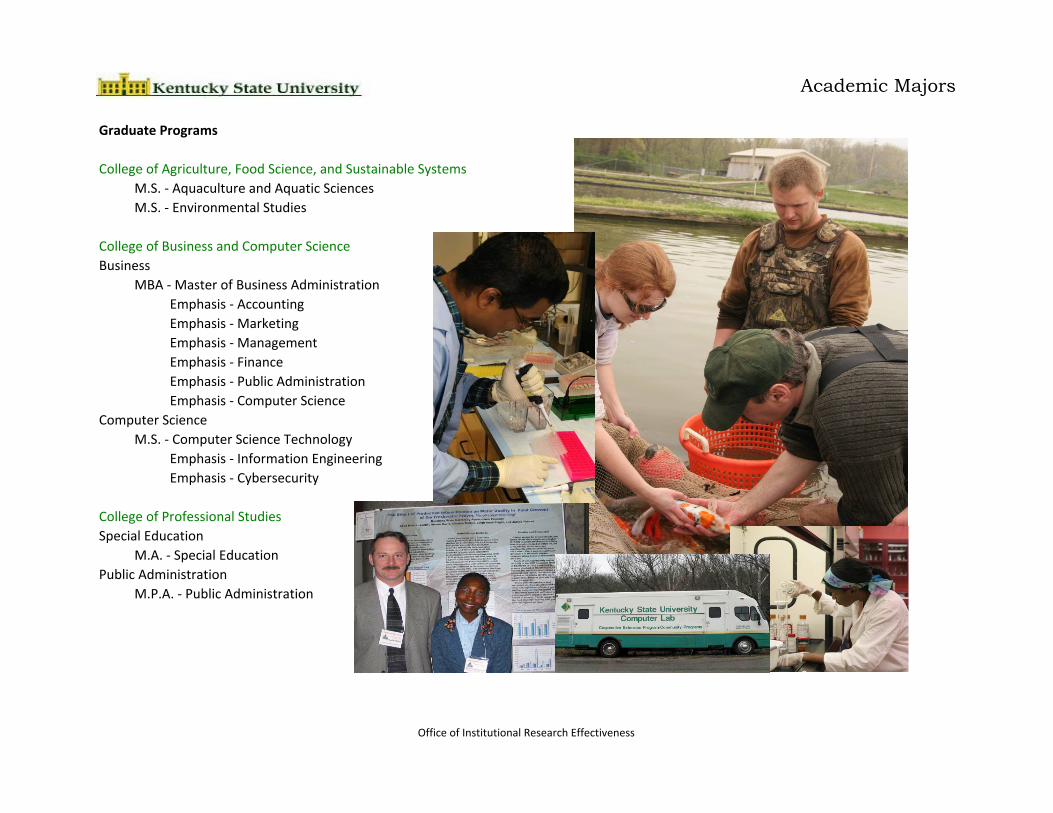
Graduate Programs
College of Agriculture, Food Science, and Sustainable SystemsM.S. ‐ Aquaculture and Aquatic SciencesM.S. ‐ Environmental Studies
College of Business and Computer ScienceBusiness
MBA ‐ Master of Business AdministrationEmphasis ‐ AccountingEmphasis ‐ MarketingEmphasis ‐ ManagementEmphasis ‐ FinanceEmphasis ‐ Public AdministrationEmphasis ‐ Computer Science
Computer ScienceM.S. ‐ Computer Science Technology
Emphasis ‐ Information EngineeringEmphasis ‐ Cybersecurity
College of Professional StudiesSpecial Education
M.A. ‐ Special EducationPublic Administration
M.P.A. ‐ Public Administration
Office of Institutional Research Effectiveness

Academic Majors
Minor
College of Agriculture, Food Science, and Sustainable Systems College of Business and Computer ScienceAgriculture, Food, and Environment AccountingAquaculture Computer Science
EconomicsCollege of Arts and Sciences Finance
African ‐ American Studies ManagementBiology MarketingChemistryEnglishFrench College of Professional StudiesHistory Applied Information TechnologyInternational Studies Athletic CoachingJournalism Athletic TrainingMathematics Child Development and Family RelationsMusic Performance Computer Information SystemsPhilosophy Criminal JusticePhysics GerontologyPolitical Science Public AdministrationPsychology RecreationSociology Sports ManagementSpanishSpeech CommunicationStudio Art Whitney Young School of Honors and Liberal StudiesTheatre Liberal Studies
Office of Institutional Research Effectiveness

Academic Majors
Level Major Concentration Fall 2009 Fall 2010 Fall 2011 Fall 2012 Fall 2013 5 Yr ChangeCET Computer Electronics Tech 13 13 6 5 1 ‐92.3%CGM Comp Graph & Multi Prod Tech 8 8 8 3 2 ‐75.0%LSA Liberal Studies (Whitney Yng) 7 23 1 12 13 85.7%LSW Liberal Studies WY (Honors) 2 0 0 1 0 ‐100.0%NUA Nursing 106 118 70 39 70 ‐34.0%NUP Nursing 181 211 224 211 183 1.1%Total Associate 317 373 309 271 269 ‐15.1%AFE Agriculture, Food, Environment 0 0 0 0 34
No Concentration 27 32 24 19 20 ‐25.9%NET Network Engineering 7 4 6 2 5 ‐28.6%WEB Web Development 5 6 4 3 2 ‐60.0%Total AIT 39 42 34 24 27 ‐30.8%
ASP Africana Studies 0 1 2 0 3No Concentration 102 121 117 110 73 ‐28.4%BIE Biology Education 6 6 5 3 0 ‐100.0%BIG General Biology 3 1 1 1 0 ‐100.0%BIP Pre‐Professional Biology 20 23 16 12 7 ‐65.0%BPR Pre‐Biology 0 0 0 0 22MGT Management 0 1 1 0 0Total BIO 131 152 140 126 102 ‐22.1%
BACHELORApplied Information Technology
Biology
ASSOCIATE
AIT
BIO
Office of Institutional Research Effectiveness

Academic Majors
Level Major Concentration Fall 2009 Fall 2010 Fall 2011 Fall 2012 Fall 2013 5 Yr ChangeNo Concentration 191 192 155 150 149 ‐22.0%ACC Accounting 28 27 20 22 28 0.0%FIN Finance 8 2 2 2 2 ‐75.0%GBU General Business 23 16 9 2 11 ‐52.2%MG5 Management (BA/MBA) 1 0 0 0 0 ‐100.0%MGT Management 31 24 24 18 23 ‐25.8%MK5 Marketing (BA/MBA) 0 1 1 1 0MKT Marketing 32 32 28 13 11 ‐65.6%MAS Management Info Systems 2 0 2 2 1 ‐50.0%Total BUA 316 294 241 210 225 ‐28.8%No Concentration 37 26 31 33 44 18.9%BTP Birth to Primary 1 0 0 0 0 ‐100.0%Total CDF 38 26 31 33 44 15.8%
CHE Chemistry 16 24 17 15 21 31.3%No Concentration 156 178 172 163 177 13.5%BIP Pre‐Professional Biology 1 1 0 0 0 ‐100.0%Total CRJ 157 179 172 163 177 12.7%No Concentration 57 59 44 49 58 1.8%BUA Business Administration 5 5 2 1 1 ‐80.0%COG Gaming 0 0 0 0 2IST Information Security 1 2 2 2 4 300.0%ITE Information Technology 0 0 0 0 1MAT Mathematics 3 1 0 1 1 ‐66.7%Total CSC 66 67 48 53 67 1.5%
ECE Interdisc Early Childhood Education 21 25 25 22 21 0.0%
BACHELOR Business Administration
Child Dev & Family Rel
CRJ Criminal Justice
Computer Science
BUA
CDF
CSC
Office of Institutional Research Effectiveness

Academic Majors
Level Major Concentration Fall 2009 Fall 2010 Fall 2011 Fall 2012 Fall 2013 5 Yr ChangeNo Concentration 135 138 121 93 95 ‐29.6%BUA Business Administration 0 1 1 0 0ENE English Education 1 3 1 0 0 ‐100.0%MAE Mathematics Education 1 1 0 0 0 ‐100.0%Total ELE 137 143 123 93 95 ‐30.7%No Concentration 26 27 18 15 21 ‐19.2%ENC Creative Writing 3 4 4 8 4 33.3%ENE English Education 13 8 12 11 5 ‐61.5%ENL Literature 1 1 2 0 3 200.0%Total ENG 43 40 36 34 33 ‐23.3%
LES Liberal Studies (Designed) 7 5 2 0 2 ‐71.4%LIS Liberal Studies (Honors) 17 15 10 7 6 ‐64.7%
No Concentration 43 40 25 25 22 ‐48.8%GBU General Business 0 1 0 0 0MAA Applied Mathematics 1 0 0 0 0 ‐100.0%Total LSC 44 41 25 25 22 ‐50.0%
LSS Liberal Studies WY (Designed) 0 1 0 0 1No Concentration 43 44 40 34 30 ‐30.2%ACS Acturial Science 0 2 1 1 0AMT Applied Mathematics (Pre‐Lng) 0 0 0 2 2BIP Pre‐Professional Biology 1 0 1 0 0 ‐100.0%MAA Applied Mathematics 9 7 3 0 1 ‐88.9%MAE Mathematics Education 5 7 4 4 3 ‐40.0%MAP Pure Mathematics 2 1 1 1 0 ‐100.0%Total MAT 60 61 50 42 36 ‐40.0%
BACHELOR
Mathematics MAT
LSC
Elementary Education
English
Liberal Studies Gen Studies
ELE
ENG
Office of Institutional Research Effectiveness

Academic Majors
Level Major Concentration Fall 2009 Fall 2010 Fall 2011 Fall 2012 Fall 2013 5 Yr ChangeNo Concentration 65 88 86 80 79 21.5%GIR International Relations 0 1 1 0 0MBJ Broadcast Journalism 0 0 7 14 17MPR Public Relations 0 0 2 6 9Total MCJ 65 89 96 100 105 61.5%No Concentration 49 40 39 21 34 ‐30.6%MEI Music Education, Instrumental 5 7 6 3 1 ‐80.0%MEV Music Education, Vocal 2 5 3 2 1 ‐50.0%MPI Music Performance‐Instrument 2 1 0 0 0 ‐100.0%MPV Music Performance‐Vocal 8 5 1 1 2 ‐75.0%MUE Music Education 0 0 0 5 4Total MUS 66 58 49 32 42 ‐36.4%
NUR Nursing 28 26 38 46 72 157.1%PED Physical Education 46 48 45 56 70 52.2%PET Physical Education (Teaching) 3 0 4 2 1 ‐66.7%PHT Physical Education and Health 47 50 41 29 37 ‐21.3%
No Concentration 31 35 34 23 18 ‐41.9%BUA Business Administration 1 1 0 0 0 ‐100.0%Total POS 32 36 34 23 18 ‐43.8%
PSY Psychology 143 156 139 124 138 ‐3.5%PUB Public Administration 22 34 30 26 27 22.7%
No Concentration 21 25 17 18 24 14.3%AED Art Education 1 2 1 2 3 200.0%Total SAR 22 27 18 20 27 22.7%
SPA Spanish 0 1 0 5 2
BACHELOR Mass Communication and Journal
Music
Political Science
Studio Art
MCJ
MUS
POS
SAR
Office of Institutional Research Effectiveness

Academic Majors
Level Major Concentration Fall 2009 Fall 2010 Fall 2011 Fall 2012 Fall 2013 5 Yr ChangeNo Concentration 10 11 9 5 13 30.0%HIE History Education 0 0 0 3 0HIS History 2 7 11 9 11 450.0%SOC Sociology 5 4 4 6 5 0.0%SSE Social Studies Education 9 5 5 10 10 11.1%Total SSC 26 27 29 33 39 50.0%
SWK Social Work 57 55 66 58 78 36.8%UNA Undeclared 1 1 0 2 0 ‐100.0%UND Undeclared 359 342 409 410 290 ‐19.2%Total Bachelor 2,009 2,066 1,954 1,813 1,862 ‐7.3%NDU Non‐degree 312 167 223 211 239 ‐23.4%NDCT Non‐degree certification 0 0 4 1 0
Total Undergraduate 2,638 2,606 2,490 2,296 2,370 ‐10.2%AQS Aquaculture/Aquatic Sciences 10 15 13 11 11 10.0%CPM Computer Science 26 35 36 30 27 3.8%ENS Environmental Studies 0 16 22 15 19MBA Business Administration 22 23 17 22 14 ‐36.4%MSE Special Education 69 75 74 60 27 ‐60.9%
No Concentration 52 69 69 79 56 7.7%HRM Spec: Human Resources Mgmt 2 0 2 1 0 ‐100.0%IAD Spec: Internatil. Admin. & Dev 0 0 0 1 0NPM Nonprofit Management 0 0 5 0 0Total PUM 54 69 76 81 56 3.7%
Total Master's 181 233 238 219 154 ‐14.9%Non Degree NDG Non‐degree Graduate 15 12 18 9 9 ‐40.0%Total Graduate 196 245 256 228 163 ‐16.8%
BACHELOR Social Sciences
Public Administration
MASTER'S
Non Degree
SSC
PUM
Office of Institutional Research Effectiveness

Academic Majors
Level Minor Fall 2009 Fall 2010 Fall 2011 Fall 2012 Fall 2013 5 Yr ChangeAAS African‐American Studies 0 1 2 1 1ACC Accounting 6 8 3 3 1 ‐83.3%AIT Applied Information Technology 0 1 1 1 0ALC Athletic Coaching 6 12 12 9 11 83.3%ALT Athletic Training 6 7 5 13 15 150.0%AQU Aquaculture 1 2 2 0 1 0.0%ART Art 1 1 0 0 1 0.0%BIO Biology, General 1 3 4 2 2 100.0%BMG Business Admin ‐ Management 0 0 2 2 2BUA Business Administration 4 5 2 4 4 0.0%CDA Child Dev & Family Rel 2 3 0 0 0 ‐100.0%CDF Child Dev & Family Rel 5 6 5 3 0 ‐100.0%CET Computer Electronics Tech 1 14 0 0 0 ‐100.0%CHE Chemistry 12 0 11 17 11 ‐8.3%CIS Computer Information Systems 2 1 1 0 0 ‐100.0%CJA Criminal Justice 0 1 1 2 1CRJ Criminal Justice 12 10 8 8 8 ‐33.3%CSC Computer Science 0 1 2 1 0ECE Interdisc Early Childhood Edu 2 0 0 0 0 ‐100.0%ECO Economics 1 2 1 1 0 ‐100.0%EED Elementary Education 0 0 0 0 1EEE Early Elementary Education 1 0 0 0 0 ‐100.0%ELE Elementary Education 1 0 0 0 0 ‐100.0%ENC Creative Writing 3 2 2 0 0 ‐100.0%ENE English Education 1 0 0 0 0 ‐100.0%ENG English 3 3 3 3 2 ‐33.3%FIN Finance 2 2 0 0 1 ‐50.0%FRE French 0 0 1 1 1
Undergraduate
Office of Institutional Research Effectiveness

Academic Majors
Level Minor Fall 2009 Fall 2010 Fall 2011 Fall 2012 Fall 2013 5 Yr ChangeGBU General Business 1 0 1 0 0 ‐100.0%GNT Gerontology 0 0 0 1 1HED Health Education 1 0 1 0 0 ‐100.0%HIS History 0 1 0 0 0HRM Spec: Human Resources Mgmt 0 0 1 0 1INS International Studies 0 1 4 2 1JOU Journalism 1 4 2 2 3 200.0%LES Liberal Studies (Designed) 0 1 0 0 0LIS Liberal Studies (Honors) 0 0 0 1 1LSA Liberal Studies (Whitney Yng) 0 1 0 0 0LSC Liberal Studies Gen Studies 2 0 1 0 1 ‐50.0%MAT Mathematics 7 3 1 1 1 ‐85.7%MGT Management 10 8 6 5 2 ‐80.0%MKT Marketing 9 5 3 2 0 ‐100.0%MPV Music Performance‐Vocal 1 0 0 0 0 ‐100.0%MUP Music ‐ Performance Ensemble 1 0 0 1 0 ‐100.0%MUS Music 7 6 4 2 0 ‐100.0%PED Physical Education 1 0 1 1 2 100.0%PHI Philosophy 4 4 3 2 1 ‐75.0%PHT Physical Education and Health 2 0 0 0 0 ‐100.0%PHY Physics 0 0 1 1 2POS Political Science 4 2 2 1 1 ‐75.0%PSY Psychology 11 10 12 12 14 27.3%PUA Public Administration 1 1 1 3 3 200.0%PUB Public Administration 1 1 2 1 1 0.0%REC Recreation 1 1 1 4 2 100.0%SAR Studio Art 0 1 0 0 0SOC Sociology 3 4 5 2 4 33.3%
Undergraduate
Office of Institutional Research Effectiveness

Academic Majors
Level Minor Fall 2009 Fall 2010 Fall 2011 Fall 2012 Fall 2013 5 Yr ChangeSPA Spanish 13 14 15 11 11 ‐15.4%SPC Speech & Communications 1 1 25 38 32 3100.0%SPE Speech & Theatre 0 1 7 6 9SPM Sports Management 5 7 6 5 5 0.0%SSC Social Sciences 0 1 0 0 0SSE Social Studies Education 1 0 0 0 0 ‐100.0%SWK Social Work 6 3 3 0 1 ‐83.3%THE Theatre 3 1 1 2 1 ‐66.7%
Undergraduate
Office of Institutional Research Effectiveness

Fact Book 2013-2014
Kentucky State University
Enrollment

Enrollment
Undergraduate Enrollment
Fall 2009 Fall 2010 Fall 2011 Fall 2012 Fall 2013 5 Year ChangeUG Degree Seeking 2,326 2,439 2,263 2,084 2,131 ‐8.4%UG Non Degree Seeking 312 167 227 212 239 ‐23.4%Total Undergraduate Enrollment 2,638 2,606 2,490 2,296 2,370 ‐10.2%
Fall 2013Total Enrollme 2,533Undergraduate 2,370Graduate 163
0
500
1,000
1,500
2,000
2,500
3,000
Fall 2009 Fall 2010 Fall 2011 Fall 2012 Fall 2013
Undergraduate Enrollment
Undergraduate94%
Graduate6%
Fall 2013 Enrollment
Office of Institutional Research and Effectiveness

Enrollment
Undergraduate Enrollment by Gender and Race
Fall 2009 Fall 2010 Fall 2011 Fall 2012 Fall 2013 5 Year ChangeNonresident Alien 15 27 19 31 4 ‐73.3%Black, Non Hispanic 862 894 816 687 780 ‐9.5%American Indian/Alaskan Native 3 2 4 0 3 0.0%Asian 5 1 2 5 10 100.0%Hispanic 19 14 17 16 18 ‐5.3%White, Non Hispanic 412 373 336 332 377 ‐8.5%Unknown 204 221 303 265 184 ‐9.8%Two or More Races 0 24 14 14 28Hawaiian or Pacific Islander 0 0 2 3 3Total Female 1,520 1,556 1,513 1,353 1,407 ‐7.4%Nonresident Alien 13 21 23 22 3 ‐76.9%Black, Non Hispanic 661 637 529 522 556 ‐15.9%American Indian/Alaskan Native 0 0 1 0 3Asian 4 2 4 3 7 75.0%Hispanic 15 14 12 4 12 ‐20.0%White, Non Hispanic 222 177 159 180 236 6.3%Unknown 203 184 234 203 125 ‐38.4%Two or More Races 0 13 14 8 20Hawaiian or Pacific Islander 0 2 1 1 1Total Male 1,118 1,050 977 943 963 ‐13.9%
Female
Male
Office of Institutional Research and Effectiveness

Enrollment
Undergraduate by Status and Class
Fall 2009 Fall 2010 Fall 2011 Fall 2012 Fall 2013 5 Year ChangeFreshman 1,068 1,127 956 740 795 ‐25.6%Sophomore 346 369 461 362 353 2.0%Junior 292 261 297 335 315 7.9%Senior 331 363 247 332 347 4.8%Non Degree 69 13 18 13 3 ‐95.7%Total Full‐Time 2,106 2,133 1,979 1,782 1,813 ‐13.9%Freshman 64 97 105 49 53 ‐17.2%Sophomore 42 51 63 73 51 21.4%Junior 52 52 50 62 53 1.9%Senior 131 119 84 131 164 25.2%Non Degree 134 94 191 69 22 ‐83.6%High School 109 60 18 130 214 96.3%Total Part‐Time 532 473 511 514 557 4.7%
Fall 2009 Fall 2010 Fall 2011 Fall 2012 Fall 2013 5 Year ChangeFirst‐Time (Full‐ and Part‐Time) Freshmen 540 635 558 397 537 ‐0.6%First‐Time Transfer 116 148 115 179 173 49.1%
Full‐Time
Part‐Time
Office of Institutional Research and Effectiveness

Enrollment
Undergraduate Enrollment by Residency
Fall 2009 Fall 2010 Fall 2011 Fall 2012 Fall 2013 5 Year ChangeIn‐State 1,554 1,423 1,366 1,287 1,374 ‐11.6%Out‐of‐State 1,084 1,183 1,124 1,009 996 ‐8.1%
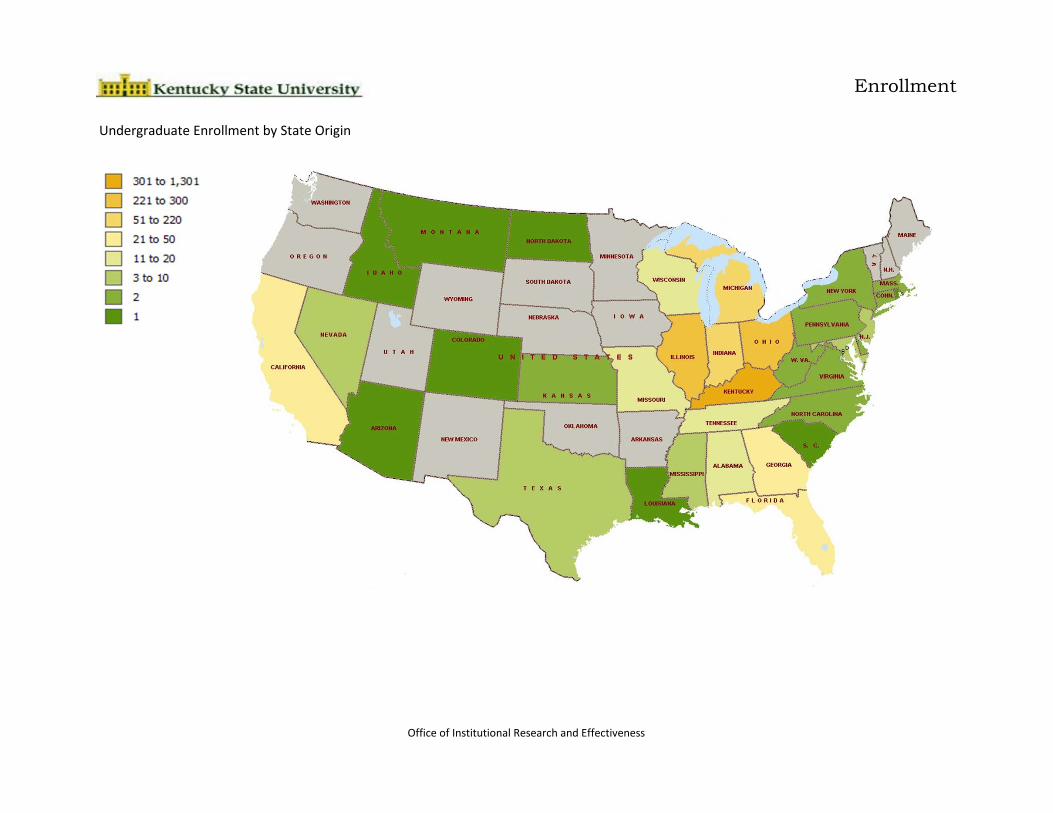
Undergraduate Enrollment by State Origin
Fall 2009 Fall 2010 Fall 2011 Fall 2012 Fall 2013 5 Year ChangeAlabama 5 10 9 7 18 260.0%Alaska 0 0 0 1 0Arizona 1 0 0 1 1 0.0%Arkansas 1 0 0 0 0 ‐100.0%California 18 22 27 21 34 88.9%Colorado 0 1 2 0 1Connecticut 3 3 2 2 2 ‐33.3%Delaware 2 3 0 0 2 0.0%District of Columbia 20 17 17 10 17 ‐15.0%Florida 21 21 18 13 38 81.0%Georgia 28 30 31 25 26 ‐7.1%Hawaii 0 0 0 0 1Idaho 0 0 0 0 1Illinois 184 233 260 172 232 26.1%Indiana 123 144 151 130 146 18.7%Kansas 1 1 0 0 2 100.0%Kentucky 1,446 1,316 1,317 1,362 1,301 ‐10.0%Louisiana 3 1 2 0 1 ‐66.7%Maryland 9 7 9 8 3 ‐66.7%
Office of Institutional Research and Effectiveness

Enrollment
Undergraduate Enrollment by State Origin
Fall 2009 Fall 2010 Fall 2011 Fall 2012 Fall 2013 5 Year ChangeMassachussetts 0 1 1 1 2Michigan 264 284 238 189 211 ‐20.1%Minnesota 1 1 1 1 0 ‐100.0%Mississippi 6 4 3 4 6 0.0%Missouri 36 34 21 14 17 ‐52.8%Montana 0 0 0 0 1Nebraska 0 2 1 0 0Nevada 0 2 2 3 3New Jersey 9 8 4 8 5 ‐44.4%New York 8 5 7 4 2 ‐75.0%North Carolina 9 5 1 1 2 ‐77.8%North Dakota 0 0 0 0 1Ohio 356 340 277 230 235 ‐34.0%Oregon 0 0 1 0 0Pennsylvania 0 4 1 2 2Rhode Island 0 1 0 0 1South Carolina 2 1 1 1 1 ‐50.0%South Dakota 1 0 0 0 0 ‐100.0%Tennessee 17 18 16 10 12 ‐29.4%Texas 6 9 5 4 10 66.7%Virginia 9 9 4 3 2 ‐77.8%Washington 0 0 1 4 0West Virginia 1 4 4 2 2 100.0%Wisconsin 15 14 14 10 12 ‐20.0%Armed Forces Overseas 0 0 0 0 2Foreign Countries 33 51 42 53 15 ‐54.5%
Office of Institutional Research and Effectiveness
Enrollment
Undergraduate Enrollment by State Origin
Office of Institutional Research and Effectiveness

Enrollment
Undergraduate Enrollment by Kentucky County Origin
Fall 2009 Fall 2010 Fall 2011 Fall 2012 Fall 2013 5 Year ChangeAdair 0 0 25 0 1Anderson 89 71 63 59 64 ‐28.1%Ballard 0 1 0 0 0Barren 0 1 1 2 4Bell 1 2 0 0 2 100.0%Boone 9 7 3 2 2 ‐77.8%Bourbon 0 0 5 7 5Boyd 5 5 0 0 2 ‐60.0%Boyle 8 9 8 10 9 12.5%Breathitt 1 0 0 0 0 ‐100.0%Bullitt 0 0 0 0 3Calloway 2 3 1 1 0 ‐100.0%Campbell 4 3 5 3 4 0.0%Carlisle 2 0 0 0 0 ‐100.0%Carroll 2 3 5 6 4 100.0%Christian 16 14 18 18 21 31.3%Clark 1 4 4 2 11 1000.0%Clay 0 1 0 0 0Clinton 1 0 0 0 0 ‐100.0%Critenden 2 2 1 1 1 ‐50.0%Daviess 5 3 4 2 3 ‐40.0%Estill 2 3 2 2 4 100.0%Fayette 137 125 120 149 129 ‐5.8%Fleming 1 1 0 0 0 ‐100.0%Floyd 2 1 4 2 2 0.0%Franklin 566 471 503 586 416 ‐26.5%
Office of Institutional Research and Effectiveness

Enrollment
Undergraduate Enrollment by Kentucky County Origin
Fall 2009 Fall 2010 Fall 2011 Fall 2012 Fall 2013 5 Year ChangeFulton 2 1 1 1 2 0.0%Gallatin 1 0 3 0 0 ‐100.0%Garrard 2 2 2 1 5 150.0%Grant 5 4 4 3 3 ‐40.0%Graves 3 3 3 0 0 ‐100.0%Grayson 0 0 0 0 3Green 0 0 1 0 1Greenup 1 1 1 0 0 ‐100.0%Hardin 14 11 11 4 10 ‐28.6%Harlan 1 1 2 1 2 100.0%Harrison 5 3 8 4 2 ‐60.0%Hart 2 0 0 1 1 ‐50.0%Henderson 5 3 2 2 4 ‐20.0%Henry 14 18 19 35 44 214.3%Hickman 0 2 1 0 0Hopkins 1 3 1 1 1 0.0%Jefferson 233 223 210 200 228 ‐2.1%Jessamine 58 40 14 14 43 ‐25.9%Johnson 1 1 0 1 1 0.0%Kenton 7 6 2 10 15 114.3%Knott 0 11 7 25 23Knox 0 3 0 0 1Larue 0 0 1 0 1Laurell 2 4 2 2 0 ‐100.0%Leslie 0 0 0 0 2Letcher 0 2 3 0 0
Office of Institutional Research and Effectiveness

Enrollment
Undergraduate Enrollment by Kentucky County Origin
Fall 2009 Fall 2010 Fall 2011 Fall 2012 Fall 2013 5 Year ChangeLewis 1 0 0 0 0 ‐100.0%Lincoln 0 0 0 1 2Logan 3 4 1 1 2 ‐33.3%McCracken 2 4 2 1 5 150.0%Madison 6 5 2 5 6 0.0%Martin 0 0 0 1 2Mason 3 1 1 0 0 ‐100.0%Meade 1 1 1 1 1 0.0%Menifee 0 0 0 0 1Mercer 3 3 12 12 12 300.0%Monroe 2 0 0 0 0 ‐100.0%Montgomery 1 2 4 2 3 200.0%Muhlenberg 0 0 0 1 0Nelson 3 4 6 4 1 ‐66.7%Nicholas 0 0 0 0 1Oldham 0 2 1 2 6Owen 48 46 32 19 26 ‐45.8%Owsley 0 0 0 0 1Pendleton 0 1 2 0 2Perry 2 2 10 5 2 0.0%Pike 1 0 0 0 0 ‐100.0%Powell 1 1 2 0 1 0.0%Pulaski 1 0 2 1 5 400.0%Rowan 0 0 1 0 1Russell 1 1 2 0 0 ‐100.0%Scott 20 27 39 40 45 125.0%
Office of Institutional Research and Effectiveness

Enrollment
Undergraduate Enrollment by Kentucky County Origin
Fall 2009 Fall 2010 Fall 2011 Fall 2012 Fall 2013 5 Year ChangeShelby 76 78 80 60 51 ‐32.9%Simpson 5 5 1 2 1 ‐80.0%Spencer 10 9 4 5 1 ‐90.0%Todd 0 0 0 0 1Trigg 1 0 0 0 1 0.0%Trimble 1 0 0 0 0 ‐100.0%Union 1 2 2 0 4 300.0%Warren 7 10 10 8 8 14.3%Washington 3 2 4 2 0 ‐100.0%Wayne 0 0 0 2 0Webster 0 0 1 0 0Whitley 1 0 1 1 3 200.0%Woodford 29 34 24 29 27 ‐6.9%Non Kentucky 1,192 1,290 1,173 934 1,069 ‐10.3%
Office of Institutional Research and Effectiveness

Enrollment
Undergraduate Enrollment by KSU Service Area
Fall 2009 Fall 2010 Fall 2011 Fall 2012 Fall 2013 5 Year ChangeAnderson 89 71 63 59 64 ‐28.1%Franklin 566 471 503 586 416 ‐26.5%Henry 14 18 19 35 44 214.3%Owen 48 46 32 19 26 ‐45.8%Scott 20 27 39 40 45 125.0%Shelby 76 78 80 60 51 ‐32.9%Total Enrollment from Service Area 813 711 736 799 646 ‐20.5%
SERVICE AREA
Public Four‐Year Postsecondary Institutions
Office of Institutional Research and Effectiveness

Enrollment
Undergraduate Foreign Enrollment by Country Origin
Fall 2009 Fall 2010 Fall 2011 Fall 2012 Fall 2013 5 Year ChangeBahamas 1 1 0 1 0 ‐100.0%Bangladesh 1 0 0 0 0 ‐100.0%Canada 0 1 0 0 0China 5 2 3 7 4 ‐20.0%Cameroon 1 2 1 2 1 0.0%Dominican Rep 0 3 0 0 0El Savador 0 3 0 0 0Gambia 5 3 0 1 0 ‐100.0%Ghana 2 0 0 1 1 ‐50.0%Guatemala 0 2 0 0 0Haiti 1 4 0 0 0 ‐100.0%Honduras 0 2 0 0 0Kenya 1 1 2 0 0 ‐100.0%Korea, Rep 10 17 31 37 7 ‐30.0%Kuwait 1 1 0 0 0 ‐100.0%Mexico 1 2 0 0 0 ‐100.0%Nigeria 2 1 1 1 1 ‐50.0%Nicaragua 0 3 0 0 0Zambia 0 1 1 1 1Srilanka 0 0 1 0 0Ethiopia 1 1 0 1 0 ‐100.0%Netherland 0 0 1 0 0Nepal 0 1 1 0 0Switzerland 1 0 0 0 0 ‐100.0%Tanzania 0 0 0 1 0
Office of Institutional Research and Effectiveness

Enrollment
Undergraduate Enrollment by Age
Fall 2009 Fall 2010 Fall 2011 Fall 2012 Fall 2013 5 Year ChangeTraditional (Under age of 25 years old) 1,996 2,024 1,929 1,801 1,887 ‐5.5%Non Traditional (Age 25 and older) 642 582 561 488 477 ‐25.7%
Undergraduate Enrollment by Degree Seeking
Fall 2009 Fall 2010 Fall 2011 Fall 2012 Fall 2013 5 Year ChangeAssociate 317 373 309 271 269 ‐15.1%Bachelor (including Undeclared) 2,009 2,066 1,954 1,813 1,862 ‐7.3%Non Degree 312 167 227 212 239 ‐23.4%
0
500
1,000
1,500
2,000
2,500
Fall 2009 Fall 2010 Fall 2011 Fall 2012 Fall 2013
Undergraduate Enrollment by Degree Seeking
Associate Bachelor
0
500
1,000
1,500
2,000
2,500
Fall 2009 Fall 2010 Fall 2011 Fall 2012 Fall 2013
Undergraduate Enrollment by Age
Traditional Non Traditional
Office of Institutional Research and Effectiveness

Enrollment
Undergraduate Enrollment by Major
Fall 2009 Fall 2010 Fall 2011 Fall 2012 Fall 2013 5 Year ChangeAgriculture 0 0 0 0 34African Studies 0 1 2 0 3Mass Communication & Journalism 65 89 96 100 105 61.5%Computer Sciences 66 67 48 53 67 1.5%Information Technology 39 42 34 24 27 ‐30.8%Elementary Education 158 168 148 115 116 ‐26.6%Physical Education 96 98 90 87 108 12.5%Electronic Technology 13 13 6 5 1 ‐92.3%Drafting 8 8 8 3 2 ‐75.0%Spanish 0 1 0 5 2Child Development 38 26 31 33 44 15.8%English 43 40 36 34 33 ‐23.3%Liberal Arts 77 85 38 45 44 ‐42.9%Biology 131 152 140 126 102 ‐22.1%Mathematics 60 61 50 42 36 ‐40.0%Chemistry 16 24 17 15 21 31.3%Psychology 143 156 139 124 138 ‐3.5%Criminal Justice 157 179 172 163 177 12.7%Public Administration 22 34 30 26 27 22.7%Social Work 57 55 66 58 78 36.8%Social Sciences 26 27 29 33 39 50.0%Political Sciences 32 36 34 23 18 ‐43.8%Arts 22 27 18 20 27 22.7%Music 66 58 49 32 42 ‐36.4%Nursing 315 355 332 296 325 3.2%Business 316 294 241 210 225 ‐28.8%Undeclared 360 343 409 412 290 ‐19.4%
Office of Institutional Research and Effectiveness

Enrollment
Graduate Enrollment
Fall 2009 Fall 2010 Fall 2011 Fall 2012 Fall 2013 5 Year ChangeGR Degree Seeking 181 233 238 219 154 ‐14.9%GR Non Degree Seeking 15 12 18 9 9 ‐40.0%Total Graduate Enrollment 196 245 256 228 163 ‐16.8%
Fall 2013Total Enrollme 2,533Graduate 163Undergraduate 2,370
0
100
200
300
Fall 2009 Fall 2010 Fall 2011 Fall 2012 Fall 2013
Graduate Enrollment
Graduate6%
Undergraduate94%
Fall 2013 Enrollment
Office of Institutional Research and Effectiveness
Enrollment
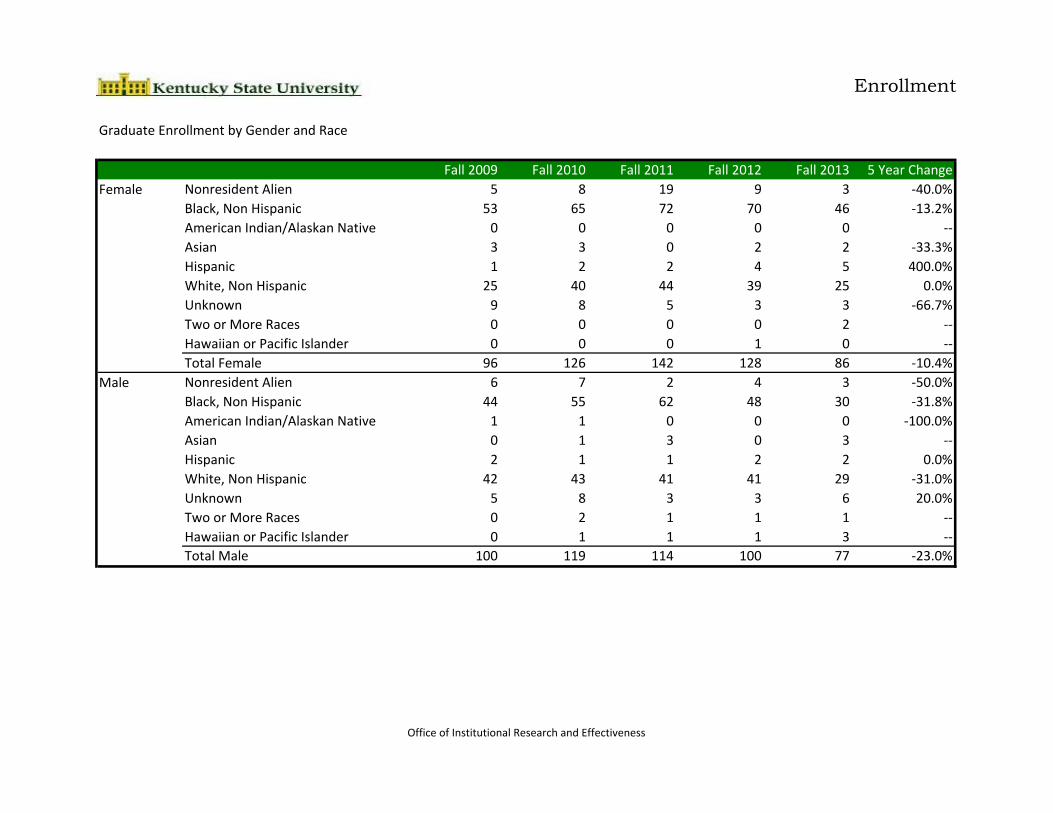
Graduate Enrollment by Gender and Race
Fall 2009 Fall 2010 Fall 2011 Fall 2012 Fall 2013 5 Year ChangeNonresident Alien 5 8 19 9 3 ‐40.0%Black, Non Hispanic 53 65 72 70 46 ‐13.2%American Indian/Alaskan Native 0 0 0 0 0 ‐‐Asian 3 3 0 2 2 ‐33.3%Hispanic 1 2 2 4 5 400.0%White, Non Hispanic 25 40 44 39 25 0.0%Unknown 9 8 5 3 3 ‐66.7%Two or More Races 0 0 0 0 2 ‐‐Hawaiian or Pacific Islander 0 0 0 1 0 ‐‐Total Female 96 126 142 128 86 ‐10.4%Nonresident Alien 6 7 2 4 3 ‐50.0%Black, Non Hispanic 44 55 62 48 30 ‐31.8%American Indian/Alaskan Native 1 1 0 0 0 ‐100.0%Asian 0 1 3 0 3 ‐‐Hispanic 2 1 1 2 2 0.0%White, Non Hispanic 42 43 41 41 29 ‐31.0%Unknown 5 8 3 3 6 20.0%Two or More Races 0 2 1 1 1 ‐‐Hawaiian or Pacific Islander 0 1 1 1 3 ‐‐Total Male 100 119 114 100 77 ‐23.0%
Female
Male
Office of Institutional Research and Effectiveness

Enrollment
Graduate by Residency and Status
Fall 2009 Fall 2010 Fall 2011 Fall 2012 Fall 2013 5 Year ChangeFull‐Time 85 107 88 69 51 ‐40.0%Part‐Time 87 108 123 104 76 ‐12.6%Total In‐State 172 215 211 173 127 ‐26.2%Full‐Time 13 16 29 42 23 76.9%Part‐Time 11 14 16 13 13 18.2%Total Out‐of‐State 24 30 45 55 36 50.0%Full‐Time 98 123 117 111 74 ‐24.5%Part‐Time 98 122 139 117 89 ‐9.2%Total Graduate Enrollment 196 245 256 228 163 ‐16.8%
Out‐of‐State
Total
In‐State
0
20
40
60
80
100
120
140
160
Fall 2009 Fall 2010 Fall 2011 Fall 2012 Fall 2013
Graduate Enrollment by Gender
Female Male
0
20
40
60
80
100
120
140
160
Fall 2009 Fall 2010 Fall 2011 Fall 2012 Fall 2013
Graduate Enrollment by Status
Full‐Time Part‐Time
Office of Institutional Research and Effectiveness

Enrollment
Graduate Enrollment by State Origin
Fall 2009 Fall 2010 Fall 2011 Fall 2012 Fall 2013 5 Year ChangeAlabama 3 1 0 0 1 ‐66.7%Arizona 0 0 1 0 1 ‐‐Arkansas 1 0 1 1 0 ‐100.0%California 2 0 0 1 0 ‐100.0%District of Columbia 1 1 0 0 0 ‐100.0%Florida 1 0 0 1 3 200.0%Georgia 3 3 1 0 2 ‐33.3%Illinois 4 3 4 3 7 75.0%Indiana 5 6 2 1 2 ‐60.0%Kansas 1 0 0 0 0 ‐100.0%Kentucky 111 155 199 188 119 7.2%Maine 0 0 0 0 1 ‐‐Maryland 2 4 4 1 1 ‐50.0%Michigan 5 9 6 4 5 0.0%Minnesota 0 0 1 0 0 ‐‐Mississippi 2 1 1 1 0 ‐100.0%Missouri 0 1 0 1 1 ‐‐New Jersey 1 1 0 0 0 ‐100.0%New York 3 0 0 0 1 ‐66.7%North Carolina 2 1 2 0 1 ‐50.0%Ohio 18 26 11 9 3 ‐83.3%Pennsylvania 0 1 1 0 0 ‐‐South Carolina 0 1 0 0 1 ‐‐South Dakota 2 1 0 3 1 ‐50.0%Tennessee 2 2 0 0 2 0.0%
Office of Institutional Research and Effectiveness

Enrollment
Graduate Enrollment by State Origin
Fall 2009 Fall 2010 Fall 2011 Fall 2012 Fall 2013 5 Year ChangeTexas 2 0 0 0 0 ‐100.0%Virginia 0 1 0 0 0 ‐‐West Virginia 1 2 0 0 0 ‐100.0%Wisconsin 0 1 0 0 1 ‐‐
Office of Institutional Research and Effectiveness

Enrollment
Graduate Enrollment by Kentucky County Origin
Fall 2009 Fall 2010 Fall 2011 Fall 2012 Fall 2013 5 Year ChangeAllen 0 1 1 0 0 ‐‐Anderson 3 6 11 13 9 200.0%Boone 1 2 1 1 1 0.0%Boyd 1 1 0 0 0 ‐100.0%Boyle 1 0 0 0 1 0.0%Bullitt 0 0 0 1 0 ‐‐Christian 4 4 1 2 1 ‐75.0%Clark 0 1 2 1 0 ‐‐Daviess 1 2 0 0 0 ‐100.0%Estill 0 0 0 1 1 ‐‐Fayette 18 29 40 28 25 38.9%Franklin 30 40 73 97 53 76.7%Hardin 0 1 1 0 0 ‐‐Harrison 1 1 1 0 0 ‐100.0%Henderson 1 1 0 0 0 ‐100.0%Henry 4 3 5 1 0 ‐100.0%Hopkins 1 1 0 0 0 ‐100.0%Jefferson 22 34 31 21 13 ‐40.9%Jessamine 1 1 1 0 0 ‐100.0%Johnson 1 0 0 0 0 ‐100.0%Kenton 0 4 1 1 2 ‐‐Lawrence 1 1 0 0 0 ‐100.0%Letcher 1 1 0 1 0 ‐100.0%Logan 0 0 1 1 1 ‐‐McCracken 1 1 1 0 0 ‐100.0%Madison 0 1 0 2 1 ‐‐Martin 0 0 1 0 0 ‐‐Meade 0 0 1 0 0 ‐‐
Office of Institutional Research and Effectiveness

Enrollment
Graduate Enrollment by Kentucky County Origin
Fall 2009 Fall 2010 Fall 2011 Fall 2012 Fall 2013 5 Year ChangeMenifee 1 0 0 0 0 ‐100.0%Mercer 0 0 1 0 0 ‐‐Montgomery 0 0 1 0 2 ‐‐Oldham 1 0 1 0 0 ‐100.0%Owen 2 3 2 0 1 ‐50.0%Pike 0 1 0 1 1 ‐‐Scott 4 5 7 3 3 ‐25.0%Shelby 3 6 8 4 3 0.0%Spencer 0 0 2 2 0 ‐‐Trigg 3 0 0 0 0 ‐100.0%Warren 1 2 0 2 0 ‐100.0%Washington 0 0 0 1 0 ‐‐Webster 1 0 0 0 0 ‐100.0%Woodford 2 2 4 4 1 ‐50.0%Non Kentucky 85 90 57 40 44 ‐48.2%
Office of Institutional Research and Effectiveness

Enrollment
Graduate Foreign Enrollment by Country Origin
Fall 2009 Fall 2010 Fall 2011 Fall 2012 Fall 2013 5 Year ChangeBahamas 0 0 2 0 0 ‐‐Belize 0 0 0 1 1 ‐‐Burma 1 0 0 0 0 ‐100.0%Canada 1 0 0 0 0 ‐100.0%Congo 0 1 0 0 0 ‐‐China 2 1 1 1 1 ‐50.0%Cameroon 3 0 0 0 0 ‐100.0%Colombia 1 1 0 0 0 ‐100.0%Gambia 0 2 2 1 0 ‐‐Ghana 1 2 0 0 1 0.0%Guyana 1 1 0 0 0 ‐100.0%Indonesia 1 0 0 0 1 0.0%India 2 8 10 4 1 ‐50.0%Jamaica 2 0 0 0 0 ‐100.0%Kenya 0 0 0 1 1 ‐‐Kuwait 0 1 0 0 0 ‐‐Lithuania 1 0 0 0 0 ‐100.0%Libya 0 0 0 0 1 ‐‐Mexico 1 0 0 0 0 ‐100.0%Nigeria 2 1 3 1 0 ‐100.0%Peru 1 0 0 0 0 ‐100.0%Philippines 1 0 0 1 1 0.0%Puerto Rico 0 0 0 0 1 ‐‐Saudi Arabia 1 1 0 0 0 ‐100.0%Senegal 1 0 0 0 0 ‐100.0%
Office of Institutional Research and Effectiveness

Enrollment
Graduate Foreign Enrollment by Country Origin
Fall 2009 Fall 2010 Fall 2011 Fall 2012 Fall 2013 5 Year ChangeTaiwan 0 0 0 1 1 ‐‐Ethiopia 0 1 0 0 0 ‐‐Iraq 0 1 0 0 0 ‐‐Japan 0 0 0 1 0 ‐‐Lebanon 0 1 0 0 0 ‐‐Nepal 1 2 3 1 0 ‐100.0%Spain 0 0 0 1 0 ‐‐Virgin Islands 0 0 1 0 0 ‐‐
Office of Institutional Research and Effectiveness

Enrollment
Graduate Enrollment by Major
Fall 2009 Fall 2010 Fall 2011 Fall 2012 Fall 2013 5 Year ChangeEnvironmental Studies 0 16 22 15 19 ‐‐Aquaculture 10 15 13 11 11 10.0%Computer Sciences 26 35 36 30 27 3.8%Special Education 69 75 74 60 27 ‐60.9%Public Administration 54 69 76 81 56 3.7%Business Administration 22 23 17 22 14 ‐36.4%
0
10
20
30
40
50
60
70
80
90
Fall 2009 Fall 2010 Fall 2011 Fall 2012 Fall 2013
Graduate Enrollment
Environmental Studies Aquaculture Computer Sciences Special Education Public Administration Business Administration
Office of Institutional Research and Effectiveness

Enrollment
Total Enrollment
Level Fall 2009 Fall 2010 Fall 2011 Fall 2012 Fall 2013 5‐Yr ChangeUndergraduate 2,638 2,606 2,490 2,296 2,370 ‐10.2%Graduate 196 245 256 228 163 ‐16.8%Total Enrollment 2,834 2,851 2,746 2,524 2,533 ‐10.6%
Five Year Enrollment Growth Among Kentucky Public Institutions
Institution Fall 2009 Fall 2010 Fall 2011 Fall 2012 Fall 2013 5‐Yr ChangeEastern Kentucky University 16,268 16,567 16,062 15,968 16,111 ‐1.0%Kentucky State University 2,834 2,851 2,746 2,524 2,533 ‐10.6%Morehead State University 9,046 8,842 10,971 11,172 11,358 25.6%Murray State University 10,078 10,416 10,623 10,832 10,943 8.6%Northern Kentucky University 15,405 15,748 15,738 15,634 15,263 ‐0.9%University of Kentucky 27,171 28,037 28,094 28,034 29,385 8.1%University of Louisville 22,031 22,290 22,249 22,293 21,447 ‐2.7%Western Kentucky University 20,712 20,903 21,048 21,110 20,448 ‐1.3%
2009‐2010 2010‐2011 2011‐2012 2012‐2013EKU 1.8% ‐3.0% ‐0.6% 0.9%KSU 0.6% ‐3.7% ‐8.1% 0.4%MoSU ‐2.3% 24.1% 1.8% 1.7%MuSU 3.4% 2.0% 2.0% 1.0%NKU 2.2% ‐0.1% ‐0.7% ‐2.4%UK 3.2% 0.2% ‐0.2% 4.8%UL 1.2% ‐0.2% 0.2% ‐3.8%WKU 0.9% 0.7% 0.3% ‐3.1%
Annual Percent Change
KSU
MoSU
UK
‐10.0%
0.0%
10.0%
20.0%
30.0%
2009‐2010 2010‐2011 2011‐2012 2012‐2013
Annual Percent Change
Office of Institutional Research and Effectiveness

Enrollment
Total Enrollment by Gender and Race
Gender Race Fall 2009 Fall 2010 Fall 2011 Fall 2012 Fall 2013 5‐Yr ChangeNonresident Alien 20 35 38 40 7 ‐65.0%Black, Non Hispanic 915 959 888 757 826 ‐9.7%American Indian/Alaskan Native 3 2 4 0 3 0.0%Asian 8 4 2 7 12 50.0%Hispanic 20 16 19 20 23 15.0%White, Non Hispanic 437 413 380 371 402 ‐8.0%Unknown 213 229 308 268 187 ‐12.2%Two or More Races 0 24 14 14 30Hawaiian or Pacific Islander 0 0 2 4 3Total Female 1,616 1,682 1,655 1,481 1,493 ‐7.6%Nonresident Alien 19 28 25 26 6 ‐68.4%Black, Non Hispanic 705 692 591 570 586 ‐16.9%American Indian/Alaskan Native 1 1 1 0 3 200.0%Asian 4 3 7 3 10 150.0%Hispanic 17 15 13 6 14 ‐17.6%White, Non Hispanic 264 220 200 221 265 0.4%Unknown 208 192 237 206 131 ‐37.0%Two or More Races 0 15 15 9 21Hawaiian or Pacific Islander 0 3 2 2 4Total Male 1,218 1,169 1,091 1,043 1,040 ‐14.6%
Female
Male
Office of Institutional Research and Effectiveness

Enrollment
Total Enrollment by Gender and Race
Gender Race Fall 2009 Fall 2010 Fall 2011 Fall 2012 Fall 2013 5‐Yr ChangeNonresident Alien 39 63 63 66 13 ‐66.7%Black, Non Hispanic 1,620 1,651 1,479 1,327 1,412 ‐12.8%American Indian/Alaskan Native 4 3 5 0 6 50.0%Asian 12 7 9 10 22 83.3%Hispanic 37 31 32 26 37 0.0%White, Non Hispanic 701 633 580 592 667 ‐4.9%Unknown 421 421 545 474 318 ‐24.5%Two or More Races 0 39 29 23 51Hawaiian or Pacific Islander 0 3 4 6 7Total Enrollment 2,834 2,851 2,746 2,524 2,533 ‐10.6%
Fall 2009 Fall 2010 Fall 2011 Fall 2012 Fall 2013Black 1620 1,651 1,479 1,327 1,412White 701 633 580 592 667Hispanic 37 31 32 26 37Asian 12 7 9 10 22Other Races 464 529 646 569 395
Other Races 513 567 687 605 454
Total
0
300
600
900
1200
1500
1800
Fall 2009 Fall 2010 Fall 2011 Fall 2012 Fall 2013
Enrollment by Race
Black White Other Races
Black56%White
26%
Hispanic1%
Asian1%
Other Races16%
Fall 2013 Enrollment
Office of Institutional Research and Effectiveness

Enrollment
Total Enrollment by Residency and Status
Residency Status Fall 2009 Fall 2010 Fall 2011 Fall 2012 Fall 2013 5‐Yr ChangeFull‐Time 1,157 1,137 1,034 934 922 ‐20.3%Part‐Time 569 501 543 526 579 1.8%Total In‐State 1,726 1,638 1,577 1,460 1,501 ‐13.0%Full‐Time 1,047 1,119 1,062 959 965 ‐7.8%Part‐Time 61 94 107 105 67 9.8%Total Out‐of‐State 1,108 1,213 1,169 1,064 1,032 ‐6.9%Full‐Time 2,204 2,256 2,096 1,893 1,887 ‐14.4%Part‐Time 630 595 650 631 646 2.5%Total Enrollment 2,834 2,851 2,746 2,524 2,533 ‐10.6%
Total
In‐State
Out‐of‐State
0
400
800
1,200
1,600
2,000
Fall 2009 Fall 2010 Fall 2011 Fall 2012 Fall 2013
Enrollment by Residency
In‐State Out‐of‐State
0
500
1,000
1,500
2,000
2,500
Fall 2009 Fall 2010 Fall 2011 Fall 2012 Fall 2013
Enrollment by Status
Full‐Time Part‐Time
Office of Institutional Research and Effectiveness

Enrollment
Full‐Time Equivalent (FTE)
There are several different techniques used to calculate the Full‐Time Equivalent (FTE). Kentucky Council on Postsecondary Education (CPE) has been using the formula (1) in the past, but since Fall 2010 CPE started using the new formula (2). Combining the enrollment number with credit hours, formula (3) is used to illustrate the actual FTE, while the Federal IPEDS uses different technique as describe in formula (4).
(1) CPE old formula FTE = Full‐Time enrollment + 1/3 Part‐Time enrollment
Fall 2009 Fall 2010 Fall 2011 Fall 2012 Fall 2013 5‐Yr ChangeFull‐Time Headcount 2,106 2,133 1,979 1,782 1,813Part‐Time Headcount 532 473 511 514 557Undergraduate FTE 2,284 2,291 2,150 1,954 1,999 ‐12.5%Full‐Time Headcount 98 123 117 111 74Part‐Time Headcount 98 122 139 117 89Graduate FTE 131 164 164 150 104 ‐20.6%Full‐Time Headcount 2,204 2,256 2,096 1,893 1,887Part‐Time Headcount 630 595 650 631 646Total FTE 2,414 2,455 2,313 2,104 2,103 ‐12.9%
(2) CPE new formula FTE = (undergraduate student credit hours/15) + (graduate student credit hours/12)
Fall 2009 Fall 2010 Fall 2011 Fall 2012 Fall 2013 5‐Yr ChangeStudent Credit Hours 32,389 32,907 30,478 27,941 29,036Undergraduate FTE 2,159 2,194 2,032 1,863 1,936 ‐10.4%Student Credit Hours 1,466 1,847 1,862 1,676 1,164Graduate FTE 122 154 155 140 97 ‐20.6%Student Credit Hours 33,855 34,754 32,340 29,617 30,200Total FTE 2,281 2,348 2,187 2,002 2,033 ‐10.9%
Undergraduate
Graduate
Total
Undergraduate
Graduate
Total
Office of Institutional Research and Effectiveness

Enrollment
Full‐Time Equivalent (FTE)
(3) Actual FTE formula FTE = Full‐Time enrollment + (undergraduate part‐time credit hours/12) + (graduate part‐time credit hours/9)
Fall 2009 Fall 2010 Fall 2011 Fall 2012 Fall 2013 5‐Yr ChangeFull‐Time Headcount 2,106 2,133 1,979 1,782 1,813Part‐Time Credit Hours 2,810 2,881 2,933 2,748 3,021Undergraduate FTE 2,340 2,373 2,223 2,011 2,065 ‐11.8%Full‐Time Headcount 98 123 117 111 74Part‐Time Credit Hours 489 617 724 614 452Graduate FTE 152 192 197 179 124 ‐18.5%Full‐Time Headcount 2,204 2,256 2,096 1,893 1,887Part‐Time Proportion 288 309 325 297 302Total FTE 2,492 2,565 2,421 2,190 2,189 ‐12.2%
(4) Federal IPEDS FTE formula FTE = Undergraduate Full‐Time Enrollment + 0.403543 Undergraduate Part‐Time Enrollment + Graduate Full‐Time Enrollment + 0.361702 Graduate Part‐Time Enrollment
Fall 2009 Fall 2010 Fall 2011 Fall 2012 Fall 2013 5‐Yr ChangeFull‐Time Headcount 2,106 2,133 1,979 1,782 1,813Part‐Time Headcount 532 473 511 514 557Undergraduate FTE 2,321 2,324 2,186 1,990 2,038 ‐12.2%Full‐Time Headcount 98 123 117 111 74Part‐Time Headcount 98 122 139 117 89Graduate FTE 134 168 168 154 107 ‐20.1%Full‐Time Headcount 2,204 2,256 2,096 1,893 1,887Part‐Time Headcount 630 595 650 631 646Total FTE 2,455 2,492 2,353 2,143 2,144 ‐12.7%
Total
Undergraduate
Graduate
Total
Undergraduate
Graduate
Office of Institutional Research and Effectiveness

Student Credit Hours
Undergraduate Student Credit Hours
Course Subject Fall 2009 Fall 2010 Fall 2011 Fall 2012 Fall 2013 5 Year ChangeAAS African American Studies 0.0 9.0 0.0 0.0 0.0 ‐‐ACC Accounting 345.0 387.0 303.0 261.0 279.0 ‐19.1%AFE Agriculture, Food, and Environment 0.0 0.0 0.0 69.0 226.0 ‐‐AFS Air Force Studies 16.0 14.0 0.0 0.0 1.0 ‐93.8%AMS Army Military Studies 20.0 11.0 6.0 5.0 10.0 ‐50.0%AQU Aquaculture 30.0 52.0 34.0 51.0 133.0 343.3%ART Aquaculture 666.0 630.0 588.0 534.0 703.0 5.6%ASL American Sign Language 108.0 120.0 153.0 141.0 120.0 11.1%ASP American Sign Language 0.0 9.0 21.0 0.0 0.0 ‐‐BIO Biology 1,581.0 1,559.0 1,443.0 1,476.0 1,339.0 ‐15.3%BUA Business Administration 482.0 650.0 426.0 371.0 591.0 22.6%CDF Child Development & Family Rel. 273.0 252.0 219.0 318.0 366.0 34.1%CHE Chemistry 455.0 367.0 353.0 440.0 543.0 19.3%CIT Applied Information Technology 405.0 408.0 372.0 291.0 267.0 ‐34.1%CJE Criminal Justice 609.0 903.0 1,062.0 1,176.0 1,149.0 88.7%CLE Credit for Life Experience 18.0 36.0 33.0 42.0 24.0 33.3%COE Cooperative Education 337.0 466.0 330.0 231.0 345.0 2.4%COS Communication 605.0 734.0 770.0 522.0 687.0 13.6%ECO Economics 570.0 441.0 459.0 405.0 399.0 ‐30.0%EDU Education 1,102.0 1,001.0 807.0 613.0 492.0 ‐55.4%ENG English 5,880.0 6,054.0 5,229.0 4,395.0 4,197.0 ‐28.6%ESL English 225.0 84.0 216.0 0.0 0.0 ‐100.0%FIN Finance 63.0 60.0 228.0 240.0 225.0 257.1%FNU Foods and Nutrition 208.0 75.0 138.0 45.0 57.0 ‐72.6%FRE French 129.0 132.0 114.0 153.0 0.0 ‐100.0%GEO Geology 42.0 90.0 66.0 15.0 60.0 42.9%
Office of Institutional Research and Effectiveness

Student Credit Hours
Undergraduate Student Credit Hours
Course Subject Fall 2009 Fall 2010 Fall 2011 Fall 2012 Fall 2013 5 Year ChangeGNT Gerontology 0.0 75.0 78.0 114.0 69.0 ‐‐HED Health Education 386.0 332.0 352.0 392.0 196.0 ‐49.2%HIS History 600.0 747.0 681.0 642.0 783.0 30.5%HON Honors Core 696.0 784.0 750.0 486.0 763.0 9.6%IGS Integrative Studies 1,494.0 1,395.0 1,362.0 1,311.0 1,323.0 ‐11.4%JOU Journalism 144.0 228.0 273.0 480.0 504.0 250.0%LST Liberal Studies ‐ Honors 134.0 144.0 92.0 100.0 67.0 ‐50.0%MAT Mathematics 3,939.0 3,701.0 3,432.0 2,825.0 3,055.0 ‐22.4%MGT Management 252.0 330.0 282.0 234.0 153.0 ‐39.3%MIS Management Information Systems 69.0 111.0 60.0 42.0 75.0 8.7%MKT Marketing 153.0 156.0 234.0 120.0 129.0 ‐15.7%MUA Music ‐ Applied 90.0 56.0 50.0 4.0 50.5 ‐43.9%MUC Music ‐ Class Instruction 26.0 58.0 31.0 26.0 31.0 19.2%MUE Music Education 58.0 56.0 28.0 30.0 45.0 ‐22.4%MUI Music Industry 0.0 6.0 0.0 9.0 18.0 ‐‐MUP Music ‐ Performance Ensemble 208.0 268.0 204.0 177.0 135.0 ‐35.1%MUS Music 571.0 562.0 546.0 534.0 586.0 2.6%NUR Nursing 1,045.0 1,067.0 1,245.0 1,262.0 1,288.0 23.3%PHE Physical Education 710.0 534.0 483.0 516.0 576.0 ‐18.9%PHI Philosophy 69.0 54.0 75.0 21.0 36.0 ‐47.8%PHS Physical Sciences 147.0 234.0 213.0 225.0 216.0 46.9%PHY Physics 197.0 196.0 165.0 145.0 130.0 ‐34.0%POS Political Science 762.0 732.0 717.0 636.0 723.0 ‐5.1%PSY Psychology 1,464.0 1,527.0 1,281.0 1,519.0 1,797.0 22.7%PUA Psychology 306.0 189.0 252.0 171.0 189.0 ‐38.2%REC Recreation 72.0 105.0 78.0 63.0 0.0 ‐100.0%
Office of Institutional Research and Effectiveness

Student Credit Hours
Undergraduate Student Credit Hours
Course Subject Fall 2009 Fall 2010 Fall 2011 Fall 2012 Fall 2013 5 Year ChangeSOC Sociology 606.0 663.0 657.0 573.0 570.0 ‐5.9%SOW Social Work 480.0 495.0 486.0 579.0 699.0 45.6%SPA Spanish 999.0 942.0 828.0 786.0 717.0 ‐28.2%SPE Speech 807.0 981.0 816.0 972.0 804.0 ‐0.4%THE Theatre 156.0 162.0 201.0 186.0 180.0 15.4%UNV University Orientation 1,583.0 1,437.0 1,142.0 943.0 900.0 ‐43.1%Total 32,392.0 32,871.0 30,464.0 27,917.0 29,020.5 ‐10.4%
Graduate Student Credit Hours
Course Subject Fall 2009 Fall 2010 Fall 2011 Fall 2012 Fall 2013 5 Year ChangeACC Accounting 27.0 0.0 18.0 15.0 0.0 ‐100.0%AQU Aquaculture 116.0 119.0 139.0 119.0 141.0 21.6%BUA Business Administration 12.0 0.0 0.0 42.0 0.0 ‐100.0%COS Communication 201.0 261.0 261.0 213.0 222.0 10.4%ECO Economics 18.0 45.0 24.0 15.0 0.0 ‐100.0%ENV English 0.0 123.0 192.0 126.0 141.0 ‐‐ESP Special Education 618.0 705.0 612.0 522.0 195.0 ‐68.4%FIN Finance 30.0 45.0 18.0 27.0 9.0 ‐70.0%MGT Management 54.0 54.0 24.0 45.0 60.0 11.1%MKT Marketing 3.0 0.0 0.0 0.0 0.0 ‐100.0%PUA Psychology 384.0 531.0 588.0 576.0 411.0 7.0%Total 1,463.0 1,883.0 1,876.0 1,700.0 1,179.0 ‐19.4%
Office of Institutional Research and Effectiveness
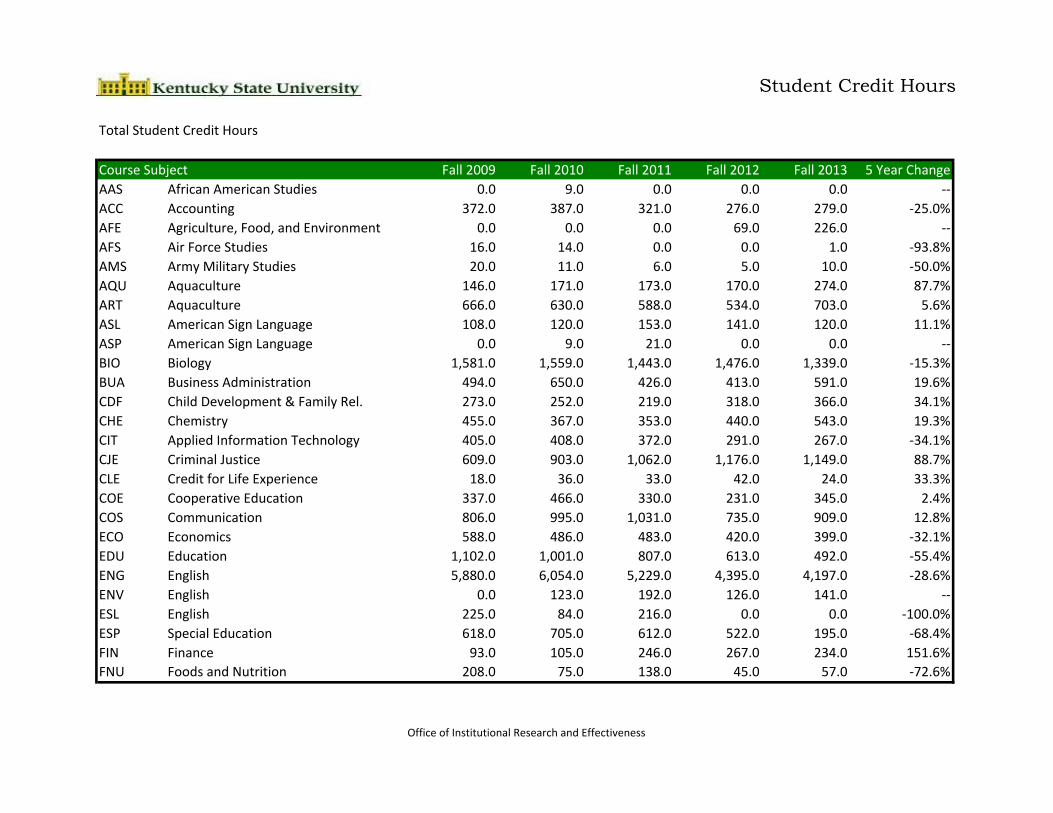
Student Credit Hours
Total Student Credit Hours
Course Subject Fall 2009 Fall 2010 Fall 2011 Fall 2012 Fall 2013 5 Year ChangeAAS African American Studies 0.0 9.0 0.0 0.0 0.0 ‐‐ACC Accounting 372.0 387.0 321.0 276.0 279.0 ‐25.0%AFE Agriculture, Food, and Environment 0.0 0.0 0.0 69.0 226.0 ‐‐AFS Air Force Studies 16.0 14.0 0.0 0.0 1.0 ‐93.8%AMS Army Military Studies 20.0 11.0 6.0 5.0 10.0 ‐50.0%AQU Aquaculture 146.0 171.0 173.0 170.0 274.0 87.7%ART Aquaculture 666.0 630.0 588.0 534.0 703.0 5.6%ASL American Sign Language 108.0 120.0 153.0 141.0 120.0 11.1%ASP American Sign Language 0.0 9.0 21.0 0.0 0.0 ‐‐BIO Biology 1,581.0 1,559.0 1,443.0 1,476.0 1,339.0 ‐15.3%BUA Business Administration 494.0 650.0 426.0 413.0 591.0 19.6%CDF Child Development & Family Rel. 273.0 252.0 219.0 318.0 366.0 34.1%CHE Chemistry 455.0 367.0 353.0 440.0 543.0 19.3%CIT Applied Information Technology 405.0 408.0 372.0 291.0 267.0 ‐34.1%CJE Criminal Justice 609.0 903.0 1,062.0 1,176.0 1,149.0 88.7%CLE Credit for Life Experience 18.0 36.0 33.0 42.0 24.0 33.3%COE Cooperative Education 337.0 466.0 330.0 231.0 345.0 2.4%COS Communication 806.0 995.0 1,031.0 735.0 909.0 12.8%ECO Economics 588.0 486.0 483.0 420.0 399.0 ‐32.1%EDU Education 1,102.0 1,001.0 807.0 613.0 492.0 ‐55.4%ENG English 5,880.0 6,054.0 5,229.0 4,395.0 4,197.0 ‐28.6%ENV English 0.0 123.0 192.0 126.0 141.0 ‐‐ESL English 225.0 84.0 216.0 0.0 0.0 ‐100.0%ESP Special Education 618.0 705.0 612.0 522.0 195.0 ‐68.4%FIN Finance 93.0 105.0 246.0 267.0 234.0 151.6%FNU Foods and Nutrition 208.0 75.0 138.0 45.0 57.0 ‐72.6%
Office of Institutional Research and Effectiveness

Student Credit Hours
Total Student Credit Hours
Course Subject Fall 2009 Fall 2010 Fall 2011 Fall 2012 Fall 2013 5 Year ChangeFRE French 129.0 132.0 114.0 153.0 0.0 ‐100.0%GEO Geology 42.0 90.0 66.0 15.0 60.0 42.9%GNT Gerontology 0.0 75.0 78.0 114.0 69.0 ‐‐HED Health Education 386.0 332.0 352.0 392.0 196.0 ‐49.2%HIS History 600.0 747.0 681.0 642.0 783.0 30.5%HON Honors Core 696.0 784.0 750.0 486.0 763.0 9.6%IGS Integrative Studies 1,494.0 1,395.0 1,362.0 1,311.0 1,323.0 ‐11.4%JOU Journalism 144.0 228.0 273.0 480.0 504.0 250.0%LST Liberal Studies ‐ Honors 134.0 144.0 92.0 100.0 67.0 ‐50.0%MAT Mathematics 3,939.0 3,701.0 3,432.0 2,825.0 3,055.0 ‐22.4%MGT Management 306.0 384.0 306.0 279.0 213.0 ‐30.4%MIS Management Information Systems 69.0 111.0 60.0 42.0 75.0 8.7%MKT Marketing 156.0 156.0 234.0 120.0 129.0 ‐17.3%MUA Music ‐ Applied 90.0 56.0 50.0 4.0 50.5 ‐43.9%MUC Music ‐ Class Instruction 26.0 58.0 31.0 26.0 31.0 19.2%MUE Music Education 58.0 56.0 28.0 30.0 45.0 ‐22.4%MUI Music Industry 0.0 6.0 0.0 9.0 18.0 ‐‐MUP Music ‐ Performance Ensemble 208.0 268.0 204.0 177.0 135.0 ‐35.1%MUS Music 571.0 562.0 546.0 534.0 586.0 2.6%NUR Nursing 1,045.0 1,067.0 1,245.0 1,262.0 1,288.0 23.3%PHE Physical Education 710.0 534.0 483.0 516.0 576.0 ‐18.9%PHI Philosophy 69.0 54.0 75.0 21.0 36.0 ‐47.8%PHS Physical Sciences 147.0 234.0 213.0 225.0 216.0 46.9%PHY Physics 197.0 196.0 165.0 145.0 130.0 ‐34.0%POS Political Science 762.0 732.0 717.0 636.0 723.0 ‐5.1%PSY Psychology 1,464.0 1,527.0 1,281.0 1,519.0 1,797.0 22.7%
Office of Institutional Research and Effectiveness

Student Credit Hours
Total Student Credit Hours
Course Subject Fall 2009 Fall 2010 Fall 2011 Fall 2012 Fall 2013 5 Year ChangePUA Psychology 690.0 720.0 840.0 747.0 600.0 ‐13.0%REC Recreation 72.0 105.0 78.0 63.0 0.0 ‐100.0%SOC Sociology 606.0 663.0 657.0 573.0 570.0 ‐5.9%SOW Social Work 480.0 495.0 486.0 579.0 699.0 45.6%SPA Spanish 999.0 942.0 828.0 786.0 717.0 ‐28.2%SPE Speech 807.0 981.0 816.0 972.0 804.0 ‐0.4%THE Theatre 156.0 162.0 201.0 186.0 180.0 15.4%UNV University Orientation 1,583.0 1,437.0 1,142.0 943.0 900.0 ‐43.1%Total 33,855.0 34,754.0 32,340.0 29,617.0 30,199.5 ‐10.8%
0
200
400
600
800
1,000
1,200
1,400
Fall 2009 Fall 2010 Fall 2011 Fall 2012 Fall 2013
Top Five Growth
AQU CJE FIN JOU PHS
0
8,000
16,000
24,000
32,000
Fall 2009 Fall 2010 Fall 2011 Fall 2012 Fall 2013
Total SCH
Office of Institutional Research and Effectiveness

Fact Book 2013-2014
Kentucky State University
Retention Rate

Retention Rate
Retention Rate
Retention Rate is calculated as the proportion of first-time degree-seeking undergraduate students who enter Kentucky State University (KSU) in a given fall
semester, and return to KSU the following fall semester. This rate may later be broken down by associate or bachelor degree seeking,
and full-or part-time. For IPEDS reporting, the retention rate of first-time, full-time, bachelor or equivalent degree seeking was used.
Retention Rate of first-time, full-time bachelor degree-seeking students:
Cohort Year
2008 2009 2010 2011 2012
Cohort Size 579 410 450 431 328 -43.4%
Returned 301 217 221 192 169 -43.9%
Retention Rate 52.0% 52.9% 49.1% 44.5% 51.5% -0.5%
5yr
Change
40%
42%
44%
46%
48%
50%
52%
54%
2008 2009 2010 2011 2012
Retention Rate
Full-Time Bachelor Degree Seeking
Office of Institutional Research and Effectiveness

Retention Rate
Retention Rate Demographics - Bachelor
N
Cohor
t
N
Retai
n
Retain
Rate
N
Cohor
t
N
Retai
n
Retain
Rate
N
Cohor
t
N
Retai
n
Retain
Rate
N
Cohor
t
N
Retai
n
Retain
Rate
N
Cohor
t
N
Retai
n
Retain
Rate
5-Yr
Change
Nonresident Alien 1 1 100.0% 0 0 -- 0 0 -- 2 0 0.0% -100.0%
Black, Non Hispanic 202 118 58.4% 145 89 61.4% 158 86 54.4% 143 60 42.0% 125 73 58.4% 0.0%
American Indian 0 0 -- 0 0 -- 0 0 -- 1 1 100.0%
Asian 0 0 -- 1 1 100.0% 0 0 -- 1 1 --
Hispanic 2 1 50.0% 2 1 50.0% 1 1 100.0% 2 1 50.0% 1 1 100.0% 50.0%
White, Non Hispanic 24 11 45.8% 19 8 42.1% 17 8 47.1% 23 17 73.9% 4 1 25.0% -20.8%
Other Races 59 34 57.6% 38 21 55.3% 51 31 60.8% 58 28 48.3% 22 15 68.2% 10.6%
Two or More Races 0 0 -- 0 0 -- 6 0 0.0% 3 3 100.0%
Total Full-Time Female 288 165 57.3% 205 120 58.5% 233 126 54.1% 233 111 47.6% 152 90 59.2% 1.9%
Nonresident Alien 1 1 100.0% 0 0 -- 0 0 -- 1 0 0.0% -100.0%
Black, Non Hispanic 204 100 49.0% 134 64 47.8% 146 61 41.8% 109 49 45.0% 140 57 40.7% -8.3%
American Indian 0 0 -- 0 0 -- 0 0 -- 1 0 0.0%
Asian 0 0 -- 1 0 0.0% 0 0 -- 0 0 --
Hispanic 2 1 50.0% 4 3 75.0% 3 2 66.7% 2 1 50.0% 2 0.0% -50.0%
White, Non Hispanic 25 6 24.0% 25 9 36.0% 25 11 44.0% 16 8 50.0% 8 5 62.5% 38.5%
Other Races 59 28 47.5% 41 21 51.2% 37 16 43.2% 69 23 33.3% 26 17 65.4% 17.9%
Two or More Races 0 0 -- 0 0 -- 6 5 83.3% 0 0 --
Total Full-Time Male 291 136 46.7% 205 97 47.3% 217 95 43.8% 198 81 40.9% 176 79 44.9% -1.8%
Cohort 2011 Cohort 2012
Bac
he
lor
Full
Tim
eFe
mal
eM
ale
Cohort 2008 Cohort 2009 Cohort 2010
Office of Institutional Research and Effectiveness

Fact Book 2013-2014
Kentucky State University
Graduation Rate

Graduation Rate
Graduation Rate
2003 2004 2005 2006 2007 5-Yr ChangeCohort Size
(First-time, Full-time, Bachelor degree-seeking)Graduated within 150%
(Completers within 6 years)Graduation Rate
(Percent Completers of Cohort)22.9% 24.8% 21.5% 14.0% 18.2% -4.7%
275 306
Cohort Year
This annual component of IPEDS was added in 1997 to help institutions satisfy the requirements of the Student Right-to-Know legislation.Data are collected on the number of students entering the institution as full-time, first-time, degree/certificate-seeking undergraduate studentsin a particular year (cohort). Students may be removed from a cohort if they left the institution for one of the following reasons: death or total andpermanent disability; service in the armed forces (including those called to active duty); service with a foreign aid service of the federal government,such as the Peace Corps; or service on official church missions. The graduation rate is calculated as the percentage of those students in the cohort(after adjusted/minus exclusion) who completed their program within 150 percent of normal time to completion.
For example, Graduation Rate of Cohort 2006 is a percentage of full-time, first-time freshmen bachelor or equivalent degree-seeking studentsenrolled at Kentucky State University in Fall 2006, including Summer prior, who completed their programs by Summer 2012.
95
522362 506
63 76 78 71
Office of Institutional Research and Effectiveness

Graduation Rate
Graduation Rates Among Kentucky Public Institutions
Institution Name 2002 2003 2004 2005 2006 5-Yr ChangeEastern Kentucky University 37.7% 36.9% 37.3% 37.6% 36.9% -0.8%Kentucky State University 22.9% 22.9% 24.8% 21.4% 14.0% -8.9%Morehead State University 39.1% 39.9% 34.2% 40.4% 42.8% 3.7%Murray State University 49.1% 49.6% 53.7% 52.4% 54.1% 5.0%Northern Kentucky University 32.3% 31.8% 34.1% 37.0% 37.1% 4.8%University of Kentucky 57.7% 59.5% 58.2% 59.2% 57.6% -0.1%University of Louisville 45.7% 48.4% 48.6% 50.8% 52.1% 6.4%Western Kentucky University 47.3% 49.5% 48.7% 49.7% 49.6% 2.3%Source: IPEDS
Note: Cohort 2007 data has not been published
Office of Institutional Research and Effectiveness

Graduation Rate
Graduation Rate Demographic
N Cohort
N Grad
Grad Rate
N Cohort
N Grad
Grad Rate
N Cohort
N Grad
Grad Rate
N Cohort
N Grad
Grad Rate
N Cohort
N Grad
Grad Rate
Total Cohort 275 63 23% 306 76 25% 362 78 22% 507 71 14% 522 95 18% -5%
GenderFemale 133 36 27% 160 57 36% 188 42 22% 225 42 19% 278 71 26% -2%Male 142 27 19% 146 19 13% 174 36 21% 282 29 10% 244 24 10% -9%
RaceBlack, Non Hispanic 211 54 26% 215 53 25% 285 64 22% 451 60 13% 413 78 19% -7%Asian/Pacific Islander 1 0 0% 3 2 67% 5 1 20% 3 1 33% 2 2 100% 100%Hispanic 5 0 0% 2 0 0% 1 0 0% 3 0 0% 1 0 0% 0%White, Non Hispanic 43 8 19% 49 12 24% 48 7 15% 45 9 20% 45 7 16% -3%Other Races 15 1 7% 37 9 24% 23 6 26% 5 1 20% 61 8 13% 6%
ResidencyIn-State 115 18 16% 142 27 19% 175 33 19% 217 30 14% 213 31 15% -1%Out-of-State 160 45 28% 164 49 30% 187 45 24% 290 41 14% 309 64 21% -7%
2006 2007Cohort Year
5-Yr Change
Grad Rate
2003 2004 2005
Fact Book 2012-2013

Fact Book 2013-2014
Kentucky State University
Degrees Awarded

Degrees Awarded
Degrees Awarded
Level 2008‐2009 2009‐2010 2010‐2011 2011‐2012 2012‐2013 5 Year ChangeAssociate 39 37 58 53 45 15.4%Bachelor 184 213 226 229 206 12.0%Master's 40 54 44 64 50 25.0%Total Degrees Awarded 263 304 328 346 301 14.4%
Associate Degrees Awarded by Major
Major 2008‐2009 2009‐2010 2010‐2011 2011‐2012 2012‐2013 5 Year ChangeDDA Drafting & Design Technology 0 0 0 2 2LSA Liberal Studies (Whitney Yng) 6 10 23 6 13 116.7%LSW Liberal Studies WY (Honors) 1 4 2 2 0 ‐100.0%NUA Nursing 32 23 33 43 30 ‐6.3%Total Associate Degrees Awarded 39 37 58 53 45 15.4%
0
50
100
150
200
250
300
350
400
2008‐2009 2009‐2010 2010‐2011 2011‐2012 2012‐2013
Total Degrees Awarded
0
50
100
150
200
250
2008‐2009 2009‐2010 2010‐2011 2011‐2012 2012‐2013
Degrees by Gender
Female Male
Office of Institutional Research Effectiveness

Degrees Awarded
Bachelor Degrees Awarded by Major
Major 2008‐2009 2009‐2010 2010‐2011 2011‐2012 2012‐2013 5 Year ChangeAIT Applied Information Technology 4 6 6 12 8 100.0%BIO Biology 18 11 12 11 19 5.6%BUA Business 28 23 26 37 19 ‐32.1%CDF Child Dev & Family Rel 7 8 9 10 10 42.9%CHE Chemistry 1 1 5 2 0 ‐100.0%CRJ Criminal Justice 15 21 18 9 16 6.7%CSC Computer Science 7 8 5 9 2 ‐71.4%ECE Interdisc Early Childhood Edu 0 2 2 0 1EEE Early Elementary Education 0 0 0 2 0ELE Elementary Education 7 16 10 15 5 ‐28.6%ENG English 6 6 8 2 5 ‐16.7%LES Liberal Studies (Designed) 3 3 2 0 0 ‐100.0%LIS Liberal Studies (Honors) 1 3 4 4 2 100.0%LSC Liberal Studies Gen Studies 28 31 29 25 23 ‐17.9%LSS Liberal Studies WY (Designed) 0 0 1 1 0MAT Mathematics 7 1 3 1 7 0.0%MCJ Mass Comm and Journalism 3 6 10 15 9 200.0%MUS Music 3 1 5 3 1 ‐66.7%NUR Nursing 10 14 10 24 32 220.0%PED Physical Education 5 11 0 4 7 40.0%PET Physical Education (Teaching) 0 0 14 0 0PHT Physical Education and Health 0 2 1 3 5POS Political Science 8 7 3 1 4 ‐50.0%PSY Psychology 6 14 19 22 17 183.3%PUB Public Administration 3 8 2 6 5 66.7%SAR Studio Art 1 1 6 1 1 0.0%SPA Spanish 2SSC Social Sciences 3 4 3 1 1 ‐66.7%SWK Social Work 10 5 13 9 5 ‐50.0%Total Bachelor Degrees Awarded 184 213 226 229 206 12.0%
Office of Institutional Research Effectiveness

Degrees Awarded
Master's Degrees Awarded by Major
Major 2008‐2009 2009‐2010 2010‐2011 2011‐2012 2012‐2013 5 Year ChangeAQS Aquaculture 3 6 2 3 0 ‐100.0%CPM Computer Science 5 10 6 11 11 120.0%ENS Environmental Studies 8 3MBA Business Administration 3 7 7 5 3 0.0%MSE Special Education 17 14 15 22 15 ‐11.8%PUM Public Administration 12 17 14 15 18 50.0%Total Master's Degrees Awarded 40 54 44 64 50 25.0%
0
10
20
30
40
50
60
70
2008‐2009 2009‐2010 2010‐2011 2011‐2012 2012‐2013
Associate Degrees Awarded
0
50
100
150
200
250
2008‐2009 2009‐2010 2010‐2011 2011‐2012 2012‐2013
Bachelor Degrees Awarded
0
10
20
30
40
50
60
70
2008‐2009 2009‐2010 2010‐2011 2011‐2012 2012‐2013
Master's Degrees Awarded
Office of Institutional Research Effectiveness

Degrees Awarded
Total Degrees Awarded by Gender and Race
Gender Race 2008‐2009 2009‐2010 2010‐2011 2011‐2012 2012‐2013 5 Year ChangeNonresident Alien 0 3 14 4 6Black, Non Hispanic 86 101 90 117 108 25.6%Asian 4 3 1 1 1 ‐75.0%Hispanic 0 1 1 1 1White, Non Hispanic 61 81 89 76 74 21.3%Unknown 7 11 11 21 19 171.4%Two or More Races 0 0 0 3 0Total Female 158 200 206 223 209 32.3%Nonresident Alien 0 4 12 3 3Black, Non Hispanic 70 71 79 65 40 ‐42.9%Asian 5 1 1 1 2 ‐60.0%Hispanic 4 1 1 1 0 ‐100.0%White, Non Hispanic 25 24 22 42 31 24.0%Unknown 1 3 6 9 13 1200.0%Two or More Races 0 0 0 2 3Total Male 105 104 121 123 92 ‐12.4%Nonresident Alien 0 7 26 7 9Black, Non Hispanic 156 172 169 182 148 ‐5.1%Asian 9 4 2 2 3 ‐66.7%Hispanic 4 2 2 2 1 ‐75.0%White, Non Hispanic 86 105 111 118 105 22.1%Unknown 8 14 17 30 32 300.0%Two or More Races 0 0 0 5 3Total Degrees Awarded 263 304 327 346 301 14.4%
Female
Male
Total
Office of Institutional Research Effectiveness

Degrees Awarded
Degrees and Credentials Awarded by Kentucky Public Institutions
Institution Level 2008‐2009 2009‐2010 2010‐2011 2011‐2012 2012‐2013 5 Year ChangeCertificates 2 17 39 40 50 2400.0%Associate 195 203 215 177 208 6.7%Bachelor 2,128 2,125 2,135 2,259 2,358 10.8%Master's/Specialist 734 705 700 742 784 6.8%Other Degrees 8 3 12 10 38 375.0%Total Degrees Awarded 3,067 3,053 3,101 3,228 3,438 12.1%Associate 39 37 58 53 45 15.4%Bachelor 184 213 226 229 206 12.0%Master's/Specialist 40 54 44 64 50 25.0%Total Degrees Awarded 263 304 328 346 301 14.4%Associate 150 158 165 163 180 20.0%Bachelor 930 926 1,079 1,115 1,116 20.0%Master's/Specialist 410 368 437 456 447 9.0%Doctoral 16Other Degrees 3 2Total Degrees Awarded 1,490 1,452 1,681 1,737 1,761 18.2%Associate 10 12 18 13 12 20.0%Bachelor 1,542 1,535 1,552 1,530 1,399 ‐9.3%Master's/Specialist 638 638 647 732 714 11.9%Other Degrees 3 6Total Degrees Awarded 2,190 2,185 2,217 2,278 2,131 ‐2.7%
Eastern Kentucky State University
Kentucky State University
Morehead State University
Murray State University
Office of Institutional Research Effectiveness

Degrees Awarded
Degrees and Credentials Awarded by Kentucky Public Institutions
Institution Level 2008‐2009 2009‐2010 2010‐2011 2011‐2012 2012‐2013 5 Year ChangeCertificates 5 6 8 29 15 200.0%Associate 124 127 105 118 98 ‐21.0%Bachelor 1,836 1,988 1,974 1,980 2,109 14.9%Master's/Specialist 491 461 485 493 491 0.0%Other Degrees 186 206 266 260 243 30.6%Total Degrees Awarded 2,642 2,788 2,838 2,880 2,956 11.9%Certificates 33 20 6Bachelor 3,650 3,521 3,712 3,735 4,022 10.2%Master's/Specialist 1,334 1,211 1,307 1,231 1,299 ‐2.6%Other Degrees 719 734 783 1,014 990 37.7%Total Degrees Awarded 5,703 5,466 5,835 6,000 6,317 10.8%Certificates 31 26 24 28 24 ‐22.6%Associate 20 18 19 11 28 40.0%Bachelor 2,482 2,550 2,618 2,702 2,731 10.0%Master's/Specialist 1,394 1,310 1,333 1,439 1,379 ‐1.1%Other Degrees 574 630 692 717 663 15.5%Total Degrees Awarded 4,501 4,534 4,686 4,897 4,825 7.2%Certificates 62 76 81 54 70 12.9%Associate 217 234 215 271 267 23.0%Bachelor 2,382 2,676 2,591 2,657 2,627 10.3%Master's/Specialist 757 858 920 973 992 31.0%Other Degrees 35 62 78 67 89 154.3%Total Degrees Awarded 3,453 3,906 3,885 4,022 4,045 17.1%
University of Louisville
Western Kentucky University
Northern Kentucky University
University of Kentucky
Office of Institutional Research Effectiveness
Fact Book 2013-2014
Kentucky State University
Career Counseling and Placement
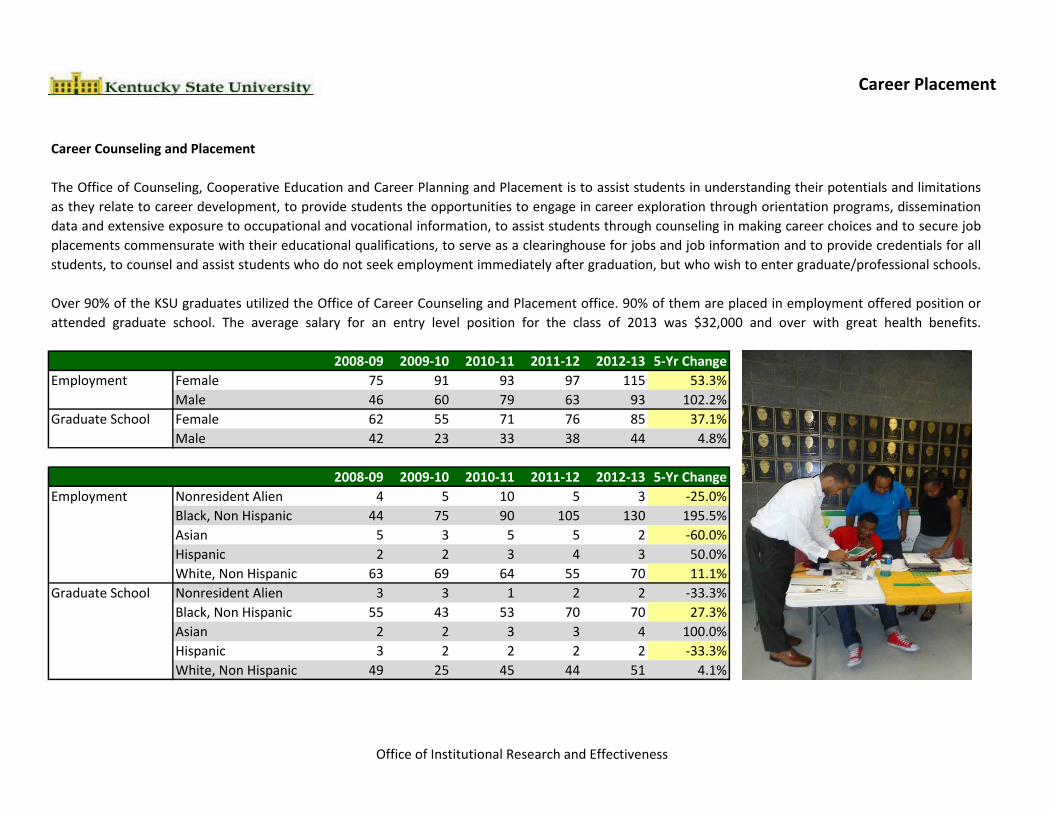
Career Placement
Career Counseling and Placement
2008-09 2009-10 2010-11 2011-12 2012-13 5-Yr Change
Employment Female 75 91 93 97 115 53.3%
Male 46 60 79 63 93 102.2%
Graduate School Female 62 55 71 76 85 37.1%
Male 42 23 33 38 44 4.8%
2008-09 2009-10 2010-11 2011-12 2012-13 5-Yr Change
Employment Nonresident Alien 4 5 10 5 3 -25.0%
Black, Non Hispanic 44 75 90 105 130 195.5%
Asian 5 3 5 5 2 -60.0%
Hispanic 2 2 3 4 3 50.0%
White, Non Hispanic 63 69 64 55 70 11.1%
Graduate School Nonresident Alien 3 3 1 2 2 -33.3%
Black, Non Hispanic 55 43 53 70 70 27.3%
Asian 2 2 3 3 4 100.0%
Hispanic 3 2 2 2 2 -33.3%
White, Non Hispanic 49 25 45 44 51 4.1%
attended graduate school. The average salary for an entry level position for the class of 2013 was $32,000 and over with great health benefits.
The Office of Counseling, Cooperative Education and Career Planning and Placement is to assist students in understanding their potentials and limitations
as they relate to career development, to provide students the opportunities to engage in career exploration through orientation programs, dissemination
data and extensive exposure to occupational and vocational information, to assist students through counseling in making career choices and to secure job
placements commensurate with their educational qualifications, to serve as a clearinghouse for jobs and job information and to provide credentials for all
students, to counsel and assist students who do not seek employment immediately after graduation, but who wish to enter graduate/professional schools.
Over 90% of the KSU graduates utilized the Office of Career Counseling and Placement office. 90% of them are placed in employment offered position or
Office of Institutional Research and Effectiveness

Career Placement
2008-09 2009-10 2010-11 2011-12 2012-13 5-Yr Change Services offered by the office of
Employment Kentucky 112 118 151 150 184 64.3% Career Counseling and Placement:
Michigan 3 3 3 0 1 -66.7% • Bi-Annual Career Fairs
Tennessee 2 0 3 1 1 -50.0% • Graduate School Information
Georgia 2 0 4 0 2 0.0% • Co-op & Internship Information
Ohio 7 10 6 0 4 -42.9% • Part-time & Full-time employment
Arizona 0 0 1 0 0 -- • How to write a Resume?
Colorado 0 0 1 0 0 -- • On-Campus Interviews
New Mexico 0 0 1 0 0 -- • Seminars – The World of Work,
Texas 0 0 1 1 0 -- Mock Interviewing, How to Dress
Florida 3 0 1 0 0 -100.0% Professional, Which Fork do I use?
Other States 12 2 0 2 6 -50.0% • SIGI 3 – Defines possible careers
Graduate School Kentucky 70 72 88 103 104 48.6% based on your experience,
Michigan 3 0 1 1 1 -66.7% education, and values.
Alabama 0 0 1 0 0 -- • Service to the Alumni
Ohio 14 4 7 6 4 -71.4% • Mock Interviews
Indiana 4 1 2 0 3 -25.0% • Graduate School Visitation Trips
Florida 2 1 1 1 0 -100.0% • Teacher Fairs
Tennessee 2 1 2 1 0 -100.0% • Alumni Motivational Task Force
Georgia 3 6 2 0 5 66.7%
Other States 13 2 0 2 2 -84.6%
Note: some students may also attended graduate school and work full/part-time.
Office of Institutional Research and Effectiveness

Career Placement
Graduating Survey
Gender 2009-2010 2010-2011 2011-2012 2012-2013 2013-2014 5-Yr Change
Female 181 170 207 160 216 19.3%
Male 94 87 99 79 117 24.5%
No response 1 0 0 1 0 -100.0%
Total 276 257 306 240 333 20.7%
Ethnicity 2009-2010 2010-2011 2011-2012 2012-2013 2013-2014 5-Yr Change
Black, Non Hispanic 168 150 167 124 196 16.7%
White, Non-Hispanic 93 91 117 100 108 16.1%
Asian 6 9 6 8 10 66.7%
American Indian/Alaskan 1 0 0 0 0 -100.0%
Hispanic 3 2 5 3 4 33.3%
Two or more Races 2 2 11 4 12 500.0%
Hawaiian/Pacific Islander 0 1 0 0 2 --
No response 3 2 0 1 1 -66.7%
Total 276 257 306 240 333 20.7%
The Office of Institutional Research and Effectiveness requires students who graduating to take a survey, in order to clear them for graduation. Starting in
Spring 2008, a question has been added in the Graduating Survey to determine what activity will be most likely to be pursued upon graduation from the
Kentucky State University.
Office of Institutional Research and Effectiveness

Career Placement
Where will you live after graduation? 2009-2010 2010-2011 2011-2012 2012-2013 2013-2014 5-Yr Change
Kentucky 193 184 212 163 225 16.6%
Other State 81 67 91 76 106 30.9%
Foreign Country 1 5 2 0 2 100.0%
No response 1 1 1 1 0 -100.0%
Total 276 257 306 240 333 20.7%
What is MOST LIKELY to be your PRINCIPAL activity upon graduation?* 2009-2010 2010-2011 2011-2012 2012-2013 2013-2014 5-Yr Change
Employment 159 147 179 146 212 33.3%
Starting or raising a family 4 2 5 4 7 75.0%
Military service 1 4 4 2 7 600.0%
Volunteer activity (e.g., Peace Corps) 3 3 1 2 2 -33.3%
Additional Undergraduate Coursework 12 5 15 2 6 -50.0%
Graduate or Professional School 90 91 95 73 83 -7.8%
Other 6 5 6 9 12 100.0%
No response 1 0 1 2 4 300.0%
Total 276 257 306 240 333 20.7%
* Respondent may select more than one answer. Question was added in Spring 2008.
Kentucky68%
Others32%
2012-2013
0
50
100
150
200
250
2010-2011 2011-2012 2012-2013 2013-2014
Activity upon Graduation
Employment Grad School Others
0
50
100
150
200
250
2010-2011 2011-2012 2012-2013 2013-2014
Respondents by Gender
Female Male
0
50
100
150
200
250
2010-2011 2011-2012 2012-2013 2013-2014
Respondents by Race
Black White Others
Office of Institutional Research and Effectiveness

Fact Book 2013-2014
Kentucky State University
Faculty and Staff

Faculty Staff
KSU Employee
EEO Code Job Group 2009-2010 2010-2011 2011-2012 2012-2013 2013-2014 5-Yr Change
H10 Executive/Administrative/Management 45 48 46 52 53 17.8%
H20 Faculty 188 185 182 178 184 -2.1%
H30 Other Professional 154 161 186 170 171 11.0%
H40 Clerical/Secretarial 108 116 61 77 75 -30.6%
H50 Tech/Paraprofessional 39 38 49 37 47 20.5%
H60 Skilled Craft 17 18 15 16 14 -17.6%
H70 Service/Maintenance 57 52 64 62 54 -5.3%
H80 Graduate Assistant 19 22 37 33 25 31.6%
Total Employee 627 640 640 625 623 -0.6%
Gender Race 2009-2010 2010-2011 2011-2012 2012-2013 2013-2014 5-Yr Change
Black, Non Hispanic 168 156 155 161 150 -10.7%
Asian 5 8 11 8 9 80.0%
Hispanic 3 4 7 4 5 66.7%
White, Non Hispanic 138 135 135 124 126 -8.7%
Two or More Races 0 1 8 9 9 --
Hawaiian/Pacific 0 0 1 1 1 --
Other Races 15 22 7 8 13 -13.3%
Total Female Employee 329 326 324 315 313 -4.9%
Black, Non Hispanic 124 129 128 137 142 14.5%
Asian 14 16 18 15 13 -7.1%
Hispanic 1 0 4 4 3 200.0%
White, Non Hispanic 137 146 150 136 136 -0.7%
Two or More Races 0 0 4 7 6 --
Hawaiian/Pacific 0 0 1 1 2 --
Other Races 22 23 11 10 8 -63.6%
Total Male Employee 298 314 316 310 310 4.0%
Female
Male
Fact Book 2013-2014
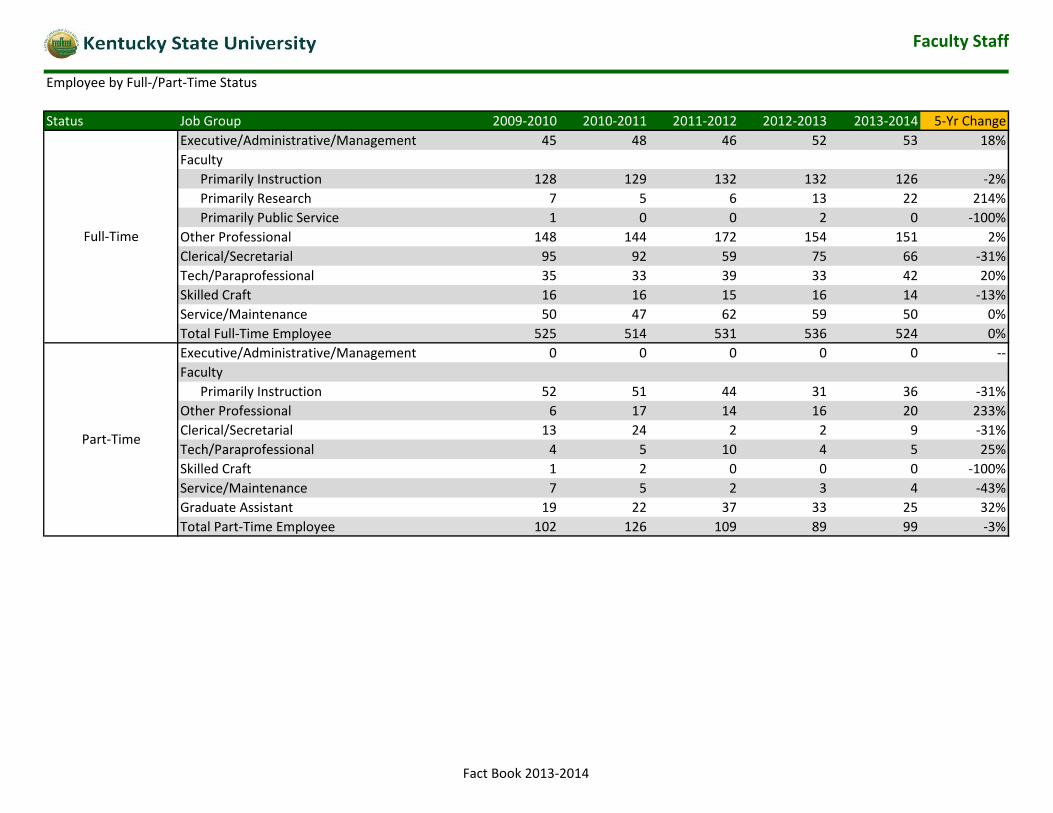
Faculty Staff
Employee by Full-/Part-Time Status
Status Job Group 2009-2010 2010-2011 2011-2012 2012-2013 2013-2014 5-Yr Change
Executive/Administrative/Management 45 48 46 52 53 18%
Faculty
Primarily Instruction 128 129 132 132 126 -2%
Primarily Research 7 5 6 13 22 214%
Primarily Public Service 1 0 0 2 0 -100%
Other Professional 148 144 172 154 151 2%
Clerical/Secretarial 95 92 59 75 66 -31%
Tech/Paraprofessional 35 33 39 33 42 20%
Skilled Craft 16 16 15 16 14 -13%
Service/Maintenance 50 47 62 59 50 0%
Total Full-Time Employee 525 514 531 536 524 0%
Executive/Administrative/Management 0 0 0 0 0 --
Faculty
Primarily Instruction 52 51 44 31 36 -31%
Other Professional 6 17 14 16 20 233%
Clerical/Secretarial 13 24 2 2 9 -31%
Tech/Paraprofessional 4 5 10 4 5 25%
Skilled Craft 1 2 0 0 0 -100%
Service/Maintenance 7 5 2 3 4 -43%
Graduate Assistant 19 22 37 33 25 32%
Total Part-Time Employee 102 126 109 89 99 -3%
Full-Time
Part-Time
Fact Book 2013-2014

Faculty Staff
Full-Time Instructional Faculty (Primarily Teaching)
Rank Contract Gender 2009-2010 2010-2011 2011-2012 2012-2013 2013-2014 5-Yr Change
9-Month Female 3 3 2 3 1 -67%
Male 15 17 18 19 22 47%
12-Month Female 0 0 1 0 1 --
Male 2 2 2 6 2 0%
Total Full-Time Professor 20 22 23 28 26 30%
9-Month Female 9 9 13 15 15 67%
Male 22 28 28 24 17 -23%
12-Month Female 6 5 4 4 3 -50%
Male 1 2 1 1 1 0%
Total Full-Time Associate Professor 38 44 46 44 36 -5%
9-Month Female 28 28 29 22 20 -29%
Male 24 18 18 24 23 -4%
12-Month Female 0 0 0 0 0 --
Male 2 2 2 2 2 0%
Total Full-Time Assistant Professor 54 48 49 48 45 -17%
9-Month Female 10 11 10 14 14 40%
Male 6 4 4 4 6 0%
12-Month Female 0 0 0 0 0 --
Male 0 0 0 1 0 --
Total Full-Time Instructor 16 15 14 19 20 25%
Professor
Associate
Professor
Assistant Professor
Instructor
Fact Book 2013-2014

Faculty Staff
Full-Time Instructional 9-Month Faculty
Rank Tenure Status Gender 2009-2010 2010-2011 2011-2012 2012-2013 2013-2014 5-Yr Change
Tenure Female 3 3 2 3 1 -67%
Male 15 16 17 17 21 40%
Tenure Track Female 0 0 0 0 0 --
Male 0 1 1 1 0 --
Non Tenure Female 0 0 0 0 0 --
Male 0 0 0 1 1 --
Tenure Female 8 8 10 10 13 63%
Male 16 24 23 20 15 -6%
Tenure Track Female 1 1 3 5 2 100%
Male 6 4 5 4 2 -67%
Non Tenure Female 0 0 0 0 0 --
Male 0 0 0 0 0 --
Tenure Female 8 7 7 6 6 -25%
Male 12 6 6 6 5 -58%
Tenure Track Female 19 17 15 12 7 -63%
Male 10 8 9 17 11 10%
Non Tenure Female 1 4 7 4 7 600%
Male 2 4 3 2 7 250%
Tenure Female 0 0 0 1 0 --
Male 0 0 0 0 0 --
Tenure Track Female 0 0 0 0 0 --
Male 0 0 0 0 0 --
Non Tenure Female 10 11 10 13 14 40%
Male 6 4 4 4 6 0%
Tenure Female 19 18 19 20 20 5%
Male 43 46 46 43 41 -5%
Tenure Track Female 20 18 18 17 9 -55%
Male 16 13 15 22 13 -19%
Non Tenure Female 11 15 17 17 21 91%
Male 8 8 7 7 14 75%
Professor
Associate Professor
Assistant Professor
Instructor
Total Full-Time 9-
Month Instructional
Faculty
Fact Book 2013-2014

Faculty Staff
Full-Time Instructional 12-Month Faculty
Rank Tenure Status Gender 2009-2010 2010-2011 2011-2012 2012-2013 2013-2014 5-Yr Change
Tenure Female 0 0 1 0 1 --
Male 2 1 2 10 1 -50%
Tenure Track Female 0 0 0 1 0 --
Male 0 1 0 3 0 --
Non Tenure Female 0 0 0 0 0 --
Male 0 0 0 1 1 --
Tenure Female 3 3 3 7 3 0%
Male 1 1 1 1 1 0%
Tenure Track Female 3 2 1 3 0 -100%
Male 0 1 0 5 0 --
Non Tenure Female 0 0 0 0 0 --
Male 0 0 0 0 0 --
Tenure Female 0 0 0 1 0 --
Male 0 0 1 2 0 --
Tenure Track Female 0 0 0 1 0 --
Male 2 2 1 7 1 -50%
Non Tenure Female 0 0 0 1 0 --
Male 0 0 0 0 1 --
Tenure Female 0 0 0 0 0 --
Male 0 0 0 0 0 --
Tenure Track Female 0 0 0 0 0 --
Male 0 0 0 0 0 --
Non Tenure Female 0 0 0 1 0 --
Male 0 0 0 3 0 --
Tenure Female 3 3 4 8 4 33%
Male 3 2 4 13 2 -33%
Tenure Track Female 3 2 1 5 0 -100%
Male 2 4 1 15 1 -50%
Non Tenure Female 0 0 0 2 0 --
Male 0 0 0 4 2 --
Professor
Associate Professor
Assistant Professor
Instructor
Total Full-Time 12-
Month
Instructional
Faculty
Fact Book 2013-2014

Faculty Staff
Full-Time Instructional Faculty Demographics
Gender Race 2009-2010 2010-2011 2011-2012 2012-2013 2013-2014 5-Yr Change
Black, Non Hispanic 12 13 13 17 8 -33%
Asian 2 2 1 1 1 -50%
Hispanic 1 3 3 2 2 100%
White, Non Hispanic 40 37 39 38 37 -8%
Two or More Races 0 0 3 4 3 --
Other Races 1 1 0 2 3 200%
Total Female Instructional Faculty 56 56 59 64 54 -4%
Black, Non Hispanic 22 24 22 30 24 9%
Asian 6 6 8 5 4 -33%
Hispanic 1 0 0 0 0 -100%
White, Non Hispanic 42 43 43 42 41 -2%
Two or More Races 0 0 0 2 1 --
Other Races 1 0 0 5 3 200%
Total Male Instructional Faculty 72 73 73 84 73 1%
Female
Male
Fact Book 2013-2014

Fact Book 2013-2014
Kentucky State University
Finance
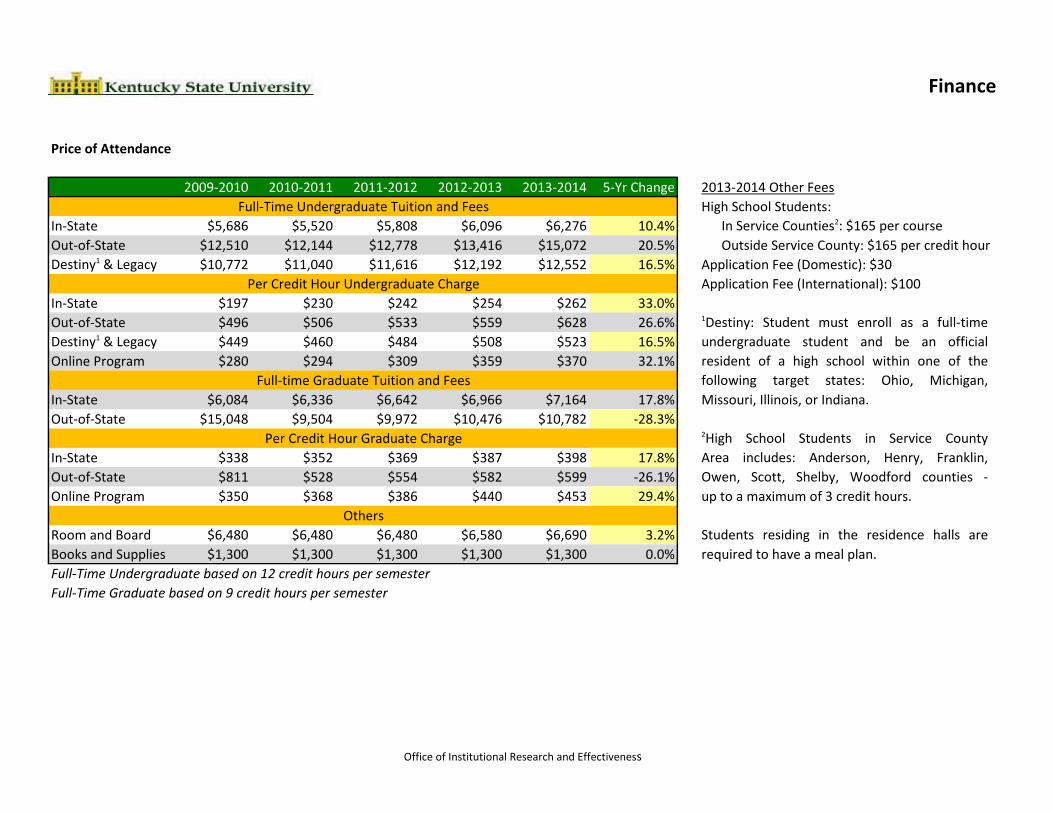
Finance
Price of Attendance
2009-2010 2010-2011 2011-2012 2012-2013 2013-2014 5-Yr Change 2013-2014 Other Fees
High School Students:
In-State $5,686 $5,520 $5,808 $6,096 $6,276 10.4% In Service Counties2: $165 per course
Out-of-State $12,510 $12,144 $12,778 $13,416 $15,072 20.5% Outside Service County: $165 per credit hour
Destiny1 & Legacy $10,772 $11,040 $11,616 $12,192 $12,552 16.5% Application Fee (Domestic): $30
Application Fee (International): $100
In-State $197 $230 $242 $254 $262 33.0%
Out-of-State $496 $506 $533 $559 $628 26.6% 1Destiny: Student must enroll as a full-time
Destiny1 & Legacy $449 $460 $484 $508 $523 16.5% undergraduate student and be an official
Online Program $280 $294 $309 $359 $370 32.1% resident of a high school within one of the
following target states: Ohio, Michigan,
In-State $6,084 $6,336 $6,642 $6,966 $7,164 17.8% Missouri, Illinois, or Indiana.
Out-of-State $15,048 $9,504 $9,972 $10,476 $10,782 -28.3%2High School Students in Service County
In-State $338 $352 $369 $387 $398 17.8% Area includes: Anderson, Henry, Franklin,
Out-of-State $811 $528 $554 $582 $599 -26.1% Owen, Scott, Shelby, Woodford counties -
Online Program $350 $368 $386 $440 $453 29.4% up to a maximum of 3 credit hours.
Room and Board $6,480 $6,480 $6,480 $6,580 $6,690 3.2% Students residing in the residence halls are
Books and Supplies $1,300 $1,300 $1,300 $1,300 $1,300 0.0% required to have a meal plan.
Full-Time Undergraduate based on 12 credit hours per semester
Full-Time Graduate based on 9 credit hours per semester
Full-Time Undergraduate Tuition and Fees
Per Credit Hour Undergraduate Charge
Full-time Graduate Tuition and Fees
Per Credit Hour Graduate Charge
Others
Office of Institutional Research and Effectiveness

Finance
Revenues and Expenditures
FY 2009 FY 2010 FY 2011 FY 2012 FY 2013 5-Yr Change
Operating Revenues
Tuition and Fees $13,328,034 $16,512,333 18,200,942 18,943,062 16,595,920 24.5%
Grants and Contracts $15,367,048 $21,097,246 19,109,564 16,064,387 16,046,137 4.4%
Auxiliary Enterprises $6,356,430 $6,745,546 6,618,704 6,838,829 6,065,393 -4.6%
Other Revenues $909,262 $1,006,390 1,103,669 1,653,909 1,131,620 24.5%
Total Operating Revenues $35,960,774 $45,361,515 45,032,879 43,500,187 39,839,070 10.8%
Operating Expenses
Instruction $14,424,476 $13,787,801 14,090,472 14,381,597 13,701,239 -5.0%
Research $5,390,037 $5,094,538 4,819,546 7,668,990 5,783,591 7.3%
Public Service $4,546,486 $4,619,045 5,456,045 6,113,245 5,419,529 19.2%
Academic Support $2,928,852 $3,346,109 4,031,587 4,286,089 3,367,893 15.0%
Student Services $5,827,532 $6,144,373 6,517,442 7,464,907 7,712,162 32.3%
Institutional Support $8,819,933 $10,359,981 10,764,712 12,059,904 9,672,796 9.7%
Operation Maintenance $5,259,658 $4,740,605 3,428,856 3,297,562 5,602,000 6.5%
Student Financial Aid $7,010,686 $9,519,263 10,302,761 10,098,858 9,162,677 30.7%
Depreciation $2,896,317 $4,261,837 4,235,658 4,122,855 4,174,107 44.1%
Auxiliary Enterprises $5,287,746 $5,111,449 4,905,721 5,864,566 6,273,691 18.6%
Aux Enterprises - Depreciation $511,115 $652,595 606,263 343,800 336,961 -34.1%
Total Operating Expenses $62,902,838 $67,637,596 69,159,063 75,702,373 71,206,646 13.2%
Operating Loss ($26,942,064) ($22,276,081) (24,126,184) (32,202,186) (31,367,576) 16.4%
Non Operating Revenues
State Appropriations $26,435,199 $24,630,377 25,363,422 24,660,001 23,537,402 -11.0%
Other Non Operating Revenues $1,279,217 $7,148,217 9,345,749 8,547,909 7,381,006 477.0%
Total Non Operating Revenues $27,714,416 $31,778,594 34,709,171 33,207,910 30,925,684 11.6%
Endowment Gifts $0 $0 $0 $106,552 $7,276
Capital Appropriations $0 $1,760,427 $0 $0
Increase in Net Assets $772,352 $11,262,940 $10,582,987 $1,112,276 $1,727,469 123.7%
Office of Institutional Research and Effectiveness

Fact Book 2013-2014
Kentucky State University
Alumni

Alumni
Notable Alumni
Dr. Henry E. Cheaney1936, Educator and nationally‐recognized expert on the history of African Americans in Kentucky
Anna Mac Clarke 1941, Member of Women’s Army Corps during WWII; 1st African American officer of an all‐white company
Paul William Lawrence Jones 1898, Educator, historian & athlete; preserved much of what Kentucky State now has in the way of books and documents about the early years of Kentucky State; started some of the 1st football, baseball and track teams at KSU, known as the “Father of Athletics” at Kentucky State.
James L. McCullin 1941, Tuskegee Airman whose plane was lost over Sicily during WWII
Ersa Hines Poston 1942, Member of the U.S. Civil Service Commission; appointed by President Carter and confirmed by the Senate; First Black to hold a positionpresidential cabinet
H.C. Russell, Jr. , Ensign in Coast Guard during WWII; became the third African American commissioned officer in the Coast Guard; later became executive with Pepsi Cola
Winnie A. Scott 1890, Educator and helped establish a hospital for African Americans in Frankfort; member of first graduating class at Kentucky State
Frank Simpson 1942, Educator; high school principal for 21 years and administrator in the Louisville schools
Moneta Sleet, Jr. 1947, Photographer; became the first African American to win the Pulitzer Prize for photography; photo of Coretta Scott King at Martin Luther King, Jr.’s funeral
Effie Waller Smithca. 1900, Educator & poet; poet James Still called her “Kentucky’s Emily Dickinson”
Luska Twyman 1938, Former mayor of Glasgow, Ky; 1st Black mayor of a Kentucky city
Dr. Harrison Wilson 1950, President of Norfolk State University
Whitney M. Young, Jr. 1941, Civil rights, Executive Director of the National Urban League from 1961‐1971 Effie Waller SmithMoneta Sleet, Jr.
Anna MacClarkeJames L McCullin
Henry Cheaney
Whitney Young, Jr.Ersa H. Poston
Office of Institutional Research and Effectiveness

Alumni
Alumni
State Residency Total State Residency Total State Residency Total State Residency TotalAlabama 107 District of Columbia 39 Kansas 10 Mississippi 50Alaska 1 Florida 269 Kentucky 5,840 Missouri 88Arizona 34 Georgia 374 Louisiana 17 Montana 2Arkansas 19 Hawaii 1 Maine 1 Nebraska 11California 121 Idaho 1 Maryland 111 Nevada 13Colorado 15 Illinois 360 Massachusetts 12 New Hampshire 5Connecticut 5 Indiana 422 Michigan 463 New Jersey 55Delaware 12 Iowa 8 Minnesota 14 New Mexico 4
New York 82North Carolina 99Ohio 906Oklahoma 18Oregon 3Pennsylvania 52South Carolina 33South Dakota 1Tennessee 200Texas 172Utah 3Vermont 2Virginia 122Washington 21West Virginia 14Wisconsin 55Wyoming 1Other/Unknown 2,003
Total KSU Alumni as of April 17, 2013 = 12,271
Office of Institutional Research and Effectiveness

Alumni
Alumni by Class Year
Class Total Class Total Class Total Class Total1918 1 1953 30 1977 143 2001 2531926 1 1954 32 1978 110 2002 2721931 2 1955 43 1979 104 2003 1771932 3 1956 42 1980 156 2004 3031933 3 1957 40 1981 179 2005 2551934 3 1958 41 1982 169 2006 2451935 11 1959 47 1983 191 2007 2971936 5 1960 56 1984 174 2008 2721937 21 1961 58 1985 185 2009 2381938 6 1962 41 1986 208 2010 2891939 18 1963 58 1987 186 2011 3301940 8 1964 66 1988 206 2012 441941 14 1965 61 1989 180 2013 2011942 16 1966 52 1990 186 2014 3701943 9 1967 71 1991 196 Unknown 1,9421944 12 1968 76 1992 2081945 18 1969 98 1993 2531946 11 1970 102 1994 2441947 14 1971 95 1995 3251948 19 1972 120 1996 1651949 24 1973 115 1997 2281950 39 1974 102 1998 2911951 38 1975 123 1999 1941952 34 1976 117 2000 286
Office of Institutional Research and Effectiveness

Fact Book 2013-2014
Kentucky State University