Embed Size (px)
Citation preview
Kentucky Horticulture OutlookKentucky Horticulture OutlookFall 2003Fall 2003
Tim Woods and Matt ErnstTim Woods and Matt Ernst
Agricultural Economics
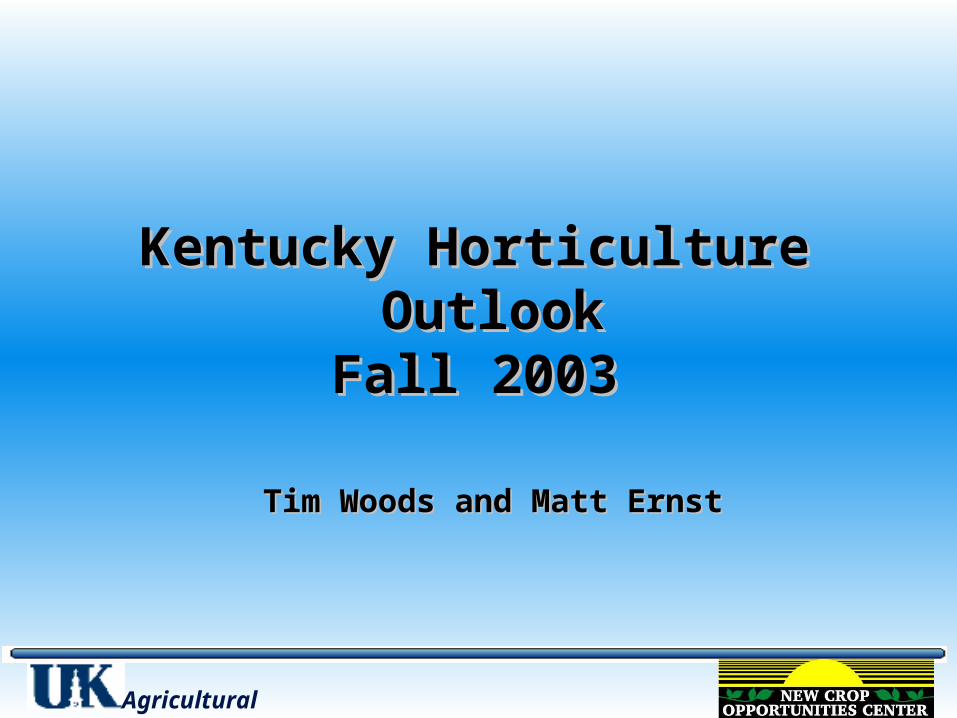
U.S. Per Capita Consumption of Selected U.S. Per Capita Consumption of Selected Fresh Produce CropsFresh Produce Crops
0
2
4
6
8
10
12
lbs
BroccoliCabbageCantaloupeSweet CornCucumbers
Agricultural Economics
Source: July 2003 USDA/ERS Vegetables and Melons Situation and Outlook Yearbook (Table 1)
7 94
74
26 26
0
10
20
30
40
50
60
70
80
Per
cen
t
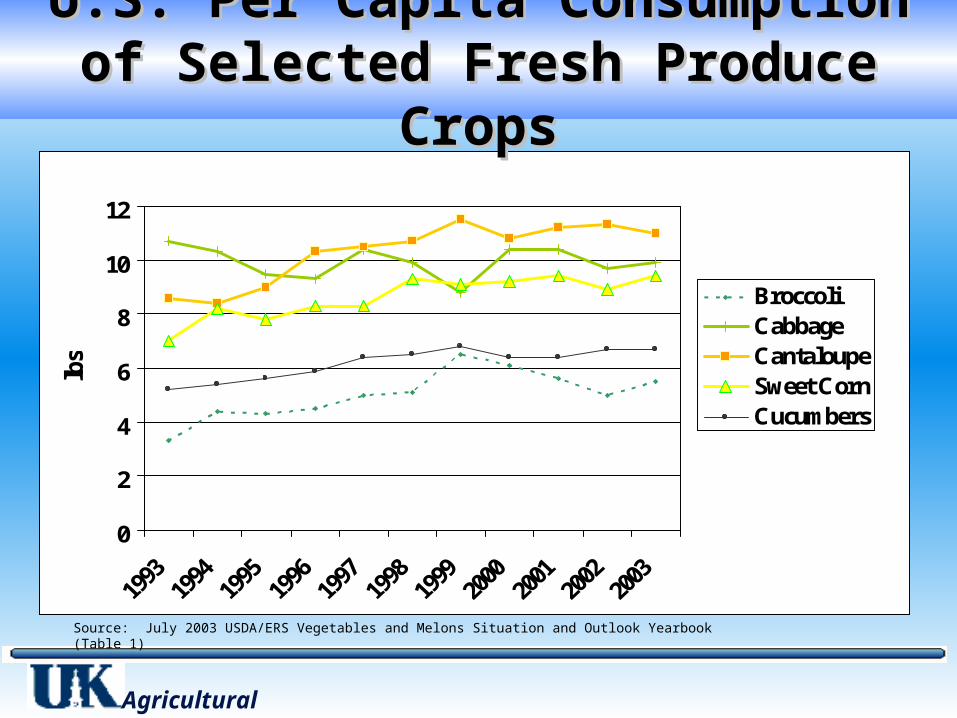
Percent selling at least 10% of theirproduce into given market channel
Source: 2001-03 KY Produce Marketing Practices Surveys
Kentucky Produce Marketing ChannelsKentucky Produce Marketing Channels

• Co-ops generally saw strong prices• Modest growth in acreage• Continued AD Fund support to develop
infrastructure and carry working capital• Management and board challenges• More demonstration programs from UK
– Additional $2 million appropriated for on-farm demos, variety development, applied research
KY Cooperative and Wholesale MarketsKY Cooperative and Wholesale Markets
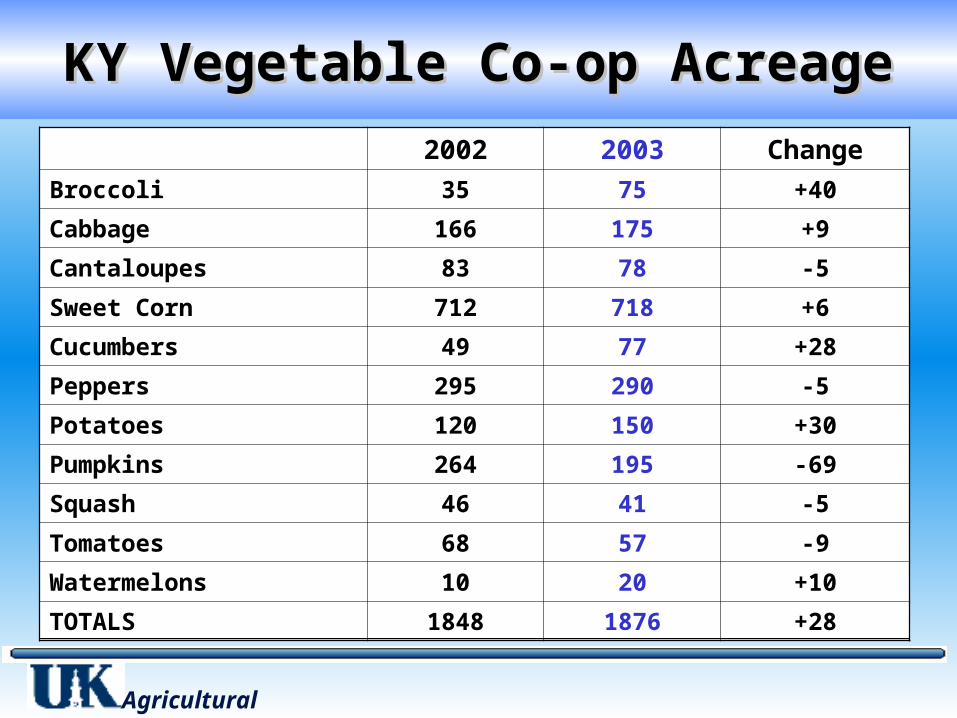
KY Vegetable Co-op AcreageKY Vegetable Co-op Acreage
Agricultural Economics
2002 2003 Change
Broccoli 35 75 +40
Cabbage 166 175 +9
Cantaloupes 83 78 -5
Sweet Corn 712 718 +6
Cucumbers 49 77 +28
Peppers 295 290 -5
Potatoes 120 150 +30
Pumpkins 264 195 -69
Squash 46 41 -5
Tomatoes 68 57 -9
Watermelons 10 20 +10
TOTALS 1848 1876 +28
• More interest in direct-store-delivery by major retailers– Grapes, blackberries, tomatoes, blueberries
• Marketing alliances to produce specialty vegetables– Specialty peppers– Specialty root crops, Asian vegetables, herbs
Wholesale Beyond the Co-opWholesale Beyond the Co-op

Fruits and Vegetables: Fruits and Vegetables: Kentucky Gross Farm Sales, 1987-2003Kentucky Gross Farm Sales, 1987-2003
• Co-op sales for 2003: $5-6 million
• 60 Farm Bureau CRMs @ $100,000: Another $6 million
• 80+ community farmers markets gross sales @$50,000: Another $4 million
• Auctions, niche processed products (grapes), wholesale not through co-ops, other direct sales: Another $5-10 million
• Major growth since 1997
0
24
6
8
1012
14
1982 1987 1992 1997 2002 2003M
illio
n $
Produce Sales
Agricultural Economics
Source: USDA/ERS, NASS Ag Census
? ?

U.S. Per Capita Consumption of Selected U.S. Per Capita Consumption of Selected Fresh Produce CropsFresh Produce Crops
02
46
810
1214
1618
20
lbs Tomatoes
Bell Peppers
Agricultural Economics
Source: July 2003 USDA/ERS Vegetables and Melons Situation and Outlook Yearbook (Table 1)
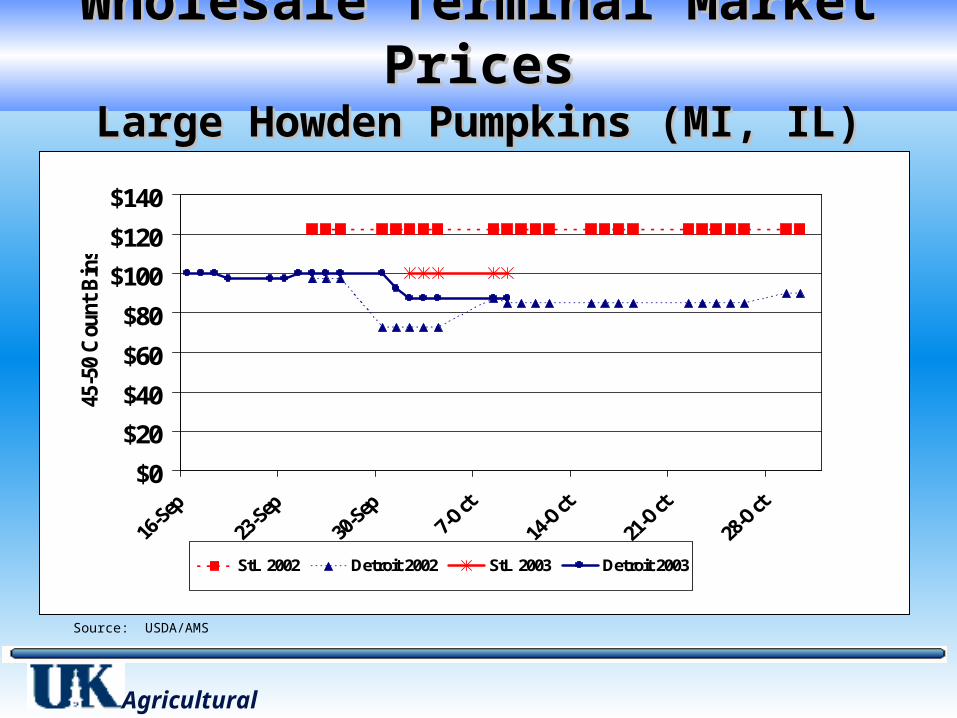
Wholesale Terminal Market PricesWholesale Terminal Market PricesLarge Howden Pumpkins (MI, IL)Large Howden Pumpkins (MI, IL)
Agricultural Economics
$0
$20
$40
$60
$80
$100
$120
$140
45-5
0 C
ount
Bin
s
StL 2002 Detroit 2002 StL 2003 Detroit 2003
Source: USDA/AMS
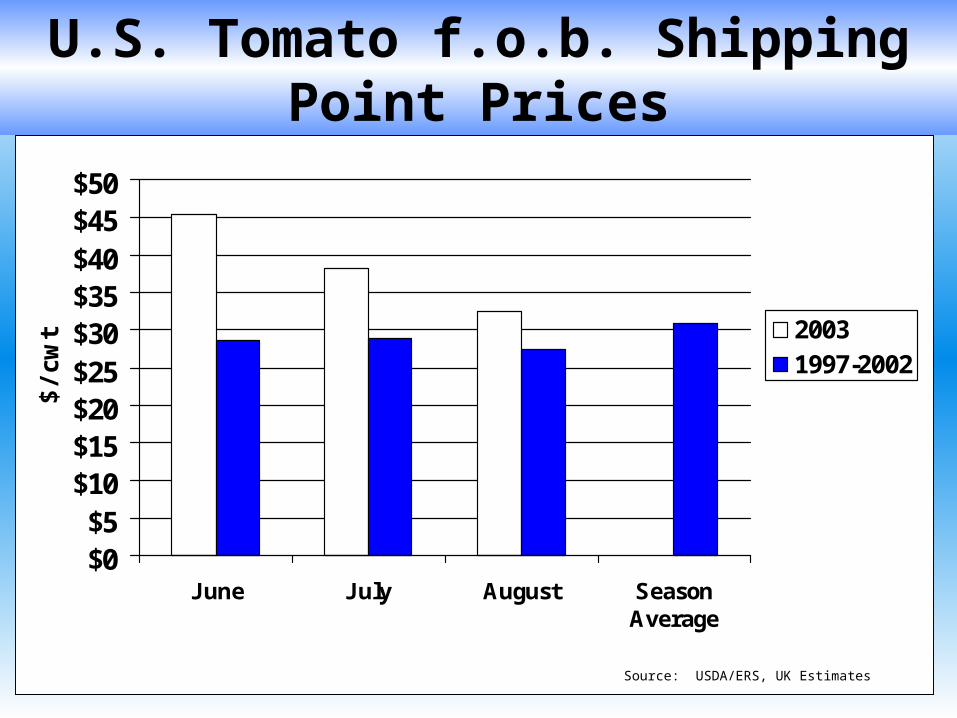
$0.00
$5.00
$10.00
$15.00
$20.00
$25.00
J une J uly August SeasonAverage
$/cw
t
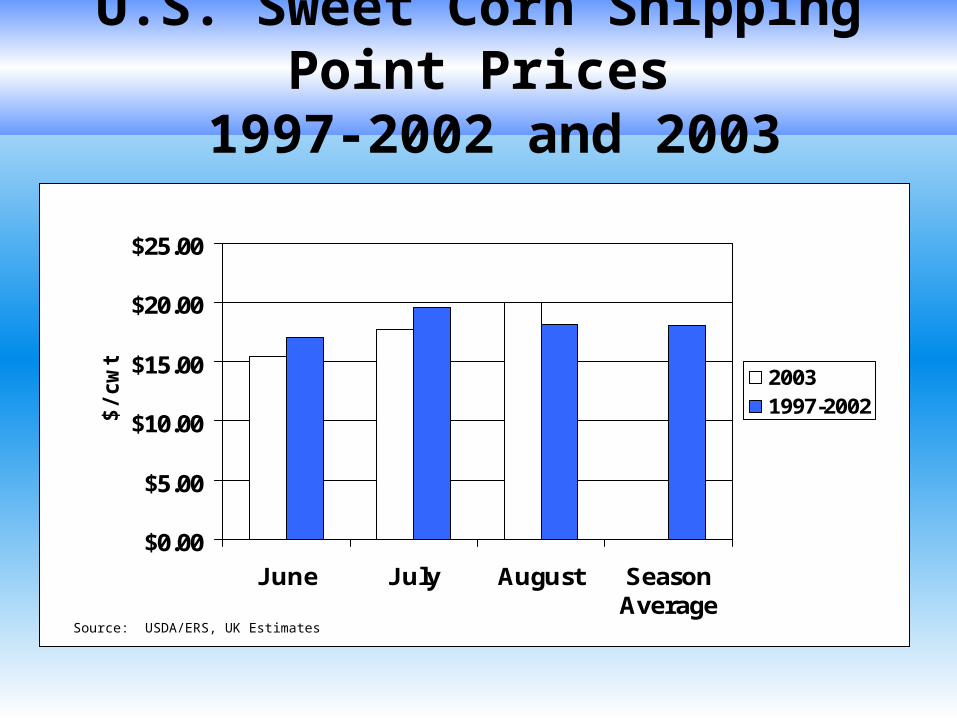
20031997-2002
Source: USDA/ERS, UK Estimates
U.S. Sweet Corn Shipping Point Prices 1997-2002 and 2003
$0$5
$10$15$20$25$30$35$40$45$50
J une J uly August SeasonAverage
$/cw
t 20031997-2002
Source: USDA/ERS, UK Estimates
U.S. Tomato f.o.b. Shipping Point Prices

Source: USDA/ERS
Tomato Imports Continue to Grow
$0
$100
$200
$300
$400
$500
$600
$700
$800
$900
Other
Netherlands
Mexico
Canada
Million $
U.S. Tomato Imports
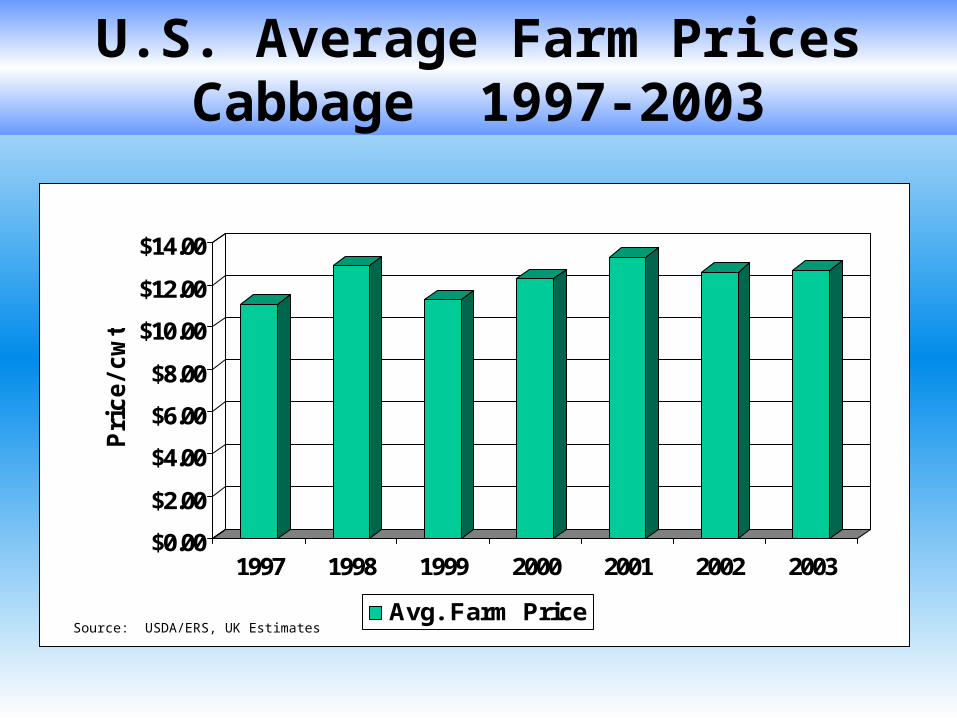
$0.00
$2.00
$4.00
$6.00
$8.00
$10.00
$12.00
$14.00
Pri
ce/cw
t
1997 1998 1999 2000 2001 2002 2003
Avg. Farm PriceSource: USDA/ERS, UK Estimates
U.S. Average Farm PricesCabbage 1997-2003
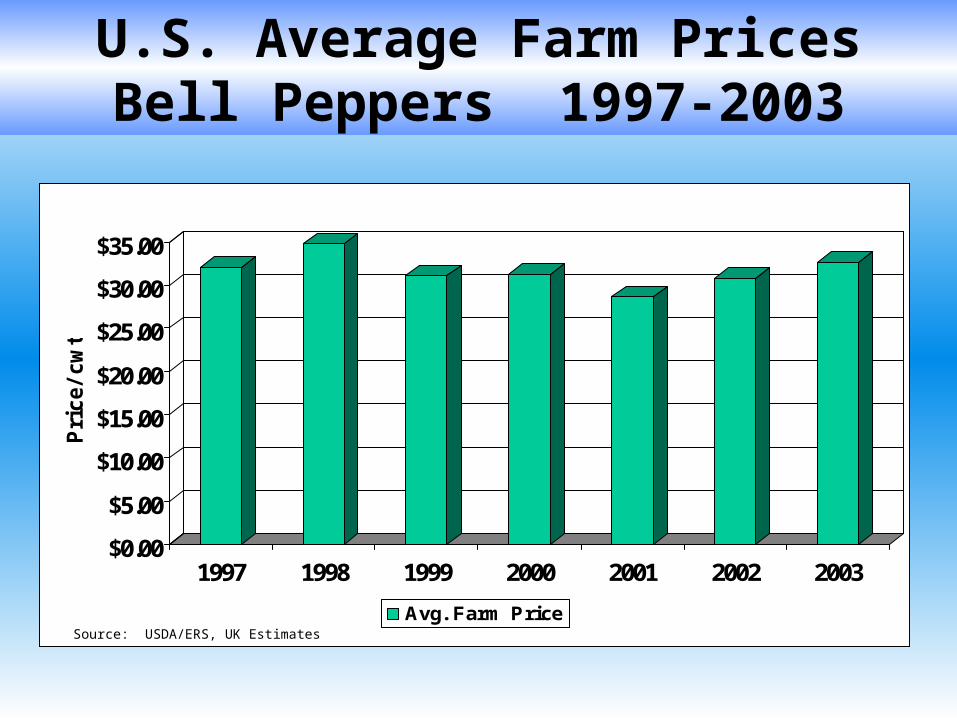
$0.00
$5.00
$10.00
$15.00
$20.00
$25.00
$30.00
$35.00
Pri
ce/cw
t
1997 1998 1999 2000 2001 2002 2003
Avg. Farm PriceSource: USDA/ERS, UK Estimates
U.S. Average Farm PricesBell Peppers 1997-2003
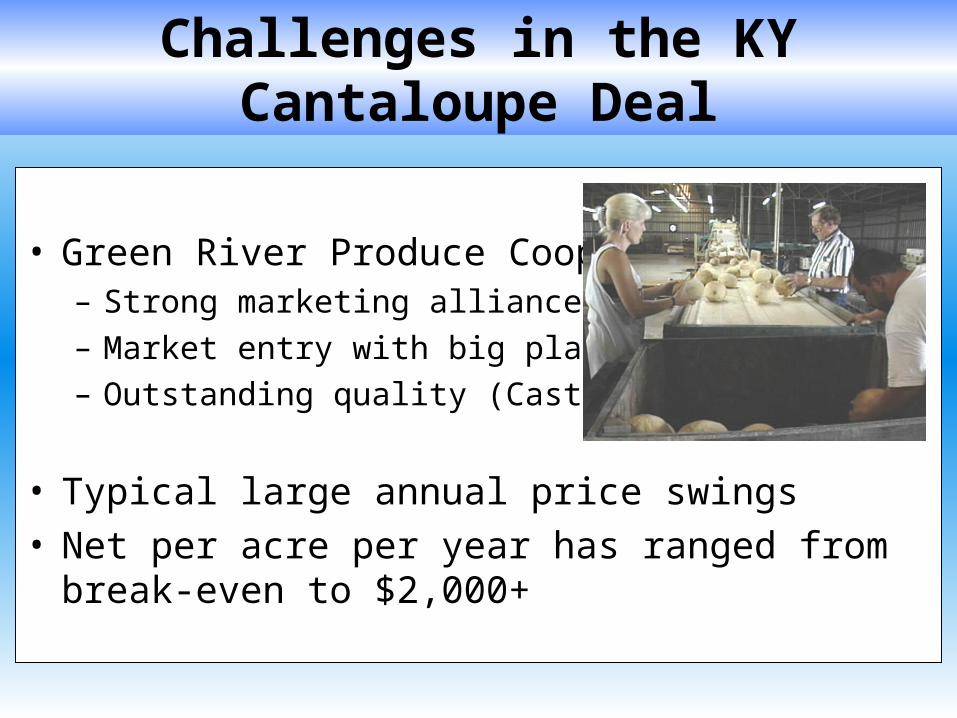
• Green River Produce Cooperative– Strong marketing alliance
– Market entry with big players
– Outstanding quality (Castellini’s)
• Typical large annual price swings• Net per acre per year has ranged from break-even to
$2,000+
Challenges in the KY Cantaloupe Deal
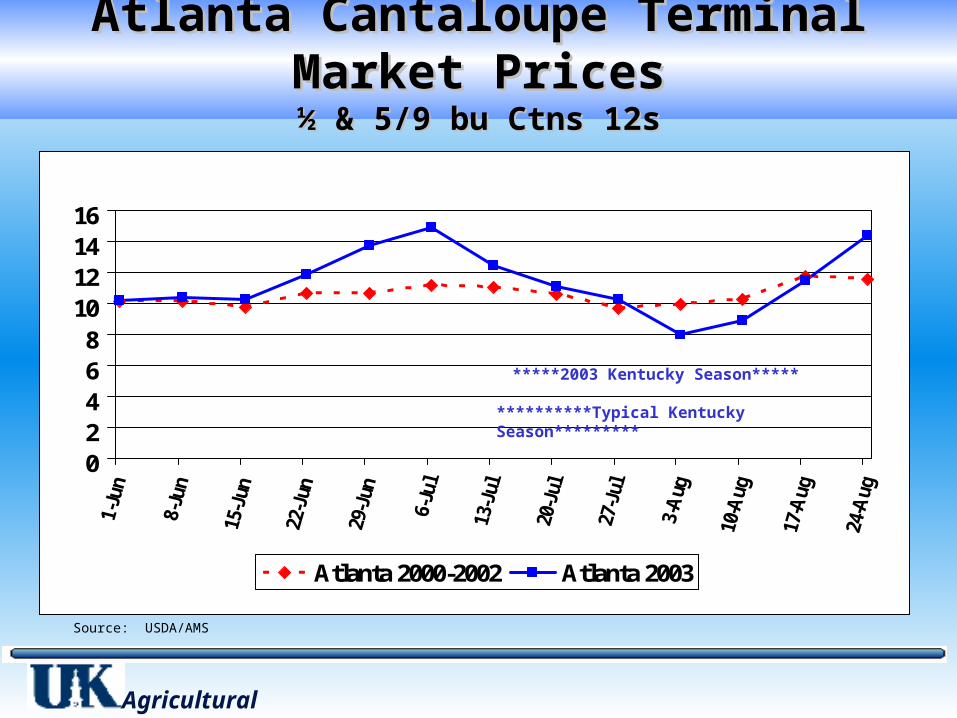
Atlanta Cantaloupe Terminal Market PricesAtlanta Cantaloupe Terminal Market Prices½ & 5/9 bu Ctns 12s½ & 5/9 bu Ctns 12s
Agricultural Economics
Source: USDA/AMS
02468
10121416
Atlanta 2000-2002 Atlanta 2003
**********Typical Kentucky Season*********
*****2003 Kentucky Season*****

Detroit Cantaloupe Terminal Market PricesDetroit Cantaloupe Terminal Market Prices½ & 5/9 bu Ctns 12s½ & 5/9 bu Ctns 12s
Agricultural Economics
Source: USDA/AMS
02468
10121416
Detroit 2000-2002 Detroit 2003
*****2003 Kentucky Season*****
**********Typical Kentucky Season*********

St. Louis Cantaloupe Terminal Market PricesSt. Louis Cantaloupe Terminal Market Prices½ & 5/9 bu Ctns 12s½ & 5/9 bu Ctns 12s
Agricultural Economics
Source: USDA/AMS
02468
1012141618
StL 2000-2002 St. Louis 2003
*****2003 Kentucky Season*****
**********Typical Kentucky Season*********
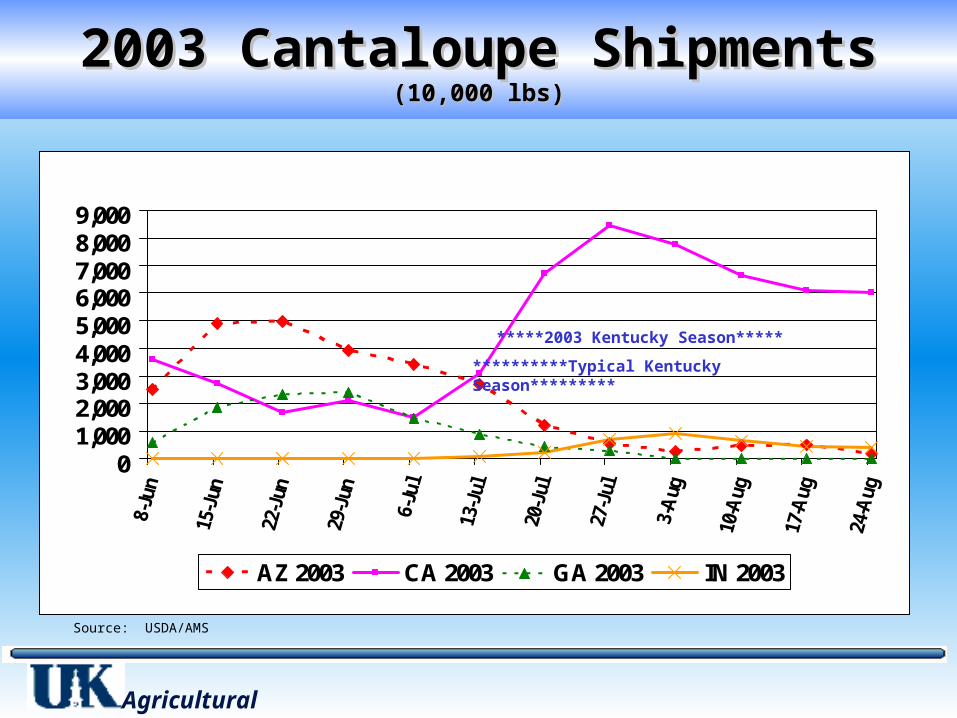
2003 Cantaloupe Shipments2003 Cantaloupe Shipments(10,000 lbs)(10,000 lbs)
Agricultural Economics
Source: USDA/AMS
01,0002,0003,0004,0005,0006,0007,0008,0009,000
AZ 2003 CA 2003 GA 2003 IN 2003
*****2003 Kentucky Season*****
**********Typical Kentucky Season*********
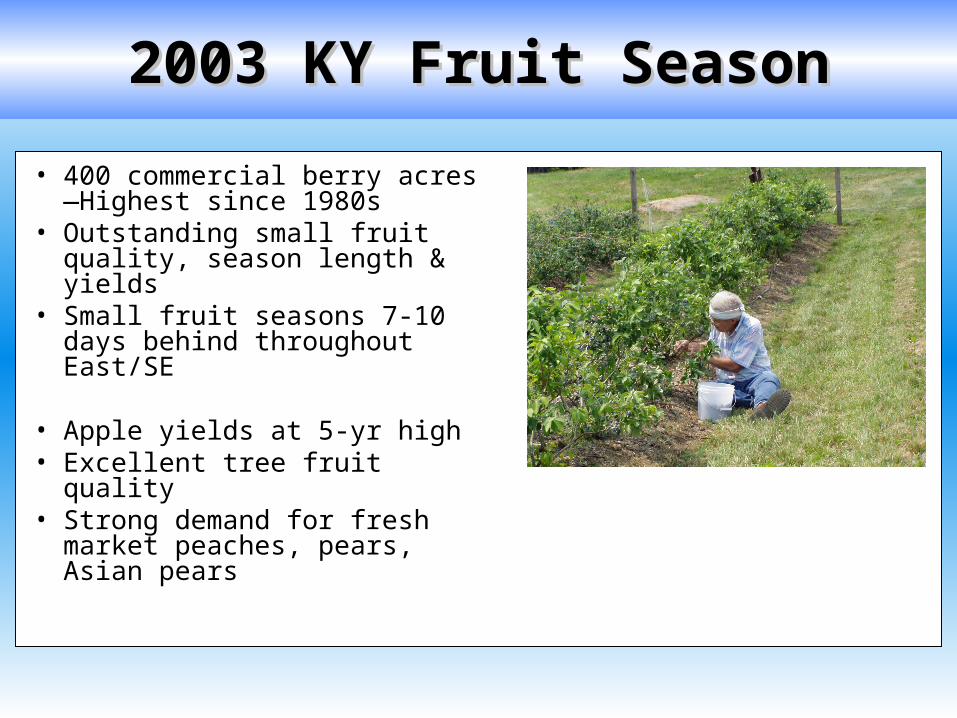
• 400 commercial berry acres—Highest since 1980s
• Outstanding small fruit quality, season length & yields
• Small fruit seasons 7-10 days behind throughout East/SE
• Apple yields at 5-yr high• Excellent tree fruit quality• Strong demand for fresh market
peaches, pears, Asian pears
2003 KY Fruit Season2003 KY Fruit Season

0
100,000,000
200,000,000
300,000,000
400,000,000
500,000,000
600,000,000
700,000,000
1987 1992 1997 2002*
Bearing Vines
Nonbearing Vines
Sources: 1987-97: US Ag Census; *2002: USDA/ERS; wineinstitute.org; CA Dept. of Food and Agriculture
2002 estimate includes 1,179,545 acres
U.S. Grape Vines 1987-2002U.S. Grape Vines 1987-2002
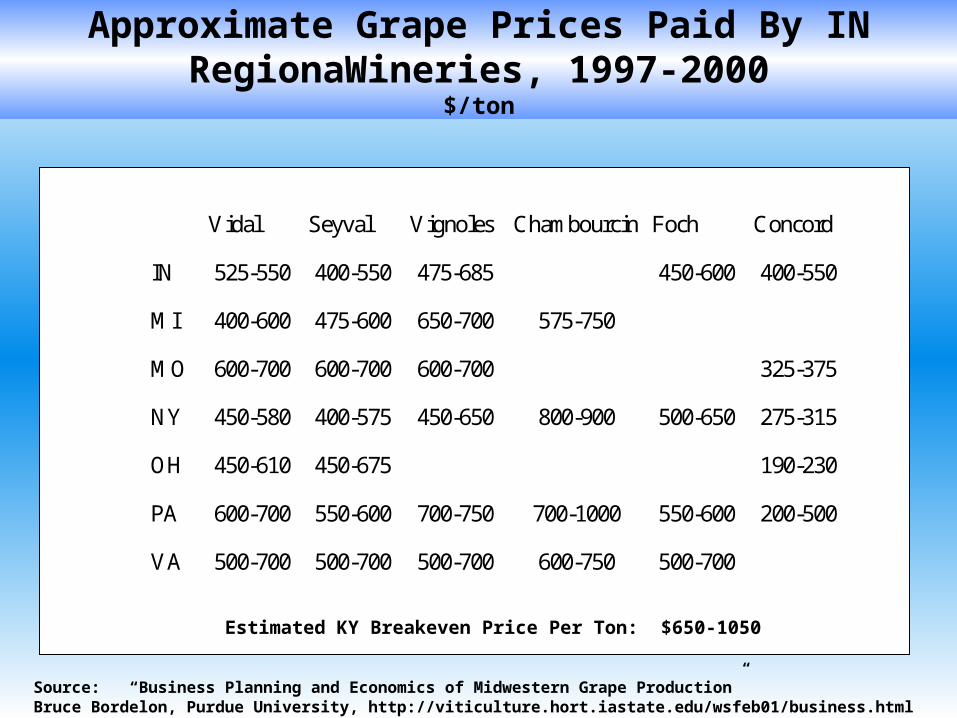
Vidal Seyval Vignoles Chambourcin Foch Concord
IN 525-550 400-550 475-685 450-600 400-550
MI 400-600 475-600 650-700 575-750
MO 600-700 600-700 600-700 325-375
NY 450-580 400-575 450-650 800-900 500-650 275-315
OH 450-610 450-675 190-230
PA 600-700 550-600 700-750 700-1000 550-600 200-500
VA 500-700 500-700 500-700 600-750 500-700
Estimated KY Breakeven Price Per Ton: $650-1050
Source: “Business Planning and Economics of Midwestern Grape Production”Bruce Bordelon, Purdue University, http://viticulture.hort.iastate.edu/wsfeb01/business.html
Approximate Grape Prices Paid By IN RegionaWineries, 1997-2000
$/ton
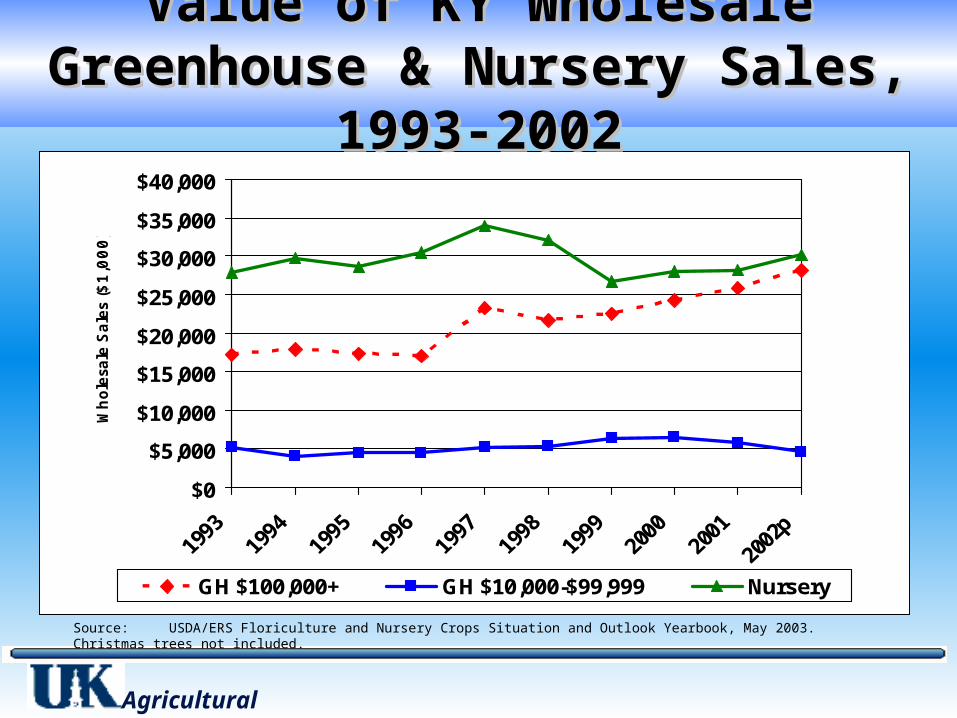
Value of KY Wholesale Greenhouse & Value of KY Wholesale Greenhouse & Nursery Sales, 1993-2002Nursery Sales, 1993-2002
Agricultural Economics
$0
$5,000
$10,000
$15,000
$20,000
$25,000
$30,000
$35,000
$40,000
Whole
sale
Sale
s ($
1,0
00)
GH $100,000+ GH $10,000-$99,999 Nursery
Source: USDA/ERS Floriculture and Nursery Crops Situation and Outlook Yearbook, May 2003. Christmas trees not included.


![[Ernst Kurth] Ernst Kurth Selected Writings (Camb(BookFi.org)](https://img.pdfslide.us/doc/110x75/55cf92c2550346f57b99475f/ernst-kurth-ernst-kurth-selected-writings-cambbookfiorg.jpg)