Embed Size (px)
Citation preview

Kentucky Data from www.higheredinfo.org
Council on Postsecondary EducationWorkforce/Economic Development Policy Group
May 24, 2004Christina E. Whitfield

The Workforce
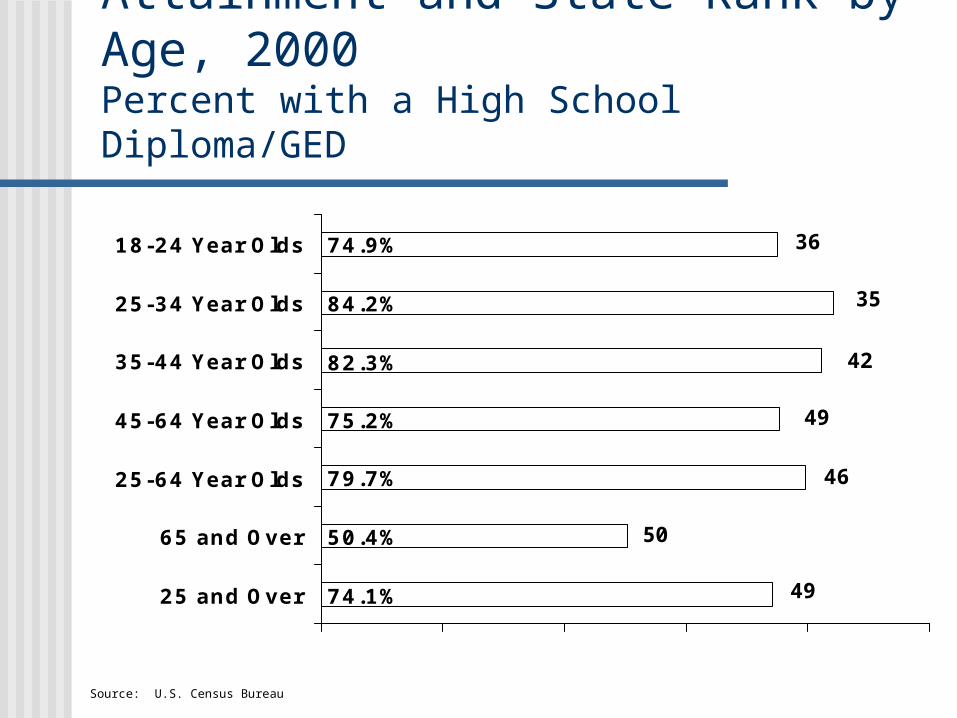
Kentucky Educational Attainment and State Rank by Age, 2000Percent with a High School Diploma/GED
74.1%
50.4%
79.7%
75.2%
82.3%
84.2%
74.9%
25 and Over
65 and Over
25-64 Year Olds
45-64 Year Olds
35-44 Year Olds
25-34 Year Olds
18-24 Year Olds
Source: U.S. Census Bureau
36
35
42
49
46
50
49
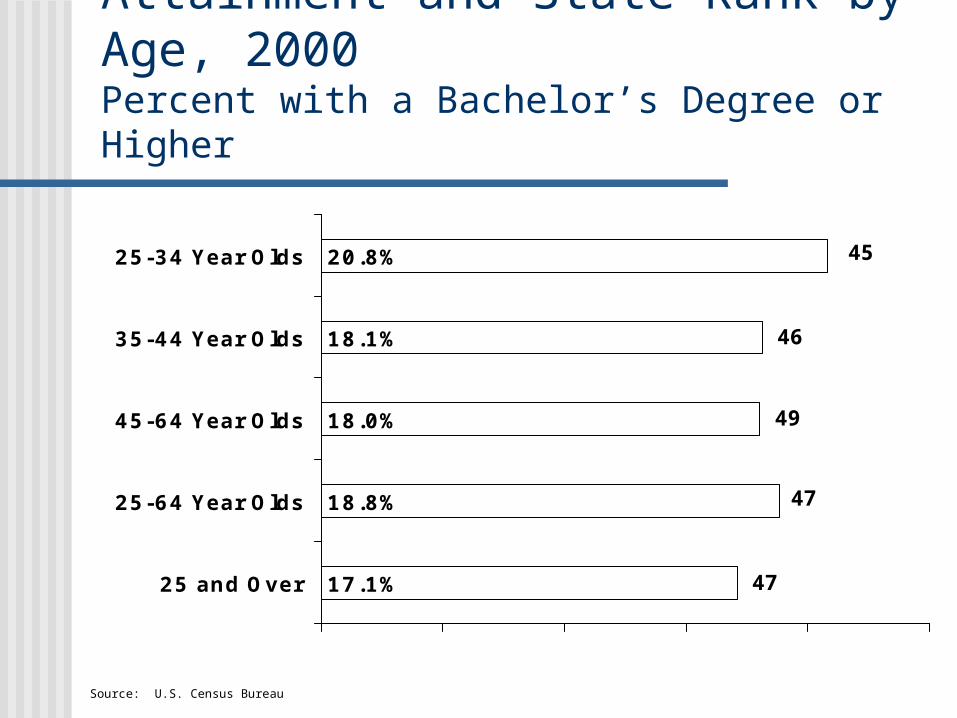
Kentucky Educational Attainment and State Rank by Age, 2000Percent with a Bachelor’s Degree or Higher
17.1%
18.8%
18.0%
18.1%
20.8%
25 and Over
25-64 Year Olds
45-64 Year Olds
35-44 Year Olds
25-34 Year Olds
Source: U.S. Census Bureau
45
46
49
47
47
Pike
Ohio
Clay
Hart
Pulaski
Hardin
Logan
BellTrigg
Lewis
Christian
Graves
Casey
BarrenWarren
Adair
ToddKnox
Butler
Floyd
WayneHarlan
Laurel Leslie
Carter
Hopkins Perry
Allen
KnottGrayson
Daviess
Bath
Nelson
Owen
Union LeeBreathitt
Shelby
Whitley
Scott
Madison
Lyon
Estill
MorganMeade Bullitt
Marion
Green
Henry
Clark
Grant
Larue
Breckinridge
Letcher
Lincoln Jackson
Jefferson
Calloway
Henderson
Lawrence
McCreary
Fleming
Monroe
Taylor
Greenup
Rowan
Webster
Fayette
Boone
MuhlenbergCaldwell
Russell
Marshall
Elliott
Ballard
Mason
Wolfe
Harrison
Crittenden
MercerMartin
Bourbon
Metcalfe
Magoffin
Johnson
Livingston
Fulton
McLean
Boyle Garrard
Boyd
Rockcastle
Edmonson
Pendleton
Hickman ClintonSimpson
Owsley
Powell
Carlisle
Franklin
Cumberland
Bracken
Washington
Menifee
Oldham
Spencer
McCracken
Kenton
Hancock
Nicholas
Anderson
TrimbleCarroll
Woodford
Jessamine
Campbell
Montgomery
Gallatin
Robertson
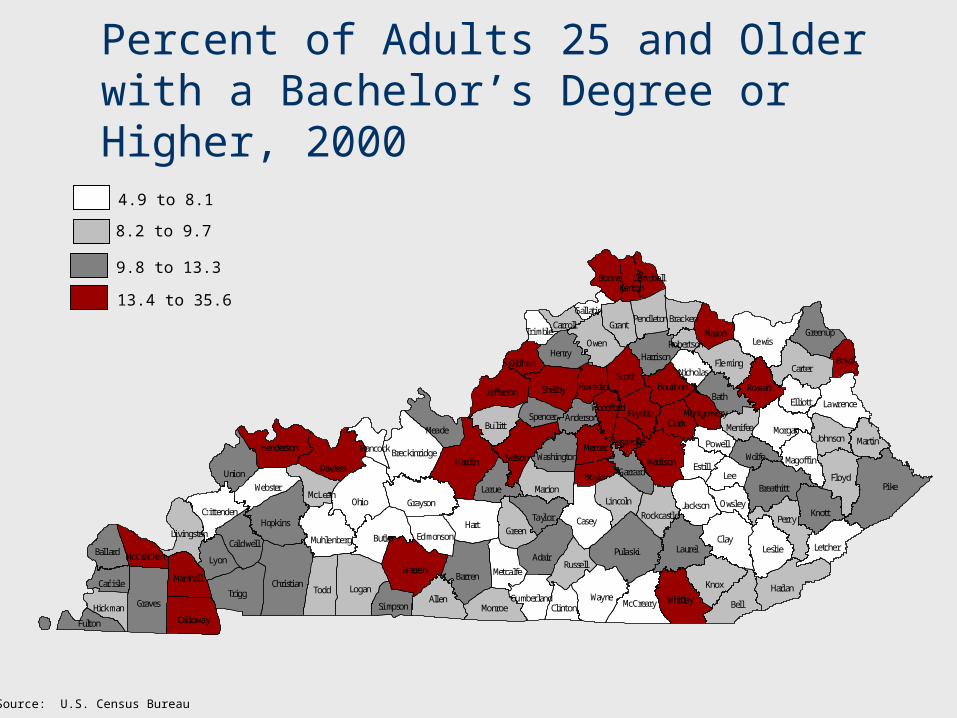
Percent of Adults 25 and Older with a Bachelor’s Degree or Higher, 2000
4.9 to 8.1
8.2 to 9.7
9.8 to 13.3
13.4 to 35.6
Source: U.S. Census Bureau
Pike
Ohio
Clay
Hart
Pulaski
Hardin
Logan
BellTrigg
Lewis
Christian
Graves
Casey
BarrenWarren
Adair
ToddKnox
Butler
Floyd
WayneHarlan
Laurel Leslie
Carter
Hopkins Per y
Allen
KnottGrayson
Daviess
Bath
Nelson
Owen
Union LeeBreathitt
Shelby
Whitley
Scott
Madison
Lyon
Estill
MorganMeade Bullitt
Marion
Green
Henry
Clark
Grant
Larue
Breckinridge
Letcher
Lincoln Jackson
Jefferson
Calloway
Henderson
Lawrence
McCreary
Fleming
Monroe
Taylor
Greenup
Rowan
Webster
Fayette
Boone
MuhlenbergCaldwell
Russell
Marshall
Elliott
Ballard
Mason
Wolfe
Harrison
Crittenden
MercerMartin
Bourbon
Metcalfe
Magoffin
Johnson
Livingston
Fulton
McLean
Boyl arrard
Boyd
Rockcastle
Edmonson
Pendleton
Hickman ClintonSimpson
O sley
Powell
Carlisle
Franklin
Cumberland
Bracken
Washington
Menifee
Oldham
Spencer
McCracken
Ke
nton
Hancock
Nicholas
Anderson
TrimbleCarroll
Woodford
Jessamine
Campb ll
ontgomery
Gallatin
Robertson
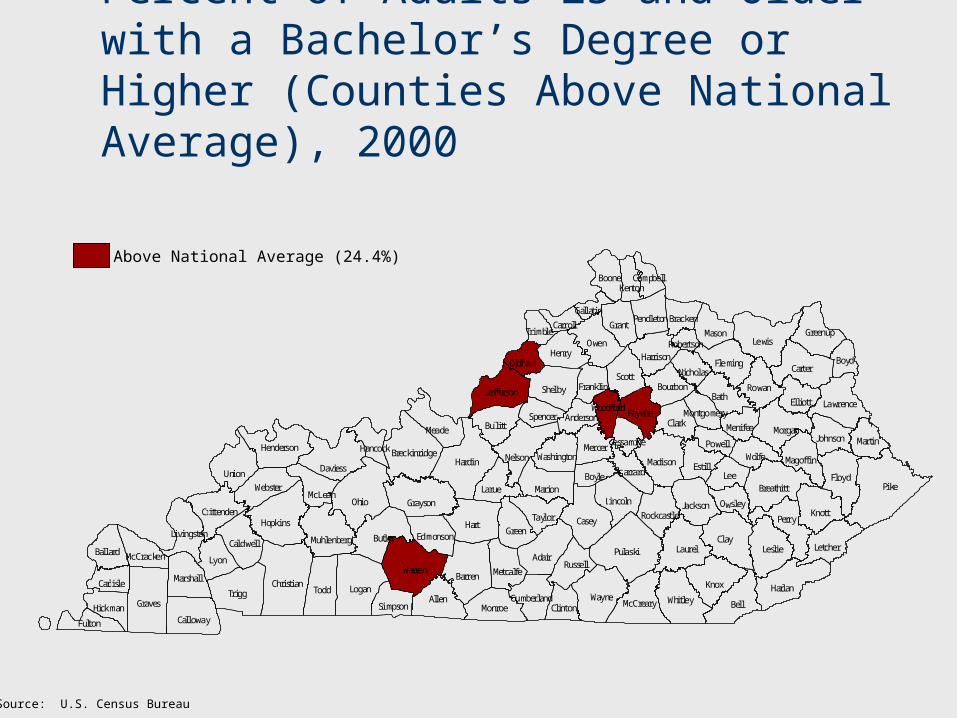
Percent of Adults 25 and Older with a Bachelor’s Degree or Higher (Counties Above National Average), 2000
Above National Average (24.4%)
Source: U.S. Census Bureau
e G
M
w
r
e
Pike
Ohio
Clay
Hart
Pulaski
Hardin
Logan
BellTrigg
Lewis
Christian
Graves
Casey
BarrenWarren
Adair
ToddKnox
Butler
Floyd
WayneHarlan
Laurel Leslie
Carter
Hopkins Per y
Allen
KnottGrayson
Daviess
Bath
Nelson
Owen
Union LeeBreathitt
Shelby
Whitley
Scott
Madison
Lyon
Estill
MorganMeade Bullitt
Marion
Green
Henry
Clark
Grant
Larue
Breckinridge
Letcher
Lincoln Jackson
Jefferson
Calloway
Henderson
Lawrence
McCreary
Fleming
Monroe
Taylor
Greenup
Rowan
Webster
Fayette
Boone
MuhlenbergCaldwell
Russell
Marshall
Elliott
Ballard
Mason
Wolfe
Harrison
Crittenden
MercerMartin
Bourbon
Metcalfe
Magoffin
Johnson
Livingston
Fulton
McLean
Boyl arrard
Boyd
Rockcastle
Edmonson
Pendleton
Hickman ClintonSimpson
O sley
Powell
Carlisle
Franklin
Cumberland
Bracken
Washington
Menifee
Oldham
Spencer
McCracken
Ke
nton
Hancock
Nicholas
Anderson
TrimbleCarroll
Woodford
Jessamine
Campb ll
ontgomery
Gallatin
Robertson
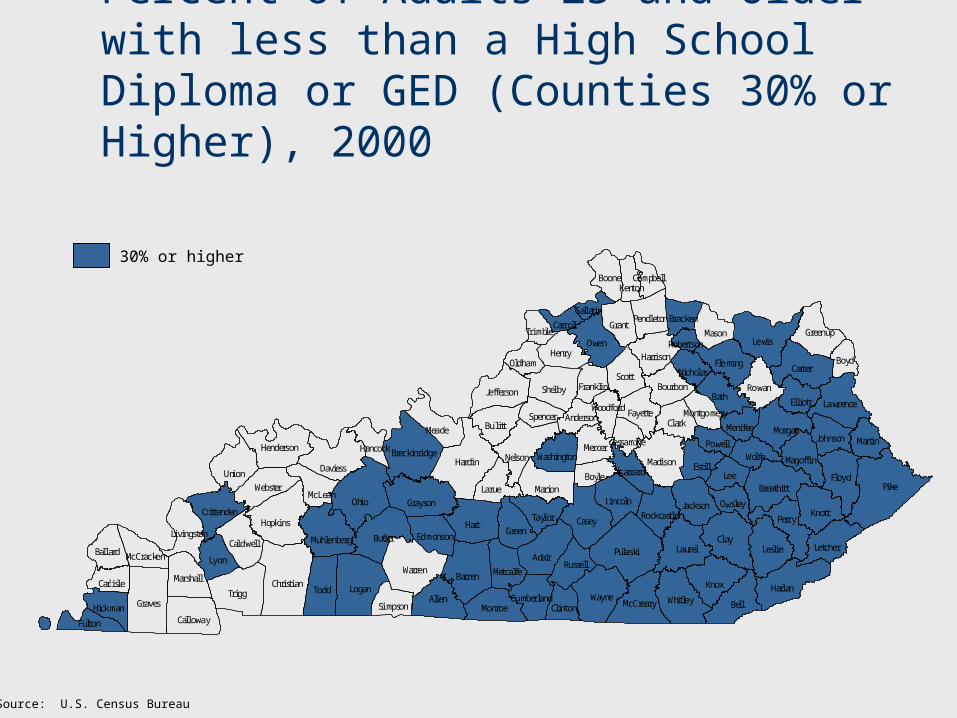
Percent of Adults 25 and Older with less than a High School Diploma or GED (Counties 30% or Higher), 2000
30% or higher
Source: U.S. Census Bureau
e G
M
w
r
e
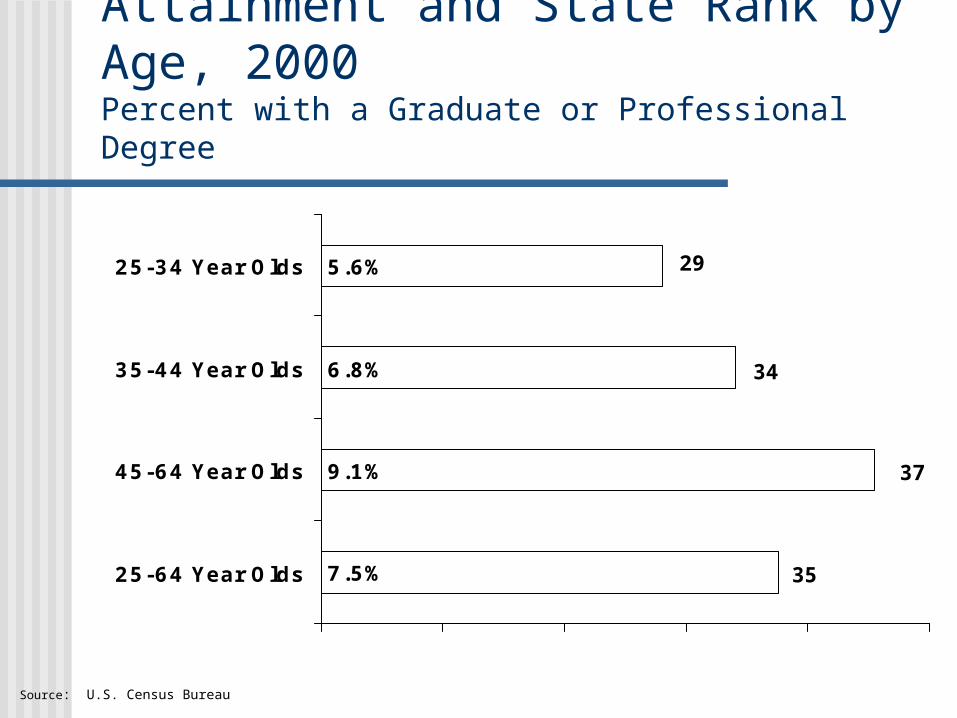
Kentucky Educational Attainment and State Rank by Age, 2000Percent with a Graduate or Professional Degree
7.5%
9.1%
6.8%
5.6%
25-64 Year Olds
45-64 Year Olds
35-44 Year Olds
25-34 Year Olds
Source: U.S. Census Bureau
29
34
37
35
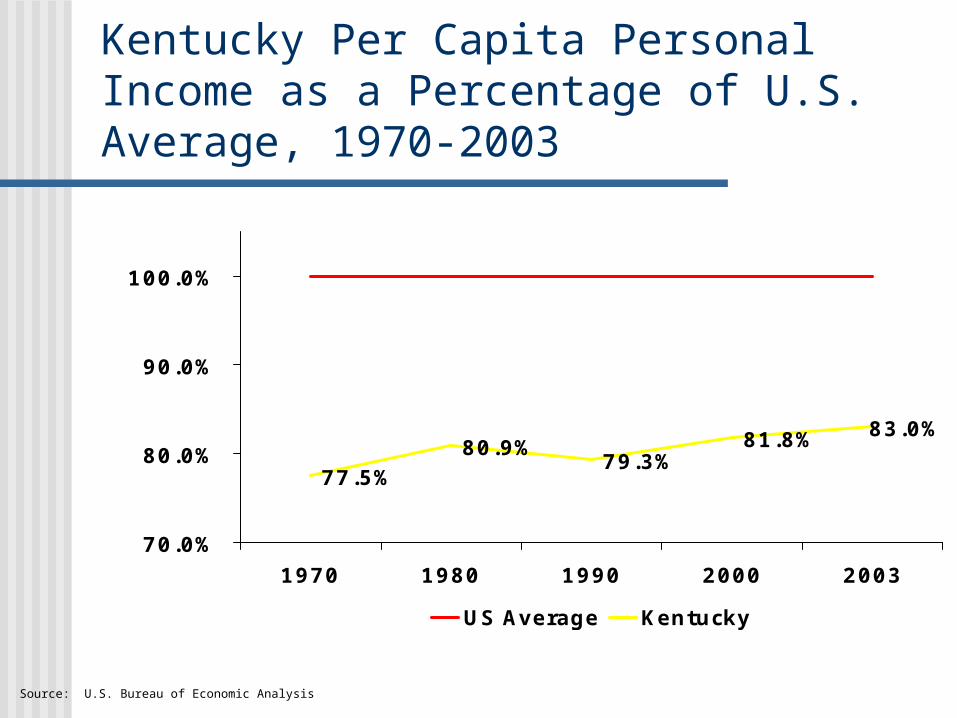
Kentucky Per Capita Personal Income as a Percentage of U.S. Average, 1970-2003
77.5%80.9%
79.3%81.8% 83.0%
70.0%
80.0%
90.0%
100.0%
1970 1980 1990 2000 2003
US Average Kentucky
Source: U.S. Bureau of Economic Analysis
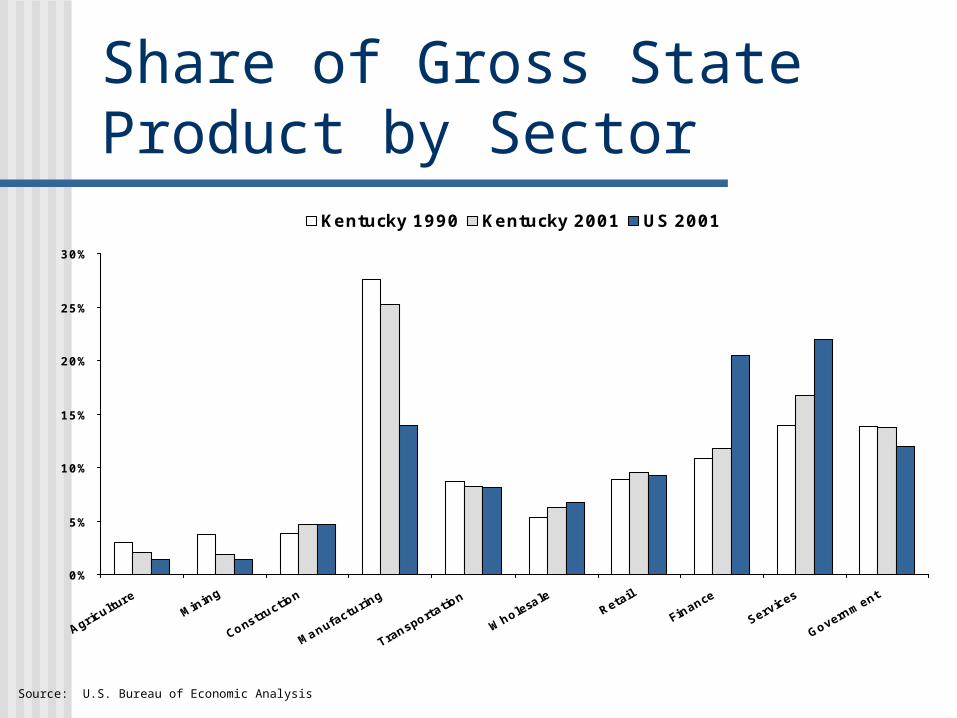
Share of Gross State Product by Sector
0%
5%
10%
15%
20%
25%
30%
Agricultu
reMining
Constructio
n
Manufacturin
g
Transportatio
n
Wholesale
Retail
Finance
Services
Government
Kentucky 1990 Kentucky 2001 US 2001
Source: U.S. Bureau of Economic Analysis

Percent Employment in Professional and Management Occupations, 2000
Mar
yland
Mas
sach
uset
ts
Conn
ectic
ut
Virg
inia
New
Jers
ey
Colora
do
New
York
Verm
ont
Califor
nia
Minne
sota
New
Hamps
hire
Was
hing
ton
Dela
ware
Alas
ka
Illinois
New
Mexico
Kans
as
Rhod
e Island
Natio
n
North
Dako
ta
Texa
s
Mon
tana
Oreg
on
Nebr
aska
Arizon
a
Geor
gia
Penn
sylvan
ia
Sout
h Da
kota
Utah
Hawa
ii
Flor
ida
Maine
Michiga
n
Miss
ouri
Idah
o
Iowa
Wisc
onsin
North
Caro
lina
Ohio
Okla
hom
a
Wyo
ming
Louisian
a
Alab
ama
Tenn
esse
e
Sout
h Ca
rolin
a
Indian
a
Kent
ucky
Wes
t Virg
inia
Arka
nsas
Miss
issippi
Neva
da
Source: U.S. Census Bureau
41.3
33.6
25.728.7
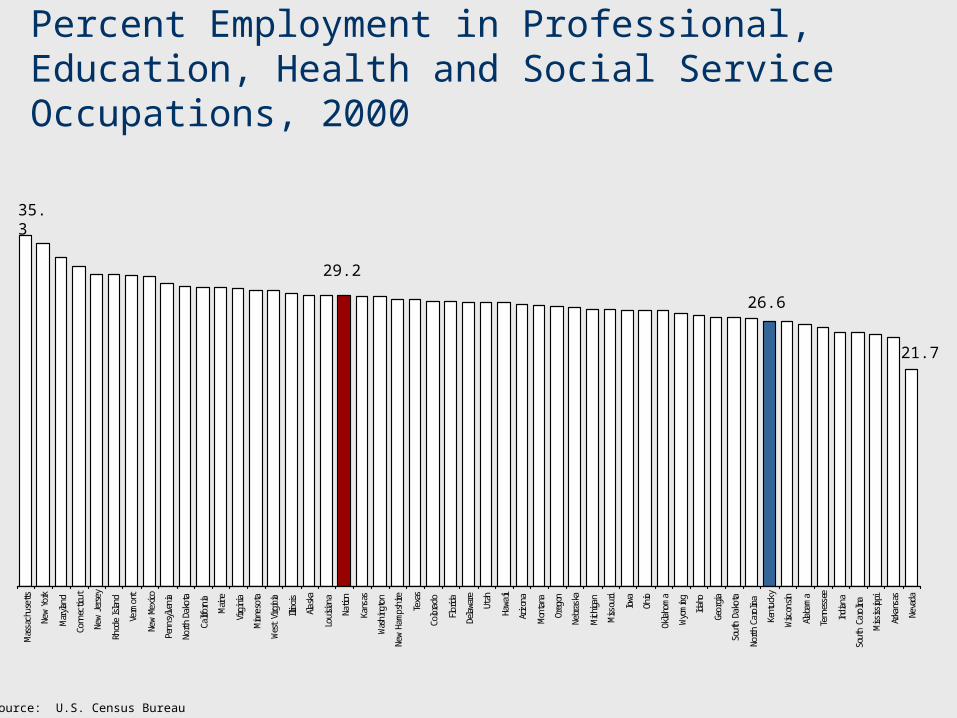
Percent Employment in Professional, Education, Health and Social Service Occupations, 2000
Mas
sach
uset
ts
New
York
Mar
yland
Conn
ectic
ut
New
Jers
ey
Rhod
e Island
Verm
ont
New
Mexico
Penn
sylvan
ia
North
Dako
ta
Califor
nia
Maine
Virg
inia
Minne
sota
Wes
t Virg
inia
Illinois
Alas
ka
Louisian
a
Natio
n
Kans
as
Was
hing
ton
New
Hamps
hire
Texa
s
Colora
do
Flor
ida
Dela
ware
Utah
Hawa
ii
Arizon
a
Mon
tana
Oreg
on
Nebr
aska
Michiga
n
Miss
ouri
Iowa
Ohio
Okla
hom
a
Wyo
ming
Idah
o
Geor
gia
Sout
h Da
kota
North
Caro
lina
Kent
ucky
Wisc
onsin
Alab
ama
Tenn
esse
e
Indian
a
Sout
h Ca
rolin
a
Miss
issippi
Arka
nsas
Neva
da
35.3
29.2
21.7
26.6
Source: U.S. Census Bureau

College Participation and Completion
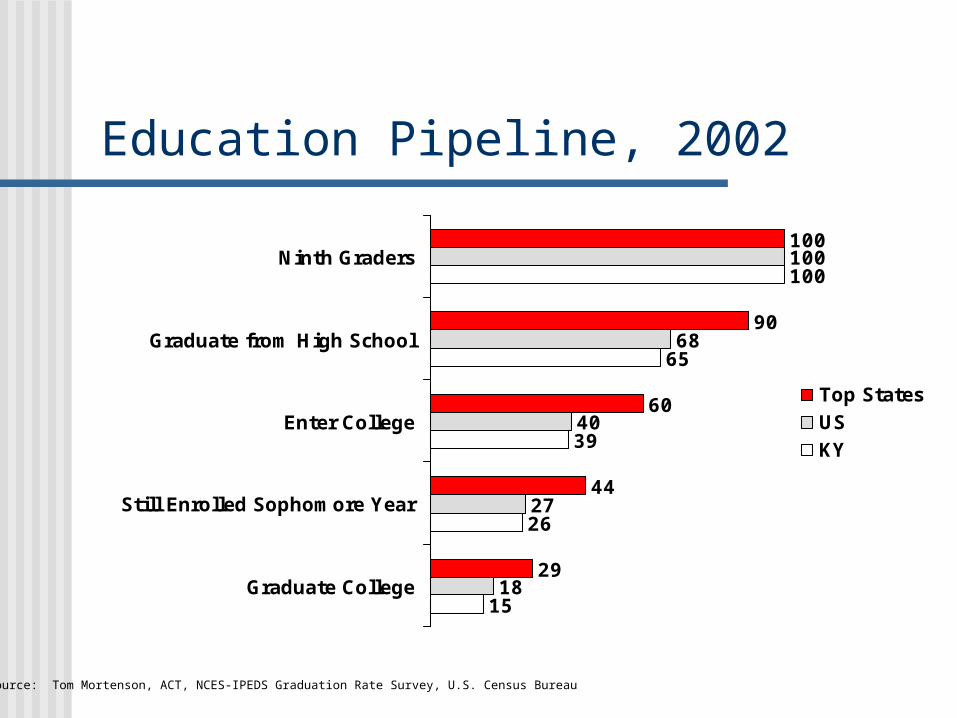
Education Pipeline, 2002
15
26
39
65
100
18
27
40
68
100
29
44
60
90
100
Graduate College
Still Enrolled Sophomore Year
Enter College
Graduate from High School
Ninth Graders
Top StatesUSKY
Source: Tom Mortenson, ACT, NCES-IPEDS Graduation Rate Survey, U.S. Census Bureau
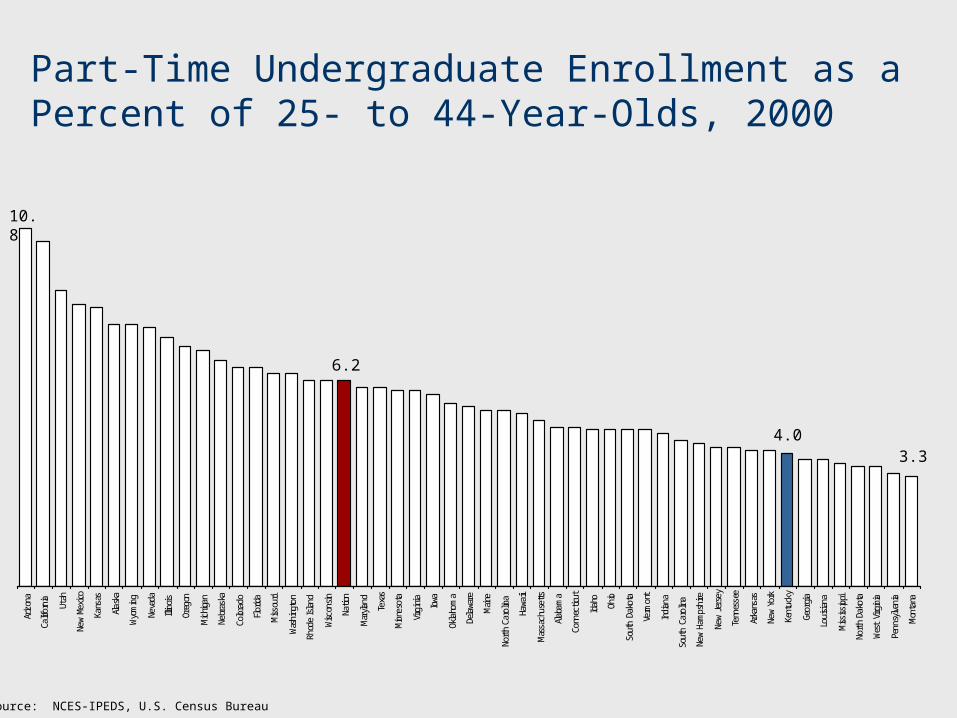
Part-Time Undergraduate Enrollment as a Percent of 25- to 44-Year-Olds, 2000
Arizon
a
Califor
nia
Utah
New
Mexico
Kans
as
Alas
ka
Wyo
ming
Neva
da
Illinois
Oreg
on
Michiga
n
Nebr
aska
Colora
do
Flor
ida
Miss
ouri
Was
hing
ton
Rhod
e Island
Wisc
onsin
Natio
n
Mar
yland
Texa
s
Minne
sota
Virg
inia
Iowa
Okla
hom
a
Dela
ware
Maine
North
Caro
lina
Hawa
ii
Mas
sach
uset
ts
Alab
ama
Conn
ectic
ut
Idah
o
Ohio
Sout
h Da
kota
Verm
ont
Indian
a
Sout
h Ca
rolin
a
New
Hamps
hire
New
Jers
ey
Tenn
esse
e
Arka
nsas
New
York
Kent
ucky
Geor
gia
Louisian
a
Miss
issippi
North
Dako
ta
Wes
t Virg
inia
Penn
sylvan
ia
Mon
tana
10.8
6.2
3.34.0
Source: NCES-IPEDS, U.S. Census Bureau
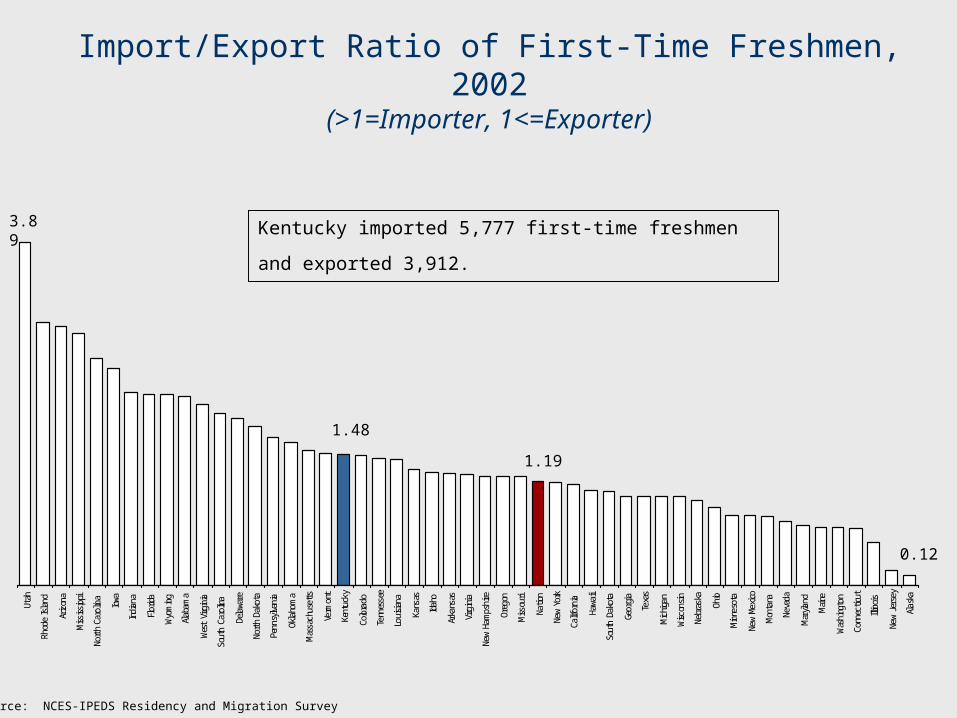
Import/Export Ratio of First-Time Freshmen, 2002(>1=Importer, 1<=Exporter)
Utah
Rhod
e Island
Arizon
a
Miss
issippi
North
Caro
lina
Iowa
Indian
a
Flor
ida
Wyo
ming
Alab
ama
Wes
t Virg
inia
Sout
h Ca
rolin
a
Dela
ware
North
Dako
ta
Penn
sylvan
ia
Okla
hom
a
Mas
sach
uset
ts
Verm
ont
Kent
ucky
Colora
do
Tenn
esse
e
Louisian
a
Kans
as
Idah
o
Arka
nsas
Virg
inia
New
Hamps
hire
Oreg
on
Miss
ouri
Natio
n
New
York
Califor
nia
Hawa
ii
Sout
h Da
kota
Geor
gia
Texa
s
Michiga
n
Wisc
onsin
Nebr
aska
Ohio
Minne
sota
New
Mexico
Mon
tana
Neva
da
Mar
yland
Maine
Was
hing
ton
Conn
ectic
ut
Illinois
New
Jers
ey
Alas
ka
Source: NCES-IPEDS Residency and Migration Survey
3.89
1.48
0.12
1.19
Kentucky imported 5,777 first-time freshmen and
exported 3,912.
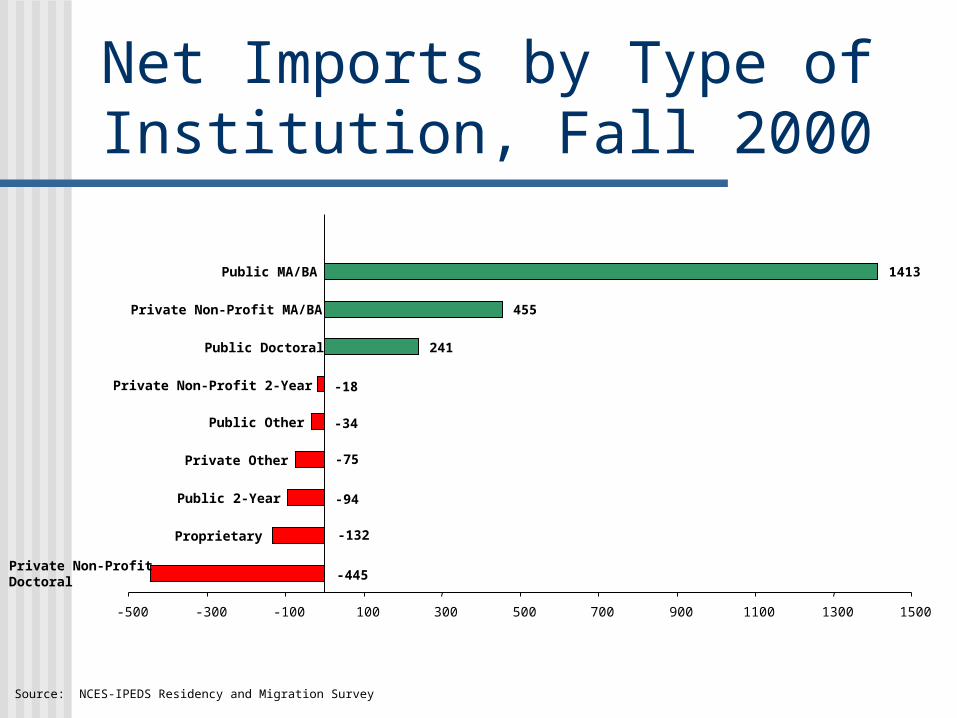
Net Imports by Type of Institution, Fall 2000
241
455
1413
-445
-132
-94
-75
-34
-18
-500 -300 -100 100 300 500 700 900 1100 1300 1500
Private Non-Profit Doctoral
Proprietary
Public 2-Year
Private Other
Public Other
Private Non-Profit 2-Year
Public Doctoral
Private Non-Profit MA/BA
Public MA/BA
Source: NCES-IPEDS Residency and Migration Survey
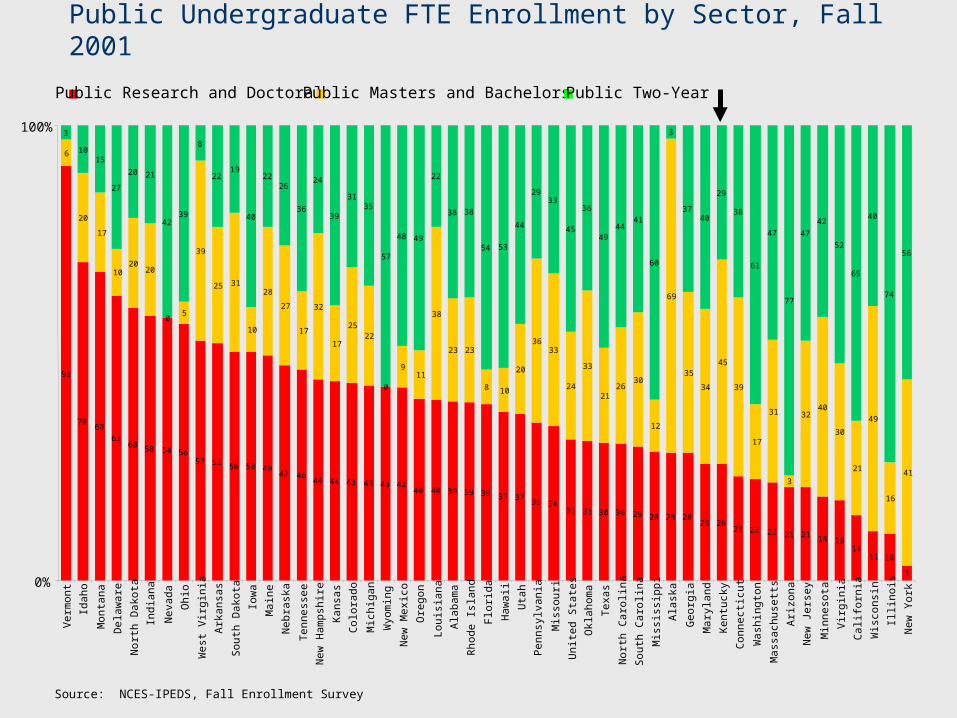
Public Undergraduate FTE Enrollment by Sector, Fall 2001
Source: NCES-IPEDS, Fall Enrollment Survey
91
7068
6360 58 58 56
53 52 50 50 4947 46
44 44 43 43 43 4240 40 39 39 39 37 37 35 34
31 31 30 30 29 28 28 2826 26
23 22 22 21 21 18 1814
11 10
3
6
20
17
1020
20
05
39
25 31
10
28
27
17
32
17
2522
0
911
38
23 23
8 10
20
3633
24
33
2126
30
12
69
35
34
45
39
17
31
3
3240
30
21
49
16
41
3
1015
27
20 21
4239
8
2219
40
2226
36
24
39
3135
57
48 49
22
38 38
54 53
44
2933
45
36
4944
41
60
3
3740
29
38
61
47
77
47
42
52
65
40
74
56
0%
100%
Verm
ont
Idaho
Montana
Delaw
are
North D
akota
Indiana
Nevada
Ohio
West V
irginia
Arkansas
South D
akota
Iowa
Maine
Nebraska
Tennessee
New
Ham
pshire
Kansas
Colorado
Michigan
Wyom
ing
New
Mexico
Oregon
Louisiana
Alabam
a
Rhode Island
Florida
Haw
aii
Utah
Pennsylvania
Missouri
United S
tates
Oklahom
a
Texas
North C
arolina
South C
arolina
Mississippi
Alaska
Georgia
Maryland
Kentucky
Connecticut
Washington
Massachusetts
Arizona
New
Jersey
Minnesota
Virginia
California
Wisconsin
Illinois
New
York
Public Research and Doctoral Public Masters and Bachelors Public Two-Year
Rhod
e Island
Mas
sach
uset
ts
Dela
ware
New
Hamps
hire
Was
hing
ton
Conn
ectic
ut
Iowa
Virg
inia
Penn
sylvan
ia
Mar
yland
Verm
ont
New
Jers
ey
Califor
nia
Illinois
Maine
North
Caro
lina
Wisc
onsin
Minne
sota
New
York
Wyo
ming
Natio
n
Indian
a
Ohio
Michiga
n
Miss
ouri
Colora
do
Sout
h Ca
rolin
a
Oreg
on
Flor
ida
Miss
issippi
Utah
Kans
as
Nebr
aska
Alab
ama
Texa
s
Tenn
esse
e
Arizon
a
Sout
h Da
kota
Hawa
ii
North
Dako
ta
Neva
da
Idah
o
Kent
ucky
Mon
tana
Geor
gia
Okla
hom
a
New
Mexico
Wes
t Virg
inia
Alas
ka
Arka
nsas
Louisian
a
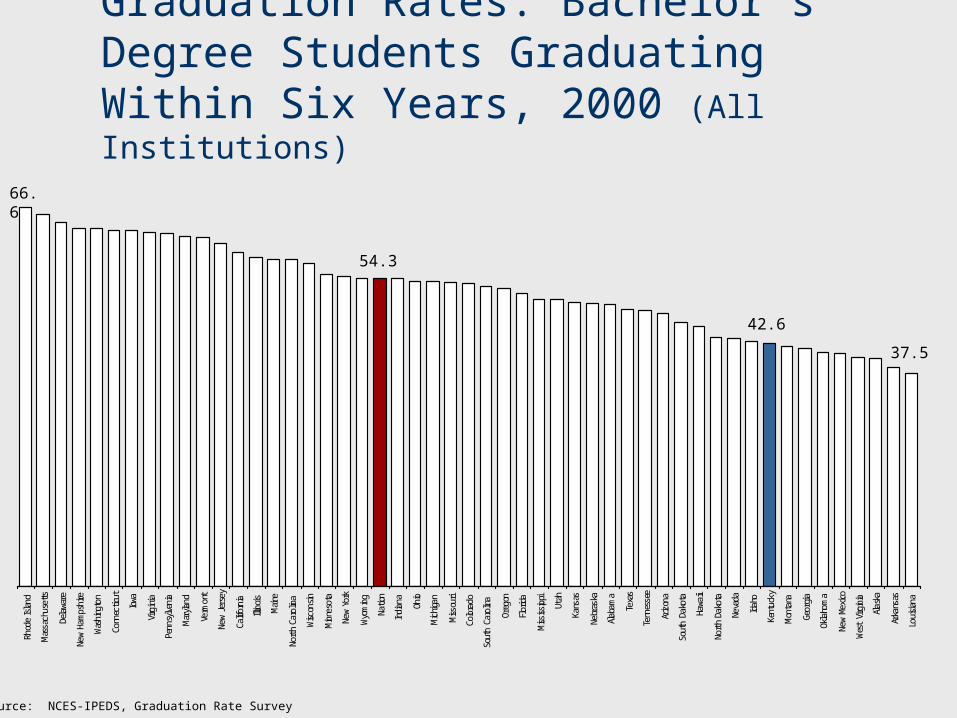
Source: NCES-IPEDS, Graduation Rate Survey
66.6
37.5
42.6
Graduation Rates: Bachelor’s Degree Students Graduating Within Six Years, 2000 (All Institutions)
54.3
Verm
ont
Mas
sach
uset
ts
Rhod
e Island
New
Hamps
hire
Penn
sylvan
ia
Mon
tana
North
Dako
ta
Dela
ware
Indian
a
New
York
Miss
ouri
Sout
h Da
kota
Iowa
Wes
t Virg
inia
Conn
ectic
ut
Utah
Maine
Nebr
aska
Ohio
Tenn
esse
e
Wisc
onsin
Colora
do
Louisian
a
Mar
yland
Sout
h Ca
rolin
a
Alab
ama
Michiga
n
Virg
inia
Okla
hom
a
New
Jers
ey
Miss
issippi
Natio
n
North
Caro
lina
Minne
sota
Geor
gia
Illinois
Kans
as
Hawa
ii
Arka
nsas
Kent
ucky
Oreg
on
Flor
ida
Texa
s
Was
hing
ton
Idah
o
Arizon
a
New
Mexico
Califor
nia
Wyo
ming
Alas
ka
Neva
da
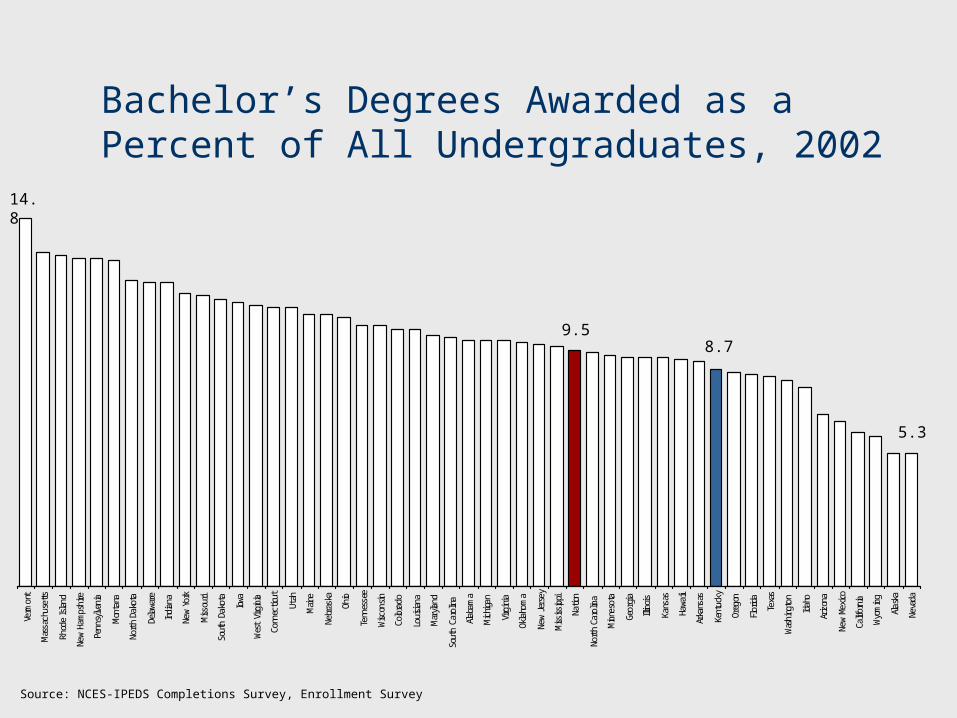
14.8
5.3
8.7
Bachelor’s Degrees Awarded as a Percent of All Undergraduates, 2002
9.5
Source: NCES-IPEDS Completions Survey, Enrollment Survey
Sout
h Da
kota
Wyo
ming
Alas
ka
Arizon
a
Penn
sylvan
ia
Califor
nia
North
Dako
ta
Nebr
aska
Maine
Wisc
onsin
New
Hamps
hire
Miss
ouri
Kans
as
Louisian
a
Wes
t Virg
inia
Flor
ida
Iowa
Minne
sota
Colora
do
Idah
o
Utah
Mon
tana
Geor
gia
Kent
ucky
Natio
n
Was
hing
ton
New
York
Verm
ont
Arka
nsas
Okla
hom
a
Indian
a
Illinois
Oreg
on
Tenn
esse
e
Ohio
Neva
da
Miss
issippi
Conn
ectic
ut
North
Caro
lina
Virg
inia
Texa
s
Alab
ama
Mas
sach
uset
ts
Hawa
ii
Michiga
n
Dela
ware
Sout
h Ca
rolin
a
Mar
yland
New
Jers
ey
New
Mexico
Rhod
e Island
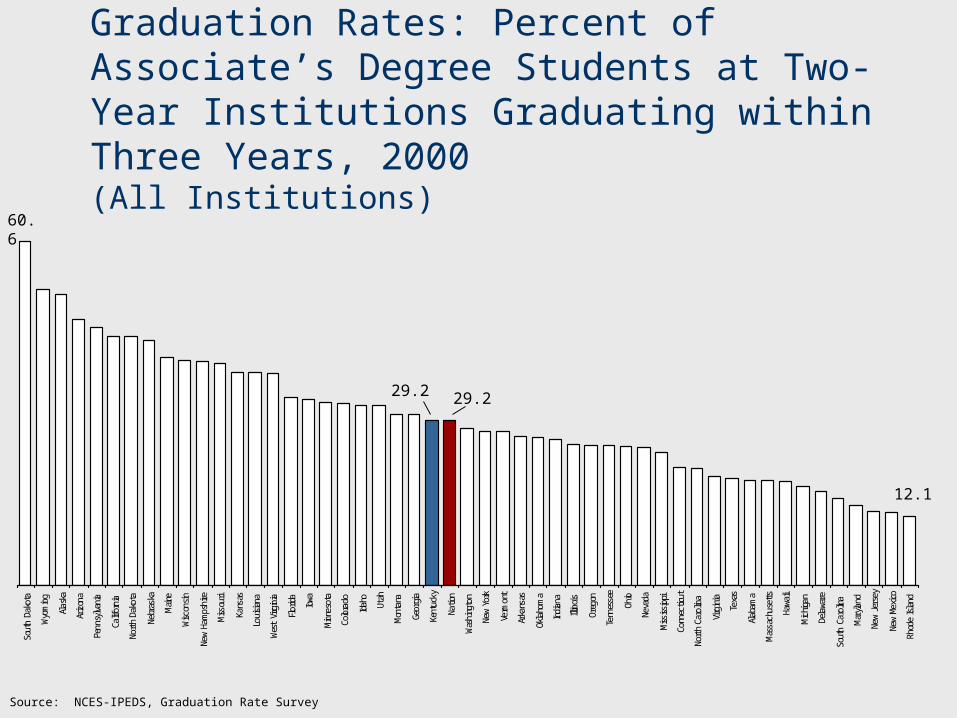
60.6
12.1
29.2
Graduation Rates: Percent of Associate’s Degree Students at Two-Year Institutions Graduating within Three Years, 2000(All Institutions)
29.2
Source: NCES-IPEDS, Graduation Rate Survey
Sout
h Da
kota
North
Dako
ta
Geor
gia
Wisc
onsin
Louisian
a
Wyo
ming
Penn
sylvan
ia
Iowa
Maine
Flor
ida
Minne
sota
Miss
issippi
Mas
sach
uset
ts
Wes
t Virg
inia
Sout
h Ca
rolin
a
Kans
as
New
Hamps
hire
Arka
nsas
Kent
ucky
Nebr
aska
New
York
Mon
tana
Was
hing
ton
North
Caro
lina
Utah
Idah
o
Miss
ouri
Arizon
a
Alab
ama
Colora
do
Dela
ware
Ohio
Hawa
ii
Okla
hom
a
Natio
n
Illinois
Indian
a
Verm
ont
Tenn
esse
e
Virg
inia
Michiga
n
Conn
ectic
ut
Texa
s
Oreg
on
New
Jers
ey
Mar
yland
New
Mexico
Rhod
e Island
Califor
nia
Neva
da
Alas
ka
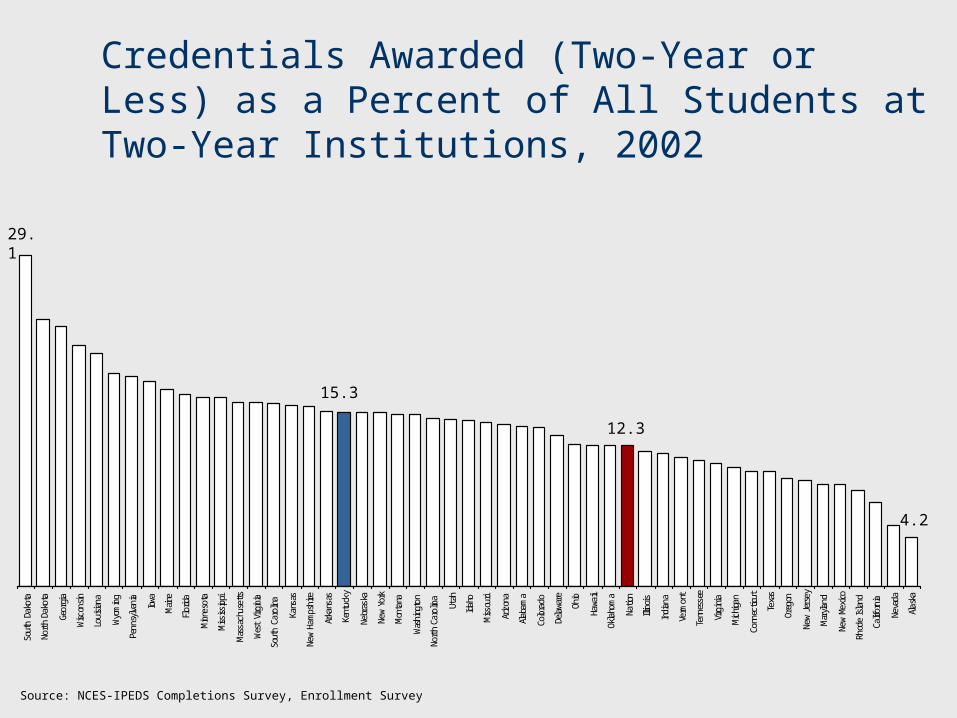
29.1
4.2
12.3
Credentials Awarded (Two-Year or Less) as a Percent of All Students at Two-Year Institutions, 2002
15.3
Source: NCES-IPEDS Completions Survey, Enrollment Survey
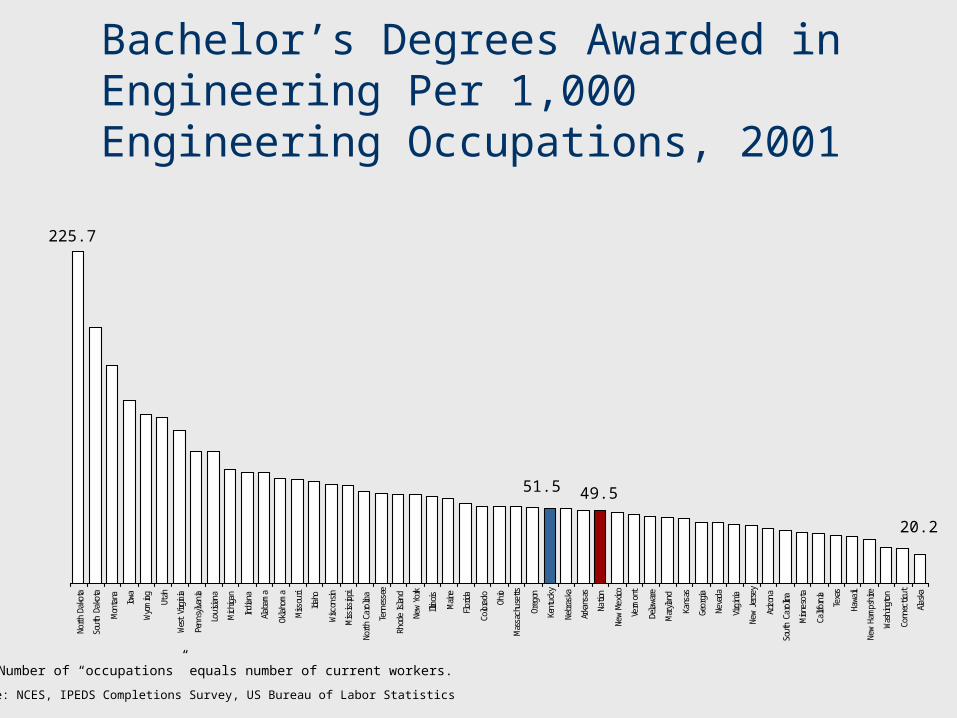
Bachelor’s Degrees Awarded in Engineering Per 1,000 Engineering Occupations, 2001
North
Dako
ta
Sout
h Da
kota
Mon
tana
Iowa
Wyo
ming
Utah
Wes
t Virg
inia
Penn
sylvan
ia
Louisian
a
Michiga
n
Indian
a
Alab
ama
Okla
hom
a
Miss
ouri
Idah
o
Wisc
onsin
Miss
issippi
North
Caro
lina
Tenn
esse
e
Rhod
e Island
New
York
Illinois
Maine
Flor
ida
Colora
do Ohio
Mas
sach
uset
ts
Oreg
on
Kent
ucky
Nebr
aska
Arka
nsas
Natio
n
New
Mexico
Verm
ont
Dela
ware
Mar
yland
Kans
as
Geor
gia
Neva
da
Virg
inia
New
Jers
ey
Arizon
a
Sout
h Ca
rolin
a
Minne
sota
Califor
nia
Texa
s
Hawa
ii
New
Hamps
hire
Was
hing
ton
Conn
ectic
ut
Alas
ka
225.7
20.2
49.551.5
Source: NCES, IPEDS Completions Survey, US Bureau of Labor Statistics
Note: Number of “occupations” equals number of current workers.
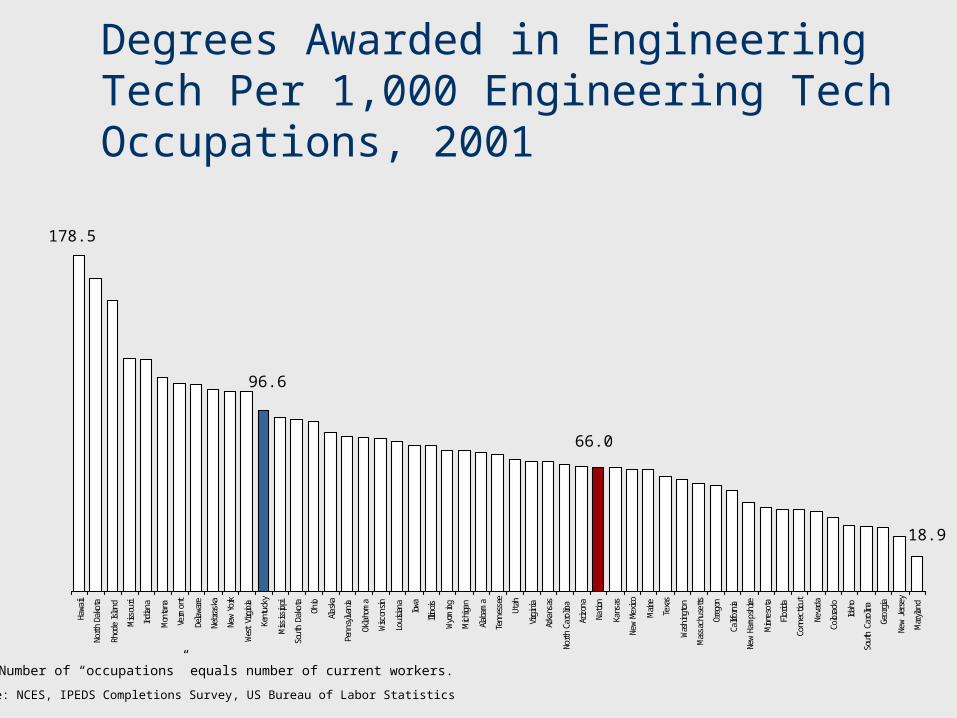
Degrees Awarded in Engineering Tech Per 1,000 Engineering Tech Occupations, 2001
Hawa
ii
North
Dako
ta
Rhod
e Island
Miss
ouri
Indian
a
Mon
tana
Verm
ont
Dela
ware
Nebr
aska
New
York
Wes
t Virg
inia
Kent
ucky
Miss
issippi
Sout
h Da
kota
Ohio
Alas
ka
Penn
sylvan
ia
Okla
hom
a
Wisc
onsin
Louisian
a
Iowa
Illinois
Wyo
ming
Michiga
n
Alab
ama
Tenn
esse
e
Utah
Virg
inia
Arka
nsas
North
Caro
lina
Arizon
a
Natio
n
Kans
as
New
Mexico
Maine
Texa
s
Was
hing
ton
Mas
sach
uset
ts
Oreg
on
Califor
nia
New
Hamps
hire
Minne
sota
Flor
ida
Conn
ectic
ut
Neva
da
Colora
do
Idah
o
Sout
h Ca
rolin
a
Geor
gia
New
Jers
ey
Mar
yland
178.5
18.9
66.0
96.6
Source: NCES, IPEDS Completions Survey, US Bureau of Labor Statistics
Note: Number of “occupations” equals number of current workers.
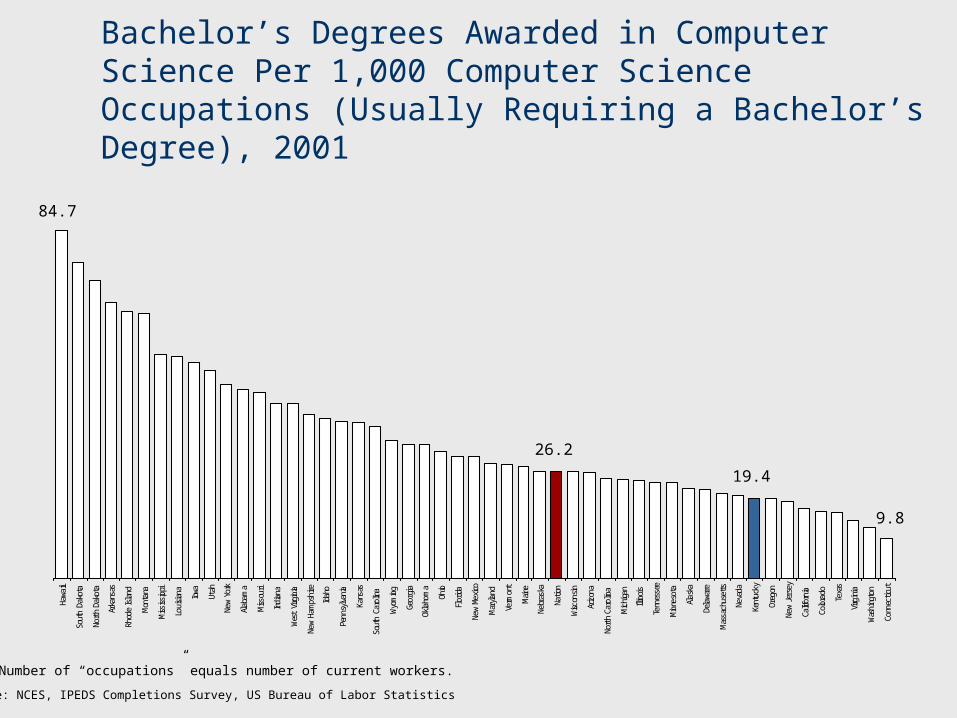
Bachelor’s Degrees Awarded in Computer Science Per 1,000 Computer Science Occupations (Usually Requiring a Bachelor’s Degree), 2001
Hawa
ii
Sout
h Da
kota
North
Dako
ta
Arka
nsas
Rhod
e Island
Mon
tana
Miss
issippi
Louisian
a
Iowa
Utah
New
York
Alab
ama
Miss
ouri
Indian
a
Wes
t Virg
inia
New
Hamps
hire
Idah
o
Penn
sylvan
ia
Kans
as
Sout
h Ca
rolin
a
Wyo
ming
Geor
gia
Okla
hom
a
Ohio
Flor
ida
New
Mexico
Mar
yland
Verm
ont
Maine
Nebr
aska
Natio
n
Wisc
onsin
Arizon
a
North
Caro
lina
Michiga
n
Illinois
Tenn
esse
e
Minne
sota
Alas
ka
Dela
ware
Mas
sach
uset
ts
Neva
da
Kent
ucky
Oreg
on
New
Jers
ey
Califor
nia
Colora
do
Texa
s
Virg
inia
Was
hing
ton
Conn
ectic
ut
84.7
9.8
19.4
26.2
Source: NCES, IPEDS Completions Survey, US Bureau of Labor Statistics
Note: Number of “occupations” equals number of current workers.
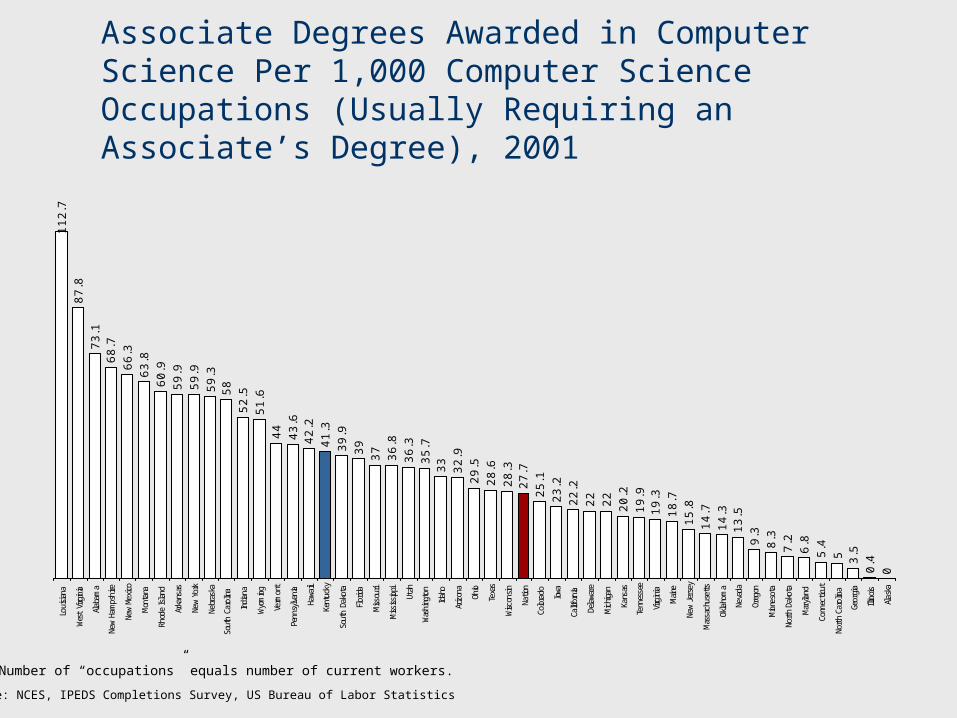
Associate Degrees Awarded in Computer Science Per 1,000 Computer Science Occupations (Usually Requiring an Associate’s Degree), 2001
11
2.7
87
.8
73
.16
8.7
66
.3
63
.8
60
.9
59
.9
59
.9
59
.35
8
52
.5
51
.6
44
43
.64
2.2
41
.3
39
.9
39
37
36
.8
36
.3
35
.73
3
32
.9
29
.5
28
.6
28
.32
7.7
25
.1
23
.2
22
.2
22
22
20
.2
19
.91
9.3
18
.7
15
.8
14
.7
14
.31
3.5
9.3
8.3
7.2
6.8
5.4
5 3.5
0.4
0
Louisian
a
Wes
t Virg
inia
Alab
ama
New
Hamps
hire
New
Mexico
Mon
tana
Rhod
e Island
Arka
nsas
New
York
Nebr
aska
Sout
h Ca
rolin
a
Indian
a
Wyo
ming
Verm
ont
Penn
sylvan
ia
Hawa
ii
Kent
ucky
Sout
h Da
kota
Flor
ida
Miss
ouri
Miss
issippi
Utah
Was
hing
ton
Idah
o
Arizon
a
Ohio
Texa
s
Wisc
onsin
Natio
n
Colora
do Iowa
Califor
nia
Dela
ware
Michiga
n
Kans
as
Tenn
esse
e
Virg
inia
Maine
New
Jers
ey
Mas
sach
uset
ts
Okla
hom
a
Neva
da
Oreg
on
Minne
sota
North
Dako
ta
Mar
yland
Conn
ectic
ut
North
Caro
lina
Geor
gia
Illinois
Alas
ka
Source: NCES, IPEDS Completions Survey, US Bureau of Labor Statistics
Note: Number of “occupations” equals number of current workers.
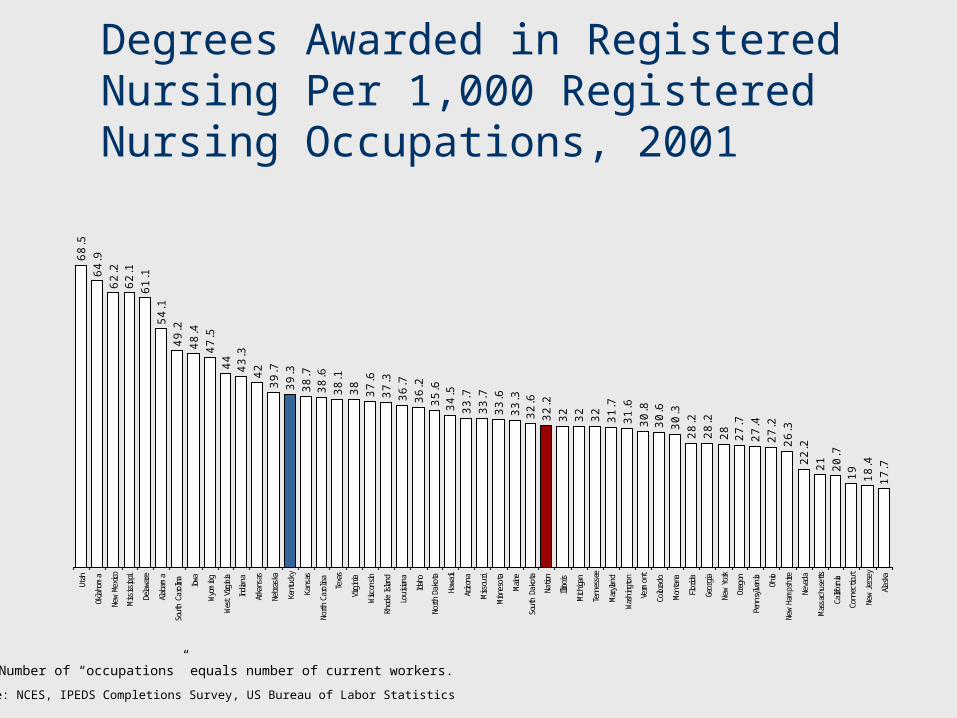
Degrees Awarded in Registered Nursing Per 1,000 Registered Nursing Occupations, 2001
68
.5
64
.9
62
.26
2.1
61
.1
54
.1
49
.2
48
.4
47
.5
44
43
.3
42
39
.7
39
.3
38
.73
8.6
38
.1
38
37
.6
37
.3
36
.7
36
.2
35
.63
4.5
33
.7
33
.7
33
.6
33
.33
2.6
32
.2
32
32
32
31
.7
31
.6
30
.83
0.6
30
.3
28
.2
28
.2
28
27
.7
27
.4
27
.2
26
.3
22
.2
21
20
.71
9
18
.4
17
.7
Utah
Okla
hom
a
New
Mexico
Miss
issippi
Dela
ware
Alab
ama
Sout
h Ca
rolin
a
Iowa
Wyo
ming
Wes
t Virg
inia
Indian
a
Arka
nsas
Nebr
aska
Kent
ucky
Kans
as
North
Caro
lina
Texa
s
Virg
inia
Wisc
onsin
Rhod
e Island
Louisian
a
Idah
o
North
Dako
ta
Hawa
ii
Arizon
a
Miss
ouri
Minne
sota
Maine
Sout
h Da
kota
Natio
n
Illinois
Michiga
n
Tenn
esse
e
Mar
yland
Was
hing
ton
Verm
ont
Colora
do
Mon
tana
Flor
ida
Geor
gia
New
York
Oreg
on
Penn
sylvan
ia
Ohio
New
Hamps
hire
Neva
da
Mas
sach
uset
ts
Califor
nia
Conn
ectic
ut
New
Jers
ey
Alas
ka
Source: NCES, IPEDS Completions Survey, US Bureau of Labor Statistics
Note: Number of “occupations” equals number of current workers.
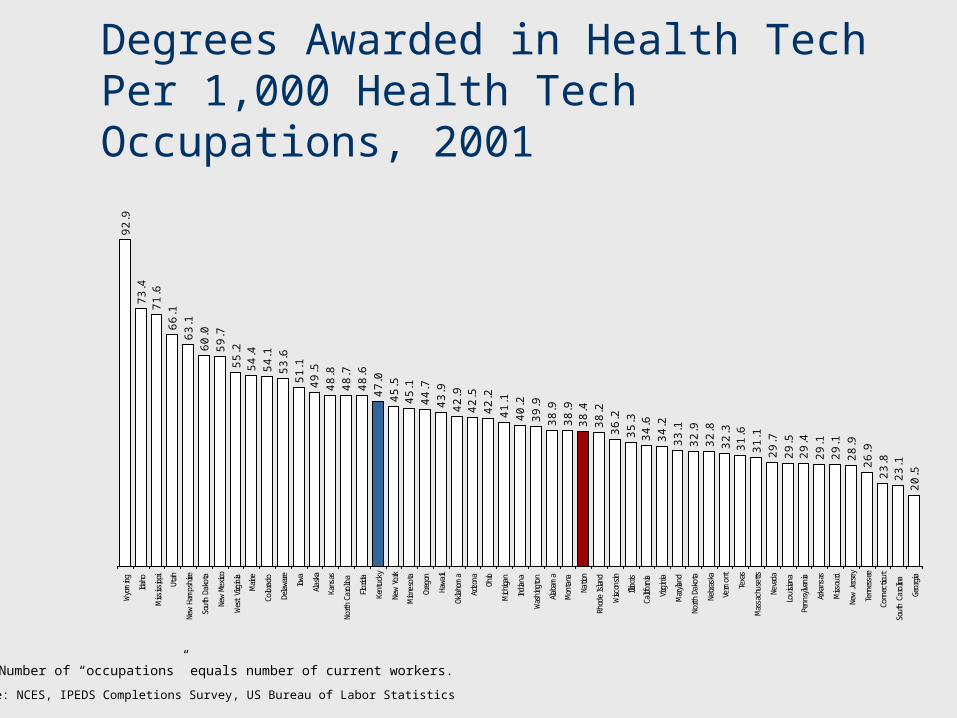
Degrees Awarded in Health Tech Per 1,000 Health Tech Occupations, 2001
92
.97
3.4
71
.66
6.1
63
.16
0.0
59
.75
5.2
54
.45
4.1
53
.65
1.1
49
.54
8.8
48
.74
8.6
47
.04
5.5
45
.14
4.7
43
.94
2.9
42
.54
2.2
41
.14
0.2
39
.93
8.9
38
.93
8.4
38
.23
6.2
35
.33
4.6
34
.23
3.1
32
.93
2.8
32
.33
1.6
31
.12
9.7
29
.52
9.4
29
.12
9.1
28
.92
6.9
23
.82
3.1
20
.5
Wyo
ming
Idah
o
Miss
issippi
Utah
New
Hamps
hire
Sout
h Da
kota
New
Mexico
Wes
t Virg
inia
Maine
Colora
do
Dela
ware
Iowa
Alas
ka
Kans
as
North
Caro
lina
Flor
ida
Kent
ucky
New
York
Minne
sota
Oreg
on
Hawa
ii
Okla
hom
a
Arizon
a
Ohio
Michiga
n
Indian
a
Was
hing
ton
Alab
ama
Mon
tana
Natio
n
Rhod
e Island
Wisc
onsin
Illinois
Califor
nia
Virg
inia
Mar
yland
North
Dako
ta
Nebr
aska
Verm
ont
Texa
s
Mas
sach
uset
ts
Neva
da
Louisian
a
Penn
sylvan
ia
Arka
nsas
Miss
ouri
New
Jers
ey
Tenn
esse
e
Conn
ectic
ut
Sout
h Ca
rolin
a
Geor
gia
Source: NCES, IPEDS Completions Survey, US Bureau of Labor Statistics
Note: Number of “occupations” equals number of current workers.
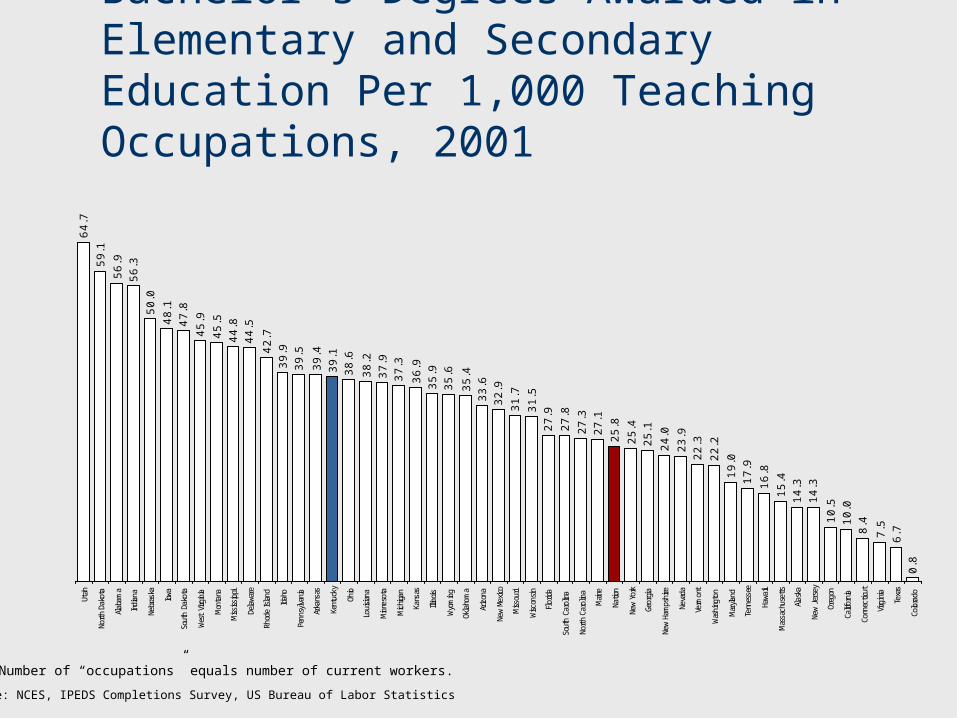
Bachelor’s Degrees Awarded in Elementary and Secondary Education Per 1,000 Teaching Occupations, 2001
64
.7
59
.1
56
.9
56
.3
50
.0
48
.1
47
.8
45
.9
45
.5
44
.8
44
.5
42
.7
39
.9
39
.5
39
.4
39
.1
38
.6
38
.2
37
.9
37
.3
36
.9
35
.9
35
.6
35
.4
33
.6
32
.9
31
.7
31
.5
27
.9
27
.8
27
.3
27
.1
25
.8
25
.4
25
.1
24
.0
23
.9
22
.3
22
.2
19
.0
17
.9
16
.8
15
.4
14
.3
14
.3
10
.5
10
.0
8.4
7.5
6.7
0.8
Utah
North
Dako
ta
Alab
ama
Indian
a
Nebr
aska
Iowa
Sout
h Da
kota
Wes
t Virg
inia
Mon
tana
Miss
issippi
Dela
ware
Rhod
e Island
Idah
o
Penn
sylvan
ia
Arka
nsas
Kent
ucky
Ohio
Louisian
a
Minne
sota
Michiga
n
Kans
as
Illinois
Wyo
ming
Okla
hom
a
Arizon
a
New
Mexico
Miss
ouri
Wisc
onsin
Flor
ida
Sout
h Ca
rolin
a
North
Caro
lina
Maine
Natio
n
New
York
Geor
gia
New
Hamps
hire
Neva
da
Verm
ont
Was
hing
ton
Mar
yland
Tenn
esse
e
Hawa
ii
Mas
sach
uset
ts
Alas
ka
New
Jers
ey
Oreg
on
Califor
nia
Conn
ectic
ut
Virg
inia
Texa
s
Colora
do
Source: NCES, IPEDS Completions Survey, US Bureau of Labor Statistics
Note: Number of “occupations” equals number of current workers.

Net Gain/Loss of Kentucky Residents
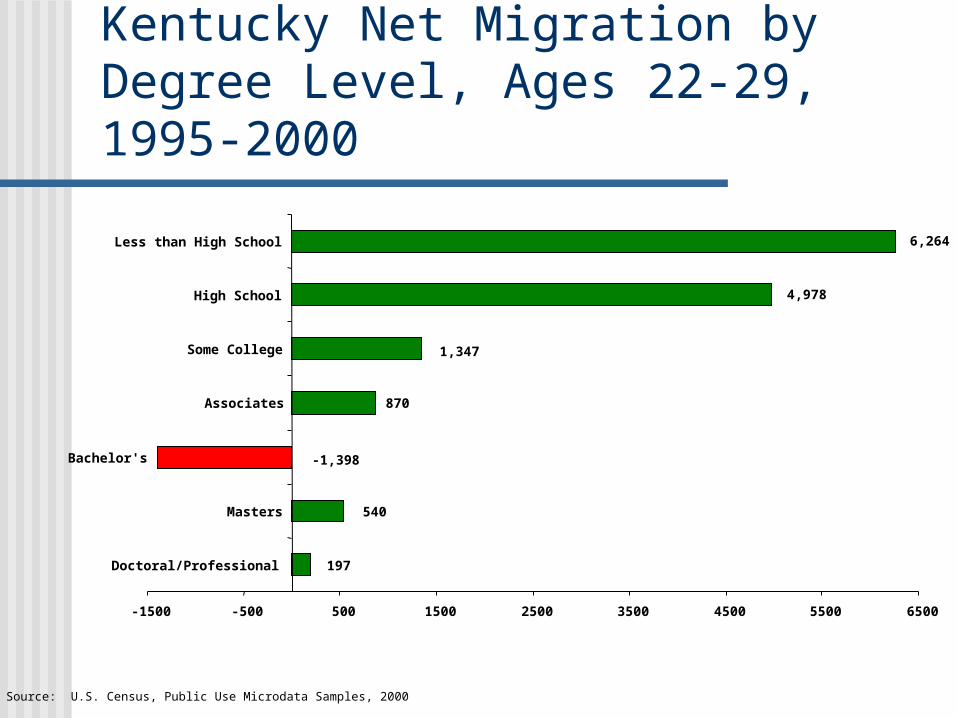
Kentucky Net Migration by Degree Level, Ages 22-29, 1995-2000
870
4,978
1,347
6,264
-1,398
540
197
-1500 -500 500 1500 2500 3500 4500 5500 6500
Doctoral/Professional
Masters
Bachelor's
Associates
Some College
High School
Less than High School
Source: U.S. Census, Public Use Microdata Samples, 2000
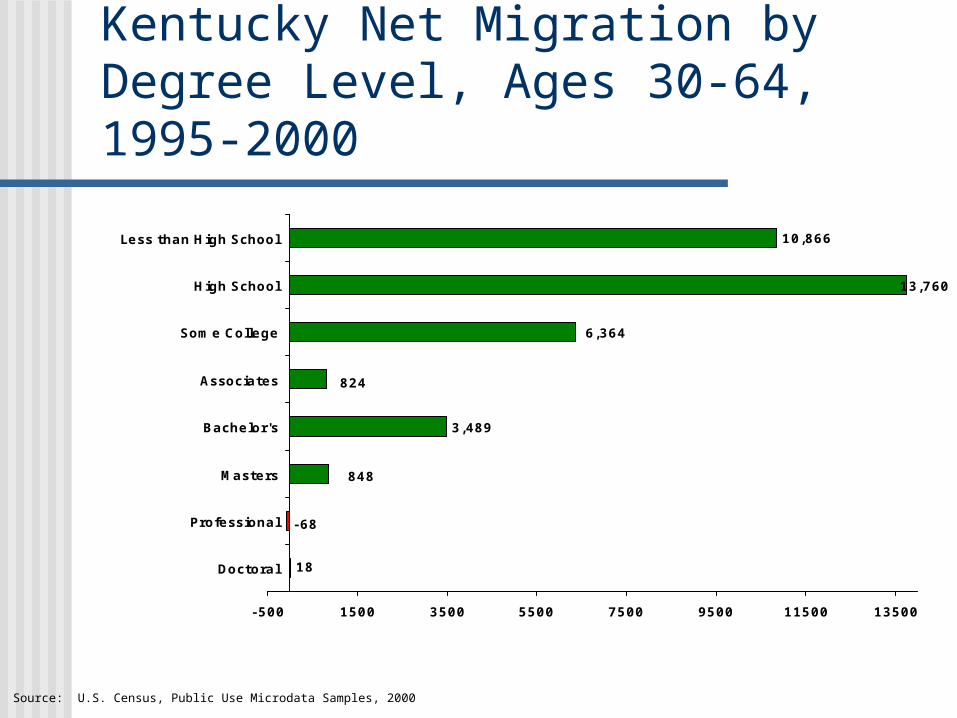
Kentucky Net Migration by Degree Level, Ages 30-64, 1995-2000
3,489
10,866
6,364
824
13,760
848
-68
18
-500 1500 3500 5500 7500 9500 11500 13500
Doctoral
Professional
Masters
Bachelor's
Associates
Some College
High School
Less than High School
Source: U.S. Census, Public Use Microdata Samples, 2000
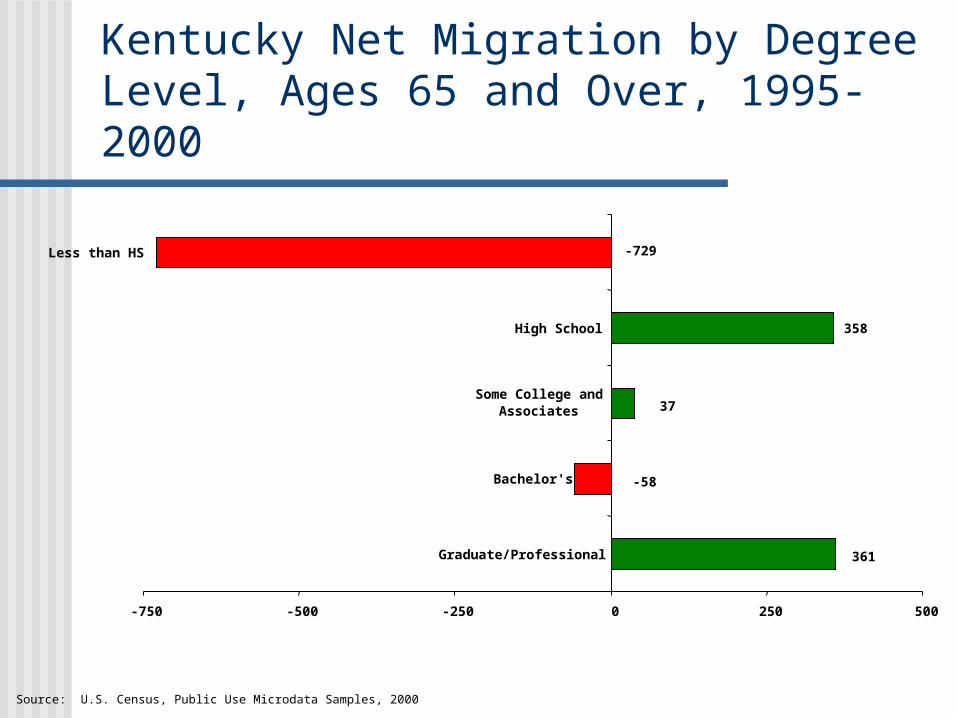
Kentucky Net Migration by Degree Level, Ages 65 and Over, 1995-2000
358
-729
37
-58
361
-750 -500 -250 0 250 500
Graduate/Professional
Bachelor's
Some College andAssociates
High School
Less than HS
Source: U.S. Census, Public Use Microdata Samples, 2000
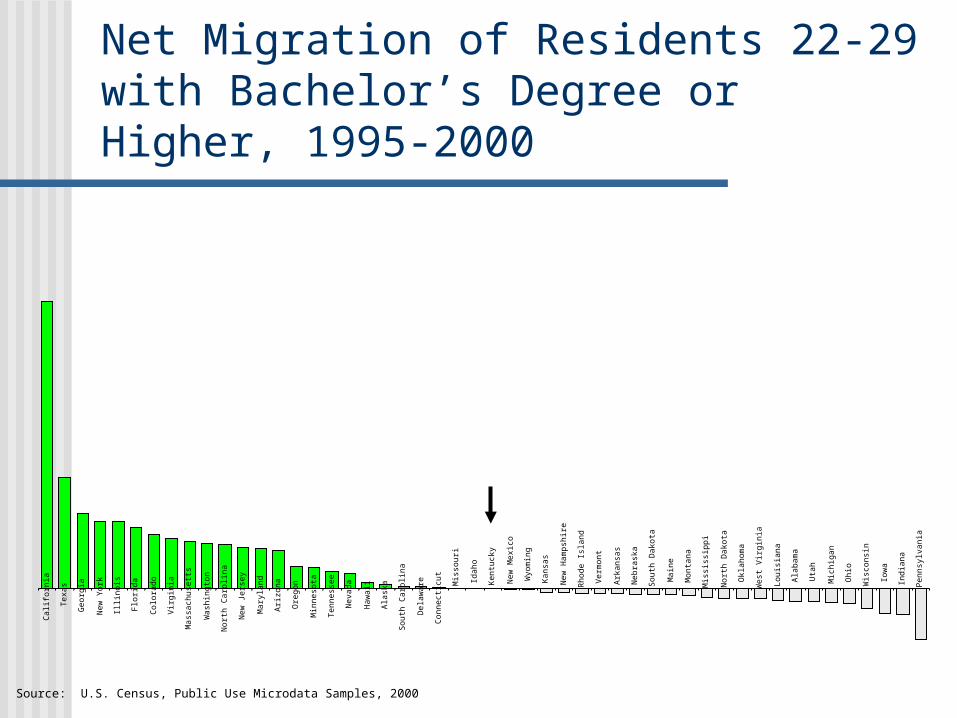
Net Migration of Residents 22-29 with Bachelor’s Degree or Higher, 1995-2000
Calif
orn
ia
Texas
Georg
ia
New
York
Illin
ois
Flori
da
Colo
rad
o
Vir
gin
ia
Mass
ach
use
tts
Wash
ing
ton
Nort
h C
aro
lina
New
Jers
ey
Mary
lan
d
Ari
zon
a
Ore
gon
Min
neso
ta
Ten
ness
ee
Nevad
a
Haw
aii
Ala
ska
Sou
th C
aro
lina
Dela
ware
Con
nect
icu
t
Mis
sou
ri
Idah
o
Ken
tuck
y
New
Mexic
o
Wyom
ing
Kan
sas
New
Ham
psh
ire
Rh
od
e Isl
an
d
Verm
on
t
Ark
an
sas
Neb
rask
a
Sou
th D
ako
ta
Main
e
Mon
tan
a
Mis
siss
ipp
i
Nort
h D
ako
ta
Okl
ah
om
a
West
Vir
gin
ia
Lou
isia
na
Ala
bam
a
Uta
h
Mic
hig
an
Oh
io
Wis
con
sin
Iow
a
Ind
ian
a
Pen
nsy
lvan
ia
Source: U.S. Census, Public Use Microdata Samples, 2000
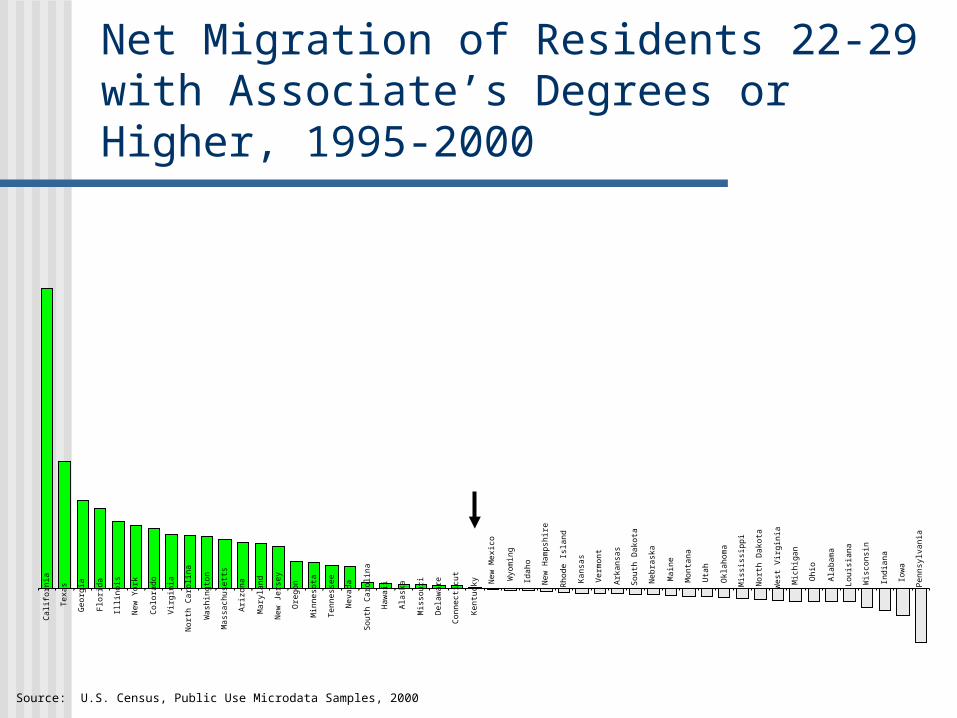
Net Migration of Residents 22-29 with Associate’s Degrees or Higher, 1995-2000
Calif
orn
ia
Texas
Georg
ia
Flori
da
Illin
ois
New
York
Colo
rad
o
Vir
gin
ia
Nort
h C
aro
lina
Wash
ing
ton
Mass
ach
use
tts
Ari
zon
a
Mary
lan
d
New
Jers
ey
Ore
gon
Min
neso
ta
Ten
ness
ee
Nevad
a
Sou
th C
aro
lina
Haw
aii
Ala
ska
Mis
sou
ri
Dela
ware
Con
nect
icu
t
Ken
tuck
y New
Mexic
o
Wyom
ing
Idah
o
New
Ham
psh
ire
Rh
od
e Isl
an
d
Kan
sas
Verm
on
t
Ark
an
sas
Sou
th D
ako
ta
Neb
rask
a
Main
e
Mon
tan
a
Uta
h
Okl
ah
om
a
Mis
siss
ipp
i
Nort
h D
ako
ta
West
Vir
gin
ia
Mic
hig
an
Oh
io
Ala
bam
a
Lou
isia
na
Wis
con
sin
Ind
ian
a
Iow
a
Pen
nsy
lvan
ia
Source: U.S. Census, Public Use Microdata Samples, 2000
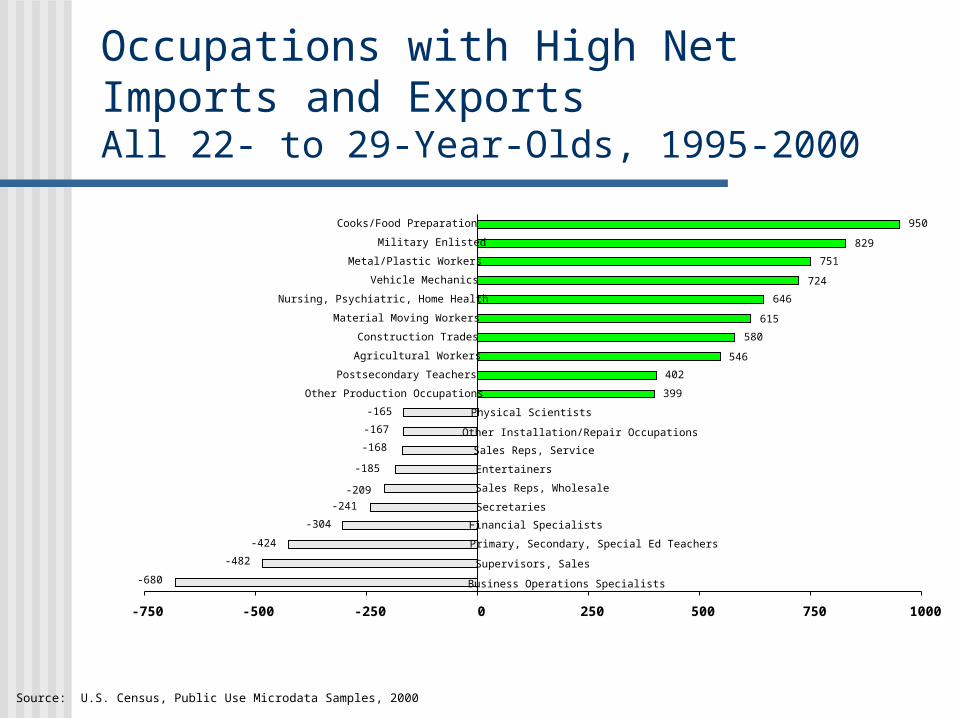
Occupations with High Net Imports and ExportsAll 22- to 29-Year-Olds, 1995-2000
399
402
546
580
615
646
724
751
829
950
-680
-482
-424
-185
-241
-209
-165
-167
-168
-304
-750 -500 -250 0 250 500 750 1000
Business Operations Specialists
Supervisors, Sales
Primary, Secondary, Special Ed Teachers
Financial Specialists
Secretaries
Sales Reps, Wholesale
Entertainers
Sales Reps, Service
Other Installation/Repair Occupations
Physical Scientists
Other Production Occupations
Postsecondary Teachers
Agricultural Workers
Construction Trades
Material Moving Workers
Nursing, Psychiatric, Home Health
Vehicle Mechanics
Metal/Plastic Workers
Military Enlisted
Cooks/Food Preparation
Source: U.S. Census, Public Use Microdata Samples, 2000
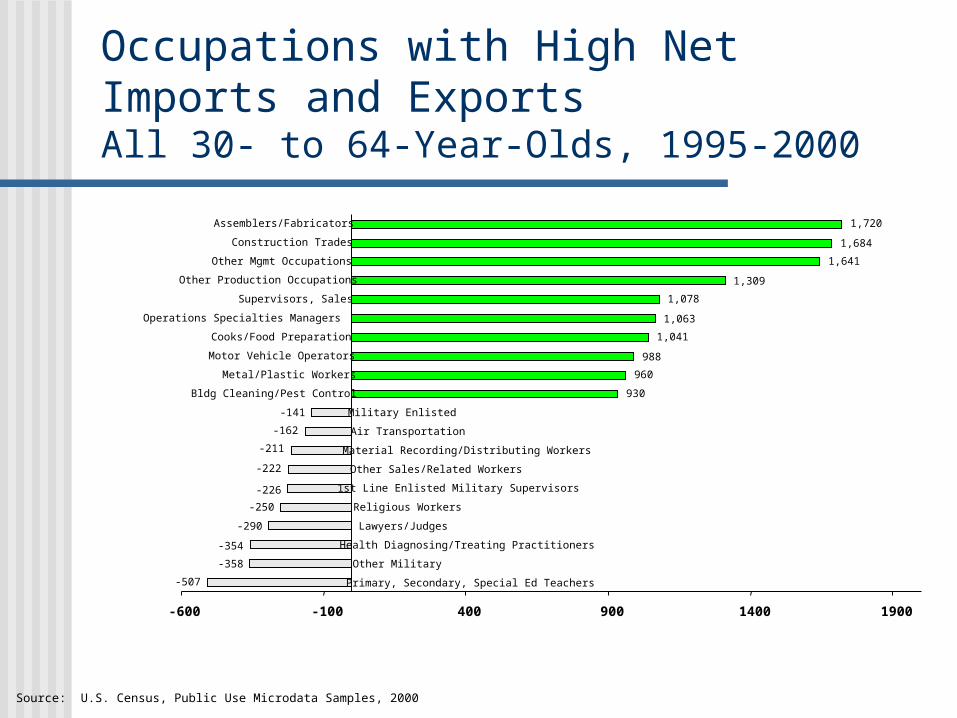
Occupations with High Net Imports and ExportsAll 30- to 64-Year-Olds, 1995-2000
930
960
988
1,041
1,063
1,078
1,309
1,641
1,684
1,720
-290
-211
-162
-141
-226
-250
-222
-354
-358
-507
-600 -100 400 900 1400 1900
Primary, Secondary, Special Ed Teachers
Other Military
Health Diagnosing/Treating Practitioners
Lawyers/Judges
Religious Workers
1st Line Enlisted Military Supervisors
Other Sales/Related Workers
Material Recording/Distributing Workers
Air Transportation
Military Enlisted
Bldg Cleaning/Pest Control
Metal/Plastic Workers
Motor Vehicle Operators
Cooks/Food Preparation
Operations Specialties Managers
Supervisors, Sales
Other Production Occupations
Other Mgmt Occupations
Construction Trades
Assemblers/Fabricators
Source: U.S. Census, Public Use Microdata Samples, 2000
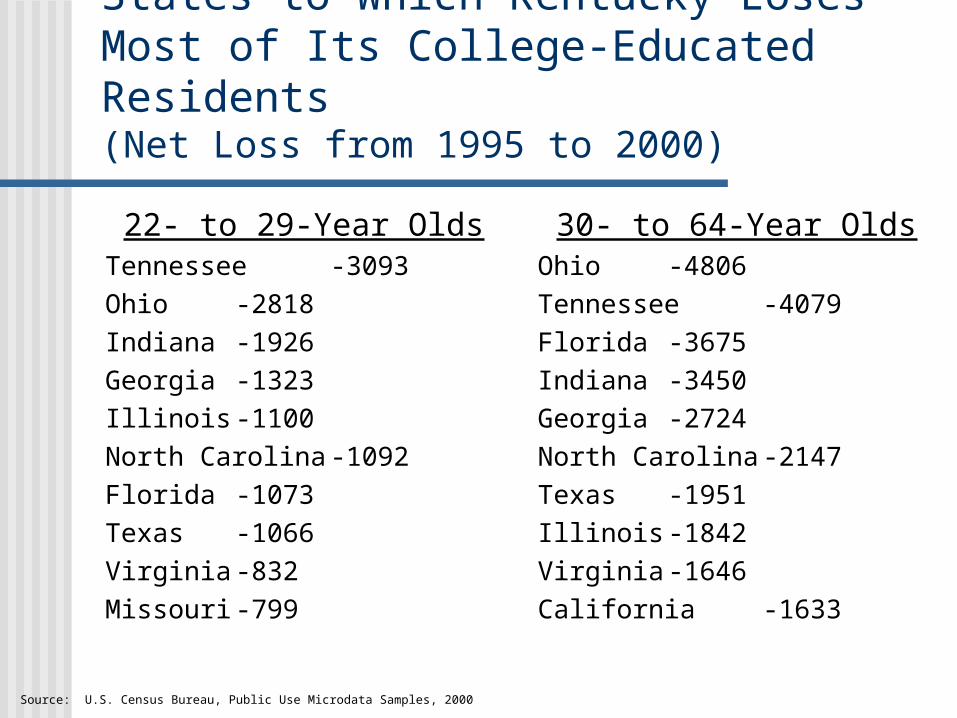
States to Which Kentucky Loses Most of Its College-Educated Residents(Net Loss from 1995 to 2000)
22- to 29-Year OldsTennessee -3093Ohio -2818Indiana -1926Georgia -1323Illinois -1100North Carolina -1092Florida -1073Texas -1066Virginia -832Missouri -799
30- to 64-Year OldsOhio -4806Tennessee -4079Florida -3675Indiana -3450Georgia -2724North Carolina -2147Texas -1951Illinois -1842Virginia -1646California -1633
Source: U.S. Census Bureau, Public Use Microdata Samples, 2000

The Economy
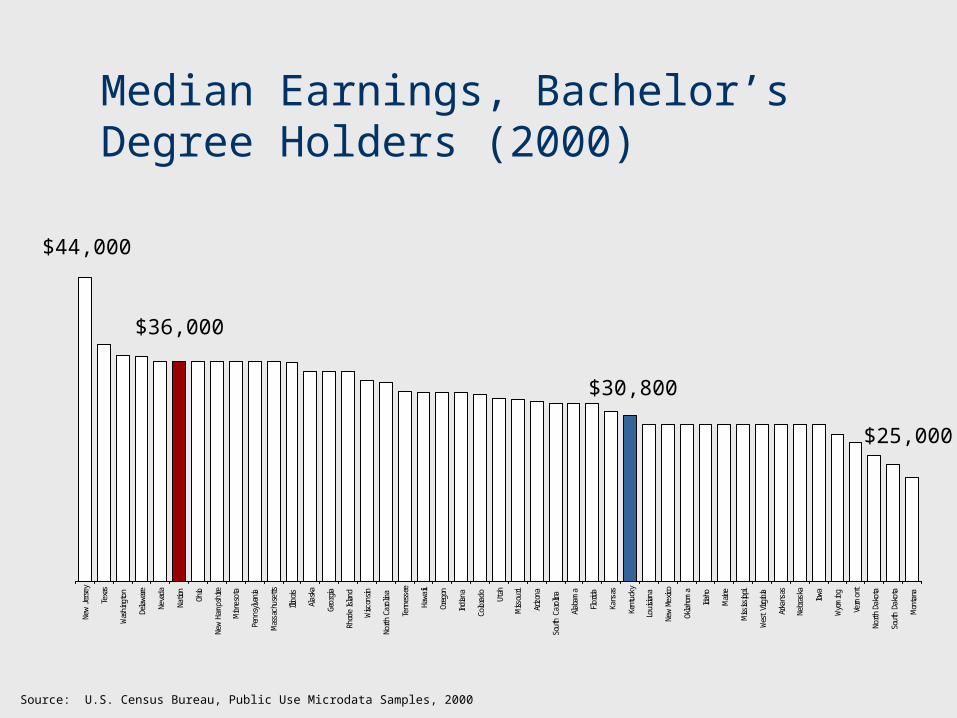
Median Earnings, Bachelor’s Degree Holders (2000)
New
Jers
ey
Texa
s
Was
hing
ton
Dela
ware
Neva
da
Natio
n
Ohio
New
Hamps
hire
Minne
sota
Penn
sylvan
ia
Mas
sach
uset
ts
Illinois
Alas
ka
Geor
gia
Rhod
e Island
Wisc
onsin
North
Caro
lina
Tenn
esse
e
Hawa
ii
Oreg
on
Indian
a
Colora
do Utah
Miss
ouri
Arizon
a
Sout
h Ca
rolin
a
Alab
ama
Flor
ida
Kans
as
Kent
ucky
Louisian
a
New
Mexico
Okla
hom
a
Idah
o
Maine
Miss
issippi
Wes
t Virg
inia
Arka
nsas
Nebr
aska
Iowa
Wyo
ming
Verm
ont
North
Dako
ta
Sout
h Da
kota
Mon
tana
$44,000
$36,000
$30,800
$25,000
Source: U.S. Census Bureau, Public Use Microdata Samples, 2000
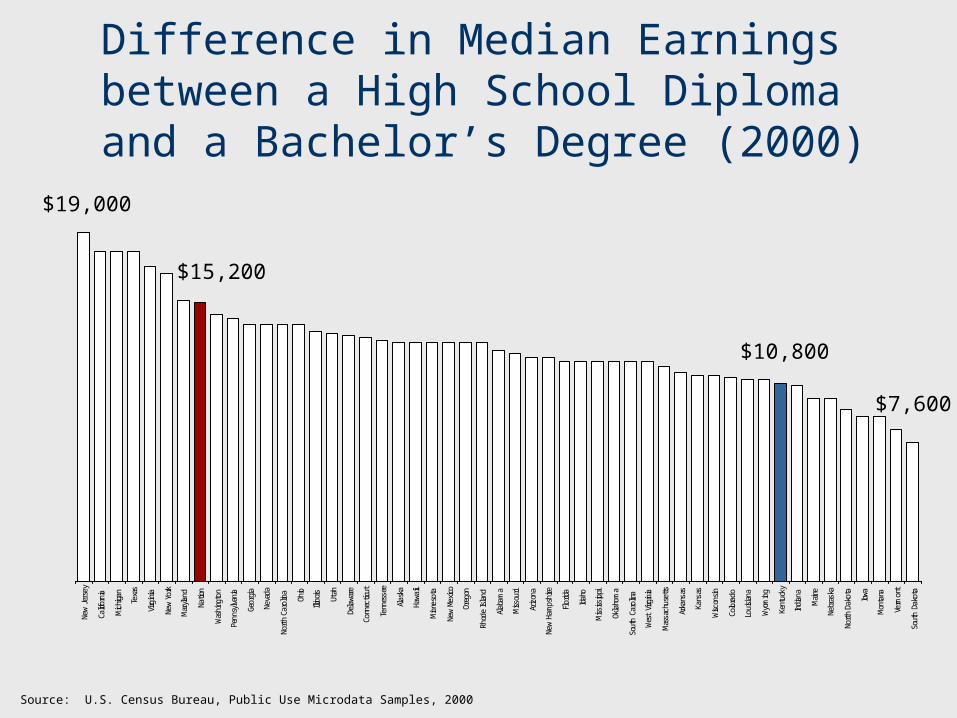
Difference in Median Earnings between a High School Diploma and a Bachelor’s Degree (2000)
New
Jers
ey
Califor
nia
Michiga
n
Texa
s
Virg
inia
New
York
Mar
yland
Natio
n
Was
hing
ton
Penn
sylvan
ia
Geor
gia
Neva
da
North
Caro
lina
Ohio
Illinois
Utah
Dela
ware
Conn
ectic
ut
Tenn
esse
e
Alas
ka
Hawa
ii
Minne
sota
New
Mexico
Oreg
on
Rhod
e Island
Alab
ama
Miss
ouri
Arizon
a
New
Hamps
hire
Flor
ida
Idah
o
Miss
issippi
Okla
hom
a
Sout
h Ca
rolin
a
Wes
t Virg
inia
Mas
sach
uset
ts
Arka
nsas
Kans
as
Wisc
onsin
Colora
do
Louisian
a
Wyo
ming
Kent
ucky
Indian
a
Maine
Nebr
aska
North
Dako
ta
Iowa
Mon
tana
Verm
ont
Sout
h Da
kota
$19,000
$15,200
$10,800
$7,600
Source: U.S. Census Bureau, Public Use Microdata Samples, 2000
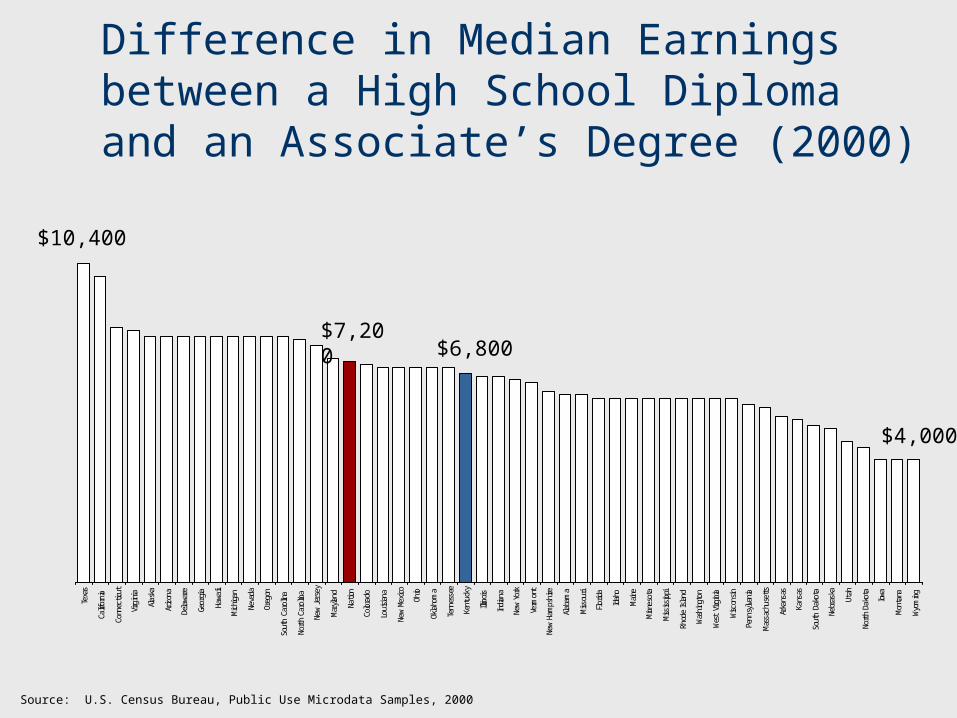
Difference in Median Earnings between a High School Diploma and an Associate’s Degree (2000)
Texa
s
Califor
nia
Conn
ectic
ut
Virg
inia
Alas
ka
Arizon
a
Dela
ware
Geor
gia
Hawa
ii
Michiga
n
Neva
da
Oreg
on
Sout
h Ca
rolin
a
North
Caro
lina
New
Jers
ey
Mar
yland
Natio
n
Colora
do
Louisian
a
New
Mexico
Ohio
Okla
hom
a
Tenn
esse
e
Kent
ucky
Illinois
Indian
a
New
York
Verm
ont
New
Hamps
hire
Alab
ama
Miss
ouri
Flor
ida
Idah
o
Maine
Minne
sota
Miss
issippi
Rhod
e Island
Was
hing
ton
Wes
t Virg
inia
Wisc
onsin
Penn
sylvan
ia
Mas
sach
uset
ts
Arka
nsas
Kans
as
Sout
h Da
kota
Nebr
aska
Utah
North
Dako
ta
Iowa
Mon
tana
Wyo
ming
$10,400
$7,200$6,800
$4,000
Source: U.S. Census Bureau, Public Use Microdata Samples, 2000

Progressive Policy Institute:State New Economy Index, 2002
90
86.2
85.5
84.3
75.6
75.1
74.2
72.1
70.5
69.3
68.9
68.7
68.7
67.6
67.6
67.2
64.7
62.7
62.3
61.6
61.5
60.3
60.1
60
58.9
58.3
57.5
57.2
56.9
56.7
56.5
56.3
55.7
54.4
54.1
53.7
52.8
52.8
52.2
52.2
52
51.1
48.6
47.4
46.1
45.9
45.7
45.3
41.7
40.9
40.7
Mas
sach
uset
ts
Was
hing
ton
Califor
nia
Colora
do
Mar
yland
New
Jers
ey
Conn
ectic
ut
Virg
inia
Dela
ware
New
York
Oreg
on
Minne
sota
Utah
New
Hamps
hire
Texa
s
Arizon
a
Illinois
Flor
ida
Penn
sylvan
ia
Idah
o
Rhod
e Island
Natio
n
Geor
gia
Michiga
n
Miss
ouri
Maine
North
Caro
lina
New
Mexico
Verm
ont
Kans
as
Ohio
Alas
ka
Neva
da
Nebr
aska
Okla
hom
a
Hawa
ii
Indian
a
Mon
tana
Iowa
Tenn
esse
e
Wisc
onsin
Sout
h Ca
rolin
a
Kent
ucky
Sout
h Da
kota
North
Dako
ta
Louisian
a
Wyo
ming
Alab
ama
Arka
nsas
Miss
issippi
Wes
t Virg
inia
Source: Progressive Policy Institute
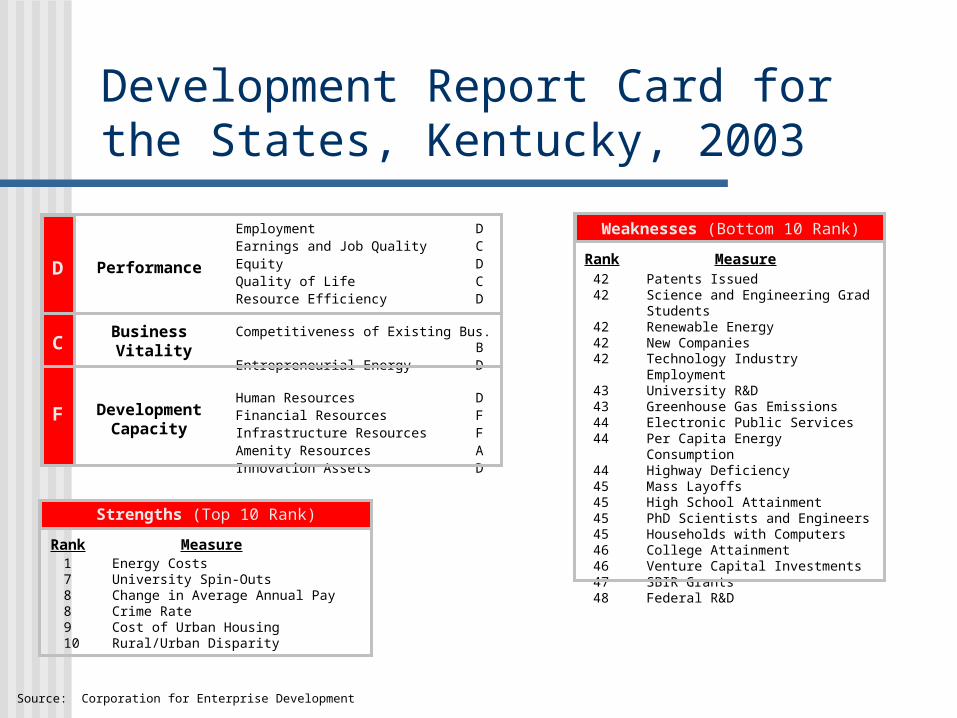
Development Report Card for the States, Kentucky, 2003
Strengths (Top 10 Rank)
Rank Measure1 Energy Costs7 University Spin-Outs8 Change in Average Annual Pay8 Crime Rate9 Cost of Urban Housing10 Rural/Urban Disparity
42 Patents Issued42 Science and Engineering Grad
Students42 Renewable Energy42 New Companies42 Technology Industry Employment43 University R&D43 Greenhouse Gas Emissions44 Electronic Public Services44 Per Capita Energy Consumption44 Highway Deficiency45 Mass Layoffs45 High School Attainment45 PhD Scientists and Engineers45 Households with Computers46 College Attainment46 Venture Capital Investments47 SBIR Grants48 Federal R&D
Weaknesses (Bottom 10 Rank)
Rank Measure
Source: Corporation for Enterprise Development
Employment DEarnings and Job Quality CEquity DQuality of Life CResource Efficiency D
Competitiveness of Existing Bus. BEntrepreneurial Energy D
Human Resources DFinancial Resources FInfrastructure Resources FAmenity Resources AInnovation Assets D
Performance
Business Vitality
DevelopmentCapacity
D
C
F
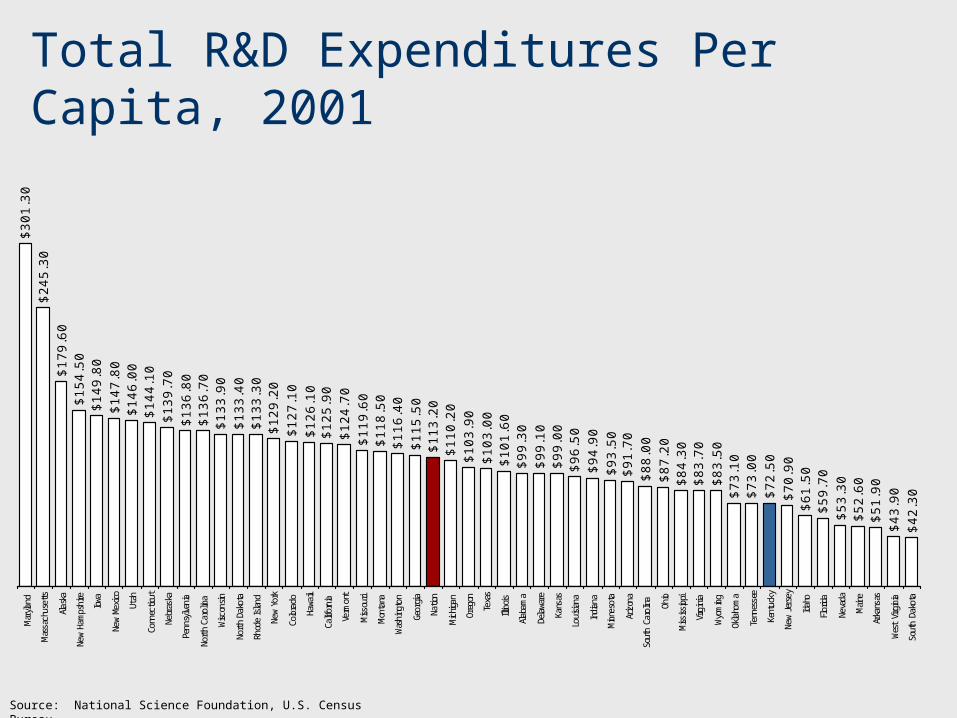
Total R&D Expenditures Per Capita, 2001
$3
01
.30
$2
45
.30
$1
79
.60
$1
54
.50
$1
49
.80
$1
47
.80
$1
46
.00
$1
44
.10
$1
39
.70
$1
36
.80
$1
36
.70
$1
33
.90
$1
33
.40
$1
33
.30
$1
29
.20
$1
27
.10
$1
26
.10
$1
25
.90
$1
24
.70
$1
19
.60
$1
18
.50
$1
16
.40
$1
15
.50
$1
13
.20
$1
10
.20
$1
03
.90
$1
03
.00
$1
01
.60
$9
9.3
0$
99.1
0$
99.0
0$
96.5
0$
94.9
0$
93.5
0$
91.7
0$
88.0
0$
87.2
0$
84.3
0$
83.7
0$
83.5
0$
73.1
0$
73.0
0$
72.5
0$
70.9
0$
61.5
0$
59.7
0$
53.3
0$
52.6
0$
51.9
0$
43.9
0$
42.3
0
Mar
yland
Mas
sach
uset
ts
Alas
ka
New
Hamps
hire
Iowa
New
Mexico
Utah
Conn
ectic
ut
Nebr
aska
Penn
sylvan
ia
North
Caro
lina
Wisc
onsin
North
Dako
ta
Rhod
e Island
New
York
Colora
do
Hawa
ii
Califor
nia
Verm
ont
Miss
ouri
Mon
tana
Was
hing
ton
Geor
gia
Natio
n
Michiga
n
Oreg
on
Texa
s
Illinois
Alab
ama
Dela
ware
Kans
as
Louisian
a
Indian
a
Minne
sota
Arizon
a
Sout
h Ca
rolin
a
Ohio
Miss
issippi
Virg
inia
Wyo
ming
Okla
hom
a
Tenn
esse
e
Kent
ucky
New
Jers
ey
Idah
o
Flor
ida
Neva
da
Maine
Arka
nsas
Wes
t Virg
inia
Sout
h Da
kota
Source: Current Population SurveySource: National Science Foundation, U.S. Census Bureau
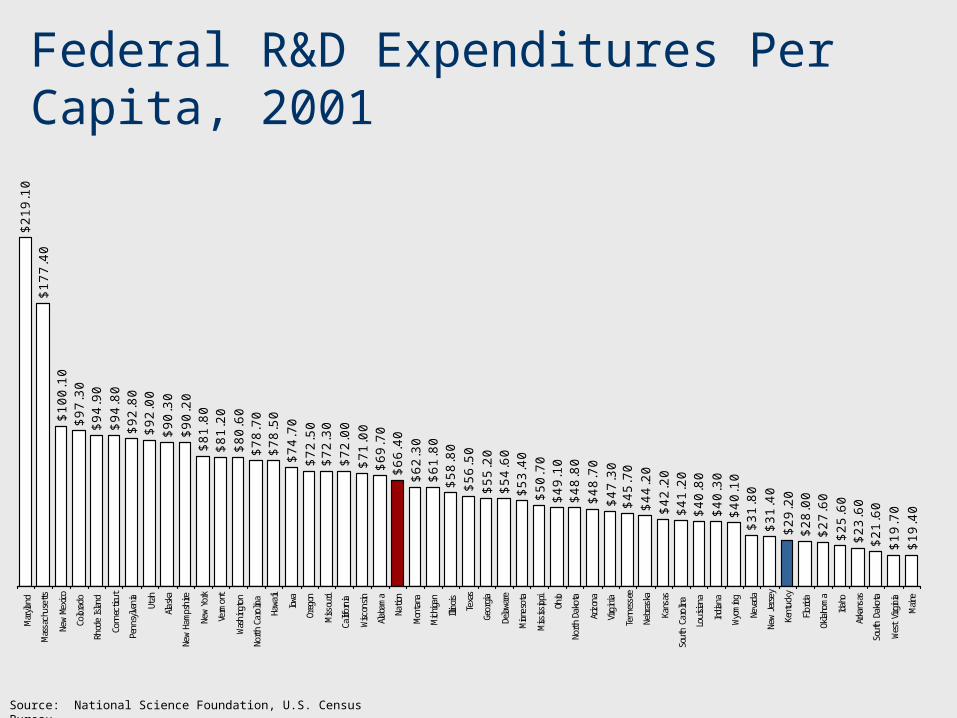
Federal R&D Expenditures Per Capita, 2001
$2
19
.10
$1
77
.40
$1
00
.10
$9
7.3
0$
94.9
0$
94.8
0$
92.8
0$
92.0
0$
90.3
0$
90.2
0$
81.8
0$
81.2
0$
80.6
0$
78.7
0$
78.5
0$
74.7
0$
72.5
0$
72.3
0$
72.0
0$
71.0
0$
69.7
0$
66.4
0$
62.3
0$
61.8
0$
58.8
0$
56.5
0$
55.2
0$
54.6
0$
53.4
0$
50.7
0$
49.1
0$
48.8
0$
48.7
0$
47.3
0$
45.7
0$
44.2
0$
42.2
0$
41.2
0$
40.8
0$
40.3
0$
40.1
0$
31.8
0$
31.4
0$
29.2
0$
28.0
0$
27.6
0$
25.6
0$
23.6
0$
21.6
0$
19.7
0$
19.4
0
Mar
yland
Mas
sach
uset
ts
New
Mexico
Colora
do
Rhod
e Island
Conn
ectic
ut
Penn
sylvan
ia
Utah
Alas
ka
New
Hamps
hire
New
York
Verm
ont
Was
hing
ton
North
Caro
lina
Hawa
ii
Iowa
Oreg
on
Miss
ouri
Califor
nia
Wisc
onsin
Alab
ama
Natio
n
Mon
tana
Michiga
n
Illinois
Texa
s
Geor
gia
Dela
ware
Minne
sota
Miss
issippi
Ohio
North
Dako
ta
Arizon
a
Virg
inia
Tenn
esse
e
Nebr
aska
Kans
as
Sout
h Ca
rolin
a
Louisian
a
Indian
a
Wyo
ming
Neva
da
New
Jers
ey
Kent
ucky
Flor
ida
Okla
hom
a
Idah
o
Arka
nsas
Sout
h Da
kota
Wes
t Virg
inia
Maine
Source: Current Population SurveySource: National Science Foundation, U.S. Census Bureau
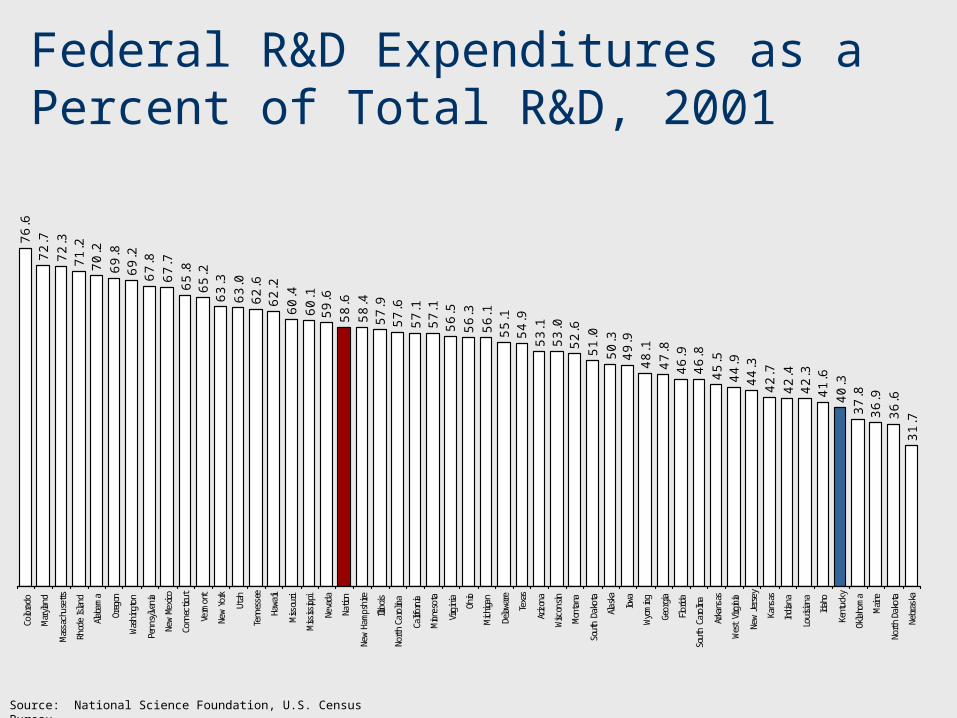
Federal R&D Expenditures as a Percent of Total R&D, 2001
76
.67
2.7
72
.37
1.2
70
.26
9.8
69
.26
7.8
67
.76
5.8
65
.26
3.3
63
.06
2.6
62
.26
0.4
60
.15
9.6
58
.65
8.4
57
.95
7.6
57
.15
7.1
56
.55
6.3
56
.15
5.1
54
.95
3.1
53
.05
2.6
51
.05
0.3
49
.94
8.1
47
.84
6.9
46
.84
5.5
44
.94
4.3
42
.74
2.4
42
.34
1.6
40
.33
7.8
36
.93
6.6
31
.7
Colora
do
Mar
yland
Mas
sach
uset
ts
Rhod
e Island
Alab
ama
Oreg
on
Was
hing
ton
Penn
sylvan
ia
New
Mexico
Conn
ectic
ut
Verm
ont
New
York
Utah
Tenn
esse
e
Hawa
ii
Miss
ouri
Miss
issippi
Neva
da
Natio
n
New
Hamps
hire
Illinois
North
Caro
lina
Califor
nia
Minne
sota
Virg
inia
Ohio
Michiga
n
Dela
ware
Texa
s
Arizon
a
Wisc
onsin
Mon
tana
Sout
h Da
kota
Alas
ka
Iowa
Wyo
ming
Geor
gia
Flor
ida
Sout
h Ca
rolin
a
Arka
nsas
Wes
t Virg
inia
New
Jers
ey
Kans
as
Indian
a
Louisian
a
Idah
o
Kent
ucky
Okla
hom
a
Maine
North
Dako
ta
Nebr
aska
Source: Current Population SurveySource: National Science Foundation, U.S. Census Bureau
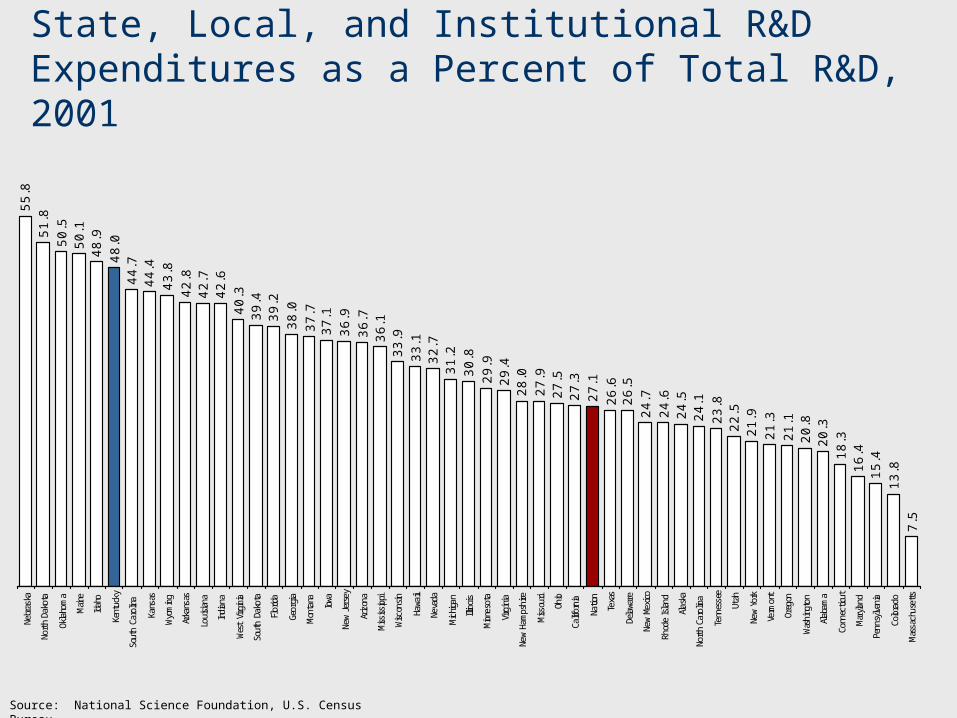
State, Local, and Institutional R&D Expenditures as a Percent of Total R&D, 2001
55
.85
1.8
50
.55
0.1
48
.94
8.0
44
.74
4.4
43
.84
2.8
42
.74
2.6
40
.33
9.4
39
.23
8.0
37
.73
7.1
36
.93
6.7
36
.13
3.9
33
.13
2.7
31
.23
0.8
29
.92
9.4
28
.02
7.9
27
.52
7.3
27
.12
6.6
26
.52
4.7
24
.62
4.5
24
.12
3.8
22
.52
1.9
21
.32
1.1
20
.82
0.3
18
.31
6.4
15
.41
3.8
7.5
Nebr
aska
North
Dako
ta
Okla
hom
a
Maine
Idah
o
Kent
ucky
Sout
h Ca
rolin
a
Kans
as
Wyo
ming
Arka
nsas
Louisian
a
Indian
a
Wes
t Virg
inia
Sout
h Da
kota
Flor
ida
Geor
gia
Mon
tana
Iowa
New
Jers
ey
Arizon
a
Miss
issippi
Wisc
onsin
Hawa
ii
Neva
da
Michiga
n
Illinois
Minne
sota
Virg
inia
New
Hamps
hire
Miss
ouri
Ohio
Califor
nia
Natio
n
Texa
s
Dela
ware
New
Mexico
Rhod
e Island
Alas
ka
North
Caro
lina
Tenn
esse
e
Utah
New
York
Verm
ont
Oreg
on
Was
hing
ton
Alab
ama
Conn
ectic
ut
Mar
yland
Penn
sylvan
ia
Colora
do
Mas
sach
uset
ts
Source: Current Population SurveySource: National Science Foundation, U.S. Census Bureau
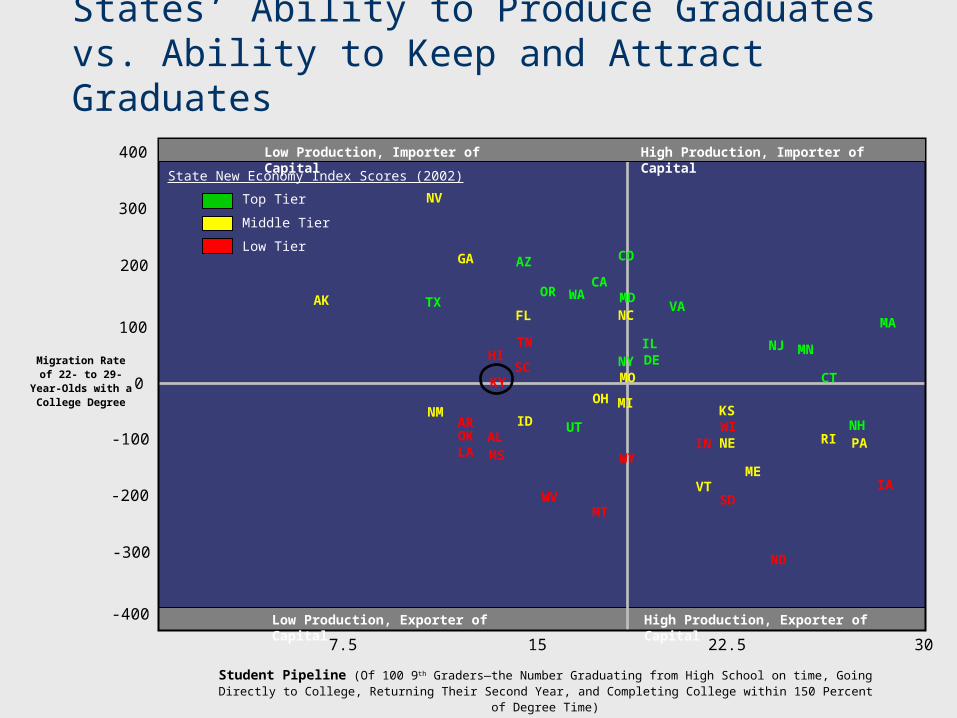
States’ Ability to Produce Graduates vs. Ability to Keep and Attract Graduates
Student Pipeline (Of 100 9th Graders—the Number Graduating from High School on time, Going Directly to College, Returning Their Second Year, and Completing College within 150 Percent of Degree Time)
Migration Rate of 22- to 29-Year-
Olds with a College Degree
100
7.5 15 22.5 30
400
AK
NV
NM
GA
ID
FL
OH
NC
MI
MO
VT
KS
NE
ME
PARI
TXOR
AZ
WA MD
IL
VA
UT
CA
CO
NY DEMN
CT
NH
NJ
MA
0
State New Economy Index Scores (2002)
Top Tier
Middle Tier
Low Tier
OKLA
AR
MS
HI
KY
AL
TN
SC
WVMT
IN
SD
WI
ND
IA
WY
Low Production, Importer of Capital High Production, Importer of Capital
Low Production, Exporter of Capital High Production, Exporter of Capital
200
300
-400
-100
-300
-200

Many of these data are available at: http://www.higheredinfo.org