Embed Size (px)
Citation preview
Kensington and Chelsea Retail and Leisure Needs Study Update Royal Borough of Kensington & Chelsea
18 April 2016
11416/03/PW/PW
Nathaniel Lichfield & Partners 14 Regent's Wharf All Saints Street London N1 9RL nlpplanning.com

This document is formatted for double sided printing. © Nathaniel Lichfield & Partners Ltd 2016. Trading as Nathaniel Lichfield & Partners. All Rights Reserved. Registered Office: 14 Regent's Wharf All Saints Street London N1 9RL All plans within this document produced by NLP are based upon Ordnance Survey mapping with the permission of Her Majesty’s Stationery Office. © Crown Copyright reserved. Licence number AL50684A
Kensington and Chelsea : Retail and Leisure Needs Study Update
10776597v2
Contents
1.0 Introduction 1
Background ...................................................................................................... 1
2.0 Recent Changes and Retail Trends 2
Retail and High Street Trends .......................................................................... 2
The Shopping Hierarchy .................................................................................. 8
Town Centre Hierarchy Analysis ...................................................................... 9
3.0 Retail Need Assessment 2
Introduction ...................................................................................................... 2
Study Area ....................................................................................................... 2
Population and Expenditure ............................................................................. 3
Existing Retail Floorspace ................................................................................ 3
Existing Spending Patterns 2016 ..................................................................... 3
Qualitative Need .............................................................................................. 7
4.0 Other Town Centre Uses 11
Service Uses .................................................................................................. 11
Commercial Leisure Uses .............................................................................. 12
5.0 Accommodating Future Growth 16
Potential Development Opportunities ............................................................. 17
6.0 Conclusions 18
Meeting Shopping and Leisure Needs ........................................................... 18
Class A Retail Floorspace Projections ........................................................... 18
Commercial Leisure ....................................................................................... 19

Kensington and Chelsea : Retail and Leisure Needs Study Update
10776597v2 P1
1.0 Introduction
Background
1.1 Nathaniel Lichfield & Partners (NLP) was commissioned by the Royal Borough
of Kensington and Chelsea to prepare the Retail and Leisure Needs Study
published in July 2008 (RLNS 2008). The RLNS 2008 included:
• an assessment of the future needs for additional retail and commercial
leisure facilities within the authority area up to 2028;
• an analysis of the role and function of existing centres in the Borough.
1.2 NLP has been commissioned to provide a partial update to the 2008 study,
providing information on recent changes/trends in retail and leisure and an
update of the needs assessment. This update report should be read alongside
the RLNS 2008.
1.3 The update identifies recent changes including the National Planning Policy
Framework (NPPF) and adopts the latest available information, e.g. population,
expenditure and turnover levels.
1.4 The key elements of work updated include:
1 revised retail floorspace data for the seven main centres1 based on the
latest Goad Plan data;
2 updated turnover estimates for existing and proposed retail floorspace;
3 Experian’s latest 2014 local expenditure data;
4 2011 census and GLA's 2014 round of population projections;
5 Experian’s latest (October 2015) expenditure growth projections and
home shopping projections;
6 update of benchmark turnovers for existing food stores (Mintel November
2015 data);
7 impact implications of commitments implemented since 2008 (primarily
Westfield) and pipeline proposals including further expansion at Brent
Cross and Westfield, the new high street and facilities at Earls Court and
development under-construction at Battersea Power Station; and
8 market commentary of recent changes and forecast for home shopping
and how these will influence the demand for new floorspace and retail
capacity projections.
1 Goad survey seven centres including King’s Road East/West and Fulham Road East/West combined.
Kensington and Chelsea : Retail and Leisure Needs Study Update
P2 10776597v2
2.0 Recent Changes and Retail Trends
Retail and High Street Trends
2.1 This section considers the changes in the retail and leisure sector nationally
and the implications for Kensington and Chelsea.
2.2 The economic downturn had a significant impact on the retail sector. A large
number of national operators failed (e.g. Phones 4 U, Blockbuster, Comet,
HMV, JJB Sports, Jessops, Clinton Cards, Woolworths, MFI, Land of Leather,
Borders, Game, Firetrap, Peacocks, La Senza, Past Times, Barratts and
Habitat), leaving major voids within town centres and on retail parks.
2.3 Many town centre development schemes were delayed or cancelled. The
demand for traditional retail warehouse operators was, and still is affected. The
main food store operators have seen a reduction in growth, with proposed new
foods cancelled.
2.4 Assessing future expenditure levels within this study needs to take into account
the likely speed of the economic recovery. Careful consideration is needed to
establish the appropriate level of expenditure growth to be adopted. This study
takes a long term view recognising the cyclical nature of expenditure growth.
Trends in population growth, home shopping/internet sales and growth in
turnover efficiency also need to be carefully considered and a balanced
approach taken.
2.5 An overview of national trends within the retail and leisure sector is set out
below.
Expenditure Growth
2.6 Historic retail trends indicate that expenditure has consistently grown in real
terms in the past, generally following a cyclical growth trend. The underlying
trend shows consistent growth and this trend is expected to continue in the
future. However the recovery from the economic downturn is expected to result
in slower growth in the short term.
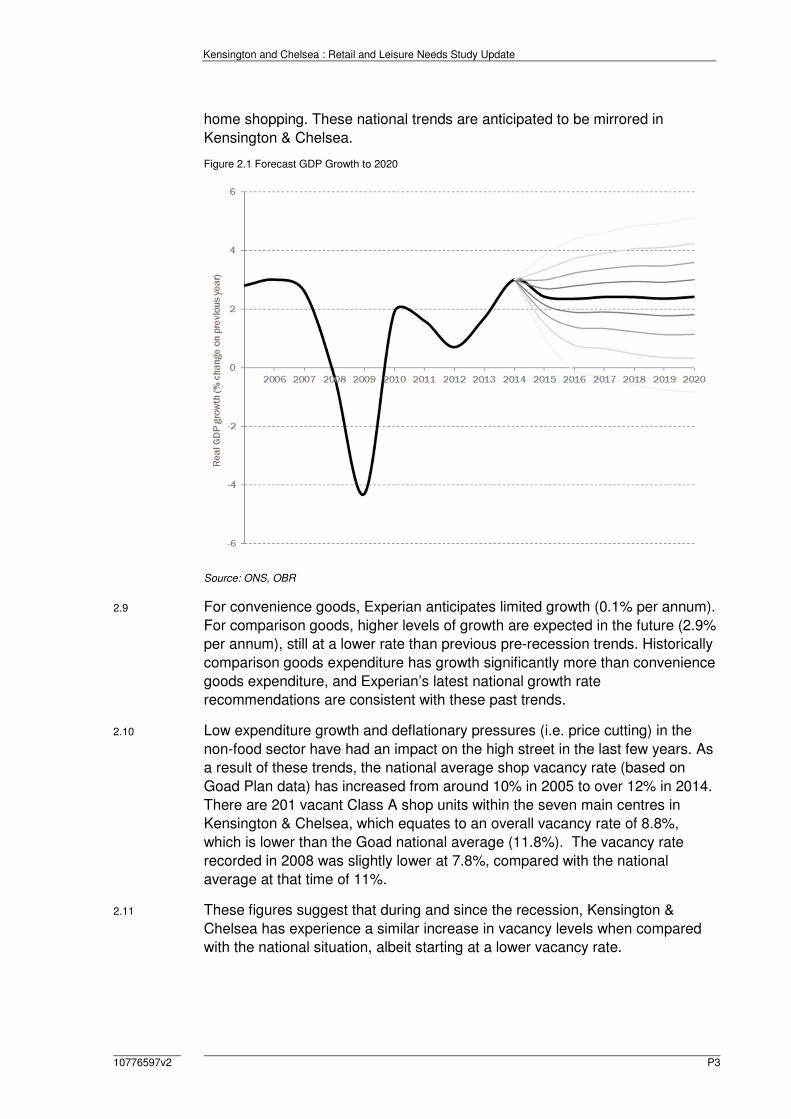
2.7 Figure 2.1 shows the Office for Budget Responsibility’s (OBR) forecast for
GDP up to 2020. After the recession in 2008, growth rebounded and from 2012
grew to the high of 3% in 2014. The OBR forecasts that growth will be slightly
above 2% per year from 2015 onwards.
2.8 In the past, expenditure growth has fuelled growth in retail floorspace, including
major out-of-centre development, particularly in the 1980s and 1990s. The
speed of recovery from the economic downturn has been slow. The high pre-
recession growth rates are unlikely to be achieved in the short term, but the
underlying trend over the medium and long terms is expected to lead to a need
for further modern retail floorspace, even allowing for continued growth in
Kensington and Chelsea : Retail and Leisure Needs Study Update
10776597v2 P3
home shopping. These national trends are anticipated to be mirrored in
Kensington & Chelsea.
Figure 2.1 Forecast GDP Growth to 2020
Source: ONS, OBR
2.9 For convenience goods, Experian anticipates limited growth (0.1% per annum).
For comparison goods, higher levels of growth are expected in the future (2.9%
per annum), still at a lower rate than previous pre-recession trends. Historically
comparison goods expenditure has growth significantly more than convenience
goods expenditure, and Experian’s latest national growth rate
recommendations are consistent with these past trends.
2.10 Low expenditure growth and deflationary pressures (i.e. price cutting) in the
non-food sector have had an impact on the high street in the last few years. As
a result of these trends, the national average shop vacancy rate (based on
Goad Plan data) has increased from around 10% in 2005 to over 12% in 2014.
There are 201 vacant Class A shop units within the seven main centres in
Kensington & Chelsea, which equates to an overall vacancy rate of 8.8%,
which is lower than the Goad national average (11.8%). The vacancy rate
recorded in 2008 was slightly lower at 7.8%, compared with the national
average at that time of 11%.
2.11 These figures suggest that during and since the recession, Kensington &
Chelsea has experience a similar increase in vacancy levels when compared
with the national situation, albeit starting at a lower vacancy rate.
Kensington and Chelsea : Retail and Leisure Needs Study Update
P4 10776597v2
New Forms of Retailing
2.12 New forms of retailing (multi-channel shopping) have continued to grow.
Home/electronic shopping has increased with the growth in the use of personal
computers, smart phones and the internet. Click and collect shopping has
become more popular. The future growth of multi-channel retailing including
home computing, internet connections and interactive TV will continue to have
an effect on retailing in the high street and from traditional stores. Trends within
this sector will have implications for retailing within Kensington & Chelsea.
2.13 Recent trends suggest continued strong growth in this sector. Experian’s Retail
Planner Briefing Note 13 (October 2015) states:
“The strong increase in online shopping in the past decade has lifted the share
of special forms of trading (SFT) to a level where it now accounts for over a
tenth of total retail sales…
The rising share of internet sales in total retail transactions dominates the
picture of SFT. Internet sales’ share of total retail sales stood at 11.7% in mid-
2015 against 4.7% in June 2008...
…non-store retailing continues to grow rapidly, outpacing traditional forms of
spending. We retain our assumption that non-store retailing will increase at a
faster pace than total retail sales well into the long term. There were 57.3
million internet users in the UK (representing 88.4% of the population) in mid-
year 2014 according to Internet World Stats. So growth of the internet user
base will be less of a driver than in the past decade. But growth momentum will
be sustained as new technology such as browsing and purchasing through
mobile phones and the development of interactive TV shopping boost internet
retailing. We expect that the SFT market share will continue to increase over
the forecast period, although the pace of e-commerce growth will moderate
markedly after about 2020. Our forecast has the SFT share of total retail sales
reaching 17.8% by 2020 rising to 19.6% by the mid-2030s.”
2.14 This retail update makes an allowance for future growth in e-tailing based on
Experian projections. It will be necessary to monitor the amount of sales
attributed to home shopping in the future in order to review future policies and
development allocations.
2.15 The implications for the demand for retail space have been carefully
considered. Some retailers operate on-line sales from their traditional retail
premises e.g. food store operators and click and collect operations, therefore
growth in on-line sales may not always mean there is a reduction in the need
for retail floorspace.
2.16 Given the likelihood that multi-channel shopping is likely to grow at a faster
pace than total retail expenditure, the retail study assessment has adopted
relatively cautious growth projections for retail expenditure (as set out in the
retail capacity methodology, Appendix 1), and allowance has been made for
retailers to increase their turnover density, due to growth in home shopping
and click and collect.
Kensington and Chelsea : Retail and Leisure Needs Study Update
10776597v2 P5
2.17 In addition to new forms of retailing, retail operators have responded to
changes in customers’ requirements. Retailers have also changed their trading
formats to include smaller store formats capable of being accommodated
within town centres (such as the Tesco Express/Metro, Sainsbury’s Central/
Local store and Marks and Spencer’s Simply Foods formats). The number of
Tesco Express, Sainsbury’s Local and Little Waitrose stores has increased
significantly during the last decade. This trend has been particularly evident in
Kensington & Chelsea, with numerous local convenience stores operated by
the main food store retailers.
2.18 A number of proposed larger food stores have not been implemented across
the country, but this trend is less evident in London, perhaps due to the high
growth in population and the absence of available sites for larger food stores.
2.19 The expansion of European discount food operators Aldi and Lidl has been
rapid during the last decade. This trend is not evident in Kensington & Chelsea,
probably due to the absence of large sites/premises for discount stores.
2.20 Comparison retailers have also responded to market conditions. The bulky
goods warehouse sector has rationalised, including a number of mergers and
failures, and scaled down store sizes. Other traditional high street retailers
often seek large out-of-centre stores, for example Boots, Next, TK Maxx and
Poundstretcher. Matalan has also opened numerous discount clothing stores
across the UK. Sports clothing retail warehouses including Decathlon have
also expanded out-of-centre.
2.21 The demand for premises within the bulky goods sector, i.e. furniture, carpets,
electrical and DIY goods, has been particularly weak during and after the
recession. This has led to voids on retail warehouse parks and proposals to
extend the range of goods sold to non-bulky goods.
2.22 The retail warehouse sector is not represented in Kensington & Chelsea, since
the closure of the Homebase store at Warwick Road. High land values and the
lack of large development sites will restrict the potential for retail warehouses in
the Borough in the future.
2.23 The charity shop sector has grown steadily over the past 20 years and there is
no sign this trend will halt. In many centres, charity shops have occupied
vacated shop premises during the recession. In many cases charity shops can
afford higher rents than small independent occupiers because of business rate
discounts, therefore it does not follow that these charity shops will be replaced
by traditional shops when the market recovers, particularly in secondary
frontages. This trend is evident in Kensington & Chelsea although charity
shops account for 2.8% of all comparison shops within the seven Goad
centres, compared with the national average of 8.4%.
2.24 The discount comparison sector has also grown significantly in recent years
e.g. pound shops. This sector is under represented in Kensington & Chelsea.
2.25 The growth of money lending/pay day loan shops and betting shops has also
raised concerns amongst planning authorities, and has resulted in a change to
Kensington and Chelsea : Retail and Leisure Needs Study Update
P6 10776597v2
permitted development rights in order to control the growth of these uses in
town centres. This trend is not as evident in Kensington & Chelsea.
2.26 Within town centres, many high street multiple comparison retailers have
changed their format. For over a decade, high street national multiples have
increasingly sought larger modern shop units (over 200 sq.m) with an
increasing polarisation of activity into the larger national, regional and sub-
regional centres, e.g. Central London, Brent Cross and Westfield.
2.27 In general operator demand for space has decreased during the recession
and, of those national multiples looking for space, many prefer to locate in
larger centres.
2.28 The continuation of these trends will influence future operator requirements in
Kensington & Chelsea with smaller vacant units becoming less attractive for
new multiple occupiers, and retailers increasingly looking to relocate into larger
units in higher order centres. However, smaller vacant units could still be
attractive to independent traders and non-retail services.
2.29 Recent and proposed changes to the General Permitted Development Order
(GPDO) may also have an impact on town centres. These measures allow for
greater flexibility for changes of use from retail to non-retail uses e.g. Class A
uses to C3 residential use and Class A1 to A2 use. These measures could
change the composition of town centres, in particular the amount of Class A1
space could reduce. The measures may lead to a reduction in vacant shop
premises, particularly in peripheral shop frontages, but this could have an
impact on the ability of operators to find space, in areas where demand is high.
It is unlikely these changes will have a significant impact on Kensington &
Chelsea, because the centres already have a broad mix of retail and non-retail
uses, and a relatively low vacancy rate.
2.30 These trends are not new and have been affecting the High Street for many
years. In response to these trends, town centres have changed and diversified.
The food and beverage, leisure and non-retail service sectors have been
successful in occupying space no longer suitable for shopping. There have
been cyclical trends in vacancy rates reflecting the macro economic trends, but
in most cases town centres recovered during periods of stronger growth. The
High Street is more resilient than many commentators give it credit.
2.31 Shopping behaviour will continue to change and the High Street will need to
continue to respond. All town centres will need to focus on the advantages they
have over other forms of multi-channel shopping, for example using the
internet as an extended shop window, click and collect facilities and providing a
combined retail and leisure experience. There will always be demand for a day
out and customers cannot eat or drink on-line.
Kensington and Chelsea : Retail and Leisure Needs Study Update
10776597v2 P7
Services, Food and Beverage
2.32 Service uses perform an important role in the overall offer of a centre, and
encourage customers to shop locally. The service uses are categorised as
follows:
• Class A1 services cover a range of uses, including hairdressers, dry
cleaners, travel agents, some sandwich shops (those not categorised as
Class A3), funeral parlours and post offices.
• Class A2 services include banks, building societies, financial services,
betting offices, pawnbrokers, estate agents and employment agencies.
• Class A3/A5 includes restaurants, cafés (A3) and takeaways (A5).
• Class A4 pubs/bars (Class A4).
2.33 Food and beverages is a fast moving and creative sector, with a steady flow of
new concepts emerging. Within this sector there has been a significant
increase in the number of national multiple chains. These national chains have
sought to increase their geographical coverage. These types of food and drink
operators (Class A3 and A4) i.e. restaurants, bars and pubs have supported
other major leisure uses, in particular cinema developments. Within town
centres, the demand has increased, including a significant expansion in the
number of coffee shops, such as Starbucks, Costa Coffee and Café Nero.
Themed restaurants have also expanded rapidly.
2.34 The key categories for food and beverage offers are:
1 impulse: characterised by their produce range that is typically highly
visual and hand-held so that it can be eaten “on the go”;
2 speed eating fast food: food that can be purchased and consumed
quickly, therefore price is low and ambience is less important. This sector
is dominated by traditional high volume fast food offers such as burgers
and fried chicken;
3 refuel and relax: a drink and snacks and a short break in a pleasant
environment rather than focusing on eating a main meal; and
4 casual dining/leisure dining: incorporating a number of food styles,
types and ethnic origins. The ambience and environment of casual dining
is as important as the food, drink and service provided. The style is
informal but is normally table service.
2.35 Food and beverage establishments (Class A3, A4 and A5) including
restaurants, bars and pubs have supported other major leisure uses on leisure
and retail parks and are important services within town and local centres.
National information available from Experian Goad indicates that the proportion
of non-retail uses within town centres across the country has increased
significantly. A balance between Class A1 and Class A3 to A5 uses needs to
be maintained.
Kensington and Chelsea : Retail and Leisure Needs Study Update
P8 10776597v2
The Shopping Hierarchy
2.36 The National Planning Policy Framework (NPPF) indicates (paragraph 23) that
planning policies should be positive, promote competitive town centre
environments and set out policies for the management and growth of centres
over the plan period. Development plans are expected to define a network and
hierarchy of centres that is resilient to anticipated future economic changes.
2.37 The National Planning Practice Guidance (NPPG) replaced the PPS4 guidance
on town centres in 2012. In terms of plan-making the NPPG’s emphasis is on
developing strategies for town centres that are appropriate and realistic to the
role of centres in the hierarchy. Town centre strategies should be based on the
current state of a centre and opportunities to meet development needs. These
town centre strategies should seek to support the town centre vitality and
viability, and should assess if changes to the role and hierarchy of centres are
appropriate. This section provides an overview of the shopping hierarchy in
Kensington and Chelsea and the surrounding sub-region.
The Designation of Town Centres
2.38 The NPPF indicates that local planning authorities should adopt a positive and
proactive approach to planning for growth and the future of the centres within
their areas. Local planning authorities are expected to identify the hierarchy of
centres and how the role of different centres will contribute to the overall vision
for their area. The town centre hierarchy is clearly set out in the RBKC
Consolidated Local Plan and the Further Alterations London Plan 2015 (FALP).
2.39 In terms of the London Plan hierarchy, Kensington and Chelsea contains:
International Centre
• Knightsbridge
Major Centres
• Kensington High Street
• Kings Road East (Goad Plan name = Chelsea Kings Road)
District Centres
• Earls Court Road (Neighbourhood Centre in the RBKC Local Plan)
• Fulham Road East (Brompton Cross DC in the RBKC Local Plan)
• Fulham Road West (Fulham Road DC in the RBKC Local Plan)
• Kings Road West (Goad Plan name = Chelsea Worlds End)
• Notting Hill Gate
• Portobello Road (Special District Centre in the RBKC Local Plan)
• South Kensington
Kensington and Chelsea : Retail and Leisure Needs Study Update
10776597v2 P9
2.40 Below District Centres, the FALP refers to Neighbourhood and Local Centres,
but these centres are not individually identified.
2.41 In addition to the 10 main centres designated within the FALP, the RBKC
Consolidated Local Plan identifies Westbourne Grove as a Special District
Centre and 36 Neighbourhood Town Centre (including Earls Court Road
identified as a District Centre in the FALP. In total Kensington and Chelsea
has 46 designated centres.
Town Centre Hierarchy Analysis
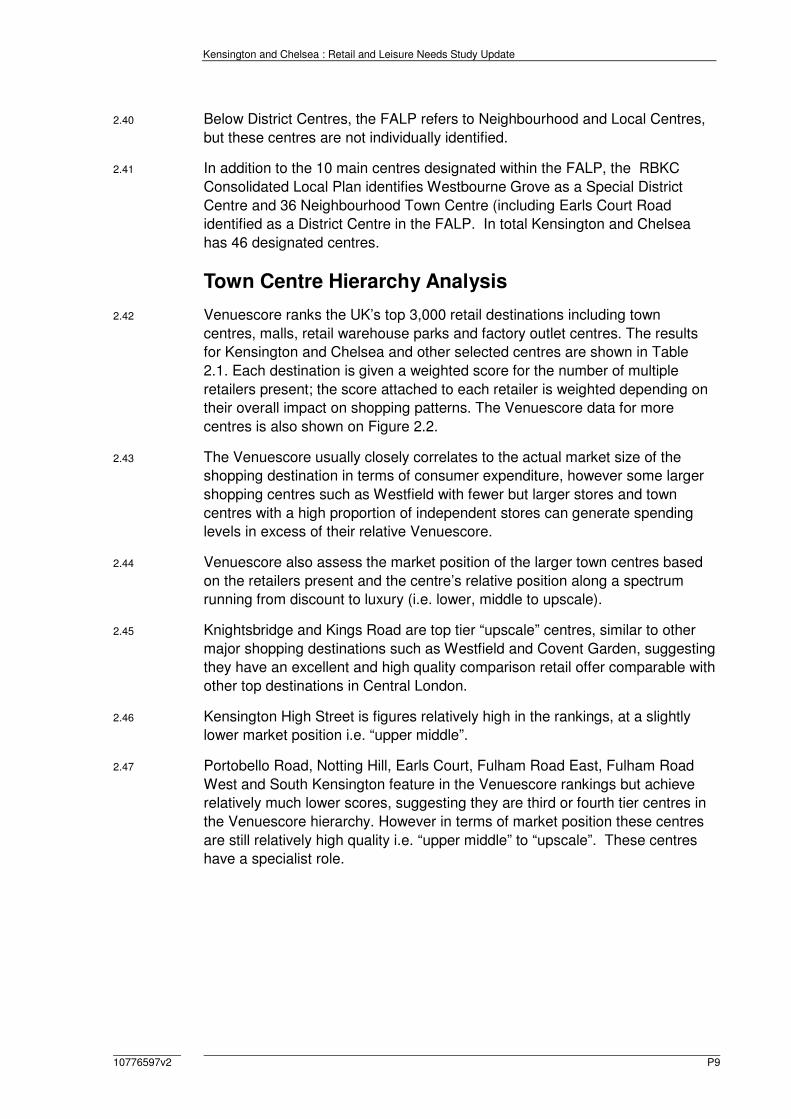
2.42 Venuescore ranks the UK’s top 3,000 retail destinations including town
centres, malls, retail warehouse parks and factory outlet centres. The results
for Kensington and Chelsea and other selected centres are shown in Table
2.1. Each destination is given a weighted score for the number of multiple
retailers present; the score attached to each retailer is weighted depending on
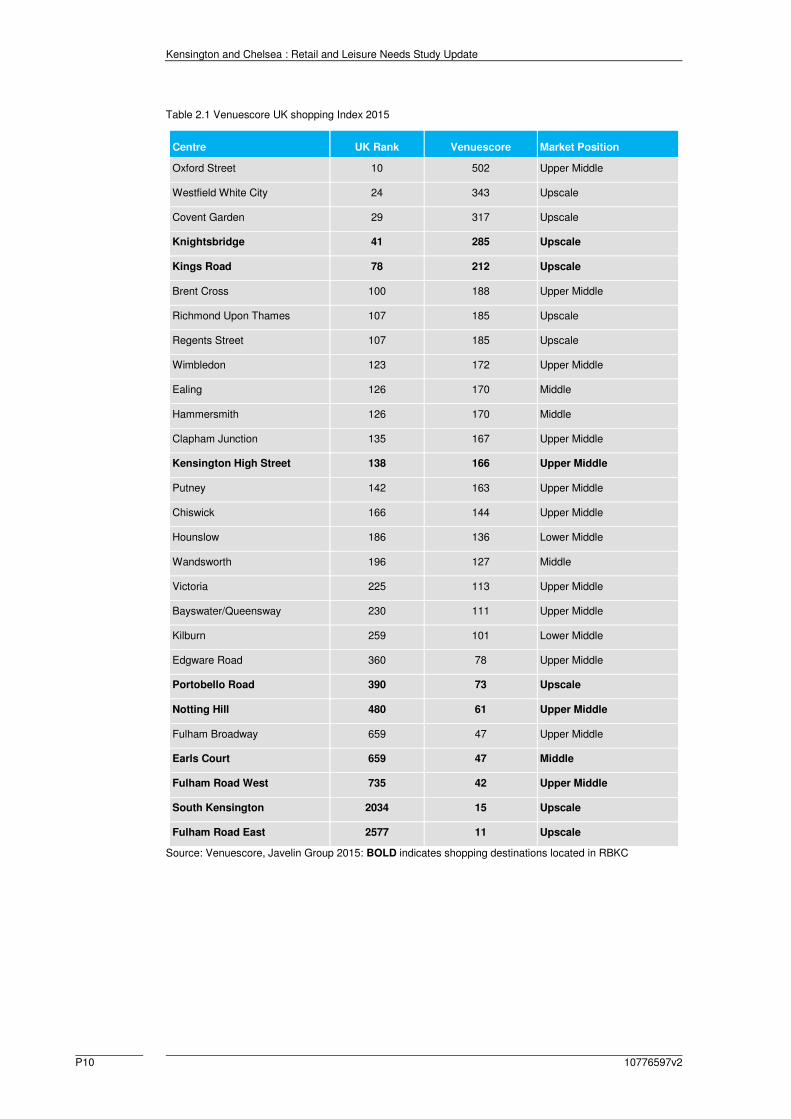
their overall impact on shopping patterns. The Venuescore data for more
centres is also shown on Figure 2.2.
2.43 The Venuescore usually closely correlates to the actual market size of the
shopping destination in terms of consumer expenditure, however some larger
shopping centres such as Westfield with fewer but larger stores and town
centres with a high proportion of independent stores can generate spending
levels in excess of their relative Venuescore.
2.44 Venuescore also assess the market position of the larger town centres based
on the retailers present and the centre’s relative position along a spectrum
running from discount to luxury (i.e. lower, middle to upscale).
2.45 Knightsbridge and Kings Road are top tier “upscale” centres, similar to other
major shopping destinations such as Westfield and Covent Garden, suggesting
they have an excellent and high quality comparison retail offer comparable with
other top destinations in Central London.
2.46 Kensington High Street is figures relatively high in the rankings, at a slightly
lower market position i.e. “upper middle”.
2.47 Portobello Road, Notting Hill, Earls Court, Fulham Road East, Fulham Road
West and South Kensington feature in the Venuescore rankings but achieve
relatively much lower scores, suggesting they are third or fourth tier centres in
the Venuescore hierarchy. However in terms of market position these centres
are still relatively high quality i.e. “upper middle” to “upscale”. These centres
have a specialist role.
Kensington and Chelsea : Retail and Leisure Needs Study Update
P10 10776597v2
Table 2.1 Venuescore UK shopping Index 2015
Centre UK Rank Venuescore Market Position
Oxford Street 10 502 Upper Middle
Westfield White City 24 343 Upscale
Covent Garden 29 317 Upscale
Knightsbridge 41 285 Upscale
Kings Road 78 212 Upscale
Brent Cross 100 188 Upper Middle
Richmond Upon Thames 107 185 Upscale
Regents Street 107 185 Upscale
Wimbledon 123 172 Upper Middle
Ealing 126 170 Middle
Hammersmith 126 170 Middle
Clapham Junction 135 167 Upper Middle
Kensington High Street 138 166 Upper Middle
Putney 142 163 Upper Middle
Chiswick 166 144 Upper Middle
Hounslow 186 136 Lower Middle
Wandsworth 196 127 Middle
Victoria 225 113 Upper Middle
Bayswater/Queensway 230 111 Upper Middle
Kilburn 259 101 Lower Middle
Edgware Road 360 78 Upper Middle
Portobello Road 390 73 Upscale
Notting Hill 480 61 Upper Middle
Fulham Broadway 659 47 Upper Middle
Earls Court 659 47 Middle
Fulham Road West 735 42 Upper Middle
South Kensington 2034 15 Upscale
Fulham Road East 2577 11 Upscale
Source: Venuescore, Javelin Group 2015: BOLD indicates shopping destinations located in RBKC
Kensington and Chelsea : Retail and Leisure Needs Study Update
10776597v2 P1
Figure 2.2: Venuescore Centres in Central/West London
Source: Javelin Venuescore 2015

Kensington and Chelsea : Retail and Leisure Needs Study Update
10776597v2 P1
Provision in Royal Borough of Kensington and Chelsea
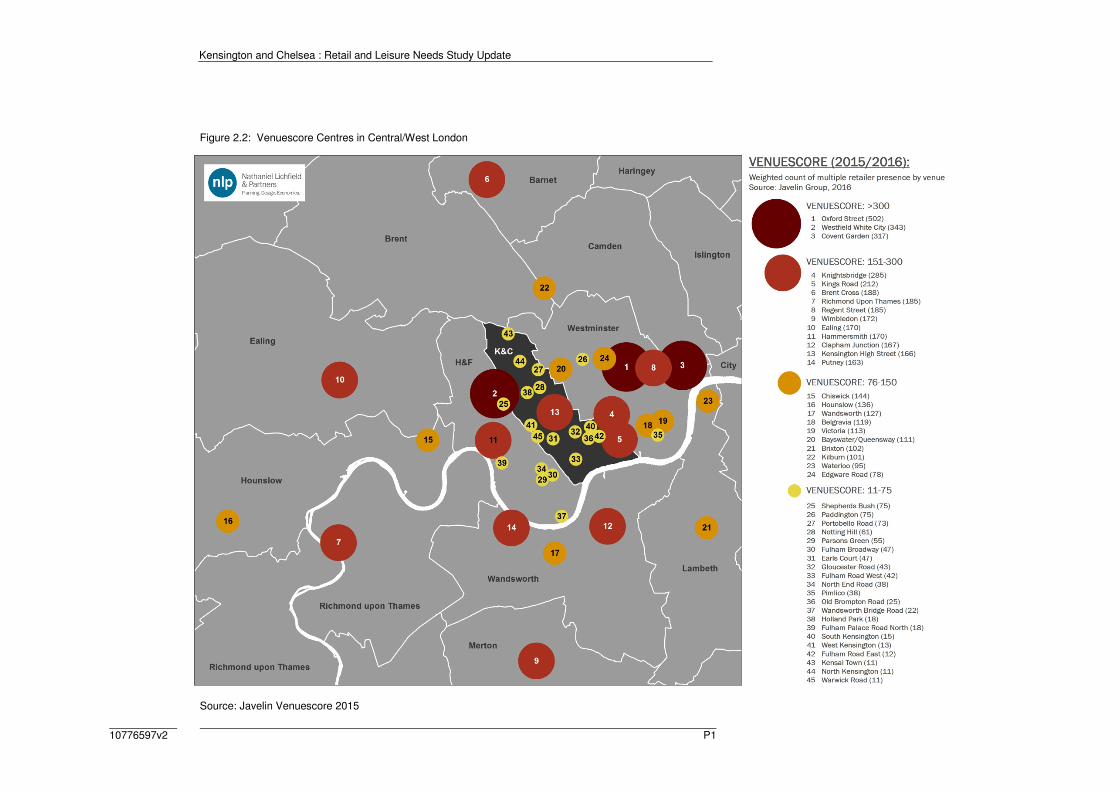
2.48 A summary of existing retail provision within Goad Plan centres in Kensington
and Chelsea is provided in Table 2.2.
Table 2.2 Existing Retail Provision in RB Kensington and Chelsea
Centre
Number
Shop
Units
Convenience
Floorspace
(sq.m gross)
Comparison
Floorspace
*(sq.m gross)
Food and
Beverage
(sq.m gross)
Knightsbridge 304 3,270 171,720 9,130
King’s Road (East and West) 415 6,630 81,840 9,520
Kensington High Street 368 7,360 51,690 10,290
Fulham Road (East and West) 315 3,340 23,250 8,840
Portobello Rd (incl. Westbourne G) 491 3,850 28,230 8,770
Notting Hill Gate 249 3,640 9,640 7,290
Earls Court Road 135 2,850 1,920 3,850
Total 2,277 30,940 368,290 57,690
Sources: Goad Plans 2015 * includes upper trading floors
2.49 A more detailed breakdown of the existing retail provision in the main centres
is provided in Appendix 2.
Kensington and Chelsea : Retail and Leisure Needs Study Update
P2 10776597v2
3.0 Retail Need Assessment
Introduction
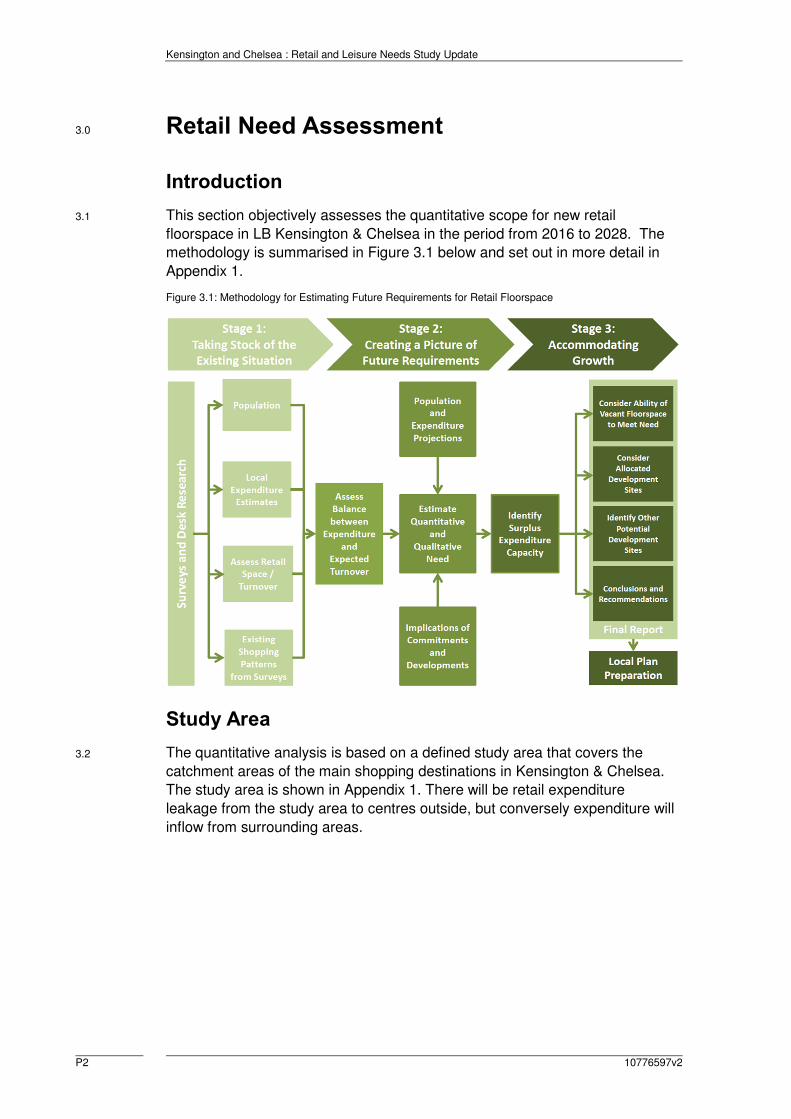
3.1 This section objectively assesses the quantitative scope for new retail
floorspace in LB Kensington & Chelsea in the period from 2016 to 2028. The
methodology is summarised in Figure 3.1 below and set out in more detail in
Appendix 1.
Figure 3.1: Methodology for Estimating Future Requirements for Retail Floorspace
Study Area
3.2 The quantitative analysis is based on a defined study area that covers the
catchment areas of the main shopping destinations in Kensington & Chelsea.
The study area is shown in Appendix 1. There will be retail expenditure
leakage from the study area to centres outside, but conversely expenditure will
inflow from surrounding areas.
Kensington and Chelsea : Retail and Leisure Needs Study Update
10776597v2 P3
Population and Expenditure
3.3 The study area population for 2011 to 2028 is set out in Table 1 in Appendix 3.
The 2011 base year population for each zone has been obtained and projected
to 2031 using the GLA 2014 Round of Demographic Projections ward (SHLAA
bases) projections.
3.4 Table 2 in Appendix 3 sets out the forecast growth in spending per head for
convenience goods within each zone in the study area up to 2028. Forecasts
of comparison goods spending per capita are shown in Table 2 in Appendix 4.
3.5 Based on the GLA population projections, as a consequence of growth in
population and per capita spending, convenience goods spending within the
study area is forecast to increase by 9.2% from £1,701 million in 2016 to
£1,858 million in 2028, as shown in Table 3 (Appendix 2).
3.6 Comparison goods spending is forecast to increase by 53% between 2016 and
2028, increasing from £2,759 million in 2016 to £4,227 million in 2028, as
shown in Table 3 (Appendix 3).
3.7 It should be noted that comparison goods spending is forecast to increase
more than convenience spending as the amount spent on food and beverage
does not increase proportionately with disposable income, whereas spending
on non-food goods is more closely linked to income.
3.8 These figures relate to real growth and exclude inflation.
Existing Retail Floorspace
3.9 Existing convenience goods retail sales floorspace within Kensington &
Chelsea is around 50,200 sq.m net, as set out in Table 10 in Appendix 3. This
floorspace figure excludes comparison sales floorspace within food stores.
This floorspace is relatively evenly spread throughout the Kensington &
Chelsea. The amount of convenience goods sales floorspace has increase by
10% from 45,500 sq.m net in 2008, due primarily to new small convenience
stores. There are now 38 food stores operated by the main food retailers
(source: ORC’s StorePoint), compared with 31 stores in 2008.
3.10 Comparison goods retail sales floorspace within Kensington & Chelsea was
estimated to be around 269,700 sq.m net in 2008. This net sales floorspace is
estimated to have fallen slightly to 267,700 sq.m net in 2015, based on the
latest Goad Plan information.
Existing Spending Patterns 2016
3.11 The results of the household shopper questionnaire survey undertaken by
NEMS in February 2008 were adopted to estimate base year shopping
patterns within the study area zones. The RLNS 2008 adjusted market shares
to reflect know commitments at that time, e.g. Westfield White City. These
adjusted market shares have been adopted for the new 2016 base year, with
Kensington and Chelsea : Retail and Leisure Needs Study Update
P4 10776597v2
further adjustments made based on household survey information, obtained
from more recent retail studies/impact assessments.
Convenience Shopping
3.12 The adjusted estimates of market share or penetration within each study area
zone are shown in Table 4, Appendix 3. The proportion of convenience goods
expenditure retained within Kensington & Chelsea (Zones 1- 3) is relatively
high at 80%. Based on NLP’s experience from other recent studies across
London, this level of convenience goods expenditure retention is relatively
high. There appears to be limited scope to increase the retention of
convenience goods expenditure within the Kensington & Chelsea area.
3.13 The level of convenience goods expenditure attracted to shops/stores in LB
Kensington & Chelsea in 2016 is estimated to be £554 million as shown in
Table 5, Appendix 3. This includes estimates of inflow from beyond the study
area, applying the adjusted market shares set out in Table 4.
3.14 The total benchmark turnover of identified existing convenience sales
floorspace within Kensington & Chelsea, based on company average sales
densities is £500 million (Table 10 in Appendix 3), compared with the actual
turnover of £554 million. These figures suggest that convenience retail sales
floorspace in Kensington & Chelsea is trading healthily at 11% above the
expected benchmark. This suggests a base year expenditure surplus of £54
million.
3.15 Based on NLP’s recent experience, food stores within London tend to trade
above national average sales densities, which may reflect higher property
costs and more affluent households. Furthermore, food stores in London tend
to be smaller with less circulation space and therefore the sales density per
unit of floorspace is likely to be higher.
3.16 The future levels of available convenience goods expenditure in 2018, 2023
and 2028 are shown at Tables 7 to 9 in Appendix 3. These projections are
based on adjusted market shares to reflect committed food store proposals
within the Vauxhall, Nine Elms and Battersea regeneration area.
3.17 The total level of convenience goods expenditure available for shops in
Kensington & Chelsea between 2016 and 2028 is summarised in Table 11 in
Appendix 3. Allowing for population and expenditure per capita growth and
increased market shares, convenience goods expenditure available to
shopping facilities in Kensington & Chelsea is expected to increase from £554
million in 2016 to £579 million in 2028, an additional £25 million.
3.18 The expenditure projections are converted into potential new floorspace
estimates in Table 12 in Appendix 3. Expenditure growth is converted into
floorspace estimates based on an average sales density figure of £10,244 per
sq.m net for the main stores/centres, based on the average derived from the
benchmark turnover. A density of 38,000 per sq.m net is adopted for other
Kensington and Chelsea : Retail and Leisure Needs Study Update
10776597v2 P5
local shops. No increase in sales density has been assumed for convenience
goods, in line with Experian forecasts.
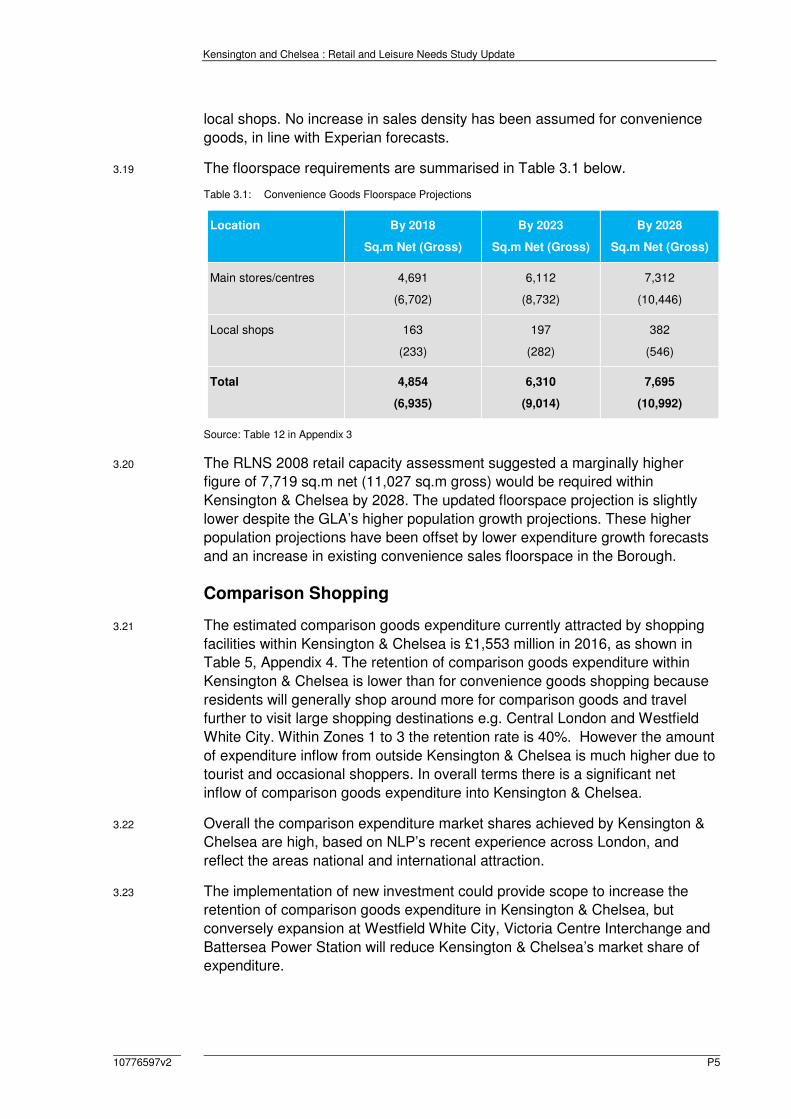
3.19 The floorspace requirements are summarised in Table 3.1 below.
Table 3.1: Convenience Goods Floorspace Projections
Location By 2018
Sq.m Net (Gross)
By 2023
Sq.m Net (Gross)
By 2028
Sq.m Net (Gross)
Main stores/centres 4,691
(6,702)
6,112
(8,732)
7,312
(10,446)
Local shops 163
(233)
197
(282)
382
(546)
Total 4,854
(6,935)
6,310
(9,014)
7,695
(10,992)
Source: Table 12 in Appendix 3
3.20 The RLNS 2008 retail capacity assessment suggested a marginally higher
figure of 7,719 sq.m net (11,027 sq.m gross) would be required within
Kensington & Chelsea by 2028. The updated floorspace projection is slightly
lower despite the GLA’s higher population growth projections. These higher
population projections have been offset by lower expenditure growth forecasts
and an increase in existing convenience sales floorspace in the Borough.
Comparison Shopping
3.21 The estimated comparison goods expenditure currently attracted by shopping
facilities within Kensington & Chelsea is £1,553 million in 2016, as shown in
Table 5, Appendix 4. The retention of comparison goods expenditure within
Kensington & Chelsea is lower than for convenience goods shopping because
residents will generally shop around more for comparison goods and travel
further to visit large shopping destinations e.g. Central London and Westfield
White City. Within Zones 1 to 3 the retention rate is 40%. However the amount
of expenditure inflow from outside Kensington & Chelsea is much higher due to
tourist and occasional shoppers. In overall terms there is a significant net
inflow of comparison goods expenditure into Kensington & Chelsea.
3.22 Overall the comparison expenditure market shares achieved by Kensington &
Chelsea are high, based on NLP’s recent experience across London, and
reflect the areas national and international attraction.
3.23 The implementation of new investment could provide scope to increase the
retention of comparison goods expenditure in Kensington & Chelsea, but
conversely expansion at Westfield White City, Victoria Centre Interchange and
Battersea Power Station will reduce Kensington & Chelsea’s market share of
expenditure.

Kensington and Chelsea : Retail and Leisure Needs Study Update
P6 10776597v2
3.24 Based on the base year estimate of comparison goods expenditure attracted to
facilities within Kensington & Chelsea, the average sales density for existing
comparison sales floorspace (267,695 sq.m net) is £5,800 per sq.m net. The
Kensington & Chelsea average was £6,442 per sq.m net in 2008 (2006 prices).
Part of this reduction in average sales density is due to deflation in comparison
good from 2006 to 2014 prices. The deflation adjusted sales density for 2008 is
£6,088 per sq.m net, which is still 5% higher than the updated 2016 base year
average turnover density.
3.25 The average sales density may have reduced due to the effects of the
recession and the impacts of recent developments. However, the current sales
density £5,800 per sq.m net is still satisfactory, although lower than the healthy
trading levels estimated in 2008.
3.26 The comparisons goods turnover of facilities in the Borough was £1,642 million
in 2008 (adjusted to 2014 prices), which is 5.4% higher than the current 2016
turnover. Between 2008 and 2016 the amount of comparison goods
expenditure within the study area increased by 25%, due to population growth
and growth in expenditure per person. If facilities in Kensington & Chelsea had
maintained their market share of expenditure between 2008 to 2016, then one
would expect the 2016 turnover to be around 30% higher than the estimate set
out above (around £2,019 million rather than £1,553 million). These figures
suggest that the cumulative impacts of Westfield and other developments
implemented between 2008 to 2016 was around 30%, but most of this impact
has been offset by expenditure growth. As a result current 2016 trading levels
are only 5.4% lower than the pre-Westfield turnover in 2008.
3.27 The RLNS 2008 predicted the post Westfield turnover of facilities in Kensington
& Chelsea would be £2,044 million in 2016. This figure is much higher than the
revised projection (£1,553 million), because total comparison goods
expenditure within the study area at 2016 is 8.1% lower than the previous
projected estimate in the RLNS 2008, and the impact of Westfield and other
developments implemented between 2008 and 2016 has been much higher
than that predicted in 2008.
3.28 These figures suggest that, despite population and comparison expenditure
growth between 2008 and 2016, growth has been offset and exceeded by the
impact of development since 2008, most notably being the opening of
Westfield. Available comparison goods expenditure has been projected
forward to 2018, 2023 and 2028 in Tables 6 to 9 in Appendix 4, based on
adjusted market shares to reflect current commitments. The results are
summarised in Table 11. Available comparison expenditure to facilities within
Kensington & Chelsea is expected to increase from £1,533 million in 2016 to
£2,089 million in 2028.
3.29 For the purposes of this assessment, the existing comparison goods
floorspace is estimated to be trading at equilibrium in 2016 (i.e. satisfactory
levels). Table 10 assumes that the turnover of comparison floorspace will
increase in real terms in the future. A growth rate of 2% per annum is adopted,
as recommended by Experian. This growth will help to maintain the health and
Kensington and Chelsea : Retail and Leisure Needs Study Update
10776597v2 P7
viability of town centres. Trends indicate that comparison retailers historically
will achieve some growth in trading efficiency.
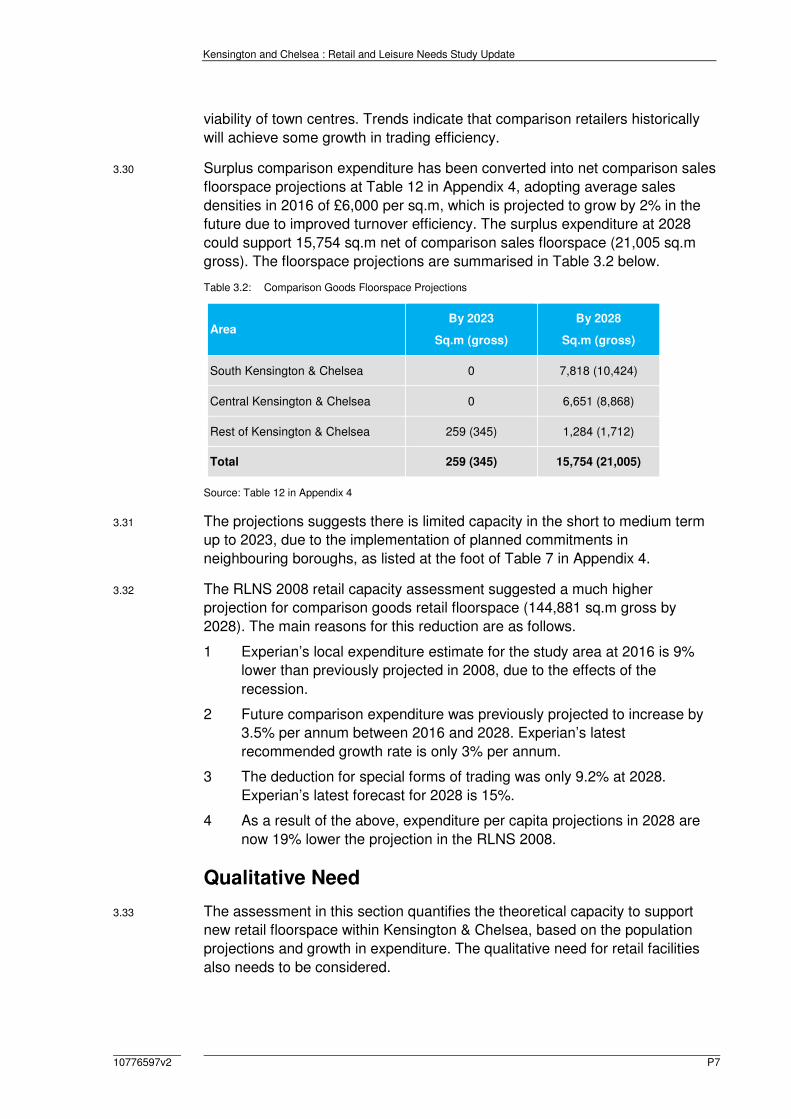
3.30 Surplus comparison expenditure has been converted into net comparison sales
floorspace projections at Table 12 in Appendix 4, adopting average sales
densities in 2016 of £6,000 per sq.m, which is projected to grow by 2% in the
future due to improved turnover efficiency. The surplus expenditure at 2028
could support 15,754 sq.m net of comparison sales floorspace (21,005 sq.m
gross). The floorspace projections are summarised in Table 3.2 below.
Table 3.2: Comparison Goods Floorspace Projections
Area By 2023
Sq.m (gross)
By 2028
Sq.m (gross)
South Kensington & Chelsea 0 7,818 (10,424)
Central Kensington & Chelsea 0 6,651 (8,868)
Rest of Kensington & Chelsea 259 (345) 1,284 (1,712)
Total 259 (345) 15,754 (21,005)
Source: Table 12 in Appendix 4
3.31 The projections suggests there is limited capacity in the short to medium term
up to 2023, due to the implementation of planned commitments in
neighbouring boroughs, as listed at the foot of Table 7 in Appendix 4.
3.32 The RLNS 2008 retail capacity assessment suggested a much higher
projection for comparison goods retail floorspace (144,881 sq.m gross by
2028). The main reasons for this reduction are as follows.
1 Experian’s local expenditure estimate for the study area at 2016 is 9%
lower than previously projected in 2008, due to the effects of the
recession.
2 Future comparison expenditure was previously projected to increase by
3.5% per annum between 2016 and 2028. Experian’s latest
recommended growth rate is only 3% per annum.
3 The deduction for special forms of trading was only 9.2% at 2028.
Experian’s latest forecast for 2028 is 15%.
4 As a result of the above, expenditure per capita projections in 2028 are
now 19% lower the projection in the RLNS 2008.
Qualitative Need
3.33 The assessment in this section quantifies the theoretical capacity to support
new retail floorspace within Kensington & Chelsea, based on the population
projections and growth in expenditure. The qualitative need for retail facilities
also needs to be considered.
Kensington and Chelsea : Retail and Leisure Needs Study Update
P8 10776597v2
3.34 Qualitative need can be assessed through consideration of the following
factors:
• deficiencies or ‘gaps’ in existing provision;
• consumer choice and competition;
• overtrading, congestion and overcrowding of existing stores;
• location specific needs such as underserved markets; and
• the quality of existing provision.
3.35 As indicated in Section 2, Kensington and Chelsea has a designated
International Centre (Knightsbridge) and two Major Centres (Kensington High
Street and Kings Road East). These three centres are major shopping
destinations within central London. These centres are supported by relatively
large designated District Centres. The network of centres serves shoppers
from the Borough and across London, and also tourist visitors.
Mix of Uses and Occupier Representation
3.36 The seven main centres surveyed by Experian Goad in 2015 have 2,277
retail/service units (excluding non-retail Class A uses). Tables 1 and 2 in
Appendix 2 set out the mix of uses in these seven main centres. Figure 1 in
Appendix 2 compares the mix of units within each centre with the Goad
national average.
3.37 The proportion of comparison goods retail units is higher than the national
average in all centres accept for Earls Court Road, which has a high proportion
of non-retail services. All centres have a high proportion of Class A3
restaurants/café, reflecting the strong evening economy and tourist attractions
in the Borough. Vacancy rates are generally lower than the national average,
with the exception of Knightsbridge. Knightsbridge has a large number of
properties undergoing alternation at the time of the Goad survey (May 2015).
3.38 The number of vacant units has increased from 157 recorded in 2008 to 201 in
2012. This increase may be due to the continuing effects of the recession and
the impact of major development (i.e. Westfield).
3.39 The increase in vacant units is not significant and there are no obvious
concentrations of vacant units within centres, a part from units under alteration
in Knightsbridge. The overall vacancy rate (8.8%) remains below the national
average (11.8%).
Convenience Goods Retailer Representation
3.40 Food store provision is set out in Table 10 in Appendix 2. There are three food
superstores (2,500 sq.m net or more) in the Borough i.e. Sainsbury stores at
Ladbroke Grove and Cromwell Road and Tesco West Cromwell Road. These
food superstores are supported by other large/medium food stores (around
1,000 to 2,000 sq.m net) that are also suitable for bulk/weekly food and grocery
Kensington and Chelsea : Retail and Leisure Needs Study Update
10776597v2 P9
shopping e.g. Waitrose and Tesco Metros stores and Marks & Spencer Food
Halls.
3.41 There are a large number of small convenience stores (less than 500 sq.m net)
that are suitable for basket and top-up food shopping e.g. Marks & Spencer
Simply Food, Little Waitrose, Tesco Express and Sainsbury’s Local stores. In
addition to food stores, centres within Kensington and Chelsea have a good
selection of small independent convenience shops.
3.42 In Kensington & Chelsea a higher proportion of household shop at smaller
stores, by bus or on foot, when compared with other parts of the Country and
outer London. This is reflected in the existing mix of food store in the Borough.
The provision of food stores in the Borough is shown in Table 10, Appendix 3.
3.43 Residents in the Borough have excellent access to a choice of food stores and
convenience shops.
Comparison Goods Retailer Representation
3.44 The total number of comparison goods shops is 1,071. The number recorded
in these centres in 2008 was 1,095, which suggests this sector reduced only
slightly despite the effects of the recession.
3.45 The network of centres in Kensington and Chelsea provide an extensive range
and choice comparison shops, including many national multiples and
independent specialists. The centres provide a spread of comparison shopping
destinations across the centre and south of the Borough, however there is
limited comparison provision in the north of the Borough. Portobello Road and
Westbourne Grove serve the northern part of the Borough, but they are more
specialist destinations and do not provide the same range and choice of
comparison shopping when compare with the Major and International Centres.
Nevertheless, residents in this part of the Borough have excellent access to the
Westfield Shopping Centre at White City.
3.46 Within Kensington & Chelsea the main department stores offer an extensive
range of furniture and electrical items and there is also a good provision of high
street and independent furniture, carpet and electrical shops. There are a large
number of antique shops and art galleries throughout the Borough, which
reflects the high proportion of affluent residents within the Borough and the
areas national and international reputation for specialist antiques shopping.
3.47 The Homebase on Warwick Road was the only traditional large retail
warehouse in Kensington & Chelsea, but this has now closed. Large retail
warehouses are unlikely to be viable in the Borough due to high land values
and the absence of large development sites. Retail warehouses in London are
generally concentrated in outer London Boroughs. The potential to improve
retail warehouse provision within the Borough is limited.
3.48 Despite the lack of retail warehouses within the Borough, there are a selection
of retail warehouses within close proximity to the Borough including Homebase
& B&Q in Wandsworth, Comet and Currys in Wembley and other standalone
Kensington and Chelsea : Retail and Leisure Needs Study Update
P10 10776597v2
stores in Hammersmith, Fulham, Acton and Chiswick. The Borough has a good
selection of traditional hardware stores, furniture shops and interior design
specialists.

Kensington and Chelsea : Retail and Leisure Needs Study Update
10776597v2 P11
4.0 Other Town Centre Uses
Service Uses
4.1 The network of centres in the Borough has an extensive range and choice of
service uses. Tables 1 and 2 in Appendix 2 indicate that the Goad surveyed
centres within the Borough have 232 Class A1 services e.g. hairdressers,
beauty parlours, travel agents and dry cleaners.
4.2 There are 170 Class A2 financial and professional services e.g. banks, building
societies and estate agents. Food and beverage outlets (A3/A4/A5) total 430,
with a particularly strong provision of Class A3 restaurants/cafés.
4.3 Food and beverage establishments (Class A3, A4 and A5) including
restaurants, bars and pubs are important services within town and local
centres. National information available from Experian Goad indicates that the
proportion of non-retail uses within town centres across the country has
increased significantly. The current UK average for Goad town centres
indicates that 14.7% of units are in Class A3/A5 (restaurants, café and
takeaway) and 2.9% of units are Class A4 (public houses/bars). A balance
between Class A1 and Class A3 to A5 uses needs to be maintained. The mix
of uses in the main centres in Kensington and Chelsea is shown in Appendix 2.
4.4 The Goad Plan surveys indicate the proportions of Class A3/A5/A4 within
Kensington and Chelsea are higher than the national average. In particular
there is an excellent provision of Class A3 restaurants/café.
Food and Beverage Expenditure
4.5 Experian's latest 2014 local expenditure figures have been adopted. Food and
beverage expenditure per capita projections are shown in Table 2 in Appendix
5. The total food and beverage expenditure in the study area is £1,510 million
at 2016. Food and beverage expenditure per capita is expected to increase in
real terms (excluding inflation) by 30% between 2016 and 2028. Taking into
account population growth, total food and beverage expenditure within the
study area is expected to increase from £1,510 million in 2016 to £1,969 million
in 2028 (Table 3 in Appendix 5).
4.6 Existing food and beverage expenditure patterns have been modelled based
on previous household survey results. The penetration rates are shown in
Table 4 in Appendix 5 and expenditure patterns are shown in Table 4. The
estimated expenditure currently attracted to facilities within Kensington and
Chelsea is £536 million in 2016.
4.7 Based on the estimate of food and beverage expenditure attracted to facilities
within the Borough, the average annual turnover of the 430 food and beverage
outlets in the main centres is over £1.1 million per outlet, with an average
turnover density of about £8,000 per sq.m gross, although the Goad floorspace
will exclude upper and basement floors.
Kensington and Chelsea : Retail and Leisure Needs Study Update
P12 10776597v2
Future Food and Beverage Capacity
4.8 Available food and beverage expenditure has been projected forward to 2028
based on adjusted market shares in Tables 6 to 8 in Appendix 5. Existing
facilities are expected to increase their turnover by 1% per annum. Future
available expenditure is compared with the projected turnover of existing
facilities in Table 10 in Appendix 5.
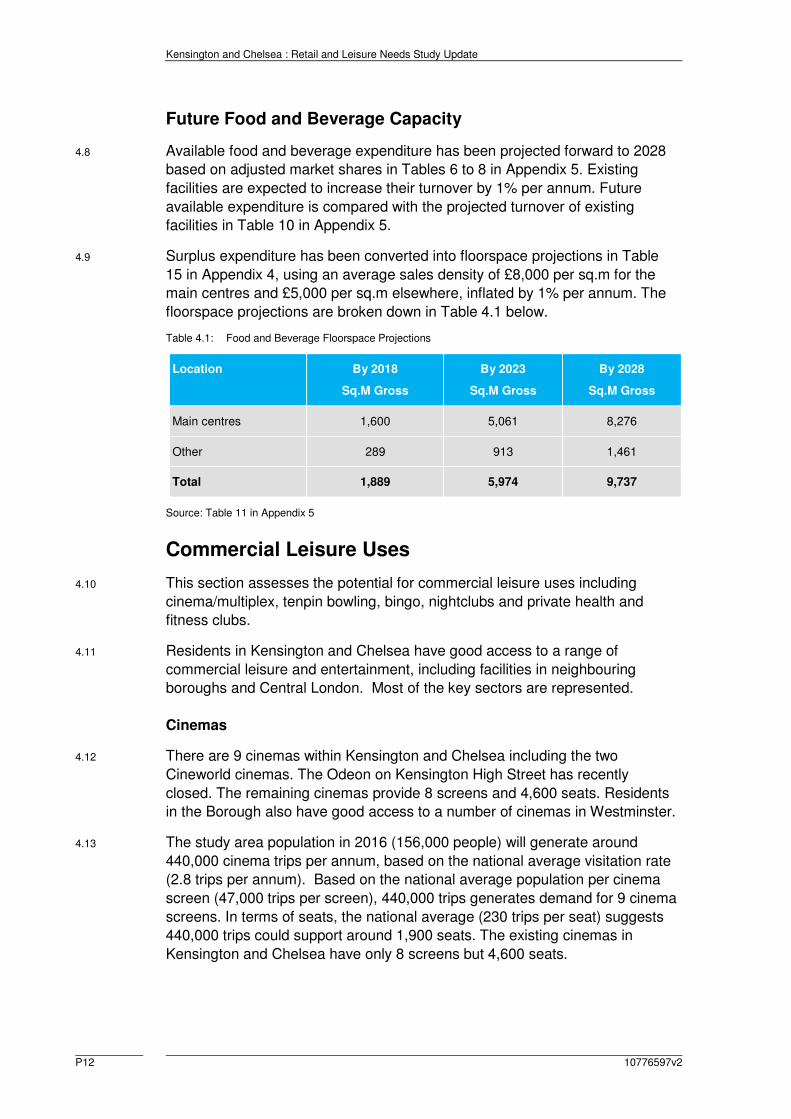
4.9 Surplus expenditure has been converted into floorspace projections in Table
15 in Appendix 4, using an average sales density of £8,000 per sq.m for the
main centres and £5,000 per sq.m elsewhere, inflated by 1% per annum. The
floorspace projections are broken down in Table 4.1 below.
Table 4.1: Food and Beverage Floorspace Projections
Location By 2018
Sq.M Gross
By 2023
Sq.M Gross
By 2028
Sq.M Gross
Main centres 1,600 5,061 8,276
Other 289 913 1,461
Total 1,889 5,974 9,737
Source: Table 11 in Appendix 5
Commercial Leisure Uses
4.10 This section assesses the potential for commercial leisure uses including
cinema/multiplex, tenpin bowling, bingo, nightclubs and private health and
fitness clubs.
4.11 Residents in Kensington and Chelsea have good access to a range of
commercial leisure and entertainment, including facilities in neighbouring
boroughs and Central London. Most of the key sectors are represented.
Cinemas
4.12 There are 9 cinemas within Kensington and Chelsea including the two
Cineworld cinemas. The Odeon on Kensington High Street has recently
closed. The remaining cinemas provide 8 screens and 4,600 seats. Residents
in the Borough also have good access to a number of cinemas in Westminster.
4.13 The study area population in 2016 (156,000 people) will generate around
440,000 cinema trips per annum, based on the national average visitation rate
(2.8 trips per annum). Based on the national average population per cinema
screen (47,000 trips per screen), 440,000 trips generates demand for 9 cinema
screens. In terms of seats, the national average (230 trips per seat) suggests
440,000 trips could support around 1,900 seats. The existing cinemas in
Kensington and Chelsea have only 8 screens but 4,600 seats.
Kensington and Chelsea : Retail and Leisure Needs Study Update
10776597v2 P13
4.14 Based on national average visitation rates, Kensington and Chelsea’s
population at 2028 (167,000) would generate demand for 10 cinema screens
or 2,033 seats.
4.15 There is limited need for further cinema facilities within Kensington and
Chelsea.
Theatres
4.16 The main theatres in Kensington and Chelsea including the Chelsea Theatre,
Finborough Theatre, Gate Theatre and 20th Century Theatre. Accessibility to
theatres within Central London will have an impact on the likely demand for
theatre facilities in Kensington and Chelsea. If proposals emerge for new
theatres then these proposals could help to claw back theatre trips currently
attracted to Central London, or alternatively attract tourist visitors to Kensington
and Chelsea.
Health and Fitness Clubs
4.17 The UK health club market has expanded rapidly as public awareness about
personal fitness has increased. The value of the UK fitness market is now
around £4 billion. Private health clubs in the UK range from small independent
clubs to large operators such as Cannons, David Lloyd, Esporta, Fitness First,
Virgin Active, Bannatyne and LA Fitness. Public sector sports centres are also
important, and the market has increased significantly over the last 10 years.
4.18 The Sport England/Active Places data indicates there are 27 health and fitness
suites in the Borough, of which 5 are for private use only. These private uses
facilities are relatively small, with 96 fitness stations in total. There are 10
suites open to the general public with 478 fitness stations as shown below.
4.19 Kensington and Chelsea’s population is 156,000 in 2016, and the GLA’s
projections (2014 round ward projections) suggest population will grow to
167,000 by 2028. Kensington and Chelsea currently has 9.2 fitness stations
per 1,000 people (1,442 stations in total).
4.20 Greater London has 1,049 Sport England registered health and fitness suites
with 56,387 fitness stations (average of 53 stations per suite). This existing
provision equates to 6.4 fitness stations per 1,000 people in London.
4.21 If Kensington and Chelsea had the same provision per head of population as
the London average then the number of fitness stations would be only 1,003,
which implies an existing over-supply of 439 stations. This apparent over-
supply may be due in part a net in-commuting into the Borough.
Kensington and Chelsea : Retail and Leisure Needs Study Update
P14 10776597v2
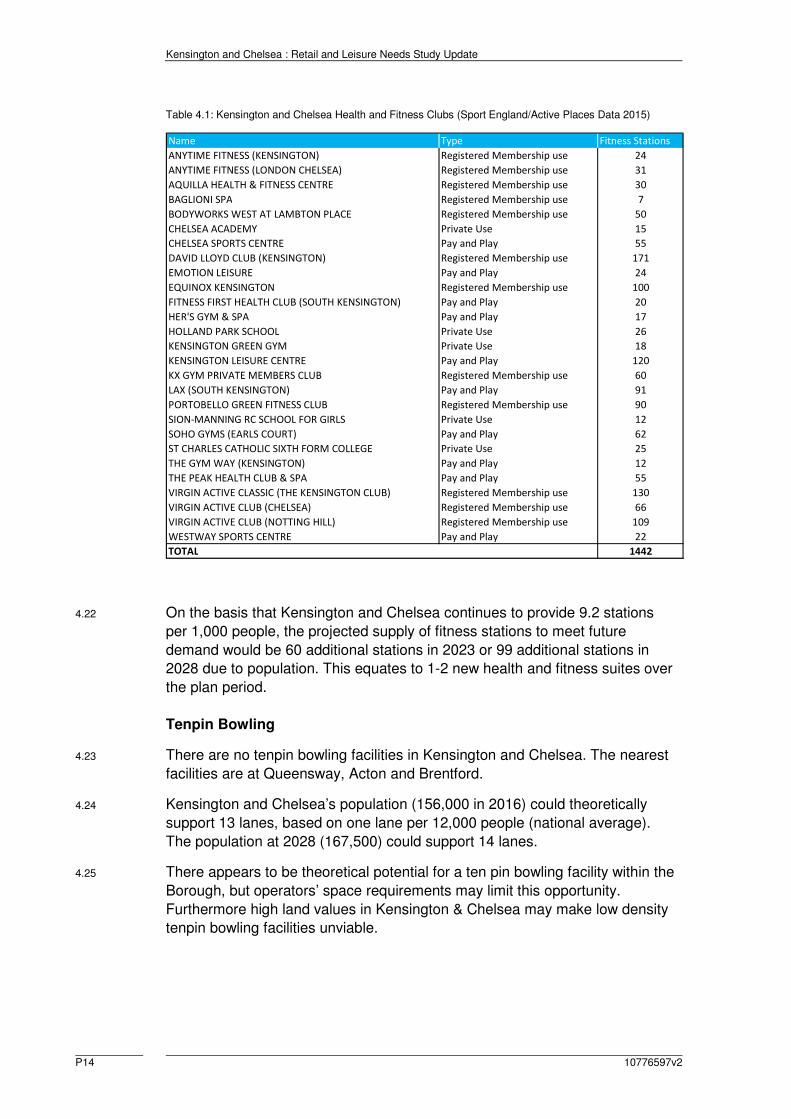
Table 4.1: Kensington and Chelsea Health and Fitness Clubs (Sport England/Active Places Data 2015)
4.22 On the basis that Kensington and Chelsea continues to provide 9.2 stations
per 1,000 people, the projected supply of fitness stations to meet future
demand would be 60 additional stations in 2023 or 99 additional stations in
2028 due to population. This equates to 1-2 new health and fitness suites over
the plan period.
Tenpin Bowling
4.23 There are no tenpin bowling facilities in Kensington and Chelsea. The nearest
facilities are at Queensway, Acton and Brentford.
4.24 Kensington and Chelsea’s population (156,000 in 2016) could theoretically
support 13 lanes, based on one lane per 12,000 people (national average).
The population at 2028 (167,500) could support 14 lanes.
4.25 There appears to be theoretical potential for a ten pin bowling facility within the
Borough, but operators’ space requirements may limit this opportunity.
Furthermore high land values in Kensington & Chelsea may make low density
tenpin bowling facilities unviable.
Name Type Fitness Stations
ANYTIME FITNESS (KENSINGTON) Registered Membership use 24
ANYTIME FITNESS (LONDON CHELSEA) Registered Membership use 31
AQUILLA HEALTH & FITNESS CENTRE Registered Membership use 30
BAGLIONI SPA Registered Membership use 7
BODYWORKS WEST AT LAMBTON PLACE Registered Membership use 50
CHELSEA ACADEMY Private Use 15
CHELSEA SPORTS CENTRE Pay and Play 55
DAVID LLOYD CLUB (KENSINGTON) Registered Membership use 171
EMOTION LEISURE Pay and Play 24
EQUINOX KENSINGTON Registered Membership use 100
FITNESS FIRST HEALTH CLUB (SOUTH KENSINGTON) Pay and Play 20
HER'S GYM & SPA Pay and Play 17
HOLLAND PARK SCHOOL Private Use 26
KENSINGTON GREEN GYM Private Use 18
KENSINGTON LEISURE CENTRE Pay and Play 120
KX GYM PRIVATE MEMBERS CLUB Registered Membership use 60
LAX (SOUTH KENSINGTON) Pay and Play 91
PORTOBELLO GREEN FITNESS CLUB Registered Membership use 90
SION-MANNING RC SCHOOL FOR GIRLS Private Use 12
SOHO GYMS (EARLS COURT) Pay and Play 62
ST CHARLES CATHOLIC SIXTH FORM COLLEGE Private Use 25
THE GYM WAY (KENSINGTON) Pay and Play 12
THE PEAK HEALTH CLUB & SPA Pay and Play 55
VIRGIN ACTIVE CLASSIC (THE KENSINGTON CLUB) Registered Membership use 130
VIRGIN ACTIVE CLUB (CHELSEA) Registered Membership use 66
VIRGIN ACTIVE CLUB (NOTTING HILL) Registered Membership use 109
WESTWAY SPORTS CENTRE Pay and Play 22
TOTAL 1442
Kensington and Chelsea : Retail and Leisure Needs Study Update
10776597v2 P15
Nightclubs/Live Music Venues
4.26 The value of the nightclub market is around £2 billion in 2014 with around
7,000 businesses (source: IBIS World), about one per 8,500 people.
Legislation that has extended licensing hours for other drinking establishments
and banned smoking indoors in public buildings has removed the industry's
main competitive advantage over pubs or bars. Nightclubs have also come
under pressure from the economic downturn.
4.27 The provision of nightclubs in Central London will limit the potential for major
new nightclubs in the Borough but small or medium nightclub facilities may be
viable.
Bingo
4.28 Mecca and Gala are the main bingo operators, controlling over half of the UK
market. Marketing of the bingo sector has been more proactive in recent years
and Gala and Mecca have invested in premises, moving out of dated premises
(i.e. converted cinemas) into purpose built units. Bingo clubs have become
increasingly sophisticated, and have actively sought to attract all age groups.
The bingo sector usually prefers central locations that are accessible by public
transport and by foot. Major bingo operators require buildings of between 2,000
- 3,000 sq.m, capable of seating up to 2,000 people, with a catchment
population of 50,000 to 70,000 within freestanding towns (source: BISL).
4.29 There are no major bingo facilities in Kensington and Chelsea. The adult (over
18) population of Kensington and Chelsea (approximately 129,000 in 2016)
could generate about 180,000 admissions based on the national participation
rate (1.4 trips per adult). Based on national average figures (133,000
admissions per club), the population of Kensington and Chelsea could support
one bingo hall.
4.30 There are currently no bingo clubs in the Borough and there is theoretical
scope for these types of facilities in the Borough. However the lack of available
sites or large premises and high land values/property prices may limit potential
in Kensington & Chelsea.
Kensington and Chelsea : Retail and Leisure Needs Study Update
P16 10776597v2
5.0 Accommodating Future Growth
5.1 The sequential approach suggests that designated town centres should be the
first choice for retail and leisure development, which is supported by policies
within the London Plan. In Kensington & Chelsea the preferred location for
retail and leisure development needs to be carefully considered, particularly for
major development which may have an extensive catchment area. Major
development should be located within the International, Major and District
Centres, as suggested in the London Plan.
5.2 Some facilities will be needed to serve more localised catchment areas. Some
development will be more appropriate within local centres. All development
should be appropriate in terms of scale and nature to the centre in which it is
located.
5.3 The existing stock of premises may have a role to play in accommodating
projected growth. The capacity analysis in this report assumes that existing
retail floorspace can, on average, increase its turnover to sales floorspace
densities. A growth rate of 2% per annum is assumed for comparison
floorspace and 1% for food and beverage floorspace. In addition to the growth
in sales densities, vacant shops could help to accommodate future growth.
5.4 There were 201 vacant shop units within the main centres in Kensington and
Chelsea, a vacancy rate of about 8.8%, which is below the Goad national
average (11.8%). Vacant floorspace totals 25,770 sq.m gross. The number of
vacant units increased between 2008 to 2012 (157 to 2012).
5.5 Vacant premises should help to accommodate growth. For example, if the
current vacancy level fell from 8.8% to 5% (i.e. the target vacancy rate
envisaged in the RLNS 2008) then the reoccupation of 87 vacant properties
could be achieved. This reoccupied space could accommodate about 11,300
sq.m gross of commercial space. Based on existing vacancy levels, this
potential re-occupied space could be distributed as follows:
• Knightsbridge 4,900 sq.m gross;
• Kensington High Street 2,100 sq.m gross;
• Fulham Road (East/West) 1,500 sq.m gross;
• Portobello Road/Westbourne Grove 1,200 sq.m gross;
• King’s Road (East/West) 1,100 sq.m gross;
• Notting Hill Gate 500 sq.m gross.
5.6 If this reduction in vacant units can be achieved this would reduce the need for
new floorspace to be provided through development. The reoccupation of
vacant units will reduce the baseline Class A1 to A5 floorspace projection for
new development up to 2028 from 41,734 sq.m gross to 30,434 sq.m gross.
Kensington and Chelsea : Retail and Leisure Needs Study Update
10776597v2 P17
5.7 Vacant units could accommodate 74% of the retail floorspace projection up to
2023 (15,333 sq.m gross), and about 27% of the floorspace projection up to
2028 (41,734 sq.m gross).
5.8 These figures suggest that, in addition to the reoccupation of vacant
floorspace, major development sites may not be required to be implemented
until around 2022.
Potential Development Opportunities
5.9 A review of potential development sites was undertaken in the RLNS in 2008.
Sites in each centre were evaluated, in terms of their implications on the scope
and need for additional retail and leisure facilities in the Borough. In total 12
potential development sites were identified that could accommodate retail,
leisure or other town centre uses.
5.10 The RLNS 2008 indicated that many of the sites had constraints and their
availability for redevelopment was uncertain, with most of the sites in active
use. The sites most likely to deliver a significant net increase in retail, leisure or
other town use floorspace were:
• S1 – Chelsea Farmers Market (edge-of-centre – King’s Road East);
• S2 – The Clearings, Draycott Avenue (edge-of-centre - Fulham Road
East);
• S4 – Iranian Embassy (edge-of-centre – South Kensington);
• S5 – High Street Kensington Station (within centre – Kensington High
Street);
• S6 – Odeon Cinema/Post Office (edge-of-centre – Kensington High
Street);
• S7– LEB Depot, Victoria Gardens (edge-of-centre – Notting Hill Gate);
• S8 – Newcombe House (within centre – Notting Hill Gate);
• S9 – Telephone Exchange and TA Centre, Warwick Road (out-of-centre);
• S11 – Earl’s Court Exhibition Centre (edge-of-centre – Earl’s Court Road)
• S12 – Portobello Court Estate (edge-of-centre – Portobello Road).
5.11 The RLNS 2008 noted that if implemented the sites allocated for retail use in
the UDP/LDF at that time could deliver up to 9,000 sq.m gross of Class A use,
4,000 sq.m gross in the south part of the Borough and 5,000 sq.m gross in the
north/central part of the Borough.
5.12 If these opportunities are still available then they could accommodate about
22% of the floorspace projection up to 2028, and with reoccupied vacant
floorspace could accommodate nearly half of the floorspace projection.
Kensington and Chelsea : Retail and Leisure Needs Study Update
P18 10776597v2
6.0 Conclusions
6.1 This report provides an update of the Borough wide needs assessment for
retail and leisure development in Kensington and Chelsea and should be read
alongside the RLNS 2008. The conclusions of the analysis contained within
this study are summarised below.
Meeting Shopping and Leisure Needs
6.2 The NPPF states that local planning authorities should assess the quantitative
and qualitative needs for land or floorspace for retail and leisure development
over the plan period.
6.3 When planning for growth in their town centres, local planning authorities
should allocate a range of suitable sites to meet the scale and type of retail
development needed. It is important that the needs for retail and other main
town centre uses are met in full and not compromised by limited site
availability.
6.4 Long term forecasts beyond 2023 may be more susceptible to change, due to
unforeseen circumstances. Projected surplus expenditure beyond 2023 is
attributable to projected growth in spending per capita as well as population
growth. If the growth in expenditure is lower than that forecast then the scope
for additional space will reduce. Long term projections should be monitored
and kept under review. The implications of major developments surrounding
the Borough should also be monitored along with the affect proposals may
have on the demand for additional development in Kensington and Chelsea.
Class A Retail Floorspace Projections
6.5 The expenditure projections in this study take into account home shopping
made through non-retail businesses, because special forms of trading have
been excluded. The quantitative assessment of the potential capacity for new
retail floorspace suggests that there is scope for new retail development within
Kensington and Chelsea. The projections suggest new floorspace should be
distributed and phased as shown in Tables 6.1, 6.2 and 6.3 below.
Table 6.1: Comparison Goods Retail Floorspace Projections
Location Additional Retail Floorspace Sq.M Gross
2016-2018 2018-2023 2023-2028 Total 2016-2028
Main Centres South K&C 400 - 10,000 10,400
Main Centres Central K&C - - 8,900 8,900
Rest of K&C - 300 1,400 1,700
Total 400 300 20,300 21,000
Kensington and Chelsea : Retail and Leisure Needs Study Update
10776597v2 P19
Table 6.2: Convenience Goods Retail Floorspace Projections
Location Additional Retail Floorspace Sq.M Gross
2016-2018 2018-2023 2023-2028 Total 2016-2028
Main Centres 6,700 2,000 1,700 10,400
Local Centres 200 100 300 600
Total 6,900 2,100 2,000 11,000
Table 6.3: Food and Beverage (A3/A4/A5) Retail Floorspace Projections
Location Additional Retail Floorspace Sq.M Gross
2016-2018 2018-2023 2023-2028 Total 2016-2028
Main centres 1,600 3,500 3,200 8,300
Local Centres 300 600 500 1,400
Total 1,900 4,100 3,700 9,700
6.6 The revised retail capacity projections suggest there is scope for up to 41,700
sq.m gross Class A1 to A5 retail floorspace in Kensington & Chelsea Borough
as a whole by 2028, of which at least 11,300 sq.m gross could be
accommodated in vacant floorspace.
Commercial Leisure
6.7 Residents in Kensington and Chelsea have good access to a range of
commercial leisure and entertainment, including facilities in neighbouring
boroughs and Central London. Most of the key sectors are represented. The
Borough’s location close to the West End may limit the potential for further
commercial leisure and entertainment facilities. High land/property values in
the Borough may also make large format leisure uses commercially unviable
e.g. tenpin bowling and bingo clubs, despite the theoretical capacity for these
uses, unless they are part of a major mixed use development.
6.8 The existing cinema provision within and around the Borough suggests there is
limited potential for further cinema facilities up to 2028. There may be scope for
1-2 new health club facilities over the plan period due to population growth.

Kensington and Chelsea : Retail and Leisure Needs Study Update
10776597v2
Appendix 1 Study Area and Methodology
Kensington and Chelsea : Retail and Leisure Needs Study Update
10776597v2
Kensington and Chelsea : Retail and Leisure Needs Study Update
10776597v2
Retail Capacity Methodology and Data
This section highlights the methodology and key assumptions adopted within
the retail update. The update broadly adopts the approach within the
Kensington & Chelsea Retail and Leisure Needs Study 2008 (RLNS 2008).
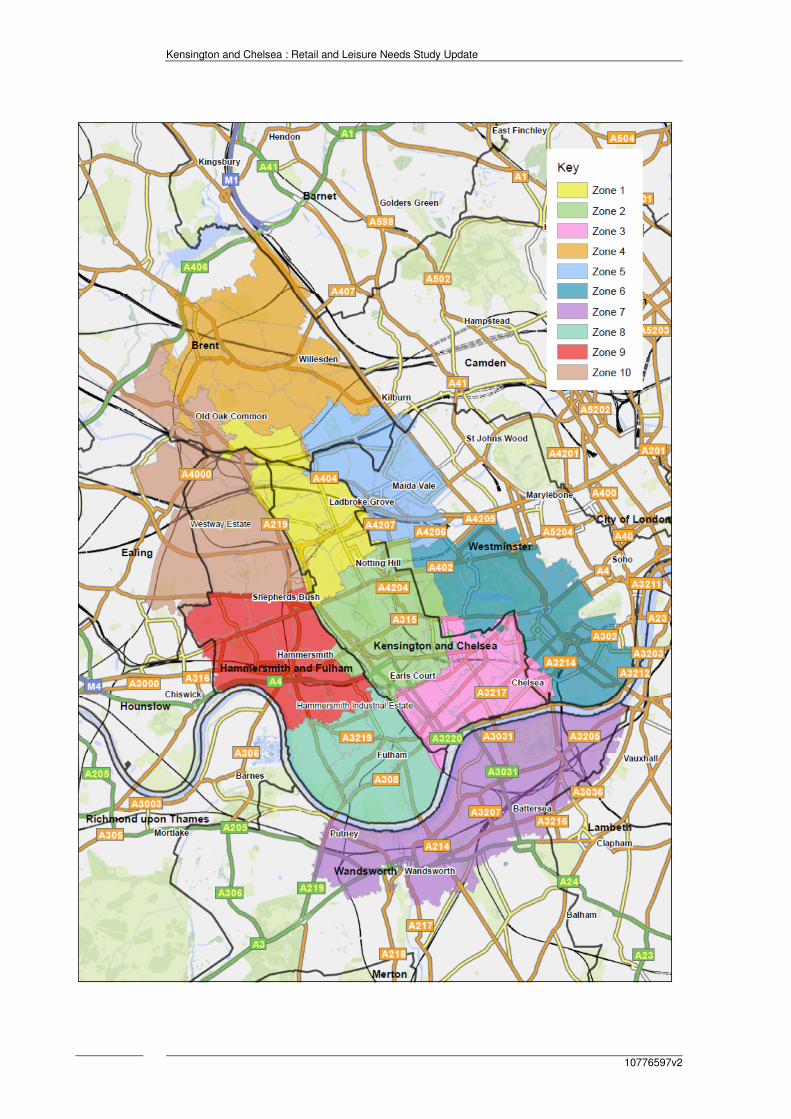
Study Area and Population
RLNS 2008 adopted a study area based on 10 sub-zones. The study includes
all parts of Kensington & Chelsea Borough and parts of neighbouring boroughs,
where the primary catchment areas of main centres extend beyond
administrative boundaries.
The RLNS 2008 adopted 2001 Census based population projections for the
postcode sector based zones. Population has been updated based on 2011
Census data and the GLA’s latest ward level population projections to 2028
(2014 round ward population projections – SHLAA based), as shown in Table 1
in Appendix 3.
The RLNS 2008 suggested the study area population would grow to around
726,000 in 2015. The revised projection for 2015 is now higher (+4.7%) at
around 760,000. The RLNS 2008 projected the study area population would
increase to about 756,000 in 2028. The revised projection for 2028 is about
844,000. Population growth is much higher due in part to major growth at
Vauxhall Nine Elms Battersea in Zone 7 in LB Wandsworth and potentially
growth at Earls Court in Zone 2.
Retail Expenditure Data
All monetary values expressed in this study are at 2014 prices, consistent with
Experian's base year expenditure figures for 2014 (Retail Planner Briefing Note
13, October 2015) which is the most up to date information available.
The level of available expenditure to support retailers is based on first
establishing per capita levels of spending for the study area population.
Experian's local consumer expenditure estimates for comparison and
convenience goods for each of the study area zones for the year 2014 have
been obtained.
Experian's EBS national expenditure information (Experian Retail Planner
Briefing Note 13) has been used to forecast expenditure within the study area.
Experian's forecasts are based on an econometric model of disaggregated
consumer spending. This model takes a number of macro-economic forecasts
(chiefly consumer spending, incomes and inflation) and uses them to produce
forecasts of consumer spending volumes, prices and value, broken down into
separate categories of goods. The model incorporates assumptions about
income and price elasticities.
Experian's EBS growth forecast rates for 2014 to 2017 reflect the current
economic circumstances and provide an appropriate growth rate for the short
term (for convenience goods: -0.2% for 2014 to 2015, +0.1% for 2015 to 2016
Kensington and Chelsea : Retail and Leisure Needs Study Update
10776597v2
and +0.3% for 2017; for comparison goods: +5.3% for 2014-2015, +3.2% for
2015-2016 and +2.9% for 2017.
In the longer term it is more difficult to forecast year on year changes in
expenditure. Experian's longer term growth average forecasts have been
adopted i.e. 0.1% per annum for convenience goods after 2016 and 3% per
annum growth for comparison goods. These growth rates are relatively cautious
when compared with past growth rates, but in our view represent realistic
forecast for future growth. These growth figures relate to real growth and
exclude inflation.
Special Forms of Trading (SFT) or non-store activity is included within
Experian's Goods Based Expenditure (GBE) estimates. SFT includes other
forms of retail expenditure not spent in shops e.g. mail order sales, some
internet sales, vending machines, party plan selling, market stalls and door to
door selling. SFT needs to be excluded from retail assessments because it
relates to expenditure not spent in shops and does not have a direct
relationship with the demand for retail floorspace. The growth in home
computing, internet connections and interactive TV may lead to a growth in
home shopping and may have effects on retailing in the high street. Experian
provides projections for special forms of trading and e-tailing. This Experian
information suggests that non-store retail sales in 2014 is:
• 8.3% of convenience goods expenditure; and
• 14.9% of comparison goods expenditure.
Experian predicts that these figures will increase in the future. However,
Experian recognises that not all of this SFT expenditure should be excluded
from a retail capacity analysis, because some of it relates to internet sales
through traditional retail businesses, rather than internet companies. The
turnover attributable to e-tail through retail businesses is included in the
company average turnovers, and therefore expenditure figures should not
exclude this expenditure. Experian has provided adjusted deductions for SFT
and projections. These projections have been used to exclude only e-tail
expenditure attributed to non-retail businesses, which will not directly impact on
the demand for retail floorspace. The adjusted figures suggest that SFT sales in
2014 are:
• 2.5% of convenience goods expenditure; and
• 11.2% of comparison goods expenditure.
The projections provided by Experian suggest that these percentages could
increase to 4.6% and 15.2% by 2022 respectively. In the longer term the growth
is predicted to fall or reverse slightly. The long term projections are 5.4% and
14.8% by 2028. These figures have been adopted in this assessment.
Home/electronic shopping has also emerged with the increasing growth in the
use of personal computers and the internet. This study makes an allowance for
future growth in e-tailing based on Experian projections. It will be necessary to
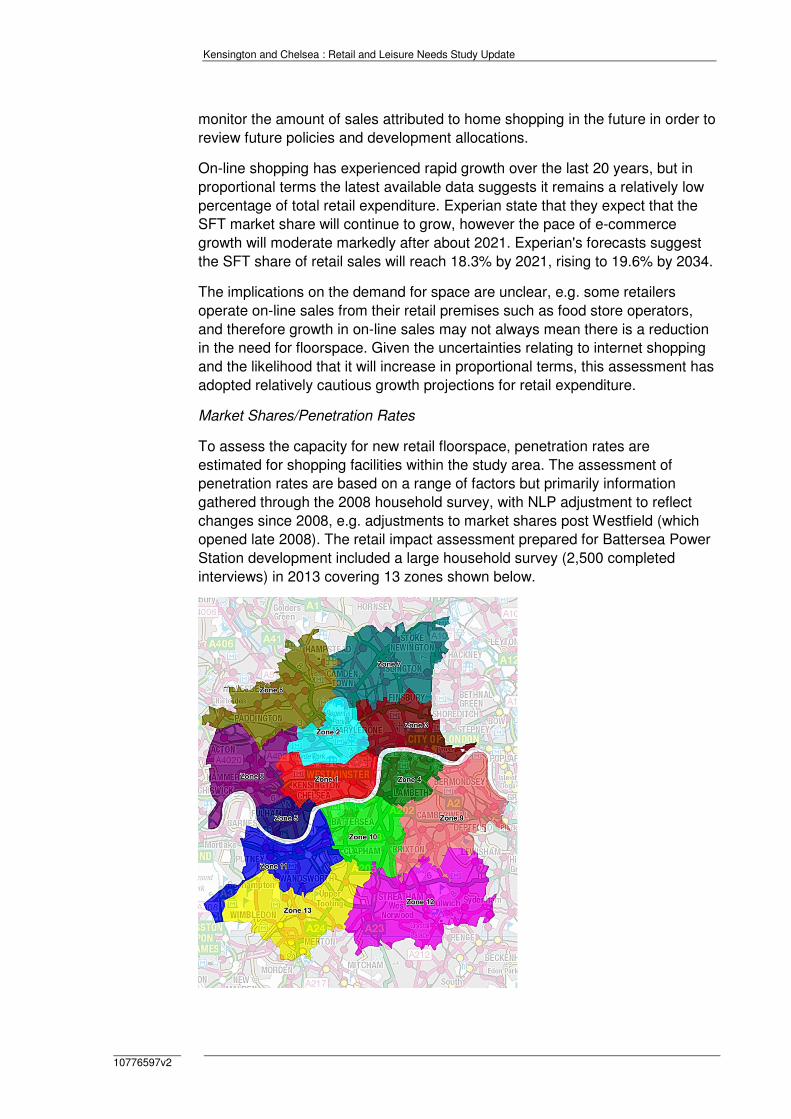
Kensington and Chelsea : Retail and Leisure Needs Study Update
10776597v2
monitor the amount of sales attributed to home shopping in the future in order to
review future policies and development allocations.
On-line shopping has experienced rapid growth over the last 20 years, but in
proportional terms the latest available data suggests it remains a relatively low
percentage of total retail expenditure. Experian state that they expect that the
SFT market share will continue to grow, however the pace of e-commerce
growth will moderate markedly after about 2021. Experian's forecasts suggest
the SFT share of retail sales will reach 18.3% by 2021, rising to 19.6% by 2034.
The implications on the demand for space are unclear, e.g. some retailers
operate on-line sales from their retail premises such as food store operators,
and therefore growth in on-line sales may not always mean there is a reduction
in the need for floorspace. Given the uncertainties relating to internet shopping
and the likelihood that it will increase in proportional terms, this assessment has
adopted relatively cautious growth projections for retail expenditure.
Market Shares/Penetration Rates
To assess the capacity for new retail floorspace, penetration rates are
estimated for shopping facilities within the study area. The assessment of
penetration rates are based on a range of factors but primarily information
gathered through the 2008 household survey, with NLP adjustment to reflect
changes since 2008, e.g. adjustments to market shares post Westfield (which
opened late 2008). The retail impact assessment prepared for Battersea Power
Station development included a large household survey (2,500 completed
interviews) in 2013 covering 13 zones shown below.
Kensington and Chelsea : Retail and Leisure Needs Study Update
10776597v2
This household extends beyond the study area adopted within the RLNS 2008
survey. Zones 1, 2, 5, 6 and 8 broadly cover the RLNS 2008 zones north of the
Thames and Zones 10 and 11 broadly cover the study area south of the
Thames.
The RLNS 2008 predicted comparison retail facilities within Kensington &
Chelsea would attract about 29% of total expenditure within the zones north of
the Thames at 2015 (£766 million at 2006 prices). The 2013 household survey
suggests a lower market share of around 24%. This suggests Westfield and
other development implemented between 2008 and 2013 have had a more
significant impact than that predicted in the RLNS 2008. The base year market
shares have been adjusted accordingly.
These results and also data from the Joint Fulham and Hammersmith study in
2010 provide a good basis for assessing how the K&C study area market
shares have changed post 2008. We will adjust the market shares within NLP’s
previous study accordingly in order to update the capacity projections.
For convenience goods shopping turnover estimates are then compared to
average company benchmark or average sales floorspace densities derived
from Mintel’s Retail Rankings and Food Store report November 2015, which
provide an indication of how individual retail stores and centres are performing
against expected turnover averages. This allows the identification of potential
surplus or deficit capacity for retail sales floorspace.
Benchmark Turnover Levels
Company average turnover to sales floorspace densities are available for major
food store operators and are compiled by Mintel. Company average sales
densities (adjusted to exclude petrol and comparison sales and include VAT)
have been applied to the sales area of the large food stores, and a benchmark
turnover for each store has been calculated. This benchmark turnover is not
necessarily the actual turnover of the food store, but it does provide a useful
benchmark for assessing existing shopping patterns and the adequacy of
current floorspace in quantitative terms.
The estimated convenience goods sales areas have been derived from a
combination of the Institute of Oxford Retail Consultants (ORC) StorePoint
database, GOAD plans, Valuation Office data and NLP estimates based on site
visits. Estimates for comparison sales floorspace within large food stores has
been deducted, for consistency with the use of goods based expenditure
figures.
Average sales densities are not widely available for small convenience shops,
particularly independent retailers. Based on the mix of shops present in each
centre within Kensington & Chelsea and NLP’s experience of trading levels of
small independent shops informed by household shopper surveys across
London, we have adopted an average sales density of £8,000 per sq.m net for
convenience shops/stores in the study area at 2014 prices. The total
Kensington and Chelsea : Retail and Leisure Needs Study Update
10776597v2
benchmark turnover of identified convenience sales floorspace within
Kensington & Chelsea is £500 million (Tables 10 Appendix 3).
Mintel's Retail Rankings provides limited company average sales density
information for a selection of national comparison retailers. Based on NLP’s
experience the average sales density for high street comparison retailers
usually ranges between £5,000 to £8,000 per sq.m net.


Kensington and Chelsea : Retail and Leisure Needs Study Update
10776597v2
Appendix 2 Goad Plan Update Summary
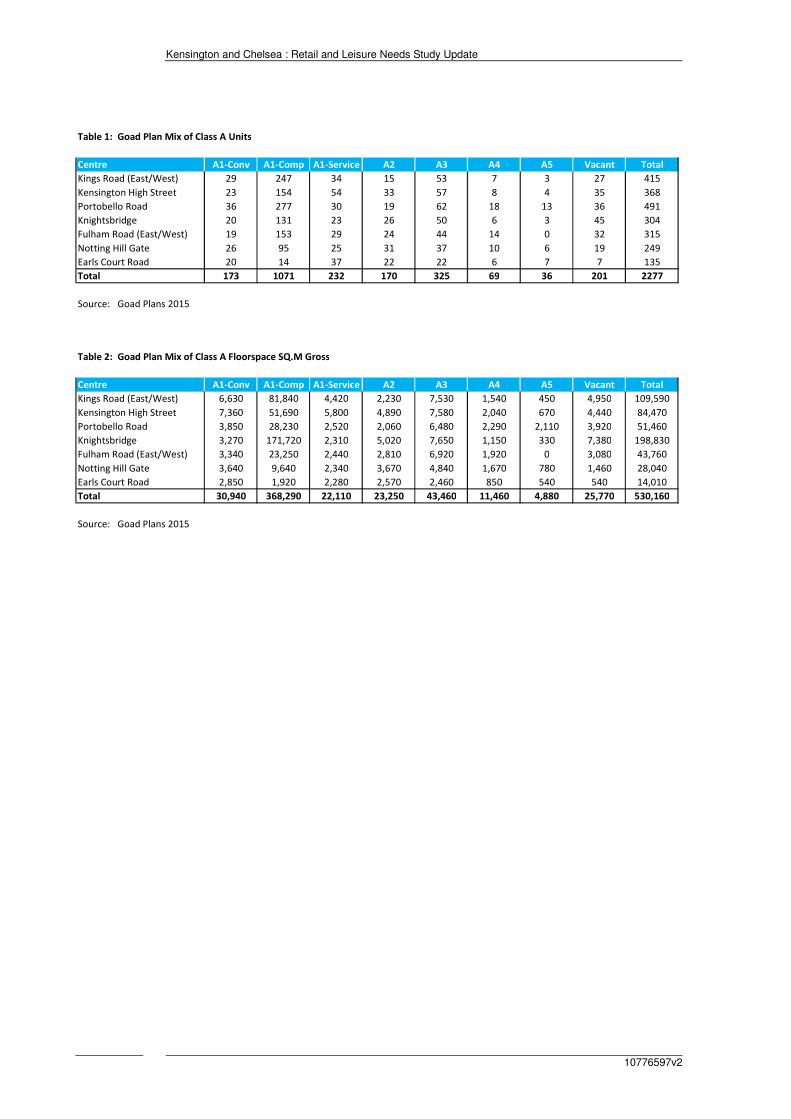
Kensington and Chelsea : Retail and Leisure Needs Study Update
10776597v2
Table 1: Goad Plan Mix of Class A Units
Centre A1-Conv A1-Comp A1-Service A2 A3 A4 A5 Vacant Total
Kings Road (East/West) 29 247 34 15 53 7 3 27 415
Kensington High Street 23 154 54 33 57 8 4 35 368
Portobello Road 36 277 30 19 62 18 13 36 491
Knightsbridge 20 131 23 26 50 6 3 45 304
Fulham Road (East/West) 19 153 29 24 44 14 0 32 315
Notting Hill Gate 26 95 25 31 37 10 6 19 249
Earls Court Road 20 14 37 22 22 6 7 7 135
Total 173 1071 232 170 325 69 36 201 2277
Source: Goad Plans 2015
Table 2: Goad Plan Mix of Class A Floorspace SQ.M Gross
Centre A1-Conv A1-Comp A1-Service A2 A3 A4 A5 Vacant Total
Kings Road (East/West) 6,630 81,840 4,420 2,230 7,530 1,540 450 4,950 109,590
Kensington High Street 7,360 51,690 5,800 4,890 7,580 2,040 670 4,440 84,470
Portobello Road 3,850 28,230 2,520 2,060 6,480 2,290 2,110 3,920 51,460
Knightsbridge 3,270 171,720 2,310 5,020 7,650 1,150 330 7,380 198,830
Fulham Road (East/West) 3,340 23,250 2,440 2,810 6,920 1,920 0 3,080 43,760
Notting Hill Gate 3,640 9,640 2,340 3,670 4,840 1,670 780 1,460 28,040
Earls Court Road 2,850 1,920 2,280 2,570 2,460 850 540 540 14,010
Total 30,940 368,290 22,110 23,250 43,460 11,460 4,880 25,770 530,160
Source: Goad Plans 2015
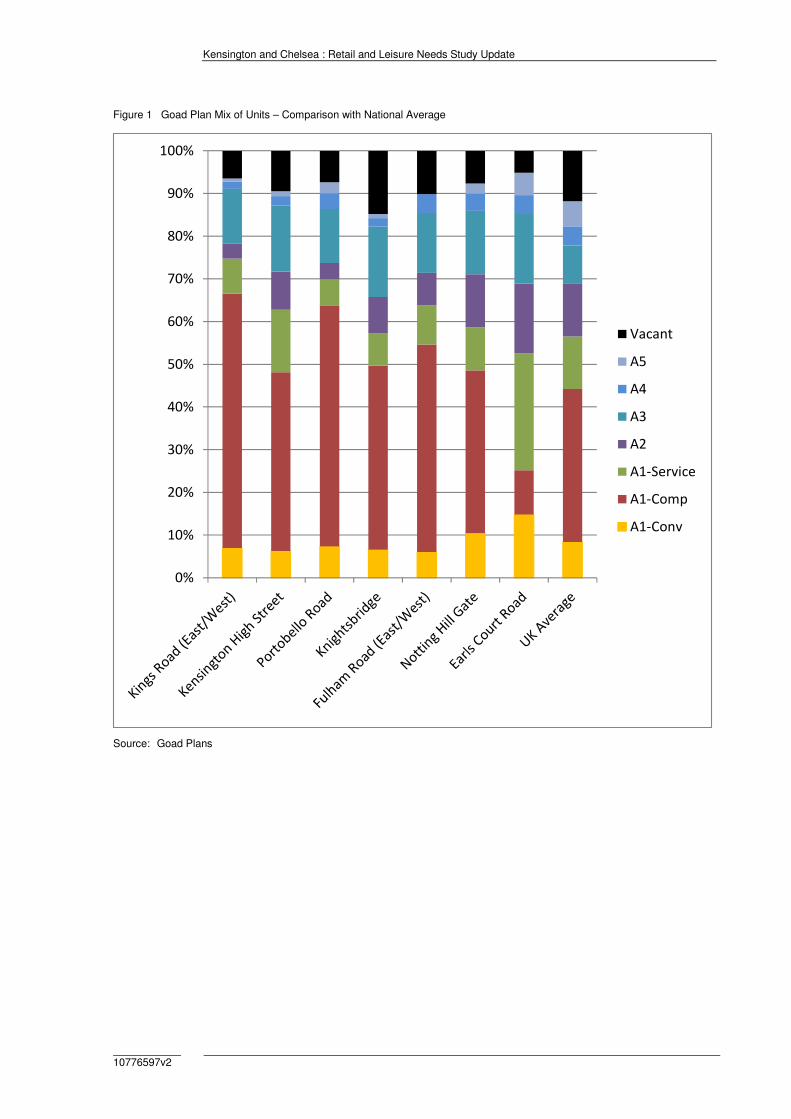
Kensington and Chelsea : Retail and Leisure Needs Study Update
10776597v2
Figure 1 Goad Plan Mix of Units – Comparison with National Average
Source: Goad Plans
0%
10%
20%
30%
40%
50%
60%
70%
80%
90%
100%
Vacant
A5
A4
A3
A2
A1-Service
A1-Comp
A1-Conv

Kensington and Chelsea : Retail and Leisure Needs Study Update
10776597v2
Appendix 3 Convenience Goods Assessment
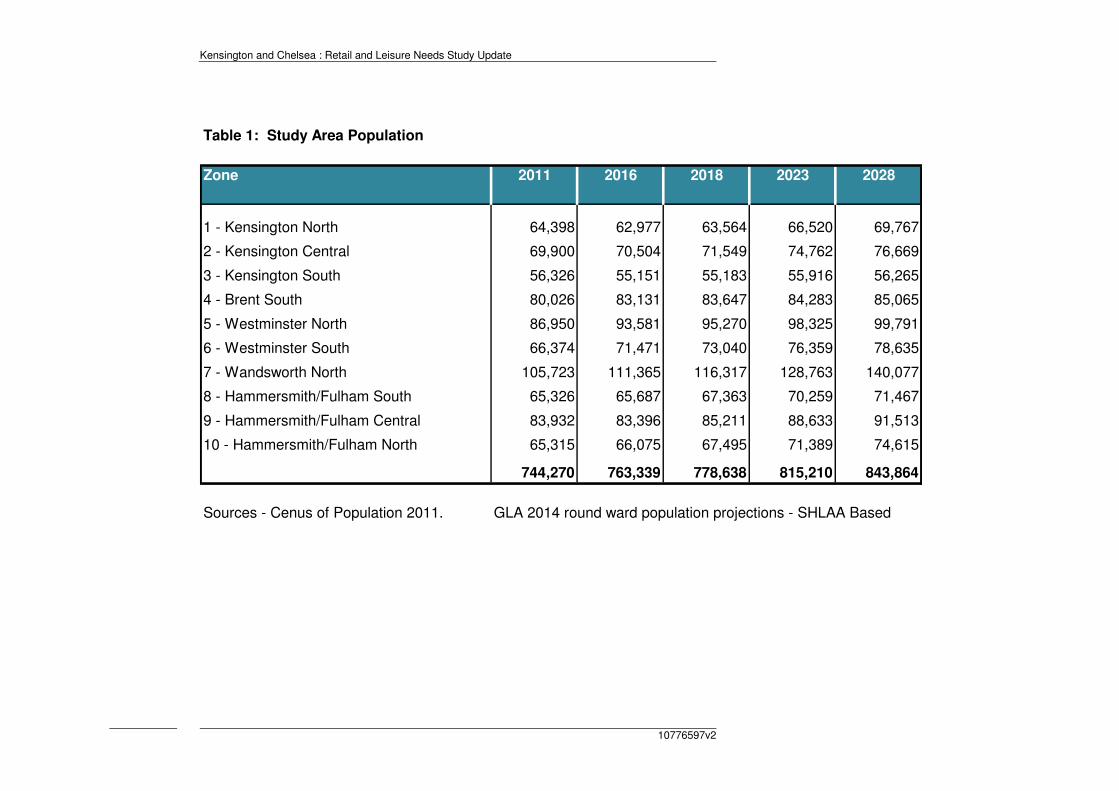
Kensington and Chelsea : Retail and Leisure Needs Study Update
10776597v2
Table 1: Study Area Population
Zone 2011 2016 2018 2023 2028
1 - Kensington North 64,398 62,977 63,564 66,520 69,767
2 - Kensington Central 69,900 70,504 71,549 74,762 76,669
3 - Kensington South 56,326 55,151 55,183 55,916 56,265
4 - Brent South 80,026 83,131 83,647 84,283 85,065
5 - Westminster North 86,950 93,581 95,270 98,325 99,791
6 - Westminster South 66,374 71,471 73,040 76,359 78,635
7 - Wandsworth North 105,723 111,365 116,317 128,763 140,077
8 - Hammersmith/Fulham South 65,326 65,687 67,363 70,259 71,467
9 - Hammersmith/Fulham Central 83,932 83,396 85,211 88,633 91,513
10 - Hammersmith/Fulham North 65,315 66,075 67,495 71,389 74,615
744,270 763,339 778,638 815,210 843,864
Sources - Cenus of Population 2011. GLA 2014 round ward population projections - SHLAA Based
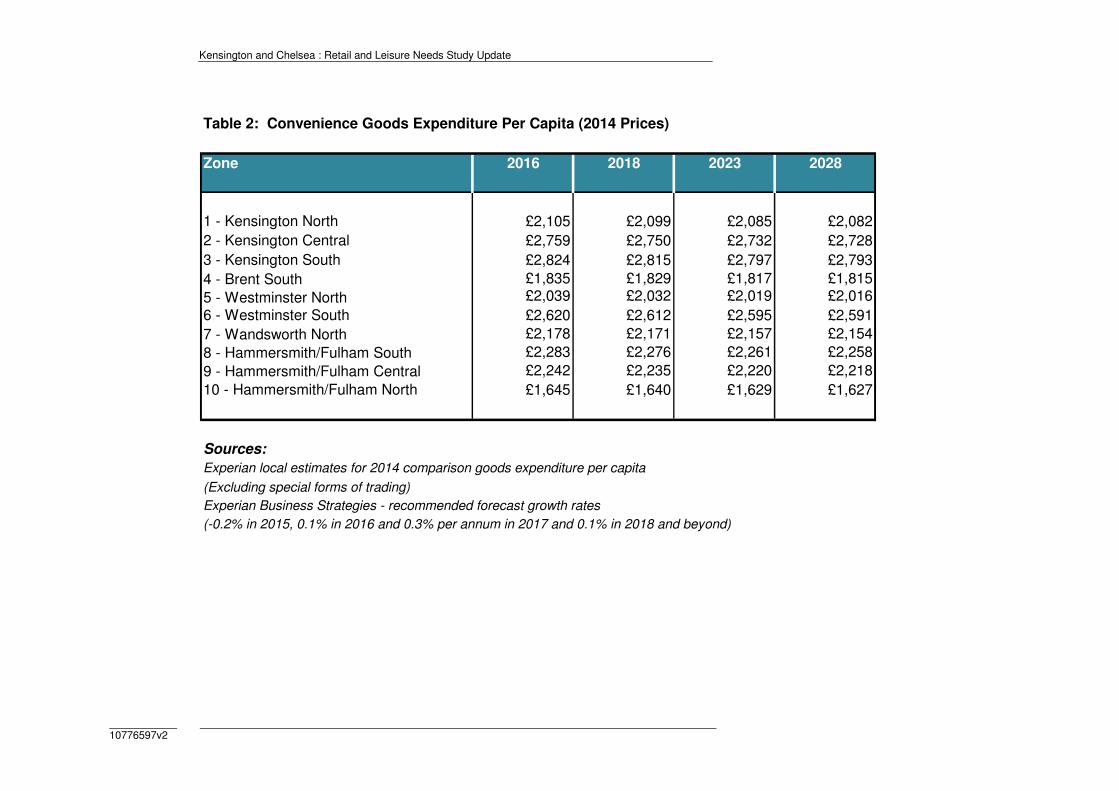
Kensington and Chelsea : Retail and Leisure Needs Study Update
10776597v2
Table 2: Convenience Goods Expenditure Per Capita (2014 Prices)
Zone 2016 2018 2023 2028
1 - Kensington North £2,105 £2,099 £2,085 £2,082
2 - Kensington Central £2,759 £2,750 £2,732 £2,728
3 - Kensington South £2,824 £2,815 £2,797 £2,793
4 - Brent South £1,835 £1,829 £1,817 £1,815
5 - Westminster North £2,039 £2,032 £2,019 £2,016
6 - Westminster South £2,620 £2,612 £2,595 £2,591
7 - Wandsworth North £2,178 £2,171 £2,157 £2,154
8 - Hammersmith/Fulham South £2,283 £2,276 £2,261 £2,258
9 - Hammersmith/Fulham Central £2,242 £2,235 £2,220 £2,218
10 - Hammersmith/Fulham North £1,645 £1,640 £1,629 £1,627
Sources:
Experian local estimates for 2014 comparison goods expenditure per capita
(Excluding special forms of trading)
Experian Business Strategies - recommended forecast growth rates
(-0.2% in 2015, 0.1% in 2016 and 0.3% per annum in 2017 and 0.1% in 2018 and beyond)
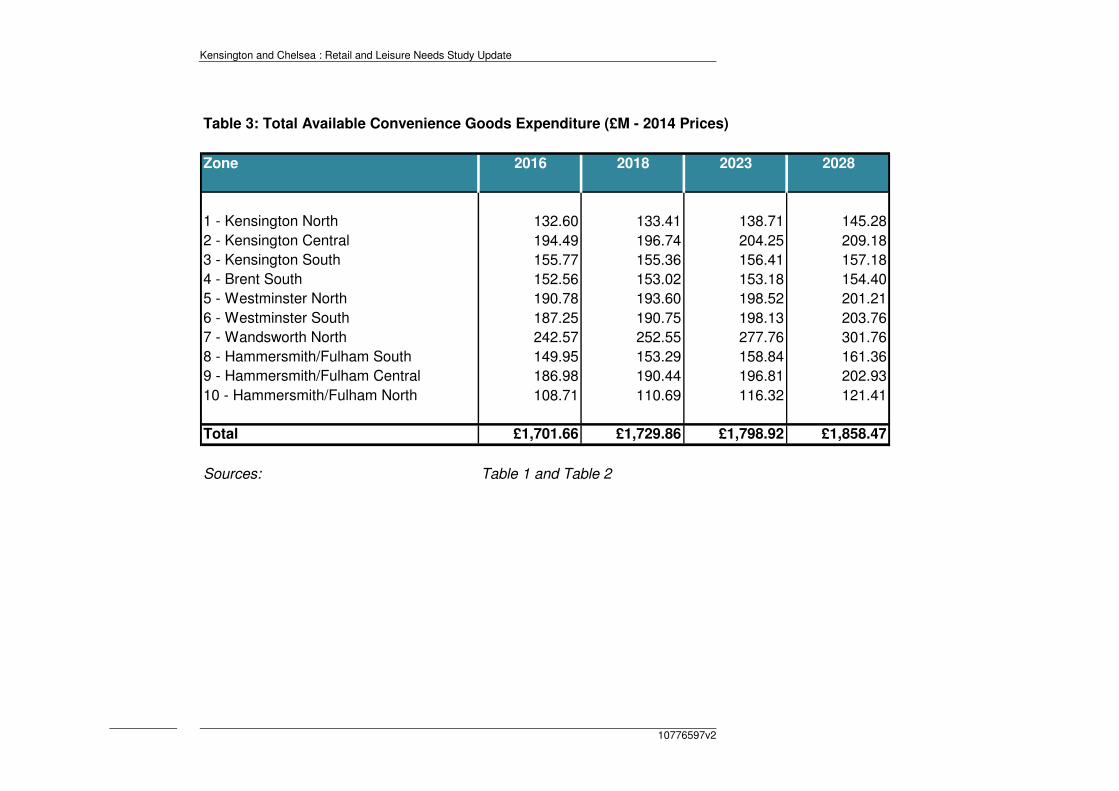
Kensington and Chelsea : Retail and Leisure Needs Study Update
10776597v2
Table 3: Total Available Convenience Goods Expenditure (£M - 2014 Prices)
Zone 2016 2018 2023 2028
1 - Kensington North 132.60 133.41 138.71 145.28
2 - Kensington Central 194.49 196.74 204.25 209.18
3 - Kensington South 155.77 155.36 156.41 157.18
4 - Brent South 152.56 153.02 153.18 154.40
5 - Westminster North 190.78 193.60 198.52 201.21
6 - Westminster South 187.25 190.75 198.13 203.76
7 - Wandsworth North 242.57 252.55 277.76 301.76
8 - Hammersmith/Fulham South 149.95 153.29 158.84 161.36
9 - Hammersmith/Fulham Central 186.98 190.44 196.81 202.93
10 - Hammersmith/Fulham North 108.71 110.69 116.32 121.41
Total £1,701.66 £1,729.86 £1,798.92 £1,858.47
Sources: Table 1 and Table 2
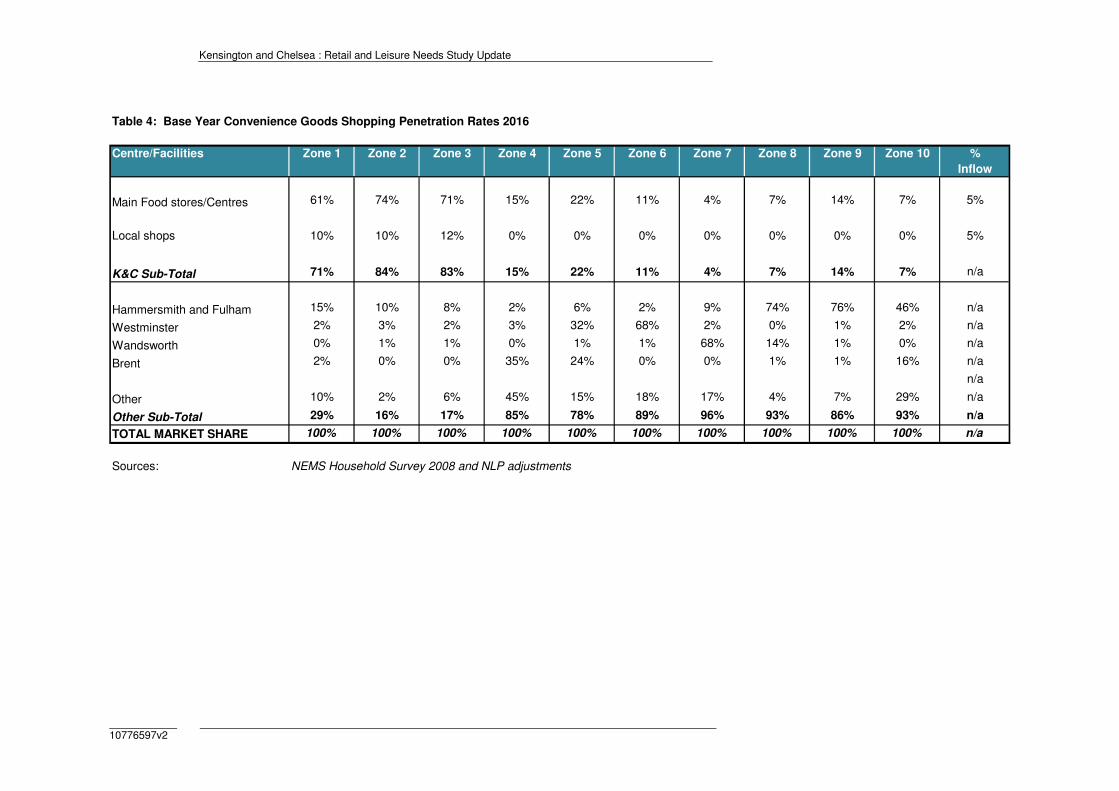
Kensington and Chelsea : Retail and Leisure Needs Study Update
10776597v2
Table 4: Base Year Convenience Goods Shopping Penetration Rates 2016
Centre/Facilities Zone 1 Zone 2 Zone 3 Zone 4 Zone 5 Zone 6 Zone 7 Zone 8 Zone 9 Zone 10 %
Inflow
Main Food stores/Centres 61% 74% 71% 15% 22% 11% 4% 7% 14% 7% 5%
Local shops 10% 10% 12% 0% 0% 0% 0% 0% 0% 0% 5%
K&C Sub-Total 71% 84% 83% 15% 22% 11% 4% 7% 14% 7% n/a
Hammersmith and Fulham 15% 10% 8% 2% 6% 2% 9% 74% 76% 46% n/a
Westminster 2% 3% 2% 3% 32% 68% 2% 0% 1% 2% n/a
Wandsworth 0% 1% 1% 0% 1% 1% 68% 14% 1% 0% n/a
Brent 2% 0% 0% 35% 24% 0% 0% 1% 1% 16% n/a
n/a
Other 10% 2% 6% 45% 15% 18% 17% 4% 7% 29% n/a
Other Sub-Total 29% 16% 17% 85% 78% 89% 96% 93% 86% 93% n/a
TOTAL MARKET SHARE 100% 100% 100% 100% 100% 100% 100% 100% 100% 100% n/a
Sources: NEMS Household Survey 2008 and NLP adjustments
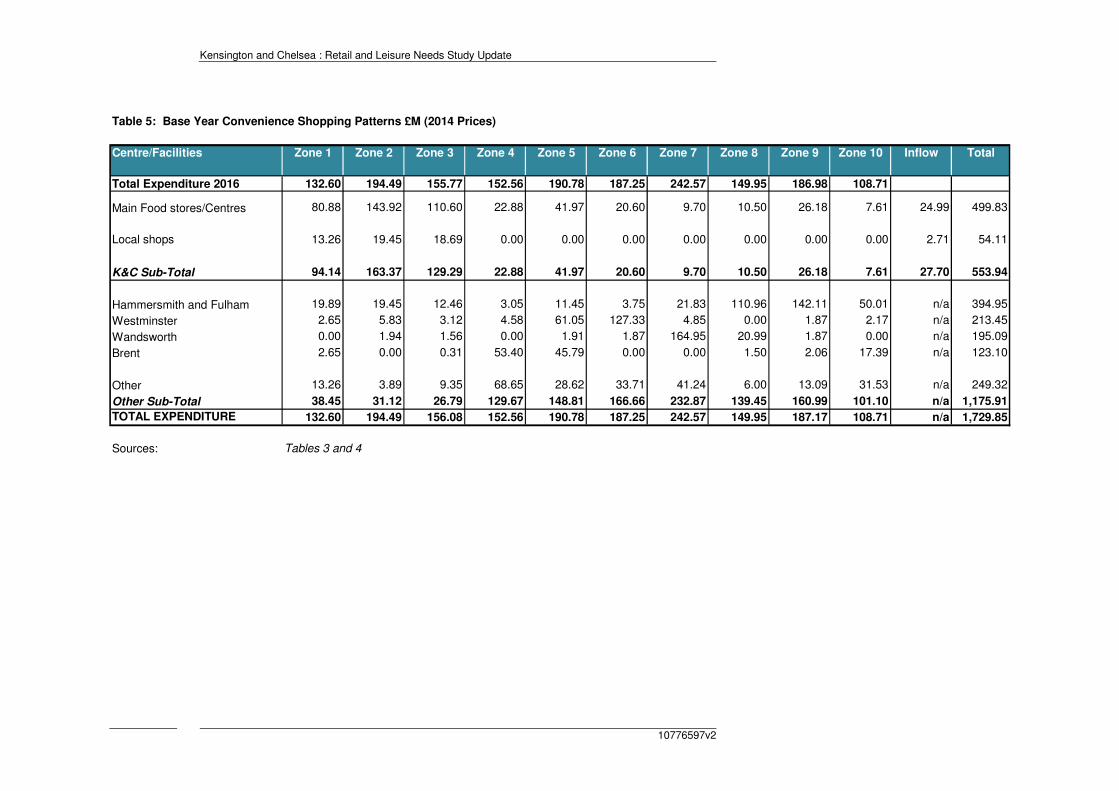
Kensington and Chelsea : Retail and Leisure Needs Study Update
10776597v2
Table 5: Base Year Convenience Shopping Patterns £M (2014 Prices)
Centre/Facilities Zone 1 Zone 2 Zone 3 Zone 4 Zone 5 Zone 6 Zone 7 Zone 8 Zone 9 Zone 10 Inflow Total
Total Expenditure 2016 132.60 194.49 155.77 152.56 190.78 187.25 242.57 149.95 186.98 108.71
Main Food stores/Centres 80.88 143.92 110.60 22.88 41.97 20.60 9.70 10.50 26.18 7.61 24.99 499.83
Local shops 13.26 19.45 18.69 0.00 0.00 0.00 0.00 0.00 0.00 0.00 2.71 54.11
K&C Sub-Total 94.14 163.37 129.29 22.88 41.97 20.60 9.70 10.50 26.18 7.61 27.70 553.94
Hammersmith and Fulham 19.89 19.45 12.46 3.05 11.45 3.75 21.83 110.96 142.11 50.01 n/a 394.95
Westminster 2.65 5.83 3.12 4.58 61.05 127.33 4.85 0.00 1.87 2.17 n/a 213.45
Wandsworth 0.00 1.94 1.56 0.00 1.91 1.87 164.95 20.99 1.87 0.00 n/a 195.09
Brent 2.65 0.00 0.31 53.40 45.79 0.00 0.00 1.50 2.06 17.39 n/a 123.10
Other 13.26 3.89 9.35 68.65 28.62 33.71 41.24 6.00 13.09 31.53 n/a 249.32
Other Sub-Total 38.45 31.12 26.79 129.67 148.81 166.66 232.87 139.45 160.99 101.10 n/a 1,175.91
TOTAL EXPENDITURE 132.60 194.49 156.08 152.56 190.78 187.25 242.57 149.95 187.17 108.71 n/a 1,729.85
Sources: Tables 3 and 4
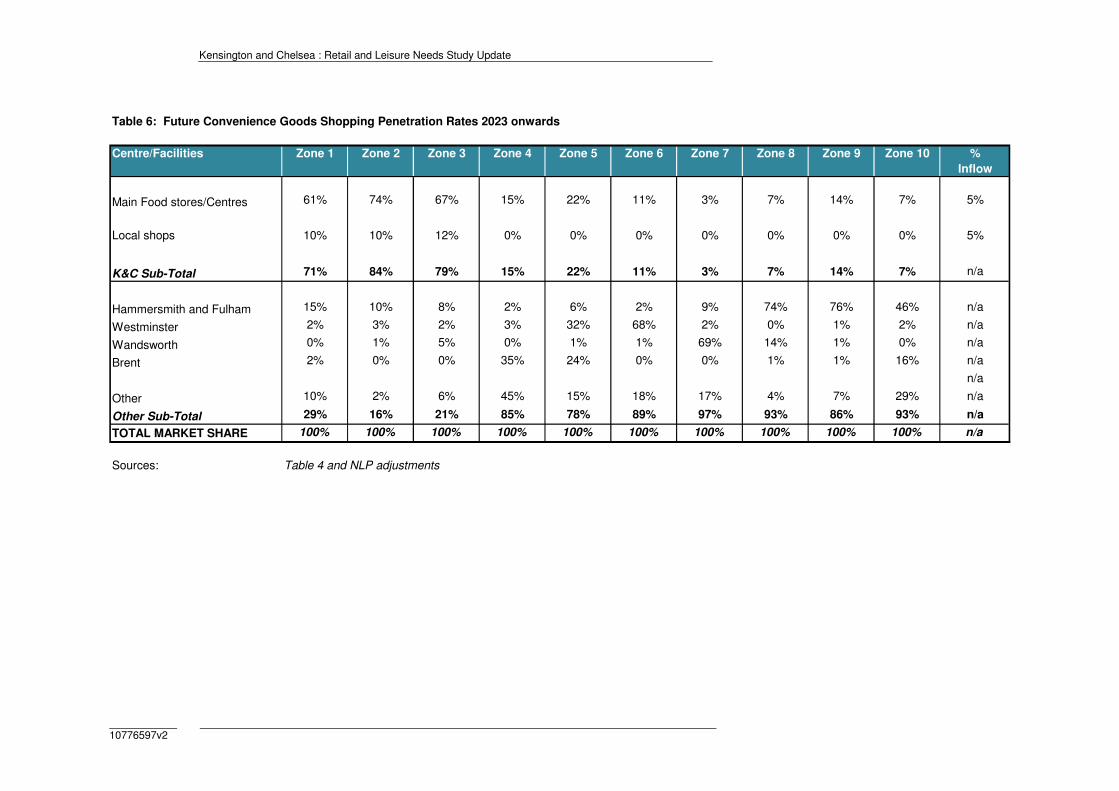
Kensington and Chelsea : Retail and Leisure Needs Study Update
10776597v2
Table 6: Future Convenience Goods Shopping Penetration Rates 2023 onwards
Centre/Facilities Zone 1 Zone 2 Zone 3 Zone 4 Zone 5 Zone 6 Zone 7 Zone 8 Zone 9 Zone 10 %
Inflow
Main Food stores/Centres 61% 74% 67% 15% 22% 11% 3% 7% 14% 7% 5%
Local shops 10% 10% 12% 0% 0% 0% 0% 0% 0% 0% 5%
K&C Sub-Total 71% 84% 79% 15% 22% 11% 3% 7% 14% 7% n/a
Hammersmith and Fulham 15% 10% 8% 2% 6% 2% 9% 74% 76% 46% n/a
Westminster 2% 3% 2% 3% 32% 68% 2% 0% 1% 2% n/a
Wandsworth 0% 1% 5% 0% 1% 1% 69% 14% 1% 0% n/a
Brent 2% 0% 0% 35% 24% 0% 0% 1% 1% 16% n/a
n/a
Other 10% 2% 6% 45% 15% 18% 17% 4% 7% 29% n/a
Other Sub-Total 29% 16% 21% 85% 78% 89% 97% 93% 86% 93% n/a
TOTAL MARKET SHARE 100% 100% 100% 100% 100% 100% 100% 100% 100% 100% n/a
Sources: Table 4 and NLP adjustments

Kensington and Chelsea : Retail and Leisure Needs Study Update
10776597v2
Table 7: Future 2018 Year Convenience Shopping Patterns £M (2014 Prices)
Centre/Facilities Zone 1 Zone 2 Zone 3 Zone 4 Zone 5 Zone 6 Zone 7 Zone 8 Zone 9 Zone 10 Inflow Total
Total Expenditure 2018 133.41 196.74 155.36 153.02 193.60 190.75 252.55 153.29 190.44 110.69
Main Food stores/Centres 81.38 145.59 104.09 22.95 42.59 20.98 7.58 10.73 26.66 7.75 24.75 495.06
Local shops 13.34 19.67 18.64 0.00 0.00 0.00 0.00 0.00 0.00 0.00 2.72 54.38
K&C Sub-Total 94.72 165.26 122.74 22.95 42.59 20.98 7.58 10.73 26.66 7.75 27.47 549.44
Hammersmith and Fulham 20.01 19.67 12.43 3.06 11.62 3.82 22.73 113.43 144.74 50.92 n/a 402.42
Westminster 2.67 5.90 3.11 4.59 61.95 129.71 5.05 0.00 1.90 2.21 n/a 217.10
Wandsworth 0.00 1.97 7.77 0.00 1.94 1.91 174.26 21.46 1.90 0.00 n/a 211.20
Brent 2.67 0.00 0.31 53.56 46.46 0.00 0.00 1.53 2.09 17.71 n/a 124.34
Other 13.34 3.93 9.32 68.86 29.04 34.34 42.93 6.13 13.33 32.10 n/a 253.33
Other Sub-Total 38.69 31.48 32.94 130.06 151.01 169.77 244.97 142.56 163.97 102.94 n/a 1,208.40
TOTAL EXPENDITURE 133.41 196.74 155.68 153.02 193.60 190.75 252.55 153.29 190.64 110.69 n/a 1,757.83
Sources: Tables 3 and 6
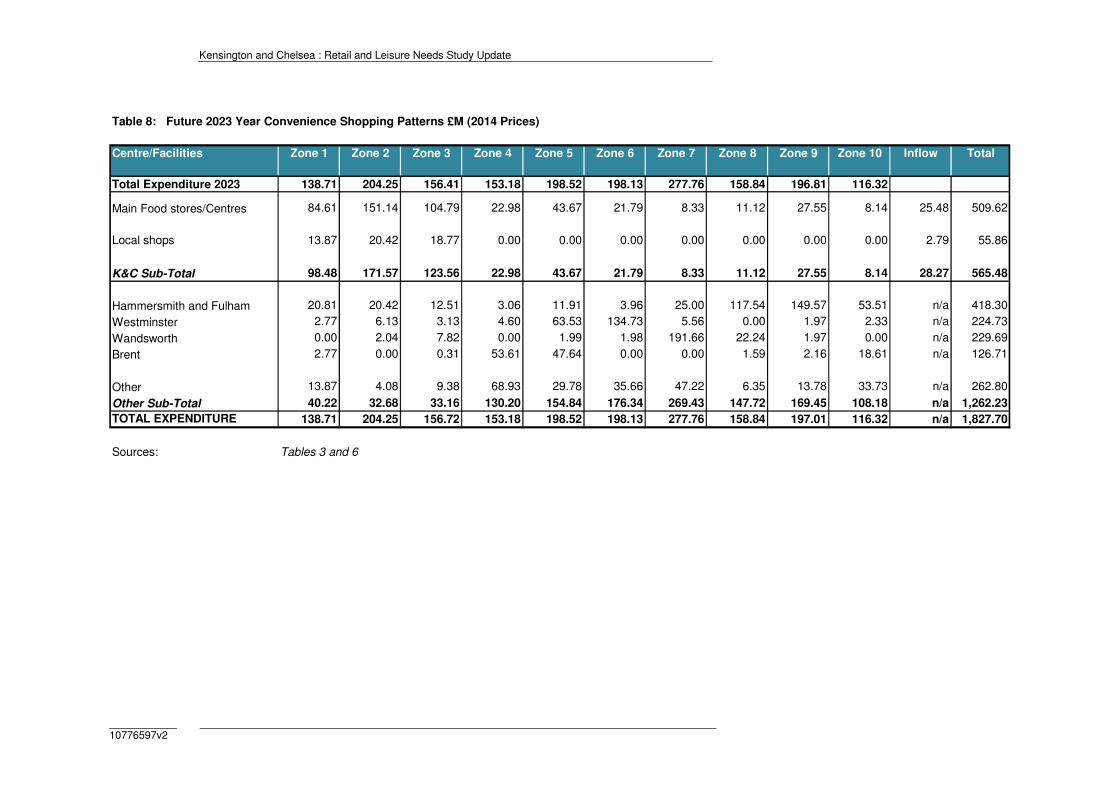
Kensington and Chelsea : Retail and Leisure Needs Study Update
10776597v2
Table 8: Future 2023 Year Convenience Shopping Patterns £M (2014 Prices)
Centre/Facilities Zone 1 Zone 2 Zone 3 Zone 4 Zone 5 Zone 6 Zone 7 Zone 8 Zone 9 Zone 10 Inflow Total
Total Expenditure 2023 138.71 204.25 156.41 153.18 198.52 198.13 277.76 158.84 196.81 116.32
Main Food stores/Centres 84.61 151.14 104.79 22.98 43.67 21.79 8.33 11.12 27.55 8.14 25.48 509.62
Local shops 13.87 20.42 18.77 0.00 0.00 0.00 0.00 0.00 0.00 0.00 2.79 55.86
K&C Sub-Total 98.48 171.57 123.56 22.98 43.67 21.79 8.33 11.12 27.55 8.14 28.27 565.48
Hammersmith and Fulham 20.81 20.42 12.51 3.06 11.91 3.96 25.00 117.54 149.57 53.51 n/a 418.30
Westminster 2.77 6.13 3.13 4.60 63.53 134.73 5.56 0.00 1.97 2.33 n/a 224.73
Wandsworth 0.00 2.04 7.82 0.00 1.99 1.98 191.66 22.24 1.97 0.00 n/a 229.69
Brent 2.77 0.00 0.31 53.61 47.64 0.00 0.00 1.59 2.16 18.61 n/a 126.71
Other 13.87 4.08 9.38 68.93 29.78 35.66 47.22 6.35 13.78 33.73 n/a 262.80
Other Sub-Total 40.22 32.68 33.16 130.20 154.84 176.34 269.43 147.72 169.45 108.18 n/a 1,262.23
TOTAL EXPENDITURE 138.71 204.25 156.72 153.18 198.52 198.13 277.76 158.84 197.01 116.32 n/a 1,827.70
Sources: Tables 3 and 6
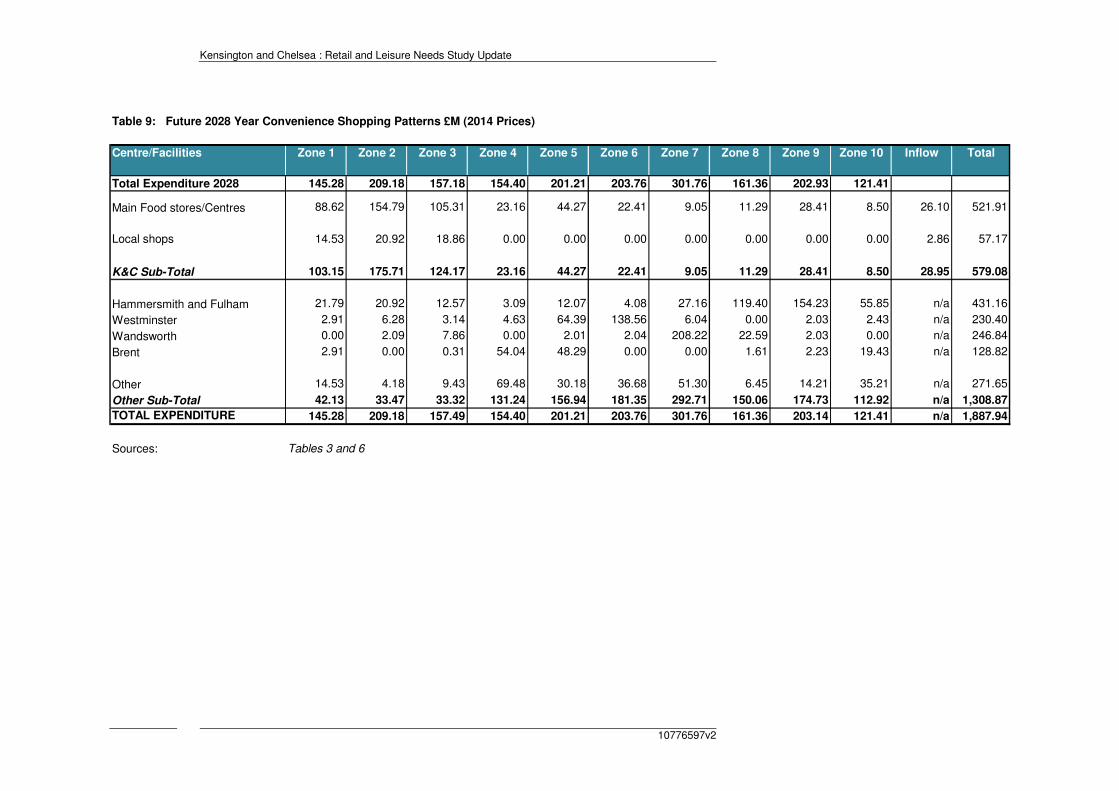
Kensington and Chelsea : Retail and Leisure Needs Study Update
10776597v2
Table 9: Future 2028 Year Convenience Shopping Patterns £M (2014 Prices)
Centre/Facilities Zone 1 Zone 2 Zone 3 Zone 4 Zone 5 Zone 6 Zone 7 Zone 8 Zone 9 Zone 10 Inflow Total
Total Expenditure 2028 145.28 209.18 157.18 154.40 201.21 203.76 301.76 161.36 202.93 121.41
Main Food stores/Centres 88.62 154.79 105.31 23.16 44.27 22.41 9.05 11.29 28.41 8.50 26.10 521.91
Local shops 14.53 20.92 18.86 0.00 0.00 0.00 0.00 0.00 0.00 0.00 2.86 57.17
K&C Sub-Total 103.15 175.71 124.17 23.16 44.27 22.41 9.05 11.29 28.41 8.50 28.95 579.08
Hammersmith and Fulham 21.79 20.92 12.57 3.09 12.07 4.08 27.16 119.40 154.23 55.85 n/a 431.16
Westminster 2.91 6.28 3.14 4.63 64.39 138.56 6.04 0.00 2.03 2.43 n/a 230.40
Wandsworth 0.00 2.09 7.86 0.00 2.01 2.04 208.22 22.59 2.03 0.00 n/a 246.84
Brent 2.91 0.00 0.31 54.04 48.29 0.00 0.00 1.61 2.23 19.43 n/a 128.82
Other 14.53 4.18 9.43 69.48 30.18 36.68 51.30 6.45 14.21 35.21 n/a 271.65
Other Sub-Total 42.13 33.47 33.32 131.24 156.94 181.35 292.71 150.06 174.73 112.92 n/a 1,308.87
TOTAL EXPENDITURE 145.28 209.18 157.49 154.40 201.21 203.76 301.76 161.36 203.14 121.41 n/a 1,887.94
Sources: Tables 3 and 6
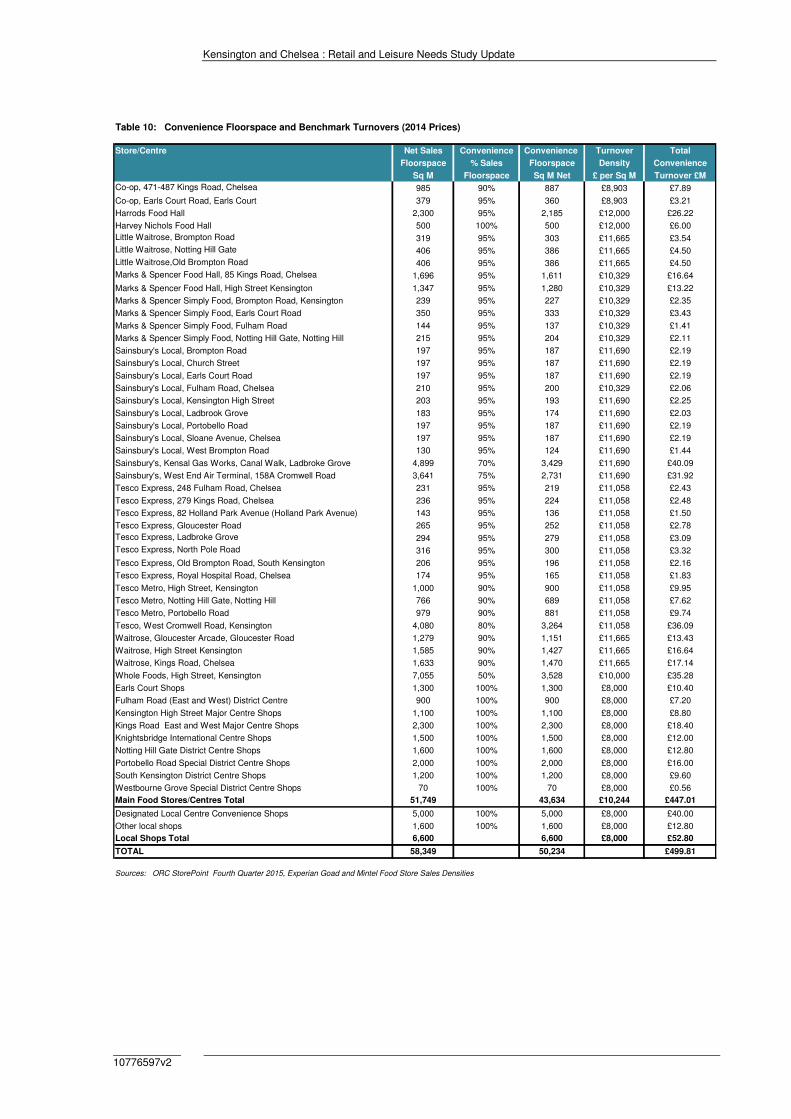
Kensington and Chelsea : Retail and Leisure Needs Study Update
10776597v2
Table 10: Convenience Floorspace and Benchmark Turnovers (2014 Prices)
Store/Centre Net Sales Convenience Convenience Turnover Total
Floorspace % Sales Floorspace Density Convenience
Sq M Floorspace Sq M Net £ per Sq M Turnover £M
Co-op, 471-487 Kings Road, Chelsea 985 90% 887 £8,903 £7.89
Co-op, Earls Court Road, Earls Court 379 95% 360 £8,903 £3.21
Harrods Food Hall 2,300 95% 2,185 £12,000 £26.22
Harvey Nichols Food Hall 500 100% 500 £12,000 £6.00
Little Waitrose, Brompton Road 319 95% 303 £11,665 £3.54
Little Waitrose, Notting Hill Gate 406 95% 386 £11,665 £4.50
Little Waitrose,Old Brompton Road 406 95% 386 £11,665 £4.50
Marks & Spencer Food Hall, 85 Kings Road, Chelsea 1,696 95% 1,611 £10,329 £16.64
Marks & Spencer Food Hall, High Street Kensington 1,347 95% 1,280 £10,329 £13.22
Marks & Spencer Simply Food, Brompton Road, Kensington 239 95% 227 £10,329 £2.35
Marks & Spencer Simply Food, Earls Court Road 350 95% 333 £10,329 £3.43
Marks & Spencer Simply Food, Fulham Road 144 95% 137 £10,329 £1.41
Marks & Spencer Simply Food, Notting Hill Gate, Notting Hill 215 95% 204 £10,329 £2.11
Sainsbury's Local, Brompton Road 197 95% 187 £11,690 £2.19
Sainsbury's Local, Church Street 197 95% 187 £11,690 £2.19
Sainsbury's Local, Earls Court Road 197 95% 187 £11,690 £2.19
Sainsbury's Local, Fulham Road, Chelsea 210 95% 200 £10,329 £2.06
Sainsbury's Local, Kensington High Street 203 95% 193 £11,690 £2.25
Sainsbury's Local, Ladbrook Grove 183 95% 174 £11,690 £2.03
Sainsbury's Local, Portobello Road 197 95% 187 £11,690 £2.19
Sainsbury's Local, Sloane Avenue, Chelsea 197 95% 187 £11,690 £2.19
Sainsbury's Local, West Brompton Road 130 95% 124 £11,690 £1.44
Sainsbury's, Kensal Gas Works, Canal Walk, Ladbroke Grove 4,899 70% 3,429 £11,690 £40.09
Sainsbury's, West End Air Terminal, 158A Cromwell Road 3,641 75% 2,731 £11,690 £31.92
Tesco Express, 248 Fulham Road, Chelsea 231 95% 219 £11,058 £2.43
Tesco Express, 279 Kings Road, Chelsea 236 95% 224 £11,058 £2.48
Tesco Express, 82 Holland Park Avenue (Holland Park Avenue) 143 95% 136 £11,058 £1.50
Tesco Express, Gloucester Road 265 95% 252 £11,058 £2.78
Tesco Express, Ladbroke Grove 294 95% 279 £11,058 £3.09
Tesco Express, North Pole Road 316 95% 300 £11,058 £3.32
Tesco Express, Old Brompton Road, South Kensington 206 95% 196 £11,058 £2.16
Tesco Express, Royal Hospital Road, Chelsea 174 95% 165 £11,058 £1.83
Tesco Metro, High Street, Kensington 1,000 90% 900 £11,058 £9.95
Tesco Metro, Notting Hill Gate, Notting Hill 766 90% 689 £11,058 £7.62
Tesco Metro, Portobello Road 979 90% 881 £11,058 £9.74
Tesco, West Cromwell Road, Kensington 4,080 80% 3,264 £11,058 £36.09
Waitrose, Gloucester Arcade, Gloucester Road 1,279 90% 1,151 £11,665 £13.43
Waitrose, High Street Kensington 1,585 90% 1,427 £11,665 £16.64
Waitrose, Kings Road, Chelsea 1,633 90% 1,470 £11,665 £17.14
Whole Foods, High Street, Kensington 7,055 50% 3,528 £10,000 £35.28
Earls Court Shops 1,300 100% 1,300 £8,000 £10.40
Fulham Road (East and West) District Centre 900 100% 900 £8,000 £7.20
Kensington High Street Major Centre Shops 1,100 100% 1,100 £8,000 £8.80
Kings Road East and West Major Centre Shops 2,300 100% 2,300 £8,000 £18.40
Knightsbridge International Centre Shops 1,500 100% 1,500 £8,000 £12.00
Notting Hill Gate District Centre Shops 1,600 100% 1,600 £8,000 £12.80
Portobello Road Special District Centre Shops 2,000 100% 2,000 £8,000 £16.00
South Kensington District Centre Shops 1,200 100% 1,200 £8,000 £9.60
Westbourne Grove Special District Centre Shops 70 100% 70 £8,000 £0.56
Main Food Stores/Centres Total 51,749 43,634 £10,244 £447.01
Designated Local Centre Convenience Shops 5,000 100% 5,000 £8,000 £40.00
Other local shops 1,600 100% 1,600 £8,000 £12.80
Local Shops Total 6,600 6,600 £8,000 £52.80
TOTAL 58,349 50,234 £499.81
Sources: ORC StorePoint Fourth Quarter 2015, Experian Goad and Mintel Food Store Sales Densities
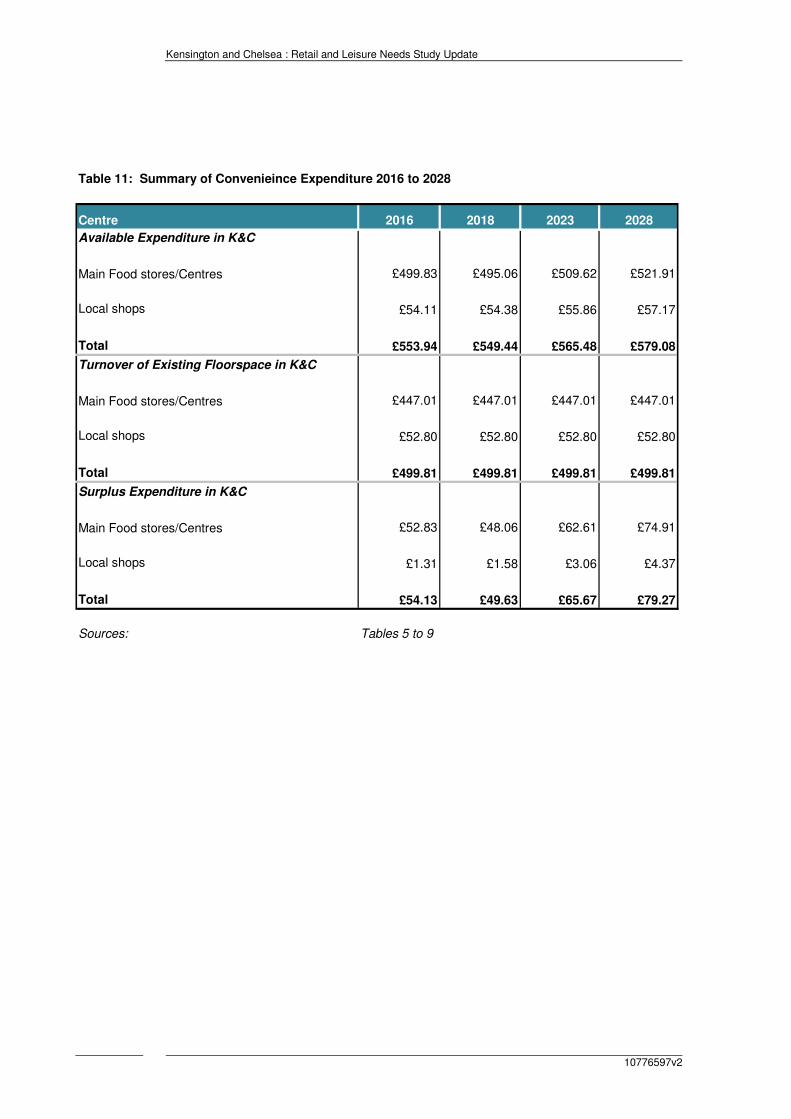
Kensington and Chelsea : Retail and Leisure Needs Study Update
10776597v2
Table 11: Summary of Convenieince Expenditure 2016 to 2028
Centre 2016 2018 2023 2028
Available Expenditure in K&C
Main Food stores/Centres £499.83 £495.06 £509.62 £521.91
Local shops £54.11 £54.38 £55.86 £57.17
Total £553.94 £549.44 £565.48 £579.08
Turnover of Existing Floorspace in K&C
Main Food stores/Centres £447.01 £447.01 £447.01 £447.01
Local shops £52.80 £52.80 £52.80 £52.80
Total £499.81 £499.81 £499.81 £499.81
Surplus Expenditure in K&C
Main Food stores/Centres £52.83 £48.06 £62.61 £74.91
Local shops £1.31 £1.58 £3.06 £4.37
Total £54.13 £49.63 £65.67 £79.27
Sources: Tables 5 to 9
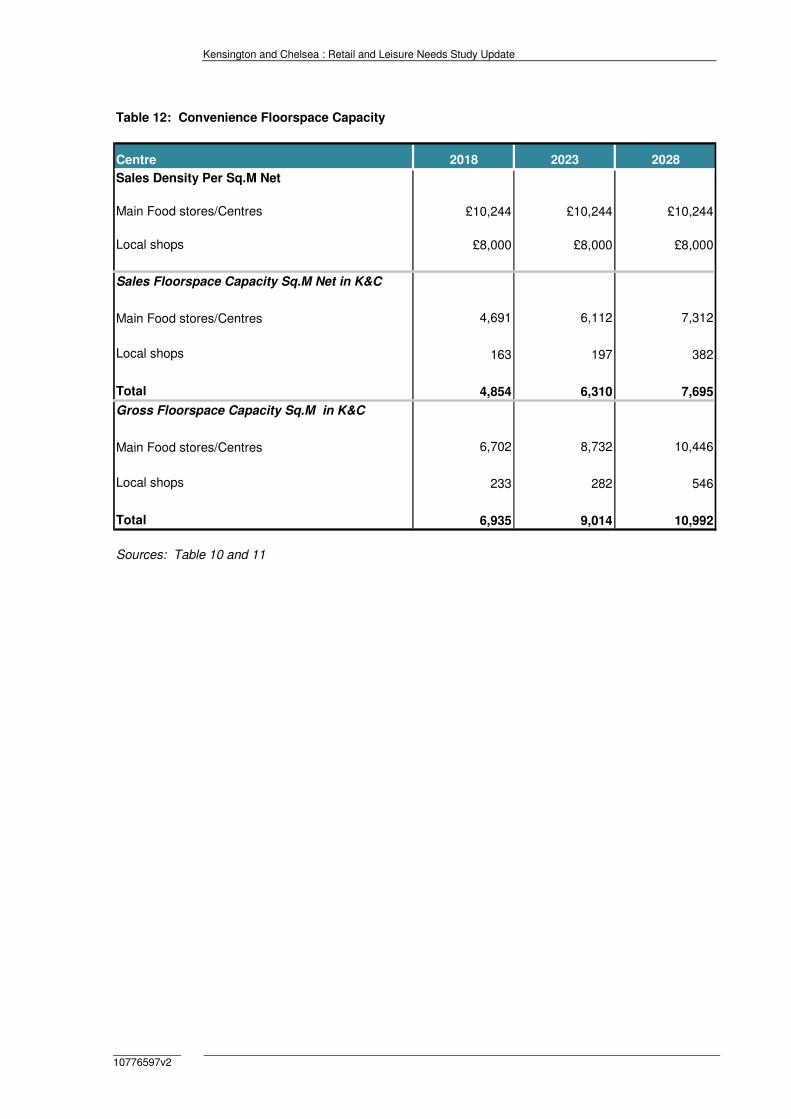
Kensington and Chelsea : Retail and Leisure Needs Study Update
10776597v2
Table 12: Convenience Floorspace Capacity
Centre 2018 2023 2028
Sales Density Per Sq.M Net
Main Food stores/Centres £10,244 £10,244 £10,244
Local shops £8,000 £8,000 £8,000
Sales Floorspace Capacity Sq.M Net in K&C
Main Food stores/Centres 4,691 6,112 7,312
Local shops 163 197 382
Total 4,854 6,310 7,695
Gross Floorspace Capacity Sq.M in K&C
Main Food stores/Centres 6,702 8,732 10,446
Local shops 233 282 546
Total 6,935 9,014 10,992
Sources: Table 10 and 11

Kensington and Chelsea : Retail and Leisure Needs Study Update
10776597v2
Appendix 4 Comparison Goods Assessment
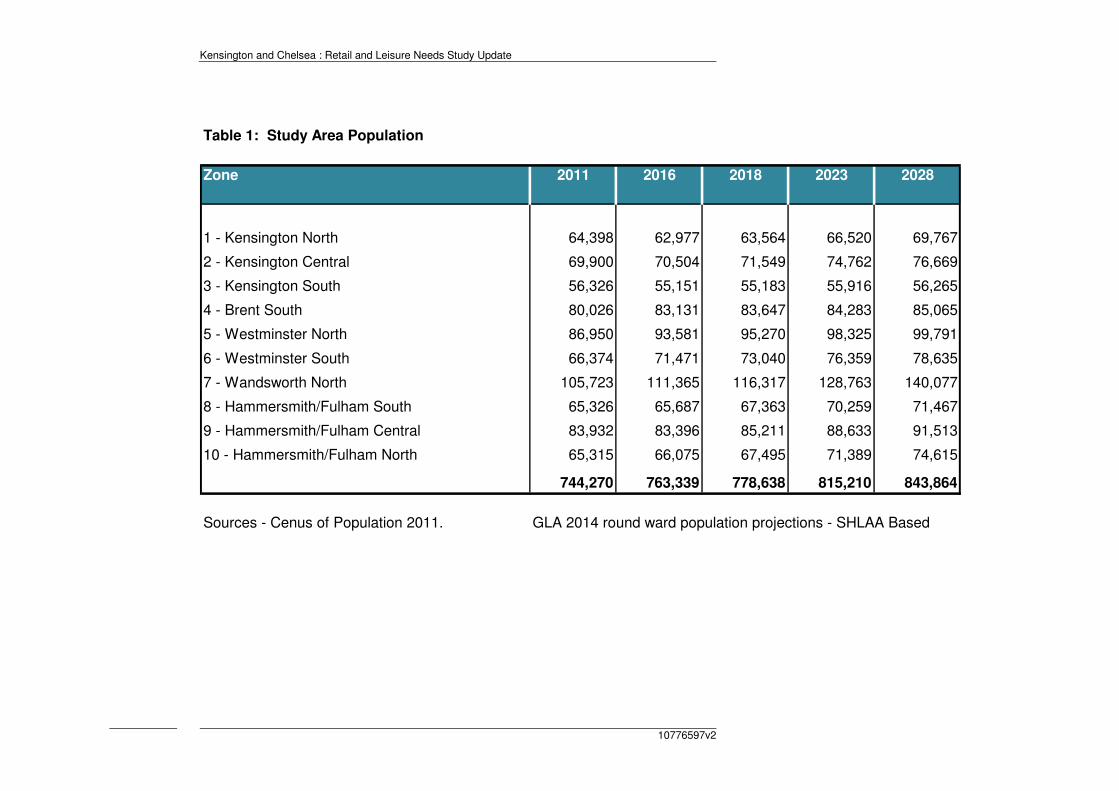
Kensington and Chelsea : Retail and Leisure Needs Study Update
10776597v2
Table 1: Study Area Population
Zone 2011 2016 2018 2023 2028
1 - Kensington North 64,398 62,977 63,564 66,520 69,767
2 - Kensington Central 69,900 70,504 71,549 74,762 76,669
3 - Kensington South 56,326 55,151 55,183 55,916 56,265
4 - Brent South 80,026 83,131 83,647 84,283 85,065
5 - Westminster North 86,950 93,581 95,270 98,325 99,791
6 - Westminster South 66,374 71,471 73,040 76,359 78,635
7 - Wandsworth North 105,723 111,365 116,317 128,763 140,077
8 - Hammersmith/Fulham South 65,326 65,687 67,363 70,259 71,467
9 - Hammersmith/Fulham Central 83,932 83,396 85,211 88,633 91,513
10 - Hammersmith/Fulham North 65,315 66,075 67,495 71,389 74,615
744,270 763,339 778,638 815,210 843,864
Sources - Cenus of Population 2011. GLA 2014 round ward population projections - SHLAA Based
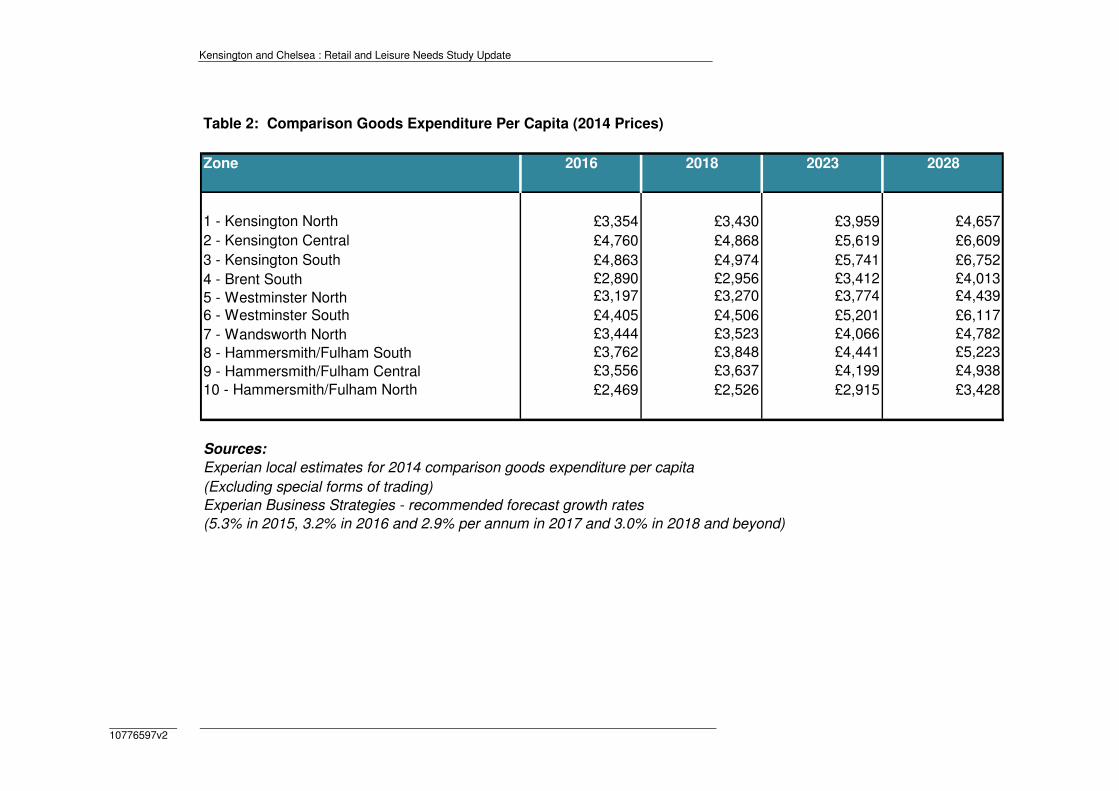
Kensington and Chelsea : Retail and Leisure Needs Study Update
10776597v2
Table 2: Comparison Goods Expenditure Per Capita (2014 Prices)
Zone 2016 2018 2023 2028
1 - Kensington North £3,354 £3,430 £3,959 £4,657
2 - Kensington Central £4,760 £4,868 £5,619 £6,609
3 - Kensington South £4,863 £4,974 £5,741 £6,752
4 - Brent South £2,890 £2,956 £3,412 £4,013
5 - Westminster North £3,197 £3,270 £3,774 £4,439
6 - Westminster South £4,405 £4,506 £5,201 £6,117
7 - Wandsworth North £3,444 £3,523 £4,066 £4,782
8 - Hammersmith/Fulham South £3,762 £3,848 £4,441 £5,223
9 - Hammersmith/Fulham Central £3,556 £3,637 £4,199 £4,938
10 - Hammersmith/Fulham North £2,469 £2,526 £2,915 £3,428
Sources:
Experian local estimates for 2014 comparison goods expenditure per capita
(Excluding special forms of trading)
Experian Business Strategies - recommended forecast growth rates
(5.3% in 2015, 3.2% in 2016 and 2.9% per annum in 2017 and 3.0% in 2018 and beyond)
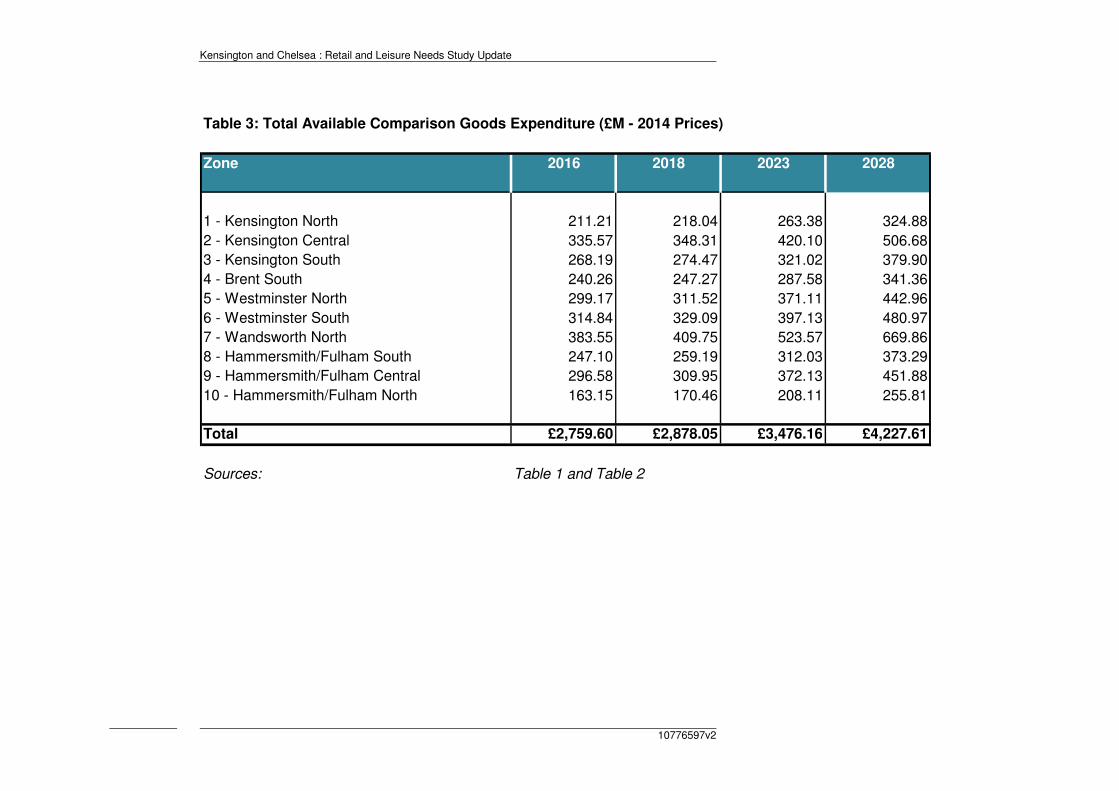
Kensington and Chelsea : Retail and Leisure Needs Study Update
10776597v2
Table 3: Total Available Comparison Goods Expenditure (£M - 2014 Prices)
Zone 2016 2018 2023 2028
1 - Kensington North 211.21 218.04 263.38 324.88
2 - Kensington Central 335.57 348.31 420.10 506.68
3 - Kensington South 268.19 274.47 321.02 379.90
4 - Brent South 240.26 247.27 287.58 341.36
5 - Westminster North 299.17 311.52 371.11 442.96
6 - Westminster South 314.84 329.09 397.13 480.97
7 - Wandsworth North 383.55 409.75 523.57 669.86
8 - Hammersmith/Fulham South 247.10 259.19 312.03 373.29
9 - Hammersmith/Fulham Central 296.58 309.95 372.13 451.88
10 - Hammersmith/Fulham North 163.15 170.46 208.11 255.81
Total £2,759.60 £2,878.05 £3,476.16 £4,227.61
Sources: Table 1 and Table 2
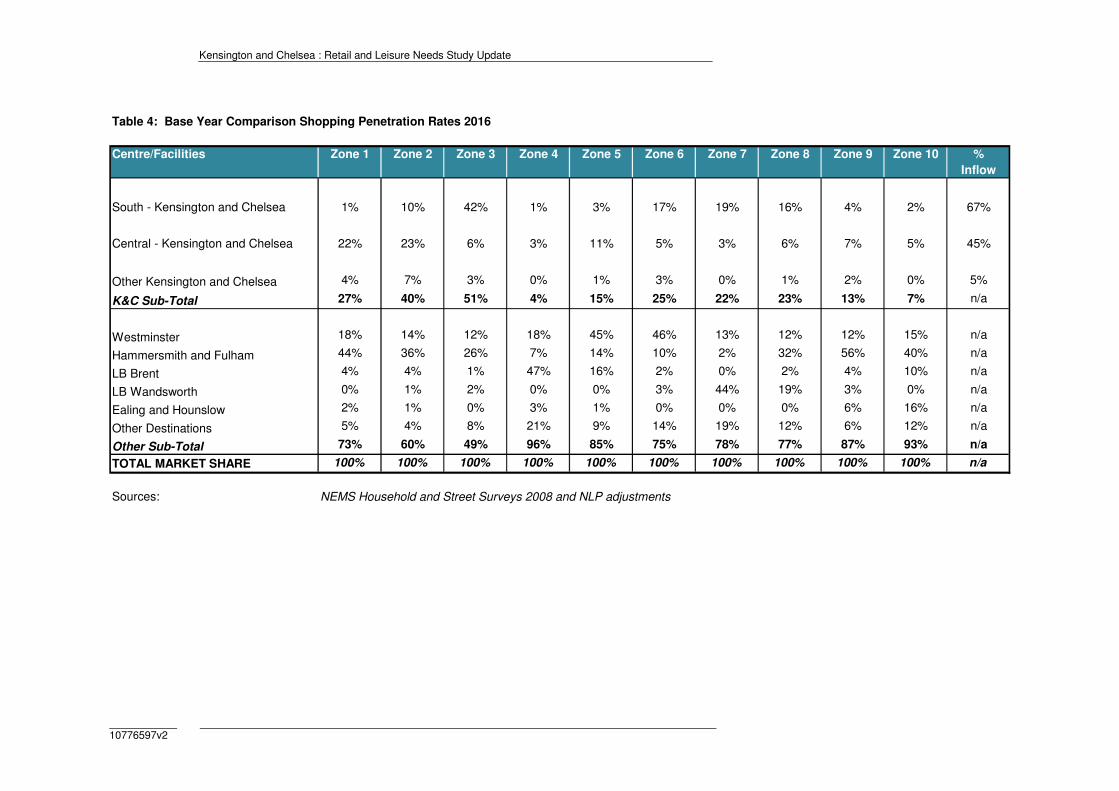
Kensington and Chelsea : Retail and Leisure Needs Study Update
10776597v2
Table 4: Base Year Comparison Shopping Penetration Rates 2016
Centre/Facilities Zone 1 Zone 2 Zone 3 Zone 4 Zone 5 Zone 6 Zone 7 Zone 8 Zone 9 Zone 10 %
Inflow
South - Kensington and Chelsea 1% 10% 42% 1% 3% 17% 19% 16% 4% 2% 67%
Central - Kensington and Chelsea 22% 23% 6% 3% 11% 5% 3% 6% 7% 5% 45%
Other Kensington and Chelsea 4% 7% 3% 0% 1% 3% 0% 1% 2% 0% 5%
K&C Sub-Total 27% 40% 51% 4% 15% 25% 22% 23% 13% 7% n/a
Westminster 18% 14% 12% 18% 45% 46% 13% 12% 12% 15% n/a
Hammersmith and Fulham 44% 36% 26% 7% 14% 10% 2% 32% 56% 40% n/a
LB Brent 4% 4% 1% 47% 16% 2% 0% 2% 4% 10% n/a
LB Wandsworth 0% 1% 2% 0% 0% 3% 44% 19% 3% 0% n/a
Ealing and Hounslow 2% 1% 0% 3% 1% 0% 0% 0% 6% 16% n/a
Other Destinations 5% 4% 8% 21% 9% 14% 19% 12% 6% 12% n/a
Other Sub-Total 73% 60% 49% 96% 85% 75% 78% 77% 87% 93% n/a
TOTAL MARKET SHARE 100% 100% 100% 100% 100% 100% 100% 100% 100% 100% n/a
Sources: NEMS Household and Street Surveys 2008 and NLP adjustments
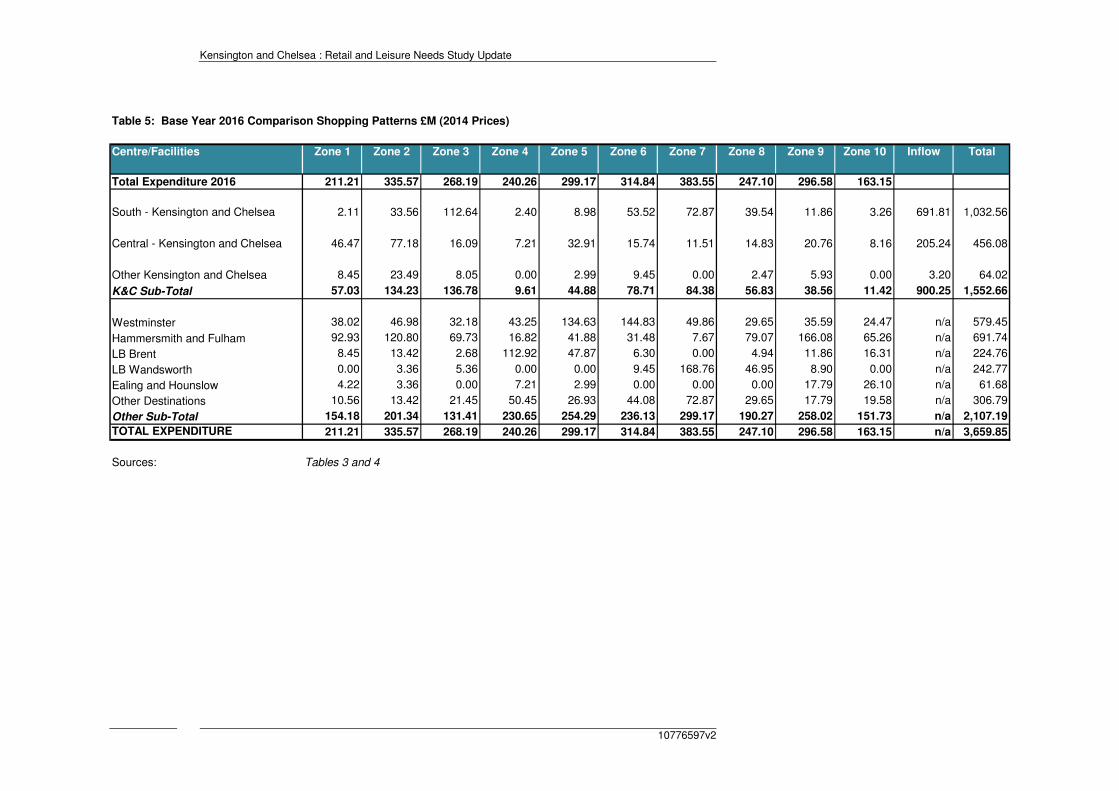
Kensington and Chelsea : Retail and Leisure Needs Study Update
10776597v2
Table 5: Base Year 2016 Comparison Shopping Patterns £M (2014 Prices)
Centre/Facilities Zone 1 Zone 2 Zone 3 Zone 4 Zone 5 Zone 6 Zone 7 Zone 8 Zone 9 Zone 10 Inflow Total
Total Expenditure 2016 211.21 335.57 268.19 240.26 299.17 314.84 383.55 247.10 296.58 163.15
South - Kensington and Chelsea 2.11 33.56 112.64 2.40 8.98 53.52 72.87 39.54 11.86 3.26 691.81 1,032.56
Central - Kensington and Chelsea 46.47 77.18 16.09 7.21 32.91 15.74 11.51 14.83 20.76 8.16 205.24 456.08
Other Kensington and Chelsea 8.45 23.49 8.05 0.00 2.99 9.45 0.00 2.47 5.93 0.00 3.20 64.02
K&C Sub-Total 57.03 134.23 136.78 9.61 44.88 78.71 84.38 56.83 38.56 11.42 900.25 1,552.66
Westminster 38.02 46.98 32.18 43.25 134.63 144.83 49.86 29.65 35.59 24.47 n/a 579.45
Hammersmith and Fulham 92.93 120.80 69.73 16.82 41.88 31.48 7.67 79.07 166.08 65.26 n/a 691.74
LB Brent 8.45 13.42 2.68 112.92 47.87 6.30 0.00 4.94 11.86 16.31 n/a 224.76
LB Wandsworth 0.00 3.36 5.36 0.00 0.00 9.45 168.76 46.95 8.90 0.00 n/a 242.77
Ealing and Hounslow 4.22 3.36 0.00 7.21 2.99 0.00 0.00 0.00 17.79 26.10 n/a 61.68
Other Destinations 10.56 13.42 21.45 50.45 26.93 44.08 72.87 29.65 17.79 19.58 n/a 306.79
Other Sub-Total 154.18 201.34 131.41 230.65 254.29 236.13 299.17 190.27 258.02 151.73 n/a 2,107.19
TOTAL EXPENDITURE 211.21 335.57 268.19 240.26 299.17 314.84 383.55 247.10 296.58 163.15 n/a 3,659.85
Sources: Tables 3 and 4
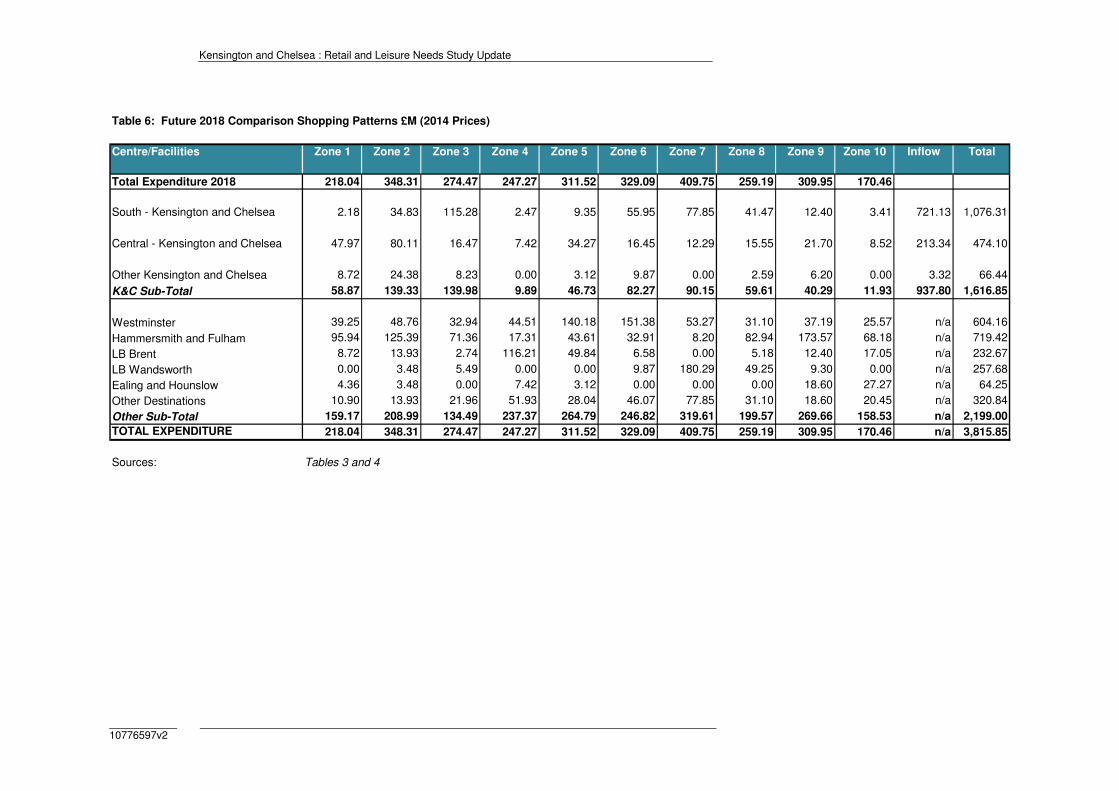
Kensington and Chelsea : Retail and Leisure Needs Study Update
10776597v2
Table 6: Future 2018 Comparison Shopping Patterns £M (2014 Prices)
Centre/Facilities Zone 1 Zone 2 Zone 3 Zone 4 Zone 5 Zone 6 Zone 7 Zone 8 Zone 9 Zone 10 Inflow Total
Total Expenditure 2018 218.04 348.31 274.47 247.27 311.52 329.09 409.75 259.19 309.95 170.46
South - Kensington and Chelsea 2.18 34.83 115.28 2.47 9.35 55.95 77.85 41.47 12.40 3.41 721.13 1,076.31
Central - Kensington and Chelsea 47.97 80.11 16.47 7.42 34.27 16.45 12.29 15.55 21.70 8.52 213.34 474.10
Other Kensington and Chelsea 8.72 24.38 8.23 0.00 3.12 9.87 0.00 2.59 6.20 0.00 3.32 66.44
K&C Sub-Total 58.87 139.33 139.98 9.89 46.73 82.27 90.15 59.61 40.29 11.93 937.80 1,616.85
Westminster 39.25 48.76 32.94 44.51 140.18 151.38 53.27 31.10 37.19 25.57 n/a 604.16
Hammersmith and Fulham 95.94 125.39 71.36 17.31 43.61 32.91 8.20 82.94 173.57 68.18 n/a 719.42
LB Brent 8.72 13.93 2.74 116.21 49.84 6.58 0.00 5.18 12.40 17.05 n/a 232.67
LB Wandsworth 0.00 3.48 5.49 0.00 0.00 9.87 180.29 49.25 9.30 0.00 n/a 257.68
Ealing and Hounslow 4.36 3.48 0.00 7.42 3.12 0.00 0.00 0.00 18.60 27.27 n/a 64.25
Other Destinations 10.90 13.93 21.96 51.93 28.04 46.07 77.85 31.10 18.60 20.45 n/a 320.84
Other Sub-Total 159.17 208.99 134.49 237.37 264.79 246.82 319.61 199.57 269.66 158.53 n/a 2,199.00
TOTAL EXPENDITURE 218.04 348.31 274.47 247.27 311.52 329.09 409.75 259.19 309.95 170.46 n/a 3,815.85
Sources: Tables 3 and 4
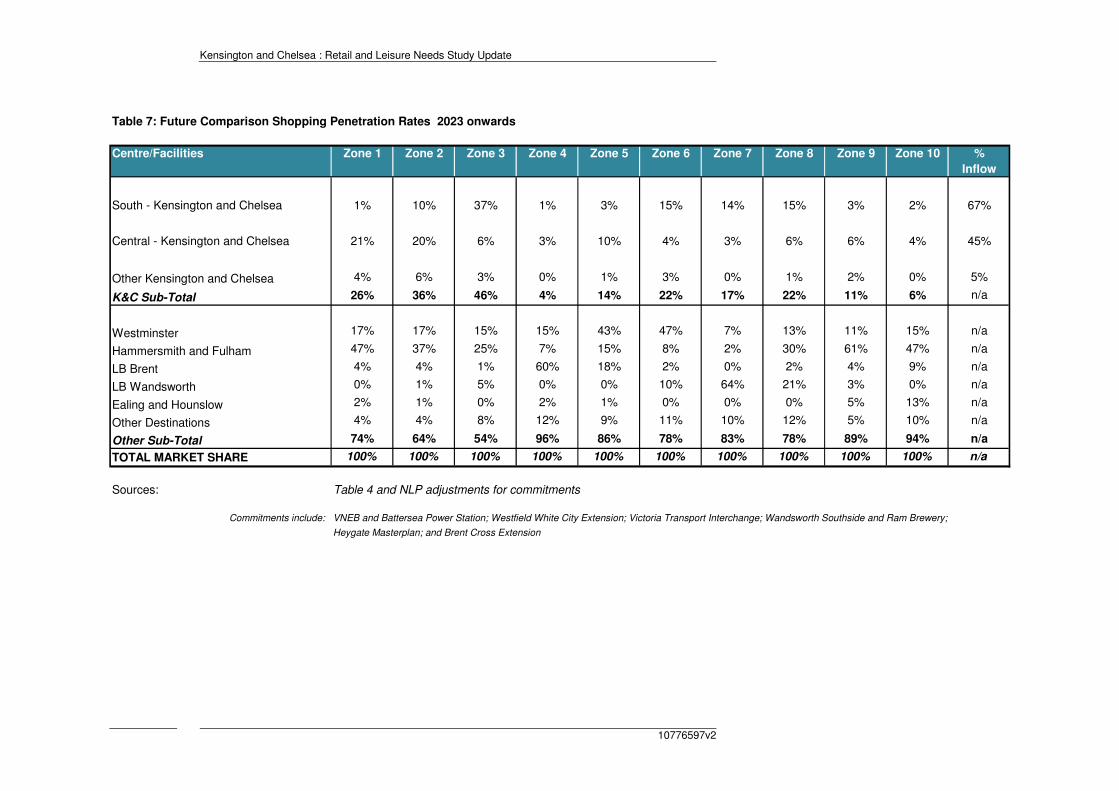
Kensington and Chelsea : Retail and Leisure Needs Study Update
10776597v2
Table 7: Future Comparison Shopping Penetration Rates 2023 onwards
Centre/Facilities Zone 1 Zone 2 Zone 3 Zone 4 Zone 5 Zone 6 Zone 7 Zone 8 Zone 9 Zone 10 %
Inflow
South - Kensington and Chelsea 1% 10% 37% 1% 3% 15% 14% 15% 3% 2% 67%
Central - Kensington and Chelsea 21% 20% 6% 3% 10% 4% 3% 6% 6% 4% 45%
Other Kensington and Chelsea 4% 6% 3% 0% 1% 3% 0% 1% 2% 0% 5%
K&C Sub-Total 26% 36% 46% 4% 14% 22% 17% 22% 11% 6% n/a
Westminster 17% 17% 15% 15% 43% 47% 7% 13% 11% 15% n/a
Hammersmith and Fulham 47% 37% 25% 7% 15% 8% 2% 30% 61% 47% n/a
LB Brent 4% 4% 1% 60% 18% 2% 0% 2% 4% 9% n/a
LB Wandsworth 0% 1% 5% 0% 0% 10% 64% 21% 3% 0% n/a
Ealing and Hounslow 2% 1% 0% 2% 1% 0% 0% 0% 5% 13% n/a
Other Destinations 4% 4% 8% 12% 9% 11% 10% 12% 5% 10% n/a
Other Sub-Total 74% 64% 54% 96% 86% 78% 83% 78% 89% 94% n/a
TOTAL MARKET SHARE 100% 100% 100% 100% 100% 100% 100% 100% 100% 100% n/a
Sources: Table 4 and NLP adjustments for commitments
Commitments include: VNEB and Battersea Power Station; Westfield White City Extension; Victoria Transport Interchange; Wandsworth Southside and Ram Brewery;
Heygate Masterplan; and Brent Cross Extension
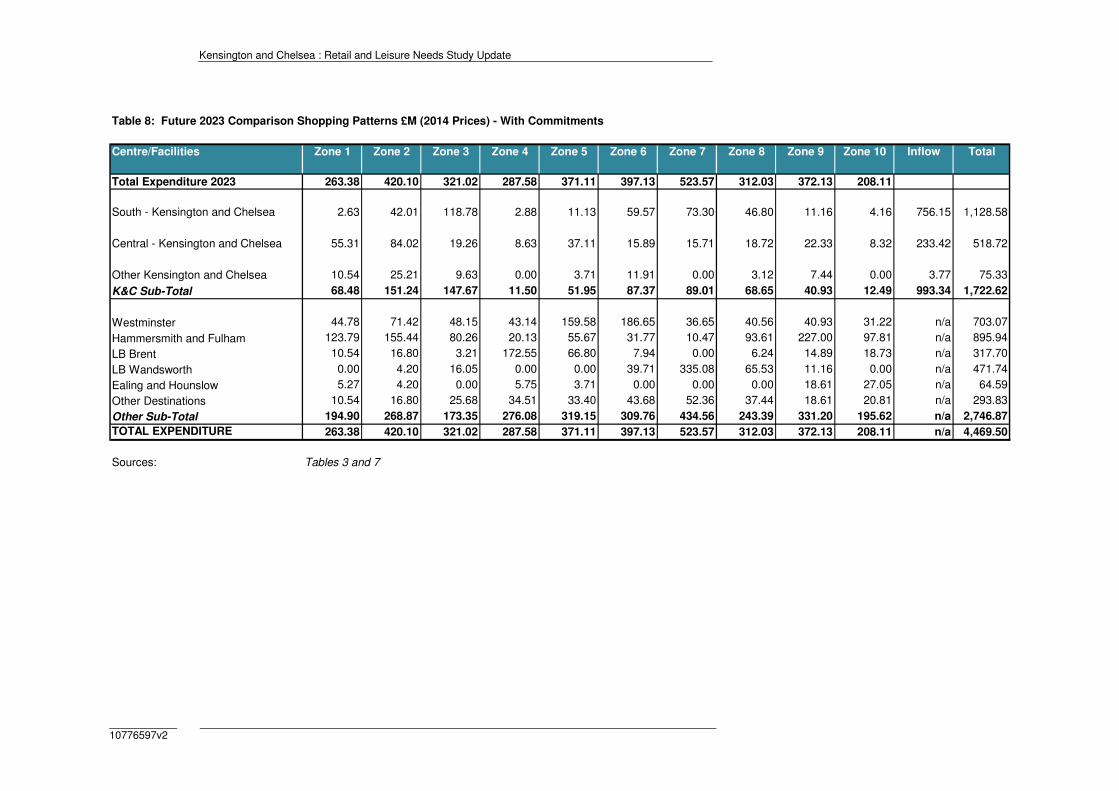
Kensington and Chelsea : Retail and Leisure Needs Study Update
10776597v2
Table 8: Future 2023 Comparison Shopping Patterns £M (2014 Prices) - With Commitments
Centre/Facilities Zone 1 Zone 2 Zone 3 Zone 4 Zone 5 Zone 6 Zone 7 Zone 8 Zone 9 Zone 10 Inflow Total
Total Expenditure 2023 263.38 420.10 321.02 287.58 371.11 397.13 523.57 312.03 372.13 208.11
South - Kensington and Chelsea 2.63 42.01 118.78 2.88 11.13 59.57 73.30 46.80 11.16 4.16 756.15 1,128.58
Central - Kensington and Chelsea 55.31 84.02 19.26 8.63 37.11 15.89 15.71 18.72 22.33 8.32 233.42 518.72
Other Kensington and Chelsea 10.54 25.21 9.63 0.00 3.71 11.91 0.00 3.12 7.44 0.00 3.77 75.33
K&C Sub-Total 68.48 151.24 147.67 11.50 51.95 87.37 89.01 68.65 40.93 12.49 993.34 1,722.62
Westminster 44.78 71.42 48.15 43.14 159.58 186.65 36.65 40.56 40.93 31.22 n/a 703.07
Hammersmith and Fulham 123.79 155.44 80.26 20.13 55.67 31.77 10.47 93.61 227.00 97.81 n/a 895.94
LB Brent 10.54 16.80 3.21 172.55 66.80 7.94 0.00 6.24 14.89 18.73 n/a 317.70
LB Wandsworth 0.00 4.20 16.05 0.00 0.00 39.71 335.08 65.53 11.16 0.00 n/a 471.74
Ealing and Hounslow 5.27 4.20 0.00 5.75 3.71 0.00 0.00 0.00 18.61 27.05 n/a 64.59
Other Destinations 10.54 16.80 25.68 34.51 33.40 43.68 52.36 37.44 18.61 20.81 n/a 293.83
Other Sub-Total 194.90 268.87 173.35 276.08 319.15 309.76 434.56 243.39 331.20 195.62 n/a 2,746.87
TOTAL EXPENDITURE 263.38 420.10 321.02 287.58 371.11 397.13 523.57 312.03 372.13 208.11 n/a 4,469.50
Sources: Tables 3 and 7
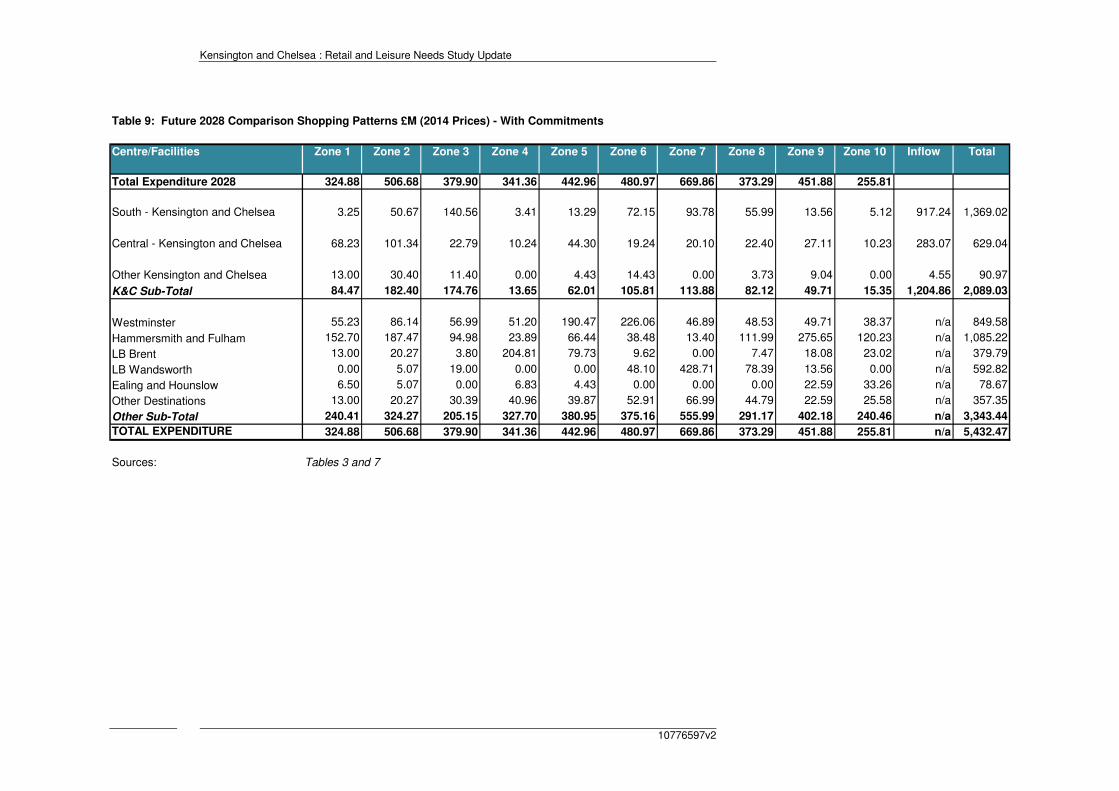
Kensington and Chelsea : Retail and Leisure Needs Study Update
10776597v2
Table 9: Future 2028 Comparison Shopping Patterns £M (2014 Prices) - With Commitments
Centre/Facilities Zone 1 Zone 2 Zone 3 Zone 4 Zone 5 Zone 6 Zone 7 Zone 8 Zone 9 Zone 10 Inflow Total
Total Expenditure 2028 324.88 506.68 379.90 341.36 442.96 480.97 669.86 373.29 451.88 255.81
South - Kensington and Chelsea 3.25 50.67 140.56 3.41 13.29 72.15 93.78 55.99 13.56 5.12 917.24 1,369.02
Central - Kensington and Chelsea 68.23 101.34 22.79 10.24 44.30 19.24 20.10 22.40 27.11 10.23 283.07 629.04
Other Kensington and Chelsea 13.00 30.40 11.40 0.00 4.43 14.43 0.00 3.73 9.04 0.00 4.55 90.97
K&C Sub-Total 84.47 182.40 174.76 13.65 62.01 105.81 113.88 82.12 49.71 15.35 1,204.86 2,089.03
Westminster 55.23 86.14 56.99 51.20 190.47 226.06 46.89 48.53 49.71 38.37 n/a 849.58
Hammersmith and Fulham 152.70 187.47 94.98 23.89 66.44 38.48 13.40 111.99 275.65 120.23 n/a 1,085.22
LB Brent 13.00 20.27 3.80 204.81 79.73 9.62 0.00 7.47 18.08 23.02 n/a 379.79
LB Wandsworth 0.00 5.07 19.00 0.00 0.00 48.10 428.71 78.39 13.56 0.00 n/a 592.82
Ealing and Hounslow 6.50 5.07 0.00 6.83 4.43 0.00 0.00 0.00 22.59 33.26 n/a 78.67
Other Destinations 13.00 20.27 30.39 40.96 39.87 52.91 66.99 44.79 22.59 25.58 n/a 357.35
Other Sub-Total 240.41 324.27 205.15 327.70 380.95 375.16 555.99 291.17 402.18 240.46 n/a 3,343.44
TOTAL EXPENDITURE 324.88 506.68 379.90 341.36 442.96 480.97 669.86 373.29 451.88 255.81 n/a 5,432.47
Sources: Tables 3 and 7
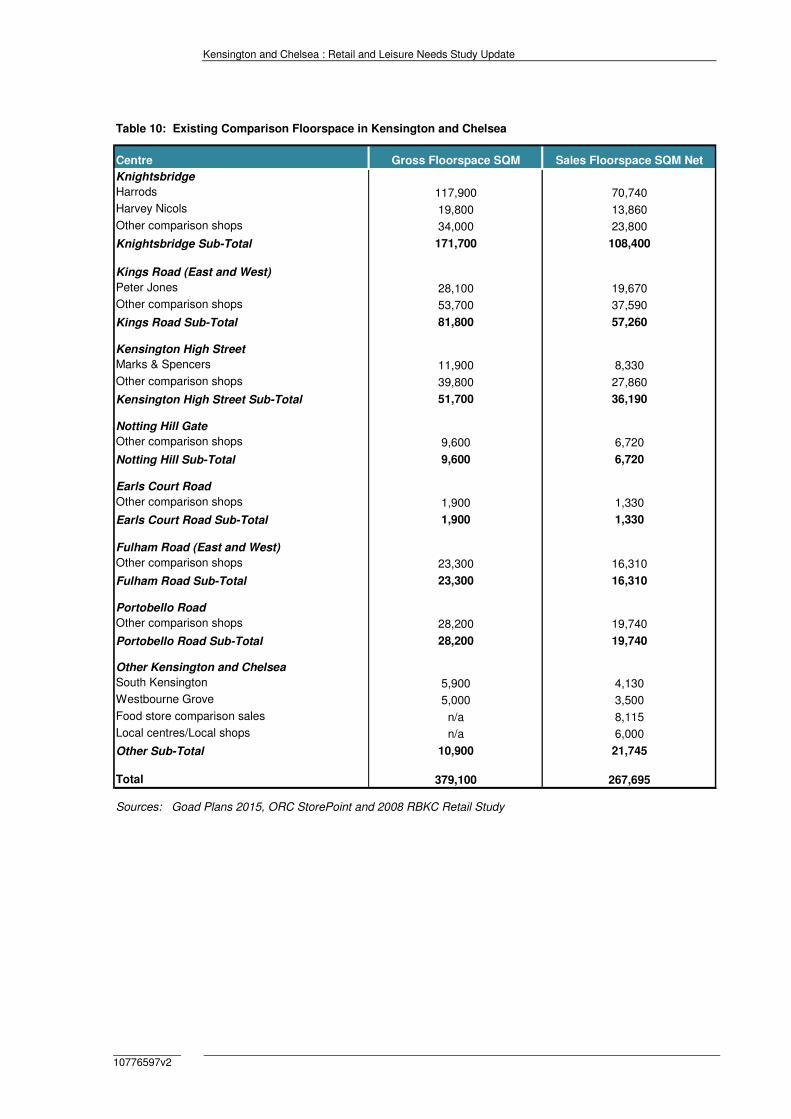
Kensington and Chelsea : Retail and Leisure Needs Study Update
10776597v2
Table 10: Existing Comparison Floorspace in Kensington and Chelsea
Centre Gross Floorspace SQM Sales Floorspace SQM Net
Knightsbridge
Harrods 117,900 70,740
Harvey Nicols 19,800 13,860
Other comparison shops 34,000 23,800
Knightsbridge Sub-Total 171,700 108,400
Kings Road (East and West)
Peter Jones 28,100 19,670
Other comparison shops 53,700 37,590
Kings Road Sub-Total 81,800 57,260
Kensington High Street
Marks & Spencers 11,900 8,330
Other comparison shops 39,800 27,860
Kensington High Street Sub-Total 51,700 36,190
Notting Hill Gate
Other comparison shops 9,600 6,720
Notting Hill Sub-Total 9,600 6,720
Earls Court Road
Other comparison shops 1,900 1,330
Earls Court Road Sub-Total 1,900 1,330
Fulham Road (East and West)
Other comparison shops 23,300 16,310
Fulham Road Sub-Total 23,300 16,310
Portobello Road
Other comparison shops 28,200 19,740
Portobello Road Sub-Total 28,200 19,740
Other Kensington and Chelsea
South Kensington 5,900 4,130
Westbourne Grove 5,000 3,500
Food store comparison sales n/a 8,115
Local centres/Local shops n/a 6,000
Other Sub-Total 10,900 21,745
Total 379,100 267,695
Sources: Goad Plans 2015, ORC StorePoint and 2008 RBKC Retail Study
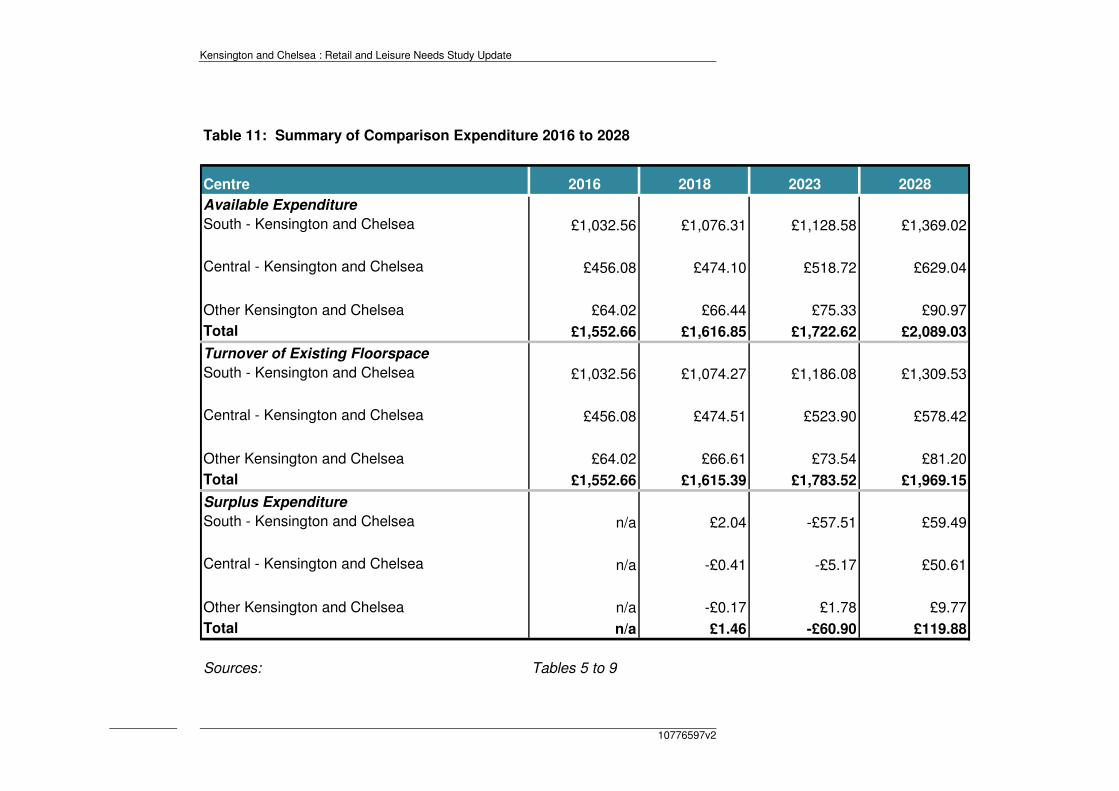
Kensington and Chelsea : Retail and Leisure Needs Study Update
10776597v2
Table 11: Summary of Comparison Expenditure 2016 to 2028
Centre 2016 2018 2023 2028
Available Expenditure
South - Kensington and Chelsea £1,032.56 £1,076.31 £1,128.58 £1,369.02
Central - Kensington and Chelsea £456.08 £474.10 £518.72 £629.04
Other Kensington and Chelsea £64.02 £66.44 £75.33 £90.97
Total £1,552.66 £1,616.85 £1,722.62 £2,089.03
Turnover of Existing Floorspace
South - Kensington and Chelsea £1,032.56 £1,074.27 £1,186.08 £1,309.53
Central - Kensington and Chelsea £456.08 £474.51 £523.90 £578.42
Other Kensington and Chelsea £64.02 £66.61 £73.54 £81.20
Total £1,552.66 £1,615.39 £1,783.52 £1,969.15
Surplus Expenditure
South - Kensington and Chelsea n/a £2.04 -£57.51 £59.49
Central - Kensington and Chelsea n/a -£0.41 -£5.17 £50.61
Other Kensington and Chelsea n/a -£0.17 £1.78 £9.77
Total n/a £1.46 -£60.90 £119.88
Sources: Tables 5 to 9
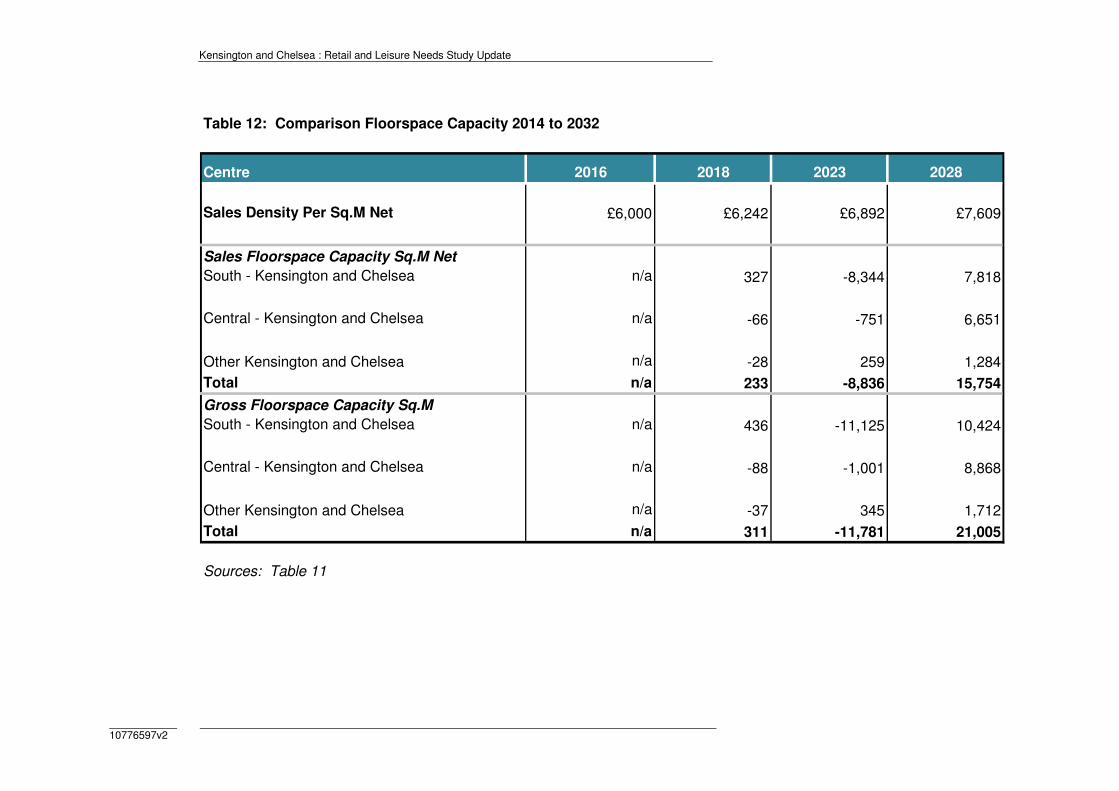
Kensington and Chelsea : Retail and Leisure Needs Study Update
10776597v2
Table 12: Comparison Floorspace Capacity 2014 to 2032
Centre 2016 2018 2023 2028
Sales Density Per Sq.M Net £6,000 £6,242 £6,892 £7,609
Sales Floorspace Capacity Sq.M Net
South - Kensington and Chelsea n/a 327 -8,344 7,818
Central - Kensington and Chelsea n/a -66 -751 6,651
Other Kensington and Chelsea n/a -28 259 1,284
Total n/a 233 -8,836 15,754
Gross Floorspace Capacity Sq.M
South - Kensington and Chelsea n/a 436 -11,125 10,424
Central - Kensington and Chelsea n/a -88 -1,001 8,868
Other Kensington and Chelsea n/a -37 345 1,712
Total n/a 311 -11,781 21,005
Sources: Table 11
Kensington and Chelsea : Retail and Leisure Needs Study Update
10776597v2
Kensington and Chelsea : Retail and Leisure Needs Study Update
10776597v2
Appendix 5 Food and Beverage Assessment

Kensington and Chelsea : Retail and Leisure Needs Study Update
10776597v2
Table 1: Study Area Population
Zone 2011 2016 2018 2023 2028
1 - Kensington North 64,398 62,977 63,564 66,520 69,767
2 - Kensington Central 69,900 70,504 71,549 74,762 76,669
3 - Kensington South 56,326 55,151 55,183 55,916 56,265
4 - Brent South 80,026 83,131 83,647 84,283 85,065
5 - Westminster North 86,950 93,581 95,270 98,325 99,791
6 - Westminster South 66,374 71,471 73,040 76,359 78,635
7 - Wandsworth North 105,723 111,365 116,317 128,763 140,077
8 - Hammersmith/Fulham South 65,326 65,687 67,363 70,259 71,467
9 - Hammersmith/Fulham Central 83,932 83,396 85,211 88,633 91,513
10 - Hammersmith/Fulham North 65,315 66,075 67,495 71,389 74,615
744,270 763,339 778,638 815,210 843,864
Sources - Cenus of Population 2011. GLA 2014 round ward population projections - SHLAA Based
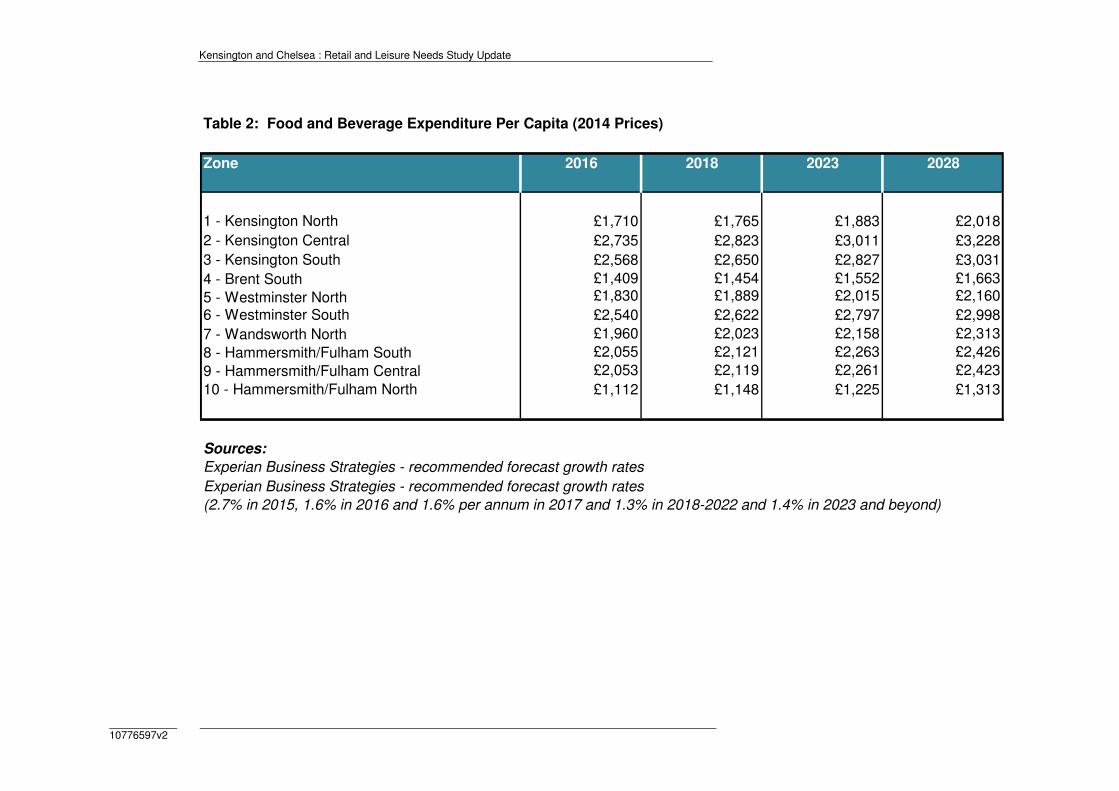
Kensington and Chelsea : Retail and Leisure Needs Study Update
10776597v2
Table 2: Food and Beverage Expenditure Per Capita (2014 Prices)
Zone 2016 2018 2023 2028
1 - Kensington North £1,710 £1,765 £1,883 £2,018
2 - Kensington Central £2,735 £2,823 £3,011 £3,228
3 - Kensington South £2,568 £2,650 £2,827 £3,031
4 - Brent South £1,409 £1,454 £1,552 £1,663
5 - Westminster North £1,830 £1,889 £2,015 £2,160
6 - Westminster South £2,540 £2,622 £2,797 £2,998
7 - Wandsworth North £1,960 £2,023 £2,158 £2,313
8 - Hammersmith/Fulham South £2,055 £2,121 £2,263 £2,426
9 - Hammersmith/Fulham Central £2,053 £2,119 £2,261 £2,423
10 - Hammersmith/Fulham North £1,112 £1,148 £1,225 £1,313
Sources:
Experian Business Strategies - recommended forecast growth rates
Experian Business Strategies - recommended forecast growth rates
(2.7% in 2015, 1.6% in 2016 and 1.6% per annum in 2017 and 1.3% in 2018-2022 and 1.4% in 2023 and beyond)

Kensington and Chelsea : Retail and Leisure Needs Study Update
10776597v2
Table 3: Total Available Food and Beverage Expenditure (£M - 2014 Prices)
Zone 2016 2018 2023 2028
1 - Kensington North 107.69 112.20 125.25 140.82
2 - Kensington Central 192.82 201.99 225.14 247.50
3 - Kensington South 141.60 146.25 158.08 170.52
4 - Brent South 117.14 121.66 130.77 141.48
5 - Westminster North 171.26 179.98 198.14 215.57
6 - Westminster South 181.52 191.49 213.55 235.74
7 - Wandsworth North 218.22 235.28 277.83 324.00
8 - Hammersmith/Fulham South 134.99 142.90 158.98 173.36
9 - Hammersmith/Fulham Central 171.21 180.58 200.36 221.76
10 - Hammersmith/Fulham North 73.49 77.49 87.43 97.96
Total £1,509.94 £1,589.82 £1,775.53 £1,968.72
Sources: Table 1 and Table 2
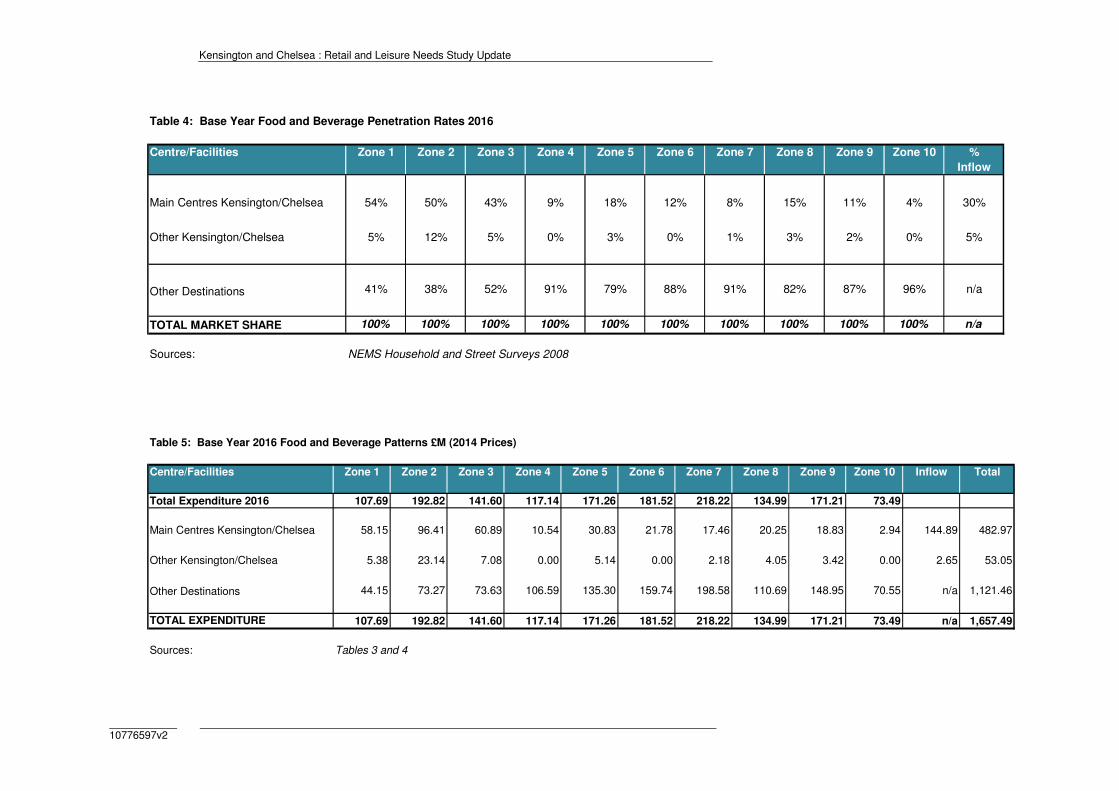
Kensington and Chelsea : Retail and Leisure Needs Study Update
10776597v2
Table 4: Base Year Food and Beverage Penetration Rates 2016
Centre/Facilities Zone 1 Zone 2 Zone 3 Zone 4 Zone 5 Zone 6 Zone 7 Zone 8 Zone 9 Zone 10 %
Inflow
Main Centres Kensington/Chelsea 54% 50% 43% 9% 18% 12% 8% 15% 11% 4% 30%
Other Kensington/Chelsea 5% 12% 5% 0% 3% 0% 1% 3% 2% 0% 5%
Other Destinations 41% 38% 52% 91% 79% 88% 91% 82% 87% 96% n/a
TOTAL MARKET SHARE 100% 100% 100% 100% 100% 100% 100% 100% 100% 100% n/a
Sources: NEMS Household and Street Surveys 2008
Table 5: Base Year 2016 Food and Beverage Patterns £M (2014 Prices)
Centre/Facilities Zone 1 Zone 2 Zone 3 Zone 4 Zone 5 Zone 6 Zone 7 Zone 8 Zone 9 Zone 10 Inflow Total
Total Expenditure 2016 107.69 192.82 141.60 117.14 171.26 181.52 218.22 134.99 171.21 73.49
Main Centres Kensington/Chelsea 58.15 96.41 60.89 10.54 30.83 21.78 17.46 20.25 18.83 2.94 144.89 482.97
Other Kensington/Chelsea 5.38 23.14 7.08 0.00 5.14 0.00 2.18 4.05 3.42 0.00 2.65 53.05
Other Destinations 44.15 73.27 73.63 106.59 135.30 159.74 198.58 110.69 148.95 70.55 n/a 1,121.46
TOTAL EXPENDITURE 107.69 192.82 141.60 117.14 171.26 181.52 218.22 134.99 171.21 73.49 n/a 1,657.49
Sources: Tables 3 and 4
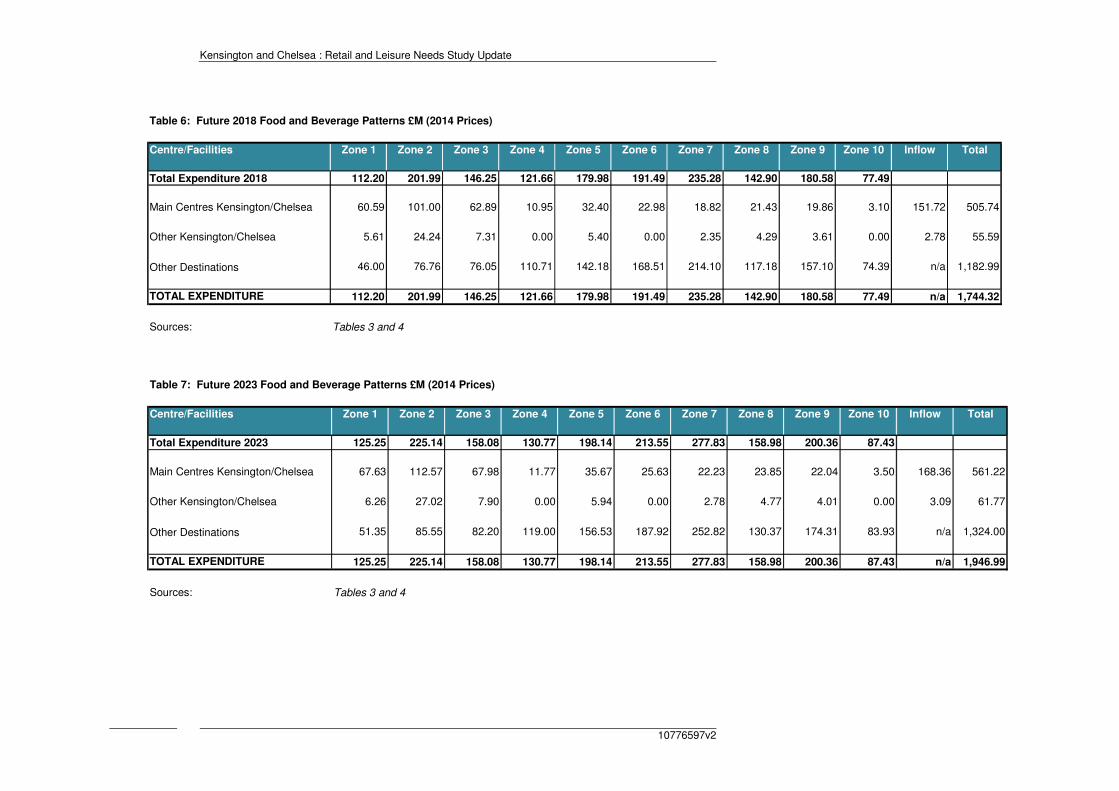
Kensington and Chelsea : Retail and Leisure Needs Study Update
10776597v2
Table 6: Future 2018 Food and Beverage Patterns £M (2014 Prices)
Centre/Facilities Zone 1 Zone 2 Zone 3 Zone 4 Zone 5 Zone 6 Zone 7 Zone 8 Zone 9 Zone 10 Inflow Total
Total Expenditure 2018 112.20 201.99 146.25 121.66 179.98 191.49 235.28 142.90 180.58 77.49
Main Centres Kensington/Chelsea 60.59 101.00 62.89 10.95 32.40 22.98 18.82 21.43 19.86 3.10 151.72 505.74
Other Kensington/Chelsea 5.61 24.24 7.31 0.00 5.40 0.00 2.35 4.29 3.61 0.00 2.78 55.59
Other Destinations 46.00 76.76 76.05 110.71 142.18 168.51 214.10 117.18 157.10 74.39 n/a 1,182.99
TOTAL EXPENDITURE 112.20 201.99 146.25 121.66 179.98 191.49 235.28 142.90 180.58 77.49 n/a 1,744.32
Sources: Tables 3 and 4
Table 7: Future 2023 Food and Beverage Patterns £M (2014 Prices)
Centre/Facilities Zone 1 Zone 2 Zone 3 Zone 4 Zone 5 Zone 6 Zone 7 Zone 8 Zone 9 Zone 10 Inflow Total
Total Expenditure 2023 125.25 225.14 158.08 130.77 198.14 213.55 277.83 158.98 200.36 87.43
Main Centres Kensington/Chelsea 67.63 112.57 67.98 11.77 35.67 25.63 22.23 23.85 22.04 3.50 168.36 561.22
Other Kensington/Chelsea 6.26 27.02 7.90 0.00 5.94 0.00 2.78 4.77 4.01 0.00 3.09 61.77
Other Destinations 51.35 85.55 82.20 119.00 156.53 187.92 252.82 130.37 174.31 83.93 n/a 1,324.00
TOTAL EXPENDITURE 125.25 225.14 158.08 130.77 198.14 213.55 277.83 158.98 200.36 87.43 n/a 1,946.99
Sources: Tables 3 and 4
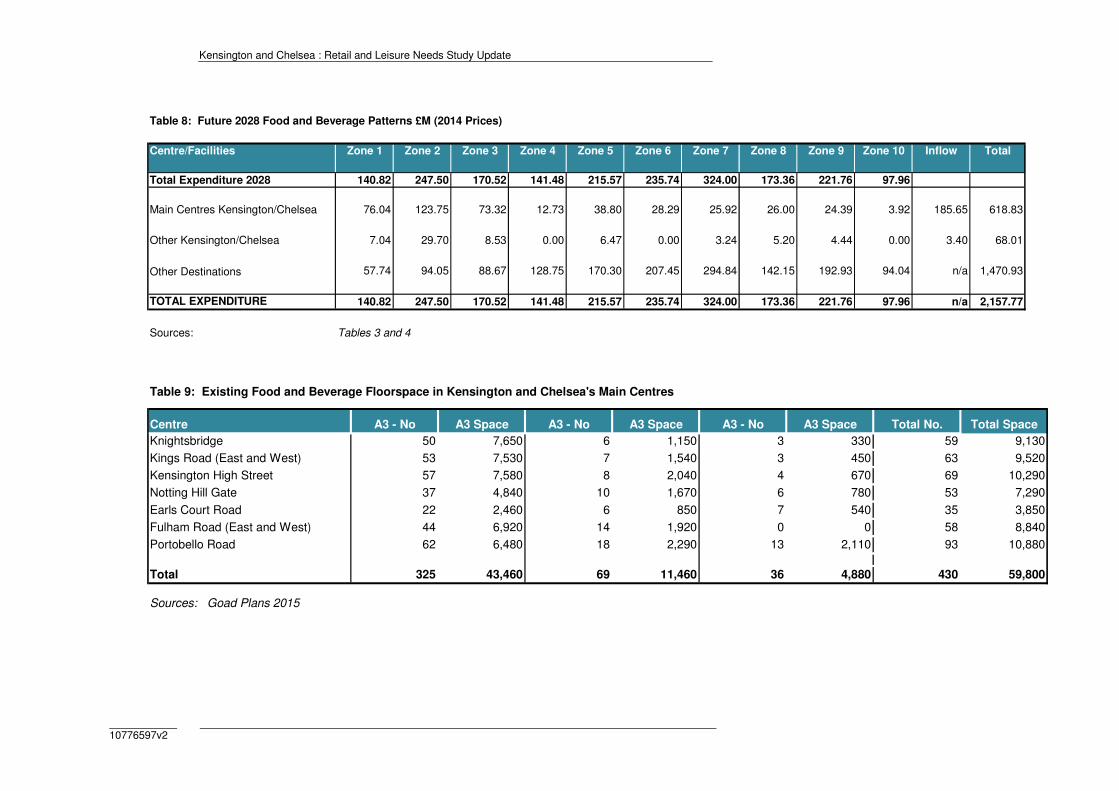
Kensington and Chelsea : Retail and Leisure Needs Study Update
10776597v2
Table 8: Future 2028 Food and Beverage Patterns £M (2014 Prices)
Centre/Facilities Zone 1 Zone 2 Zone 3 Zone 4 Zone 5 Zone 6 Zone 7 Zone 8 Zone 9 Zone 10 Inflow Total
Total Expenditure 2028 140.82 247.50 170.52 141.48 215.57 235.74 324.00 173.36 221.76 97.96
Main Centres Kensington/Chelsea 76.04 123.75 73.32 12.73 38.80 28.29 25.92 26.00 24.39 3.92 185.65 618.83
Other Kensington/Chelsea 7.04 29.70 8.53 0.00 6.47 0.00 3.24 5.20 4.44 0.00 3.40 68.01
Other Destinations 57.74 94.05 88.67 128.75 170.30 207.45 294.84 142.15 192.93 94.04 n/a 1,470.93
TOTAL EXPENDITURE 140.82 247.50 170.52 141.48 215.57 235.74 324.00 173.36 221.76 97.96 n/a 2,157.77
Sources: Tables 3 and 4
Table 9: Existing Food and Beverage Floorspace in Kensington and Chelsea's Main Centres
Centre A3 - No A3 Space A3 - No A3 Space A3 - No A3 Space Total No. Total Space
Knightsbridge 50 7,650 6 1,150 3 330 59 9,130
Kings Road (East and West) 53 7,530 7 1,540 3 450 63 9,520
Kensington High Street 57 7,580 8 2,040 4 670 69 10,290
Notting Hill Gate 37 4,840 10 1,670 6 780 53 7,290
Earls Court Road 22 2,460 6 850 7 540 35 3,850
Fulham Road (East and West) 44 6,920 14 1,920 0 0 58 8,840
Portobello Road 62 6,480 18 2,290 13 2,110 93 10,880
Total 325 43,460 69 11,460 36 4,880 430 59,800
Sources: Goad Plans 2015
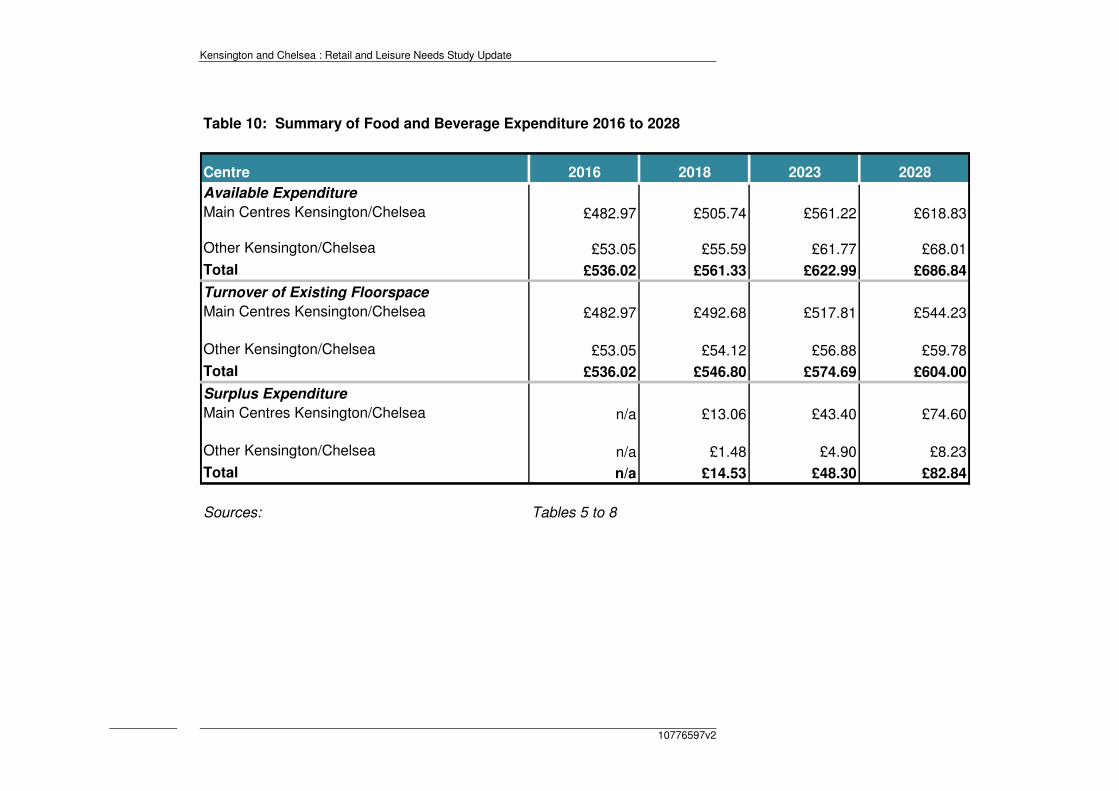
Kensington and Chelsea : Retail and Leisure Needs Study Update
10776597v2
Table 10: Summary of Food and Beverage Expenditure 2016 to 2028
Centre 2016 2018 2023 2028
Available Expenditure
Main Centres Kensington/Chelsea £482.97 £505.74 £561.22 £618.83
Other Kensington/Chelsea £53.05 £55.59 £61.77 £68.01
Total £536.02 £561.33 £622.99 £686.84
Turnover of Existing Floorspace
Main Centres Kensington/Chelsea £482.97 £492.68 £517.81 £544.23
Other Kensington/Chelsea £53.05 £54.12 £56.88 £59.78
Total £536.02 £546.80 £574.69 £604.00
Surplus Expenditure
Main Centres Kensington/Chelsea n/a £13.06 £43.40 £74.60
Other Kensington/Chelsea n/a £1.48 £4.90 £8.23
Total n/a £14.53 £48.30 £82.84
Sources: Tables 5 to 8
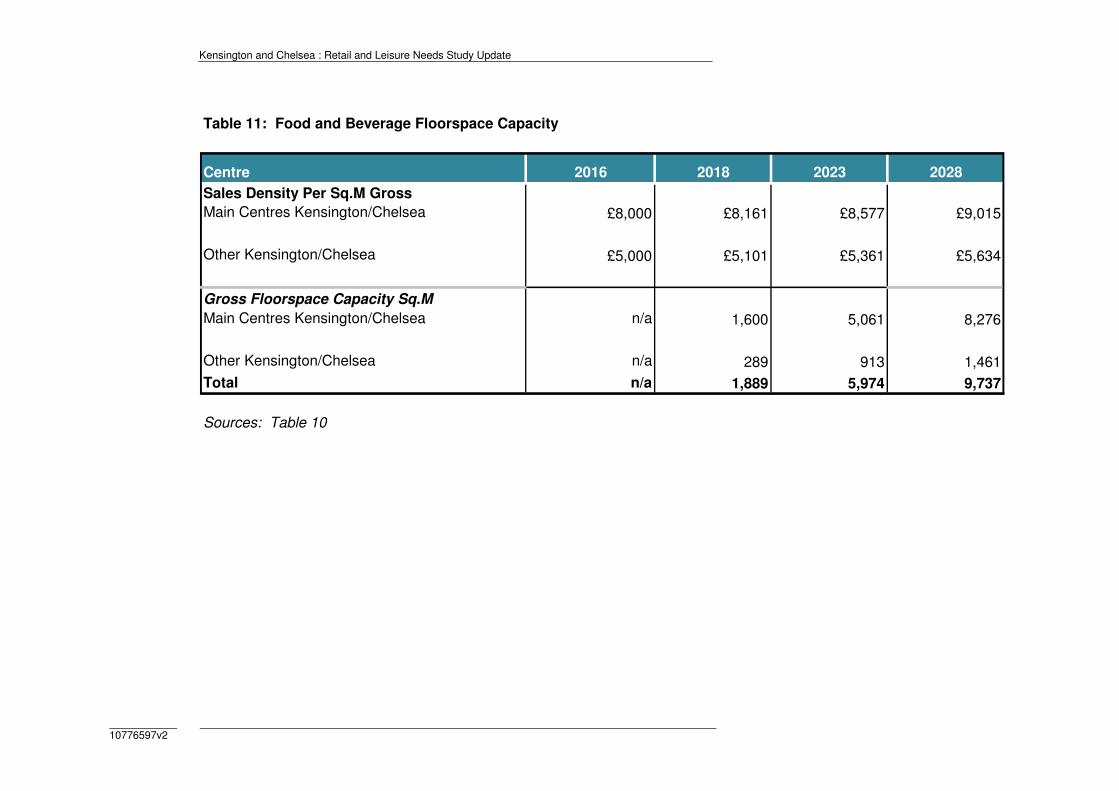
Kensington and Chelsea : Retail and Leisure Needs Study Update
10776597v2
Table 11: Food and Beverage Floorspace Capacity
Centre 2016 2018 2023 2028
Sales Density Per Sq.M Gross
Main Centres Kensington/Chelsea £8,000 £8,161 £8,577 £9,015
Other Kensington/Chelsea £5,000 £5,101 £5,361 £5,634
Gross Floorspace Capacity Sq.M
Main Centres Kensington/Chelsea n/a 1,600 5,061 8,276
Other Kensington/Chelsea n/a 289 913 1,461
Total n/a 1,889 5,974 9,737
Sources: Table 10
Kensington and Chelsea : Retail and Leisure Needs Study Update
10776597v2