Embed Size (px)
Citation preview

ALGAE CONTROL BY PHOSPHORUS INACTIVATION
KENNETH J. WAGNER, Ph.D, CLM WATER RESOURCE SERVICES
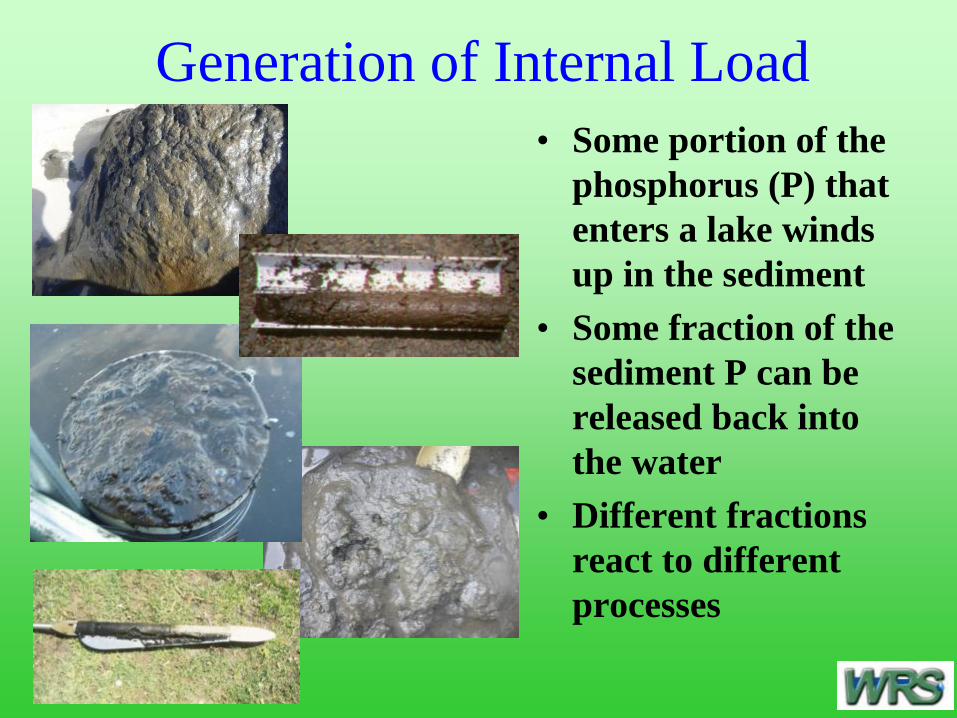
Generation of Internal Load • Some portion of the
phosphorus (P) that enters a lake winds up in the sediment
• Some fraction of the sediment P can be released back into the water
• Different fractions react to different processes

Key processes in internal loading • P bound as organic matter may be released upon
decay • P bound as calcium may be released under low pH • P bound as iron may be released under low oxygen • P bound as aluminum tends not to be released • Rooted plants can extract P from most sediment
forms, and may release some of it into the water column
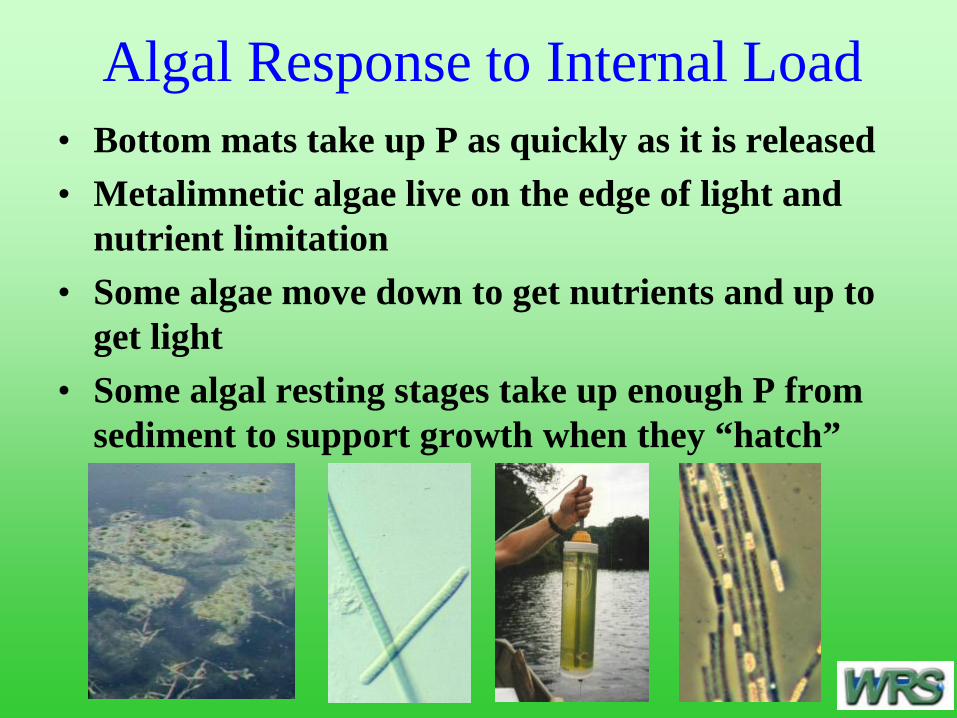
Algal Response to Internal Load • Bottom mats take up P as quickly as it is released • Metalimnetic algae live on the edge of light and
nutrient limitation • Some algae move down to get nutrients and up to
get light • Some algal resting stages take up enough P from
sediment to support growth when they “hatch”

Evaluating Internal Load • Measure P near the bottom and top, and preferably
in between, to look for gradients • Measure P over time to detect accumulation in
bottom or surface waters • Measure forms of P in the sediments; evaluate
potential releases

Key Sediment P Fractions

Phosphorus Inactivation Phosphorus binding to
reduce availability – “anti-fertilizer”
treatments

Binder Options ♦ Iron is the most
common natural binder, but does not hold P under anoxia
♦ Aluminum is the most common applied binder, multiple forms, permanent results, toxicity issues
♦ Calcium used in some high pH systems
♦ Binders used for water column or sediment P

When to use Aluminum • Internal P load is high relative to external load, or
external load is pulsed such that limited treatment covers much of the annual load
• Detention time is high; short term loading won’t drastically change conditions
• pH is 6-8 and alkalinity (buffer capacity) is high (>20 ppm, preferably >40ppm) during treatment
• Potentially sensitive receptors are few, or avoidable, or impacts are acceptable
• Rooted plant density in the targeted area at the time of treatment is low
Factors in Planning Treatments • Problem to be solved: algal blooms due to high P • Existing P load, internal vs external • Sources and inactivation needs – field and lab tests • System bathymetry and hydrology • Potential water chemistry alteration - pH, metals
levels, oxygen concentration • Potentially sensitive receptors - fish, zooplankton,
macroinvertebrates, reptiles, amphibians, waterfowl
• Accumulated residues - quantity and quality
Phosphorus Inactivation by Aluminum
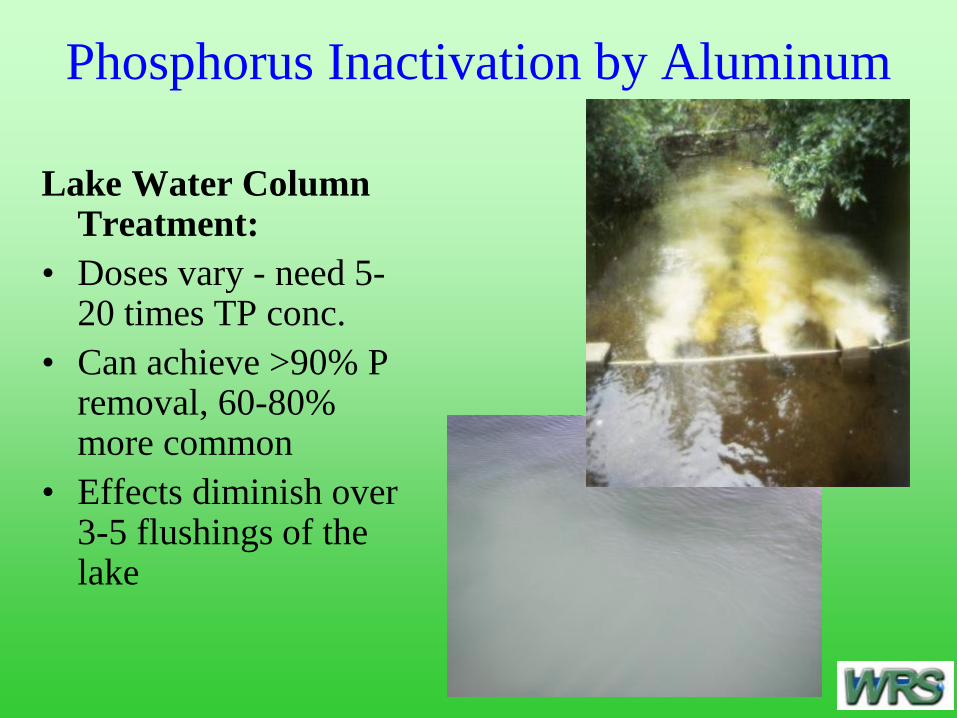
Lake Water Column Treatment:
• Doses vary - need 5- 20 times TP conc.
• Can achieve >90% P removal, 60-80% more common
• Effects diminish over 3-5 flushings of the lake
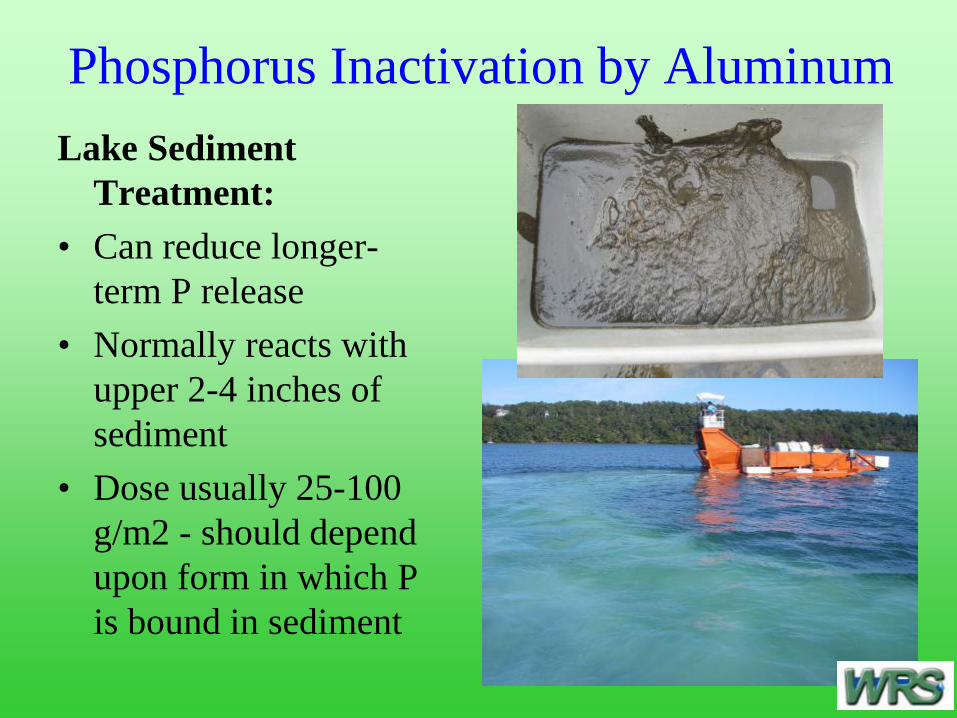
Phosphorus Inactivation by Aluminum Lake Sediment
Treatment: • Can reduce longer-
term P release • Normally reacts with
upper 2-4 inches of sediment
• Dose usually 25-100 g/m2 - should depend upon form in which P is bound in sediment

Sediment Dose Calculation • Oldest approach is to treat at maximum level that maintains
pH >6; may need to do jar tests and repeat application over time to achieve goal
• Alternative older method is to measure accumulated hypolimnetic P during stratification, or change in lake P over a dry period, or release from incubated sediment, translate into sediment P concentration (per square meter), then treat with dose at least 10 times that level on areal basis – buffer if necessary to control pH
• Most current approach is to determine available P in sediment (Rydin and Welch method), treat aliquots of sediment slurry with aluminum, re-test for P availability, graph results and evaluate in context of target P level, diminishing returns, and cost; dose of 10 to 100 times available sediment P level expected

Sediment Dose Calculation Sediment P response curve, based on aluminum dosing
Lake PocotopaugAvailable Sediment P Reduction (%) vs.
Aluminum Dose (g/m2)
0102030405060708090
100
0 50 100 150 200Al dose (g/m2)
% R
educ
tion
in a
vail.
P

Methods for Minimizing Aluminum Toxicity
• Aluminum dose at any one time should be <10 mg/L, preferably <5 mg/L
• When buffering alum with aluminate, use a 2:1 ratio of alum to aluminate, by volume, to avoid pH change (can be adjusted – 1.8 to 2.1 common)
• Treat defined areas of the lake in a pattern that minimizes contiguous area treated at once (patchwork with adjacent blocks not treated sequentially)
• Apply aluminum at enough depth to create a surface refuge (can even treat below thermocline)

Hamblin Pond Example Cape Cod, MA
• P levels related to old
duck farm, could not use multi-million $ beach

Hamblin Pond Example Cape Cod, MA
P levels dramatically
reduced, water clarity substantially increased
for 18 years so far

Long Pond Example, Cape Cod, MA 370 acres of a 740 ac lake treated; everywhere >30 ft deep

Long Pond Example Cape Cod, MA
Aluminum sulfate and
sodium aluminate distribution
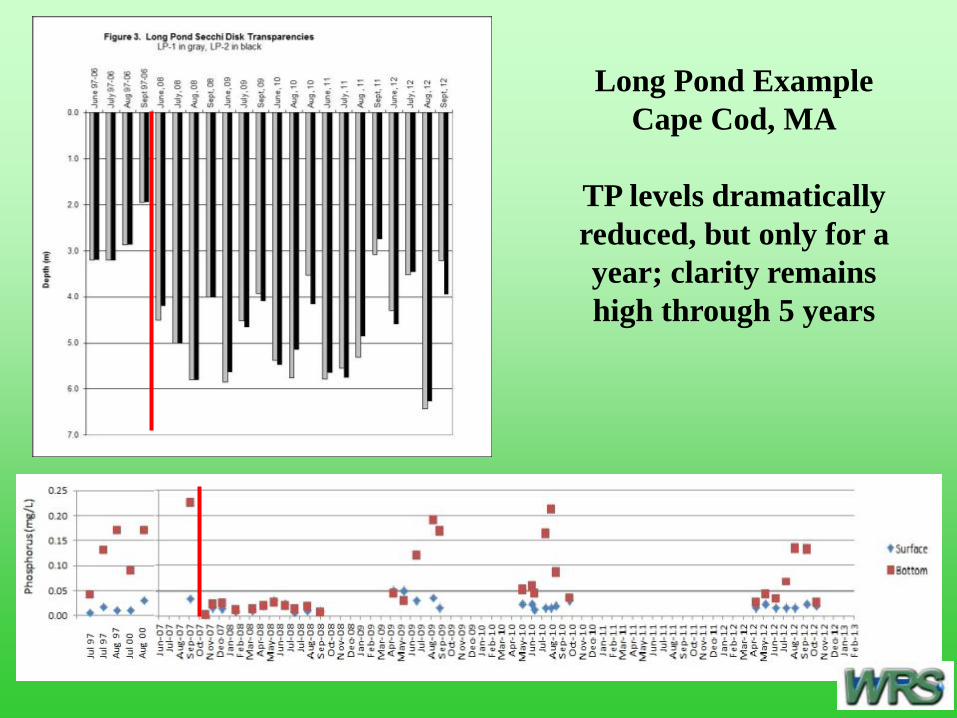
Long Pond Example Cape Cod, MA
TP levels dramatically reduced, but only for a year; clarity remains high through 5 years
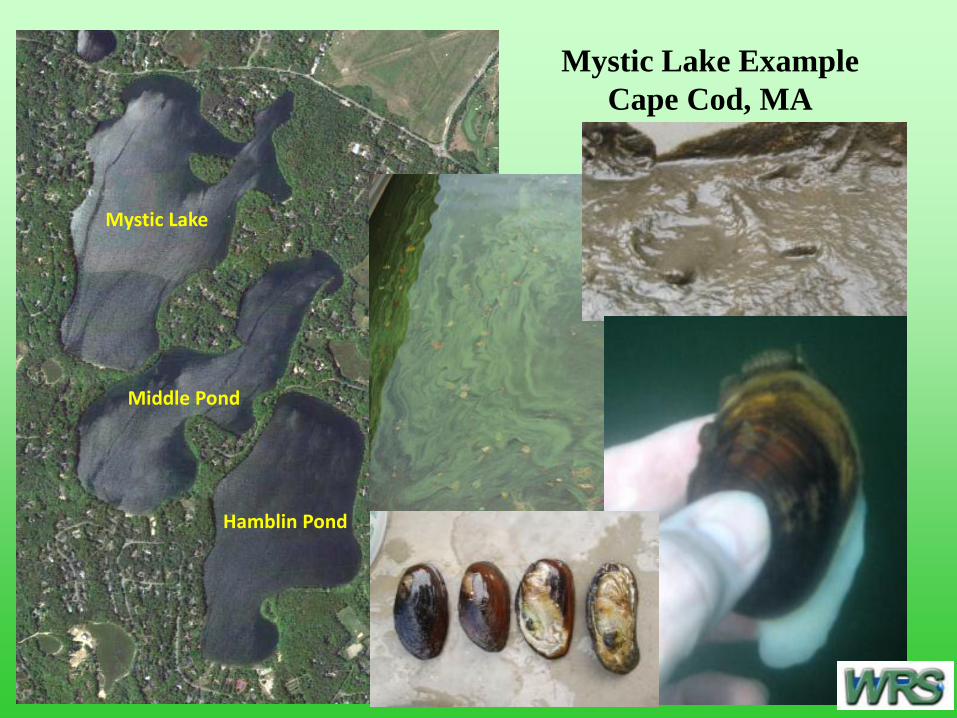
Mystic Lake Example Cape Cod, MA
Mystic Lake
Middle Pond
Hamblin Pond
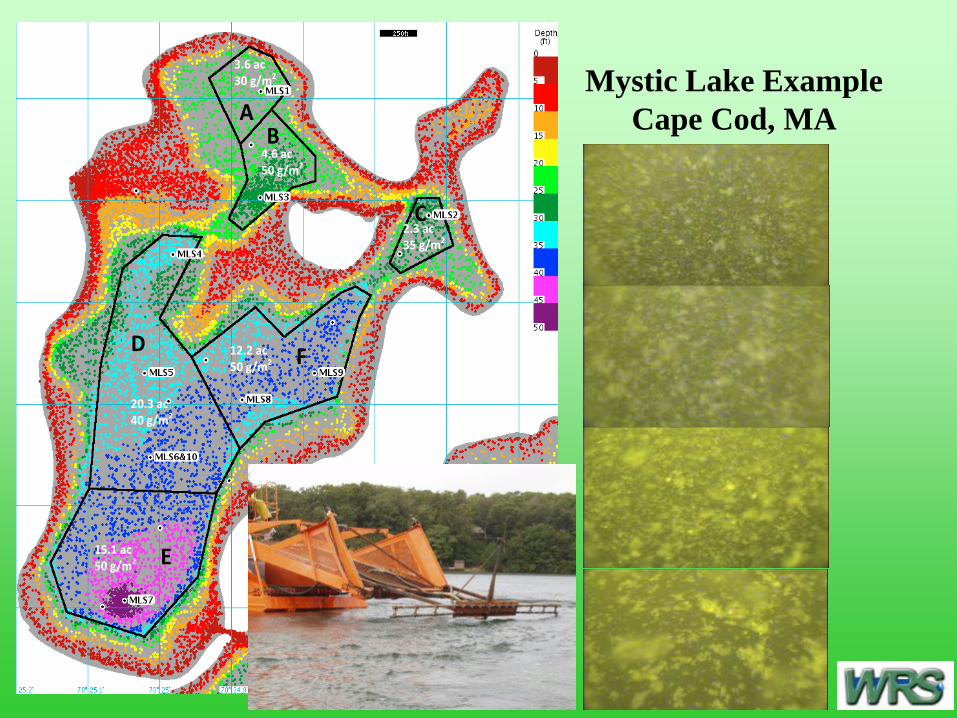
Mystic Lake Example Cape Cod, MA
3.6 ac 30 g/m2
2.3 ac 35 g/m2
4.6 ac 50 g/m2
20.3 ac 40 g/m2
15.1 ac 50 g/m2
12.2 ac 50 g/m2
A B
C
D
E
F
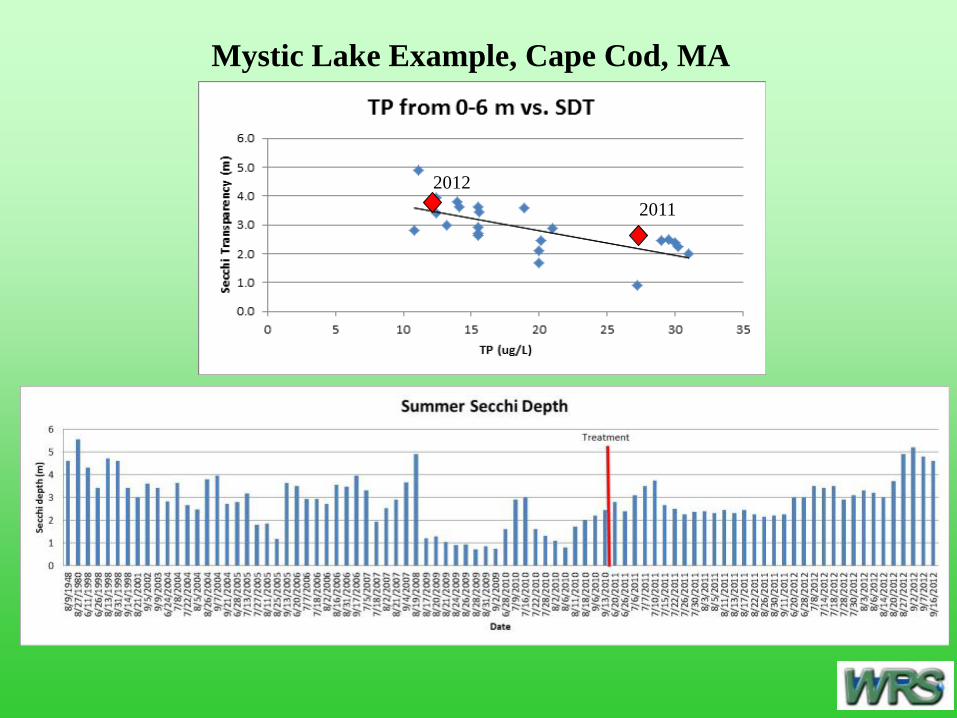
Mystic Lake Example, Cape Cod, MA
2011 2012

Mystic Lake Example, Cape Cod, MA
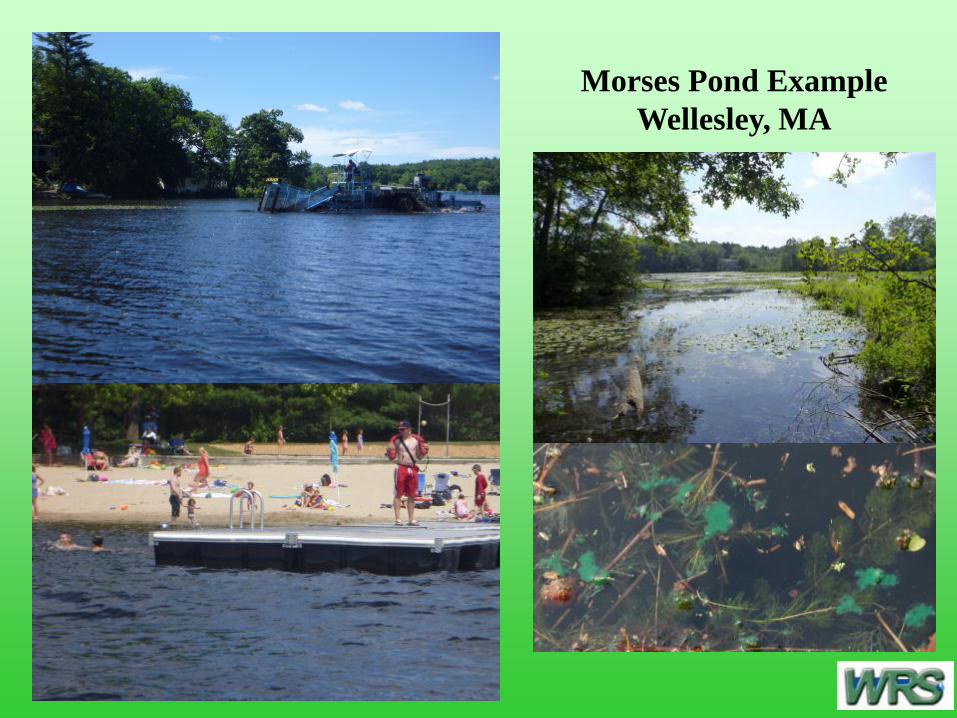
Morses Pond Example Wellesley, MA
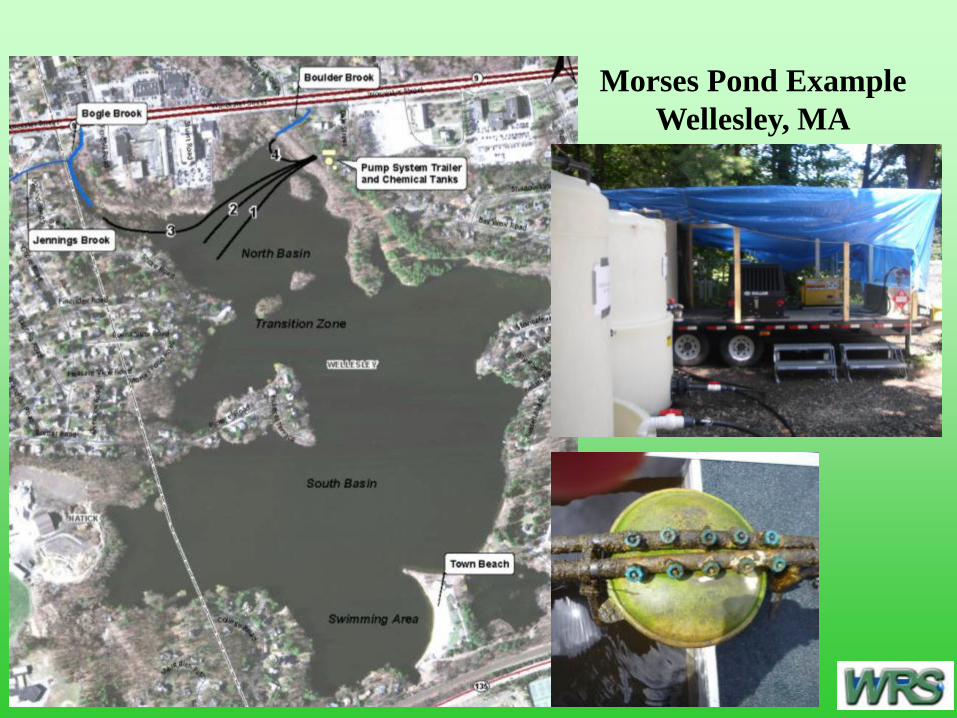
Morses Pond Example Wellesley, MA
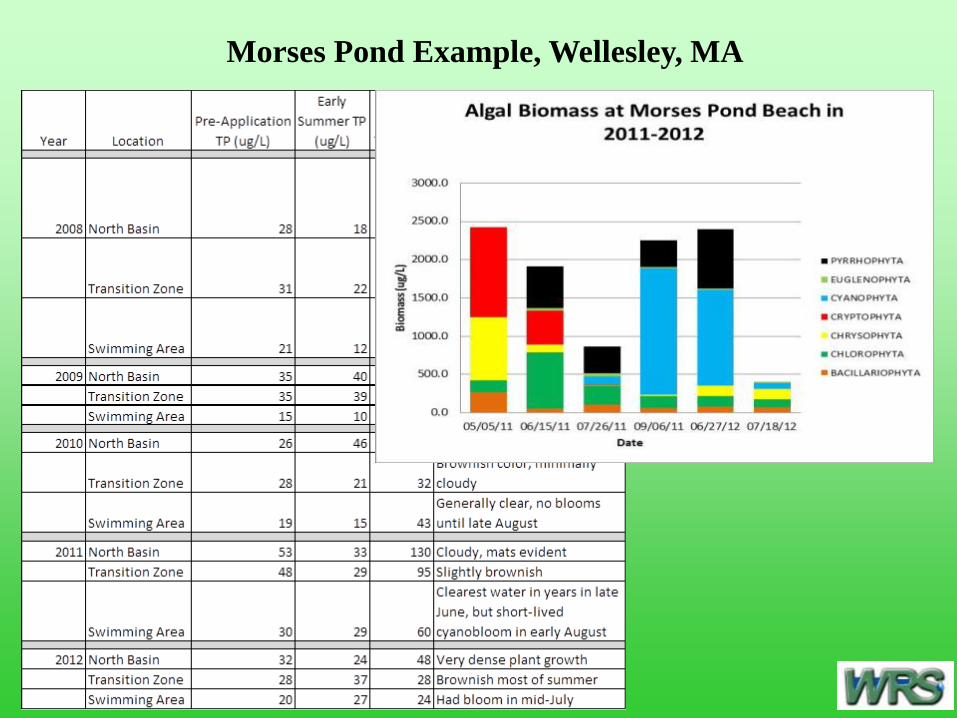
Morses Pond Example, Wellesley, MA
The End
QUESTIONS?
Keep drinking…we don’t want the
nutrients to settle out!