Embed Size (px)
DESCRIPTION
DNA-based stock-of-origin assignment of Chinook salmon smolts outmigrating past Chandler trap for years 2004-2008: Computational error, methodological concerns, and outmigration trends. Kenneth I. Warheit Todd W. Kassler WDFW, Molecular Genetics Lab. - PowerPoint PPT Presentation
Citation preview

DNA-based stock-of-origin assignment of Chinook salmon smolts outmigrating past Chandler trap for
years 2004-2008:
Computational error, methodological concerns, and outmigration trends
Kenneth I. WarheitTodd W. Kassler
WDFW, Molecular Genetics Lab
Yakima Basin Science & Management Conference Ellensburg, WA June 17, 2009

Project Summary• Five populations (baseline)
Upper Yakima River – Spring Naches River – Spring American River – Spring Lower Yakima river – Fall Marion Drain – Fall
• DNA samples from outmigrating smolts collected at Chandler Trap
• Data from eight brood years (2000-2008)
• Standardized (GAPS) markers and proportional sampling since 2004 (5 years)
Benton City
Yakim a
Cle ElumHatchery
RozaDam
Naches
R iver
River
R iver
Yakima
Yakima
upper
lower
M arion Drain
Am erican
River
Chandler trap
10 km 5 m iles
N
W E
S

Previous Reports & Talks
• Separately for each year and season (Jan-Feb,
Mar, Apr, May, Jun-Jul) assign smolts to populations 20 independent assignments (5 years x 5 seasons)
Conditional likelihood / partial Bayesian Procedure (e.g., GMA, ONCOR)
• “Power” analysis of baseline e.g., Jackknife assignments

New Stuff – presented here
• Power analysis of baseline Model-based Calculates probability of correct assignment
• Population assignment of smolts Hierarchical conditional-likelihood
• Considers all samples from all years and seasons simultaneously• Bi-weekly population assignment
Outmigration trends
All models and analyses written in R or Matlab by Warheit

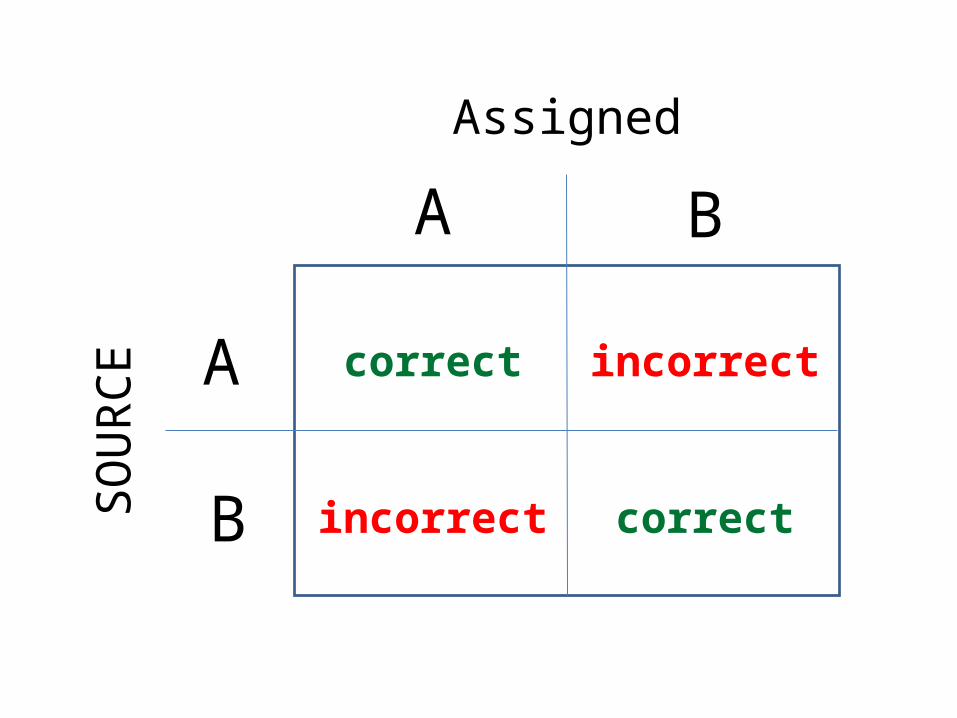
Power Analysis
• How good is the baseline for assigning smolts to populations?
• Many methods Jackknife (“leave-one-out”) 100% simulations Cross-validation method (Anderson et al., 2008) Prob (assignment | population)
• Model used here: Building on Anderson et al. Prob (population | assignment) Probability of the correct assignment
A B
A
BSOU
RCE
Assigned
correct
correct
incorrect
incorrect
Population
American LoYakimaF MarionD Naches upYakimaSp
p (
po
pu
latio
n |
ass
ign
me
nt)
"pro
babi
lity
of c
orre
ct a
ssig
nmen
t"
0.75
0.80
0.85
0.90
0.95
1.00
Median
Mean

Population
American LoYakimaF MarionD Naches upYakimaSp
p (
ass
ign
to lo
wY
aki
ma
F |
po
pu
latio
n)
0.0
0.1
0.2
0.8
0.9
1.0

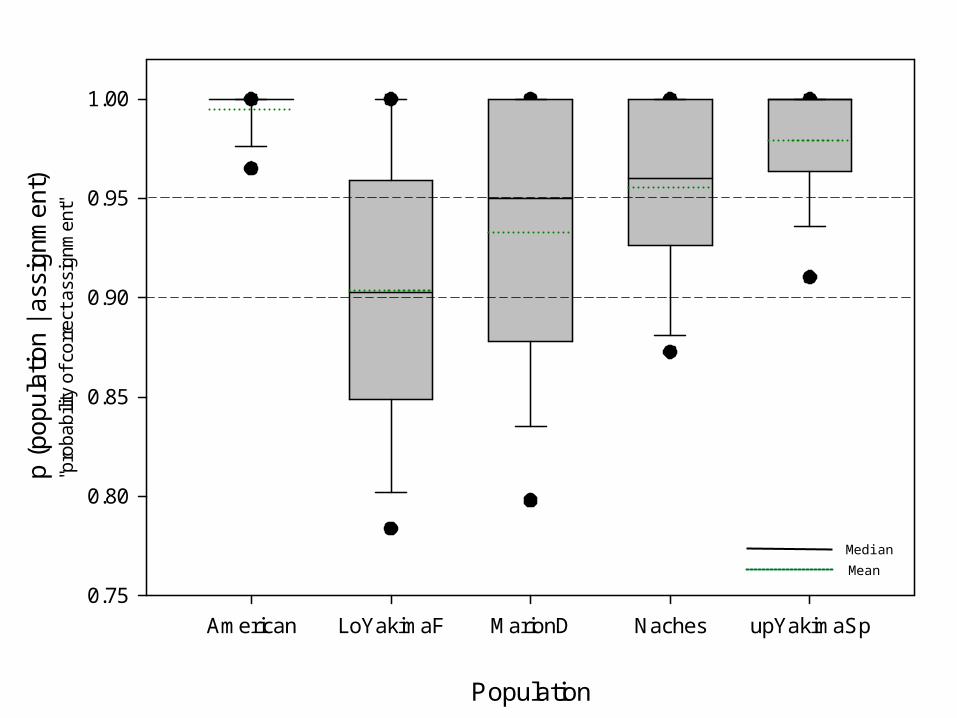
Population Assignment
• No details of methods Hierarchical approach Informed priors at each level in the hierarchy Sufficient power to assign bi-weekly, rather than monthly
• Population trends of outmigrating smolts Within a year Differences among years
• For each population: Year-to-year variability of migration timing Within a year compare timing among populations

POPULATION TRENDS
• 5 populations• 5 years (2004-2008)• 14 time periods (early and late, Jan – July)• 25 trends with 14 data points for each trend

2004
Jan-
early
Jan-
late
Feb-e
arly
Feb-la
te
Mar
-ear
ly
Mar
-late
Apr-e
arly
Apr-la
te
May
-ear
ly
May
-late
Jun-
early
Jun-
late
Jul-e
arly
Pop
ulat
ion
Pro
port
ions
0.0
0.2
0.4
0.6
0.8
1.0 upYakimaR - sp

2004
Jan-
early
Jan-
late
Feb-e
arly
Feb-la
te
Mar
-ear
ly
Mar
-late
Apr-e
arly
Apr-la
te
May
-ear
ly
May
-late
Jun-
early
Jun-
late
Jul-e
arly
Pop
ulat
ion
Pro
port
ions
0.0
0.2
0.4
0.6
0.8
1.0 upYakimaR - splowYakima - f

2004
Jan-
early
Jan-
late
Feb-e
arly
Feb-la
te
Mar
-ear
ly
Mar
-late
Apr-e
arly
Apr-la
te
May
-ear
ly
May
-late
Jun-
early
Jun-
late
Jul-e
arly
Pop
ulat
ion
Pro
port
ions
0.0
0.2
0.4
0.6
0.8
1.0 AmericanRNachesRupYakimaR_spMarionD_flowYakimaR_f

Jan-
early
Jan-
late
Feb-e
arly
Feb-la
te
Mar
-ear
ly
Mar
-late
Apr-e
arly
Apr-la
te
May
-ear
ly
May
-late
Jun-
early
Jun-
late
Jul-e
arly
Jul-la
te
Po
pu
latio
n P
rop
ort
ion
s
0.0
0.2
0.4
0.6
0.8
1.0

Jan Feb Mar Apr May Jun Jul
20042005
AmericanR 20062007200820042005
NachesR 20062007200820042005
upYakimaR 20062007200820042005
lowYakimaR_fall 20062007200820042005
MarionD_fall 200620072008
0
0.1
0.2
0.3
0.4
0.5
0.6
0.7
0.8
0.9
1
Population Proportions of Smolts at ChandlerBy Year and Bi-week
Relative Abundance

TIMING OF OUTMIGRATION
• New method – no details• Independent trends for each stock• Sampling effects are removed• Trends expressed as deviations from total outmigration of all pops

2008
Jan-
early
Jan-
late
Feb-e
arly
Feb-la
te
Mar
-ear
ly
Mar
-late
Apr-e
arly
Apr-la
te
May
-ear
ly
May
-late
Jun-
early
Jun-
late
Jul-e
arly
Jul-la
te
Sta
nd
ard
ize
d T
em
po
ral P
rop
ort
ion
s
-0.4
-0.3
-0.2
-0.1
0.0
0.1
0.2
0.3
0.4
AmericanRNachesRupYakimaR_spMarionD_flowYakimaR_f

2005
Jan-
early
Jan-
late
Feb-e
arly
Feb-la
te
Mar
-ear
ly
Mar
-late
Apr-e
arly
Apr-la
te
May
-ear
ly
May
-late
Jun-
early
Jun-
late
Jul-e
arly
Jul-la
te
Sta
nd
ard
ize
d T
em
po
ral P
rop
ort
ion
s
-0.3
-0.2
-0.1
0.0
0.1
0.2
0.3
AmericanRNachesRupYakimaR_spMarionD_flowYakimaR_f

2007
Jan-
early
Jan-
late
Feb-e
arly
Feb-la
te
Mar
-ear
ly
Mar
-late
Apr-e
arly
Apr-la
te
May
-ear
ly
May
-late
Jun-
early
Jun-
late
Jul-e
arly
Jul-la
te
Sta
nd
ard
ize
d T
em
po
ral P
rop
ort
ion
s
-0.4
-0.2
0.0
0.2
0.4
0.6
AmericanRNachesRupYakimaR_spMarionD_flowYakimaR_f

2006
Jan-
early
Jan-
late
Feb-e
arly
Feb-la
te
Mar
-ear
ly
Mar
-late
Apr-e
arly
Apr-la
te
May
-ear
ly
May
-late
Jun-
early
Jun-
late
Jul-e
arly
Jul-la
te
Sta
nd
ard
ize
d T
em
po
ral P
rop
ort
ion
s
-0.4
-0.2
0.0
0.2
0.4
0.6
AmericanRNachesRupYakimaR_spMarionD_flowYakimaR_f

2004
Jan-
early
Jan-
late
Feb-e
arly
Feb-la
te
Mar
-ear
ly
Mar
-late
Apr-e
arly
Apr-la
te
May
-ear
ly
May
-late
Jun-
early
Jun-
late
Jul-e
arly
Jul-la
te
Sta
nd
ard
ize
d T
em
po
ral P
rop
ort
ion
s
-0.2
-0.1
0.0
0.1
0.2
0.3
0.4
AmericanRNachesRupYakimaR_spMarionD_flowYakimaR_f

Conclusions
• Baseline sufficient power to assign smolts to populations
• Spring stocks dominate outmigration January – late May or early June
• Lower Yakima fall dominant population June and July
• Among spring pops: upYakima > Naches > American

Conclusions
• Timing of outmigration variable among years, but some patterns: Outmigration not necessarily synchronous upYakima earlier than Naches and American Some years with two “waves” of spring
outmigration: late Jan-early Feb and then late April/early May
March either no sampling or few fish

Acknowledgements
• Funding: BPA and Washington State General Fund
• Yakima Nation: Mark Johnston and crew (sampling), Dave Lind, Bill Bosch, Doug Neeley, Dave Fast (data and coordination)
• WDFW Laboratory: Jennifer von Bargen, Norm Switzler
• WDFW YKFP Coordination: Todd Pearsons (now Grant Co.
PUD), Andrew Murdock, Molly Kelly, John Easterbrooks, Anthony Fritts, Scott Blankenship