Embed Size (px)
Citation preview
Groundwater Overdraft and Management
Kenneth D. SchmidtPrincipalKenneth D. Schmidt & Associates
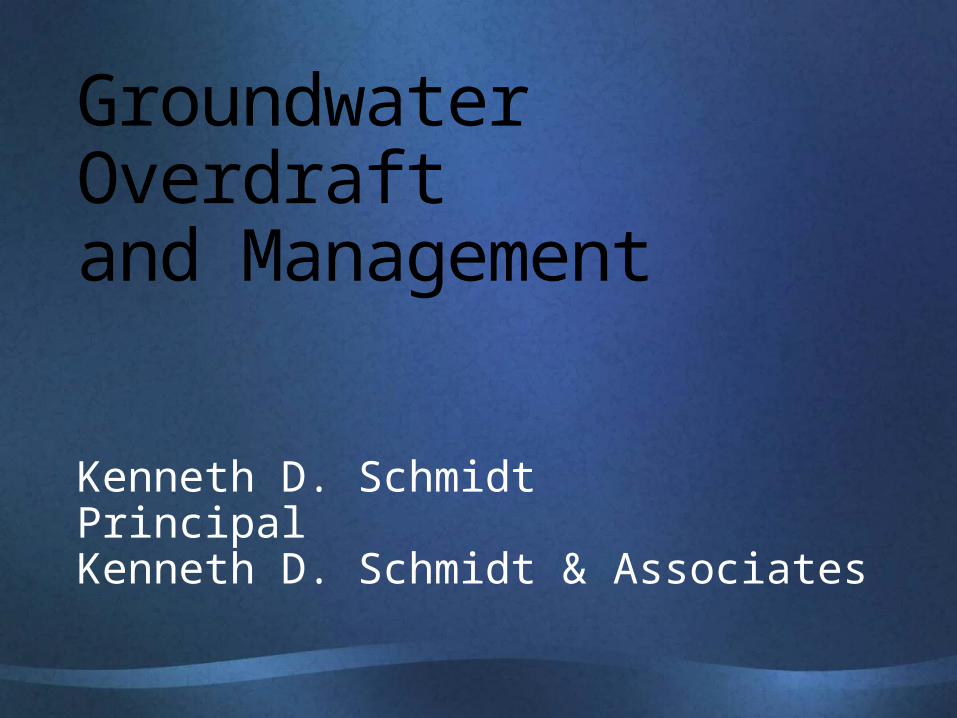
Water-Level Hydrographs for Wells East of Sanger
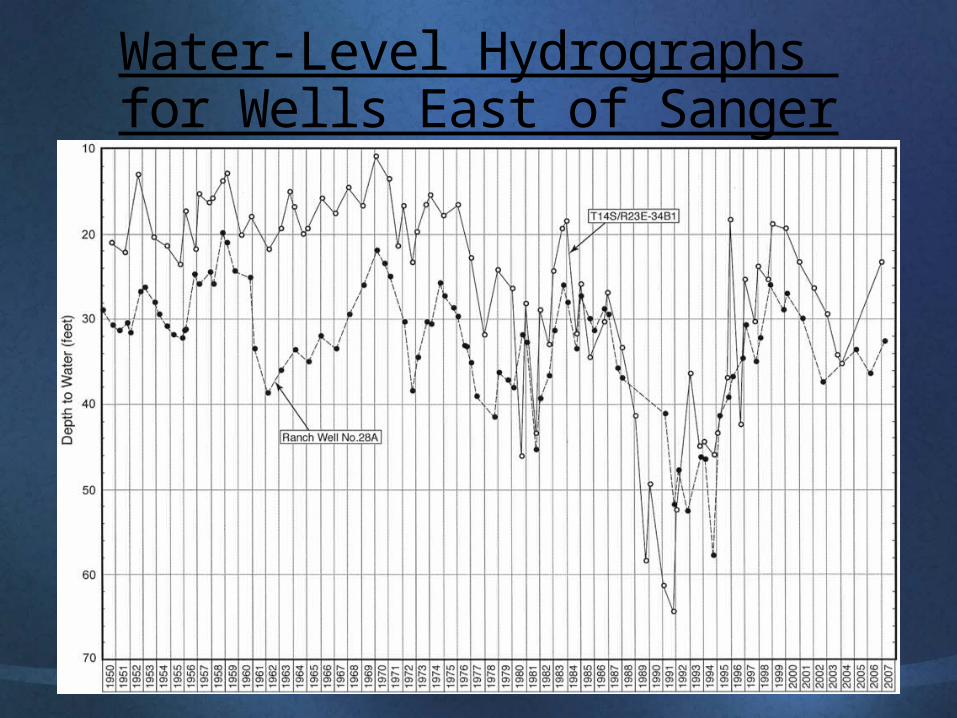
Water-Level Hydrographs for Well Southwest of Madera
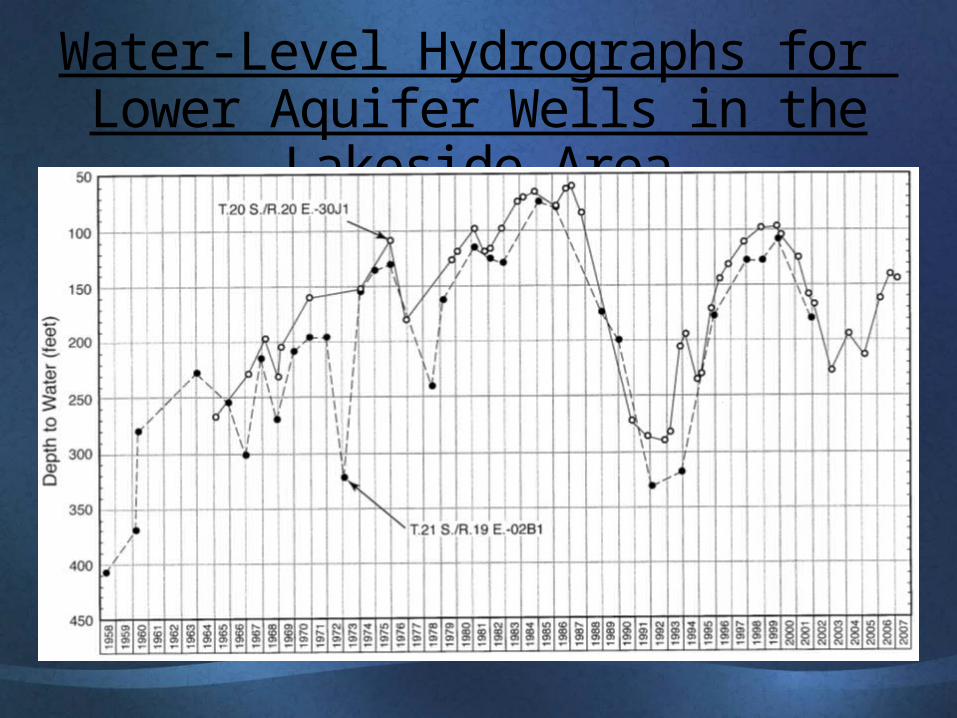
Water-Level Hydrographs for Lower Aquifer Wells in the Lakeside Area
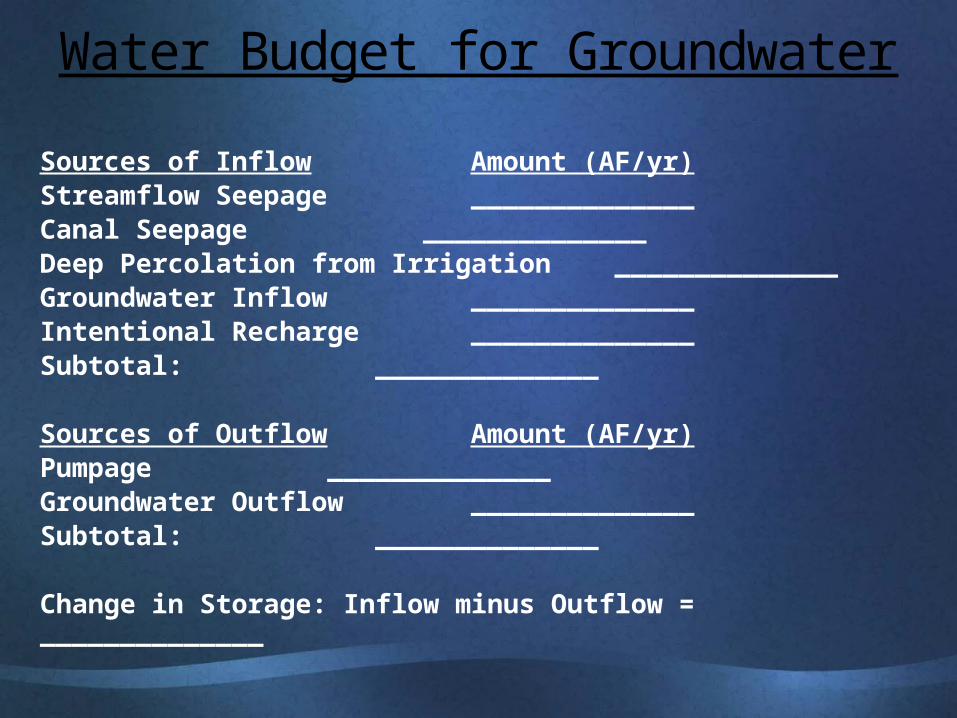
Water Budget for Groundwater
Sources of Inflow Amount (AF/yr)Streamflow Seepage ______________Canal Seepage ______________Deep Percolation from Irrigation ______________Groundwater Inflow ______________Intentional Recharge ______________Subtotal: ______________
Sources of Outflow Amount (AF/yr)Pumpage ______________Groundwater Outflow ______________Subtotal: ______________
Change in Storage: Inflow minus Outflow = ______________
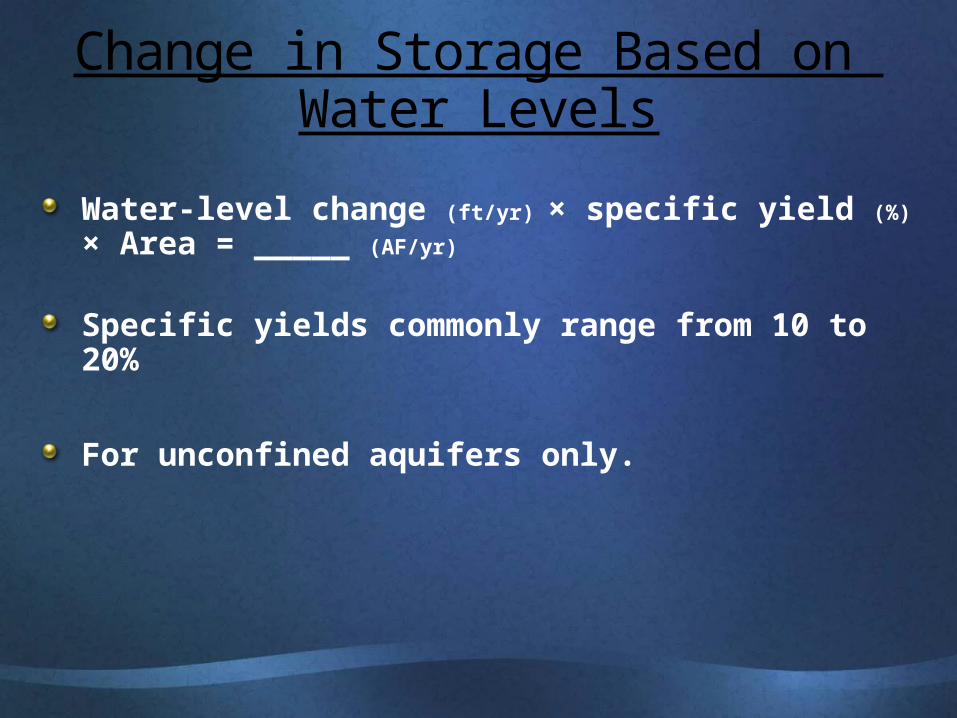
Change in Storage Based on Water Levels
Water-level change (ft/yr) × specific yield (%) × Area = _____ (AF/yr)
Specific yields commonly range from 10 to 20%
For unconfined aquifers only.
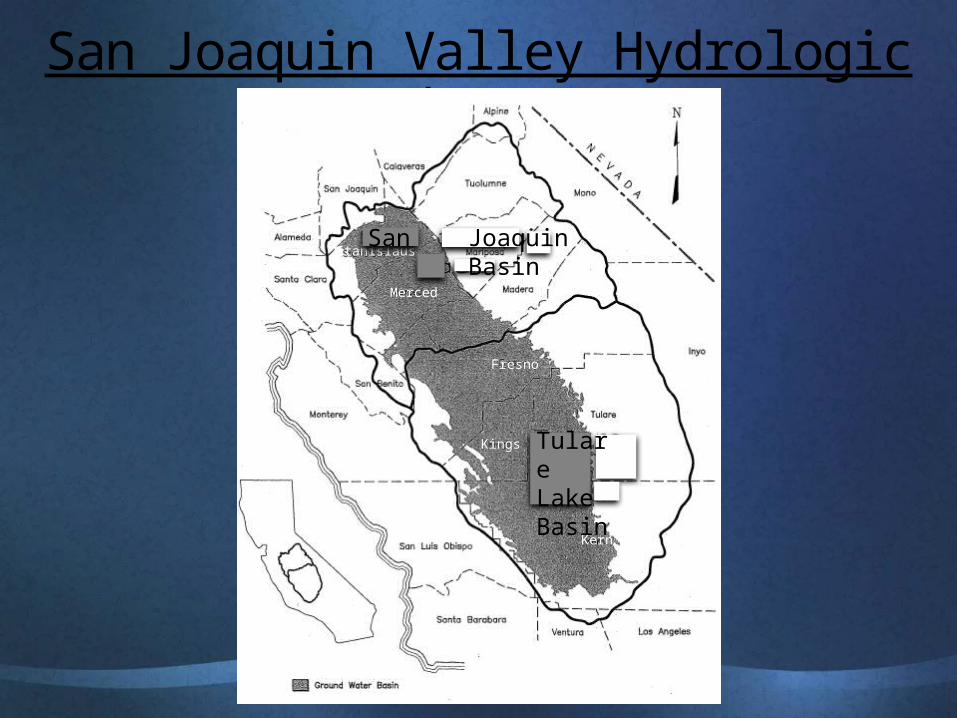
San Joaquin Valley Hydrologic Study Areas
Kings
Fresno
Merced
Stanislaus
Kern
San Joaquin Basin
TulareLake Basin
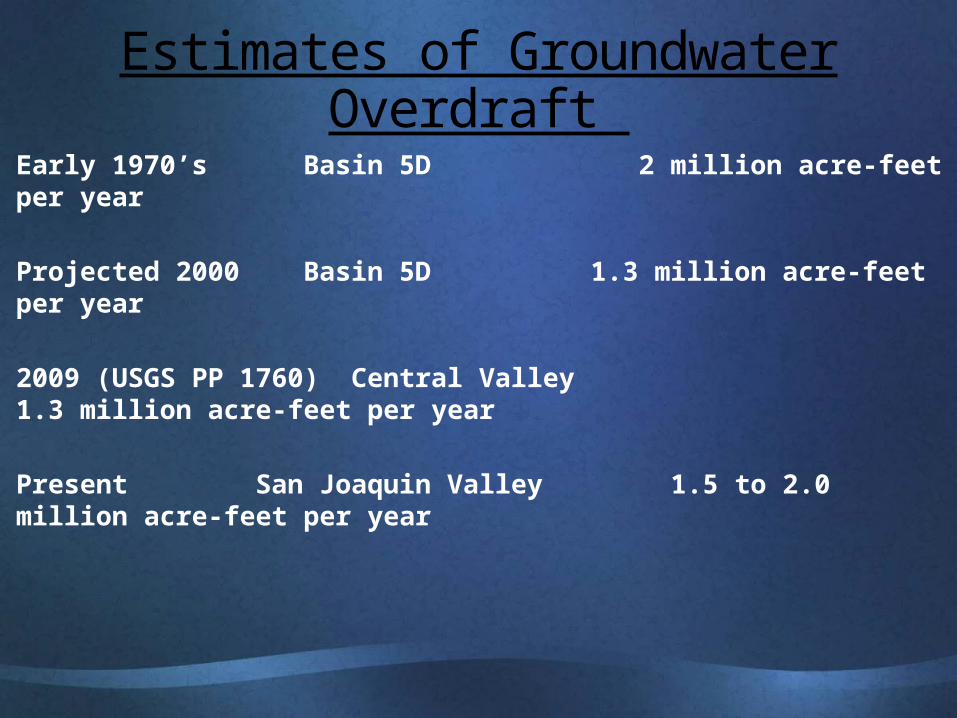
Estimates of Groundwater Overdraft
Early 1970’s Basin 5D 2 million acre-feet per year
Projected 2000 Basin 5D 1.3 million acre-feet per year 2009 (USGS PP 1760) Central Valley 1.3 million acre-feet per year
Present San Joaquin Valley 1.5 to 2.0 million acre-feet per year
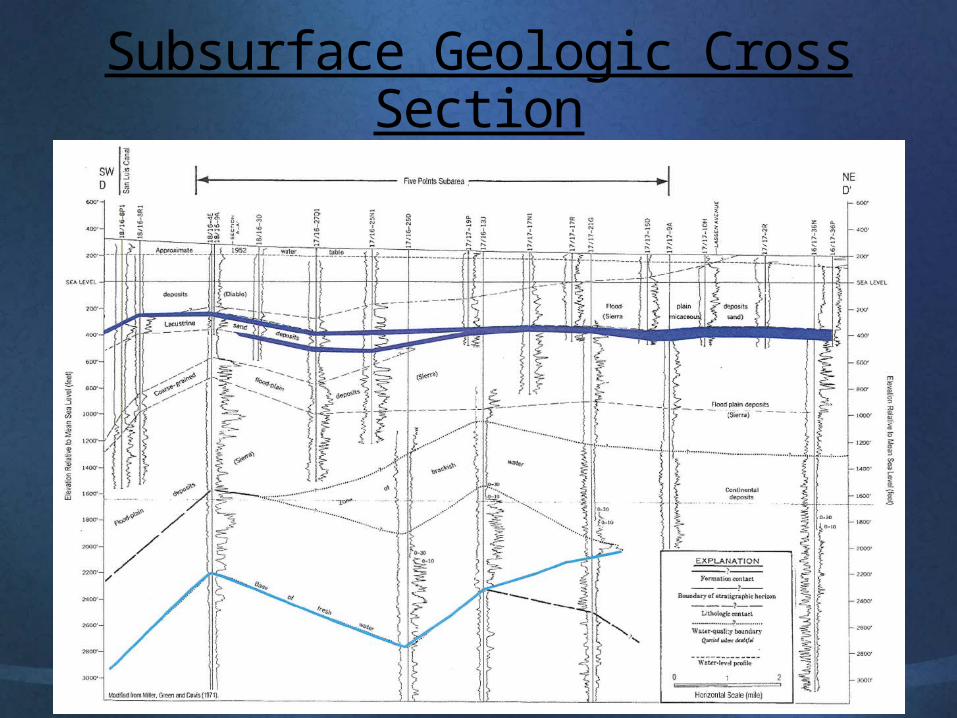
Subsurface Geologic Cross SectionBeneath Five Points Subarea
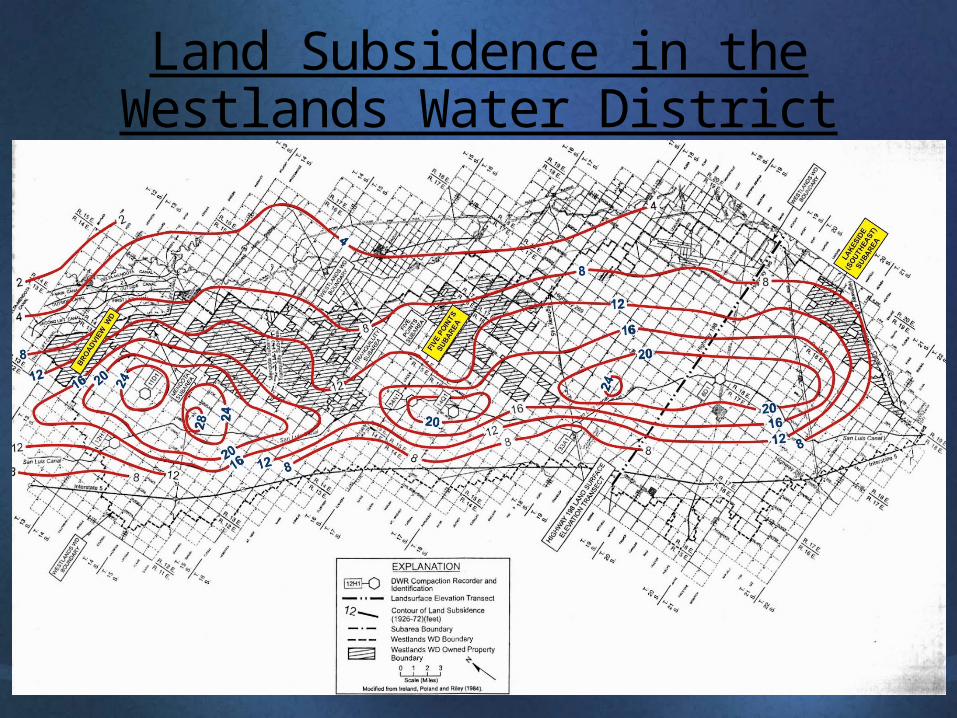
Land Subsidence in the Westlands Water District (1926-1972)
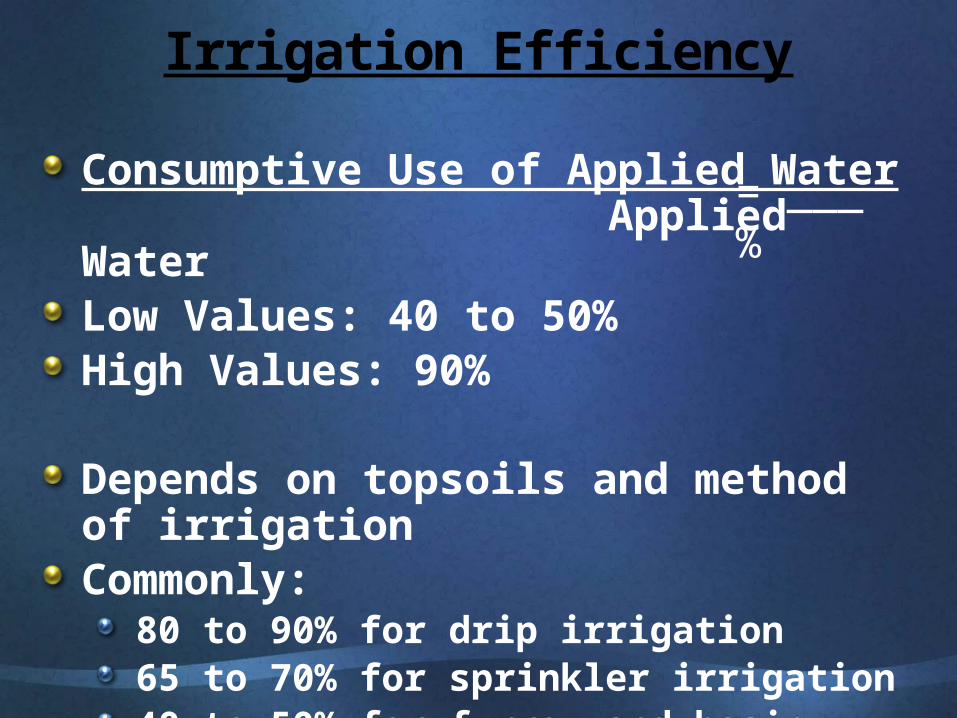
Irrigation Efficiency
Consumptive Use of Applied Water Applied Water
Low Values: 40 to 50%High Values: 90%
Depends on topsoils and method of irrigationCommonly:
80 to 90% for drip irrigation65 to 70% for sprinkler irrigation40 to 50% for furrow and basin irrigation
= ___ %
Impact of DifferentIrrigation Efficiencies
Low irrigation efficiencies in areas with surface water supplies resulted in large amounts of recharge of low salinity water, spread out over large areas.
High irrigation efficiencies result in less recharge from irrigation and higher increases in salinity for the shallow groundwater.
Sustainable Groundwater Pumpage
Compare the amount of surface water available to the consumptive use of applied water.If the surface water is greater than the consumptive use, water levels will rise and there will normally be groundwater outflow.If the surface water is less than the consumptive use, water levels will fall and groundwater inflow will be enhanced.If the surface water and consumptive use are equal, groundwater levels will be stable.The groundwater aquifer should be considered a storage space for surface water, and not a source of water supply itself.
Sustainable Groundwater Pumpage
One interpretation:If one has no surface water and is not next to a river that is a losing stream, then all of the groundwater pumpage is generally not sustainable.The only sustainable groundwater pumpage is where there is adequate surface water to balance the consumptive use, unless there is sustainable groundwater inflow to create a balance.
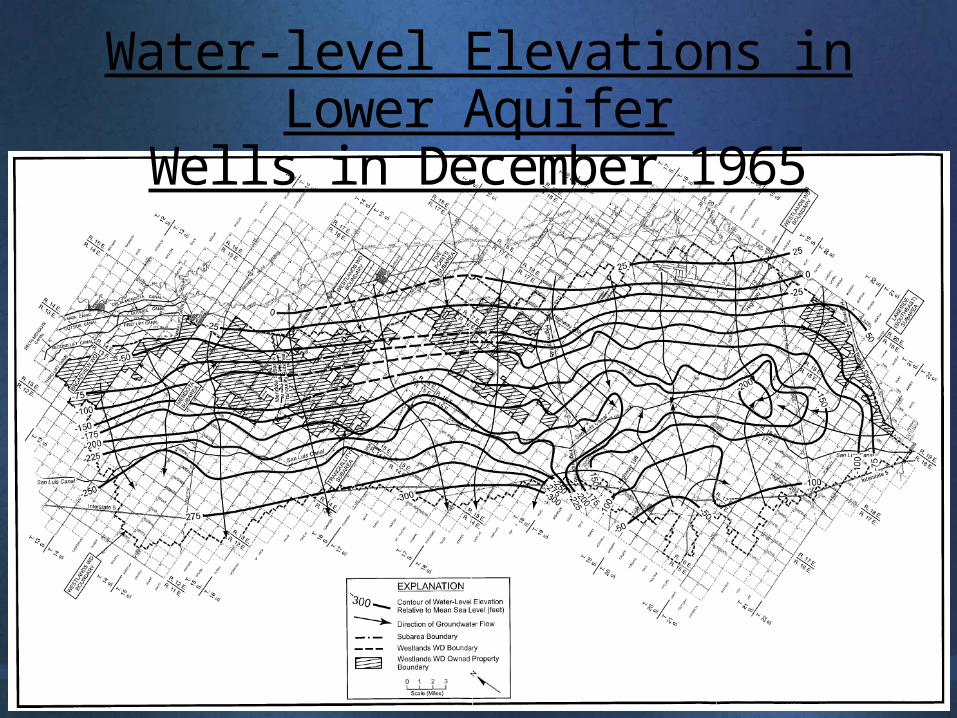
Water-level Elevations in Lower AquiferWells in December 1965
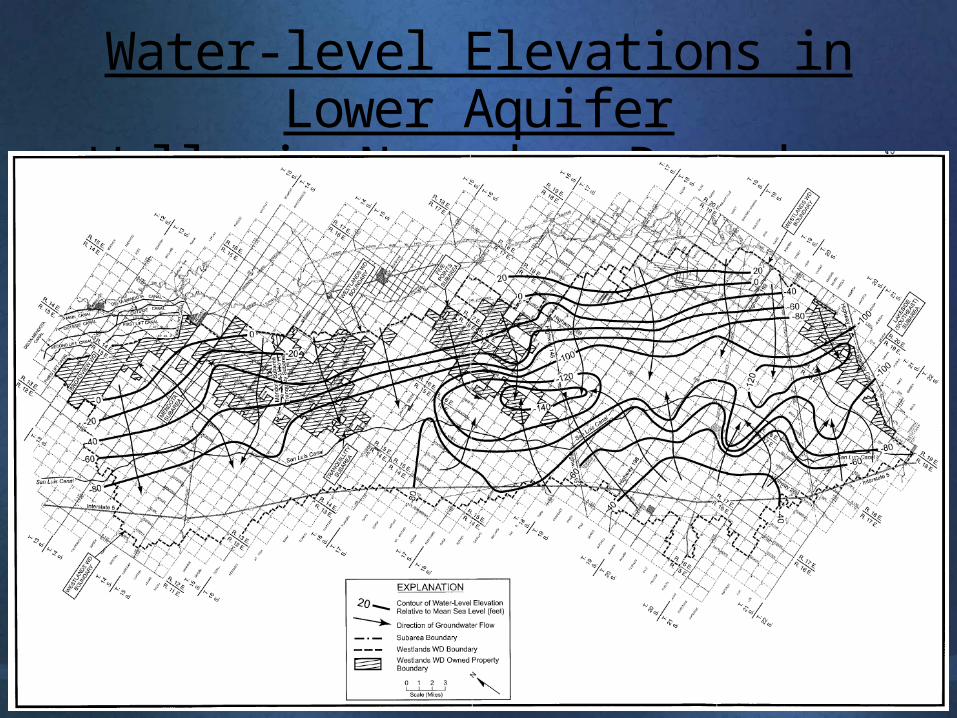
Water-level Elevations in Lower AquiferWells in November-December 1993
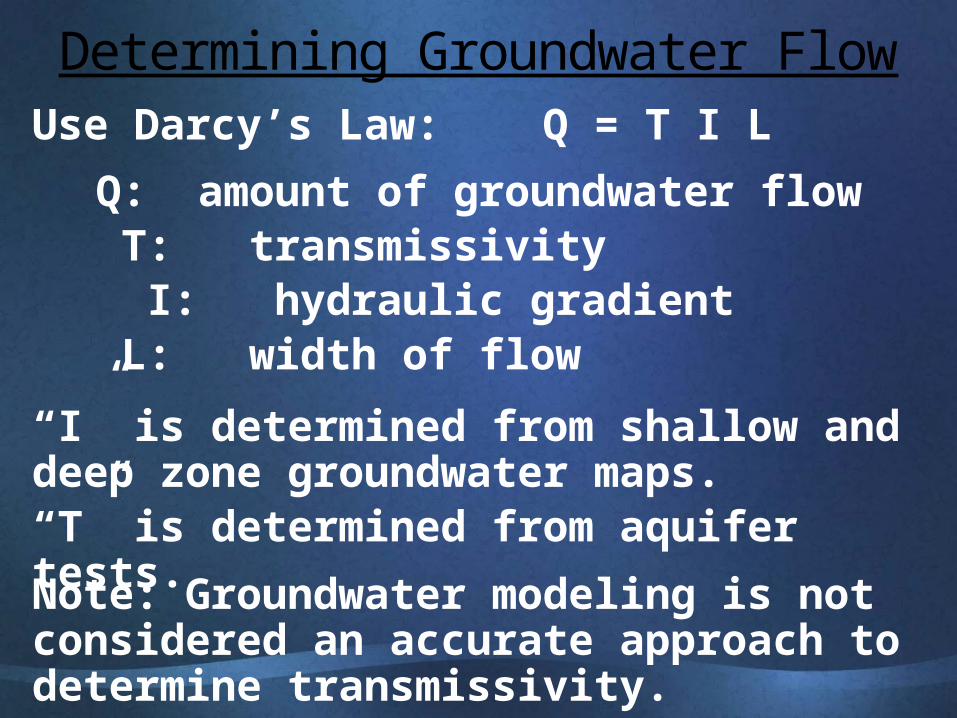
Determining Groundwater FlowUse Darcy’s Law: Q = T I L
Q: amount of groundwater flow T: transmissivity I: hydraulic gradient L: width of flow
“I” is determined from shallow and deep zone groundwater maps.“T” is determined from aquifer tests.
Note: Groundwater modeling is not considered an accurate approach to determine transmissivity.