Embed Size (px)
Citation preview

58
Kendall Major is a junior Business Management major, with minors in Biology and Chemistry. She is a member of the Helen Hardin Honors Program, Business Honors Program, Alpha Lambda Delta, Alpha Epsilon Delta, and Phi Kappa Phi. Her interests include medicine, research, and business. Following graduation, Kendall hopes to attend medical school and become a doctor. In her free time, she loves to run, hike, autocross, and eat at local restaurants.

59
Kendall MajorGenetic diversity and population structure in the clonal plant
Trillium recurvatumFaculty Sponsors
Dr. Jennifer Mandel and Dr. James Moore
60
ABSTRACTTrillium recurvatum, a common understory herb in forests across the cen-tral and eastern United States, provides support for forest structure and is a source of nutrition for deer and ants. This species is not only clonal, but also self-incompatible, meaning that one genetic individual must be pol-linated by another genetic individual. Trillium leaves were collected from the University of Memphis Meeman Biological Field Station, the DNA extracted, and specific loci amplified. Simple Sequence Repeat genetic markers were used in this study to measure the level of genetic diversity. Our results indicate that levels of genetic diversity are high, with clusters of individuals containing multiple genotypes. This study provides the first population genetics study for the Shelby County populations of T. recur-vatum. This data will provide vital information to conservation managers in order to take the necessary action to preserve this species if indicated. Further research will include the amplification of more loci for this pop-ulation and the collection of more individuals from other locations to test for levels of genetic diversity.
61
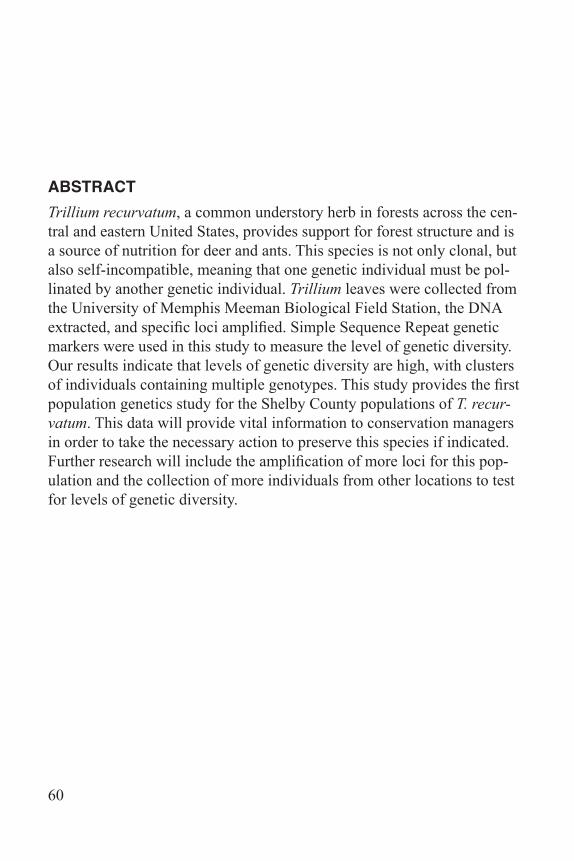
Introduction Trillium recurvatum Beck (common name: Prairie Trillium), Melanthiaceae family, is a long living perennial clonal plant found in the United States. It extends as far north as Michigan, while also extending down into Texas. The species is often found in shady woodland areas with rich, well-drained soil. Flowering typically occurs anywhere from late February to March in partial to full shade. Currently, T. recurvatum is listed by the U.S. federal government as a threatened species in Michigan (Fig. 1). It is also considered rare in Wisconsin, Alabama, North Carolina, Ohio, Texas, Louisiana, and Oklahoma (Fig. 1). In these states, T. recur-vatum, as well as other forest understory species, is threatened by climate change, forest management practices, land-use conversion, and habitat fragmentation (Jules 1998). This species is an understory herb, which means that it is present on the bottom layer of the forest, under the main canopy. Understory herbs have some of the largest species diversity and thus are important in supporting the structure of forests (Gilliam 2007).
Figure 1: BONAP map of Trillium recurvatum. Brown indicates absence, dark green indicates the state in which it is found, light green indicates the specific county, yellow demonstrates rarity, and the light blue indicates that T. recurvatum is adventive in that specific county (Kartesz 2015).
62
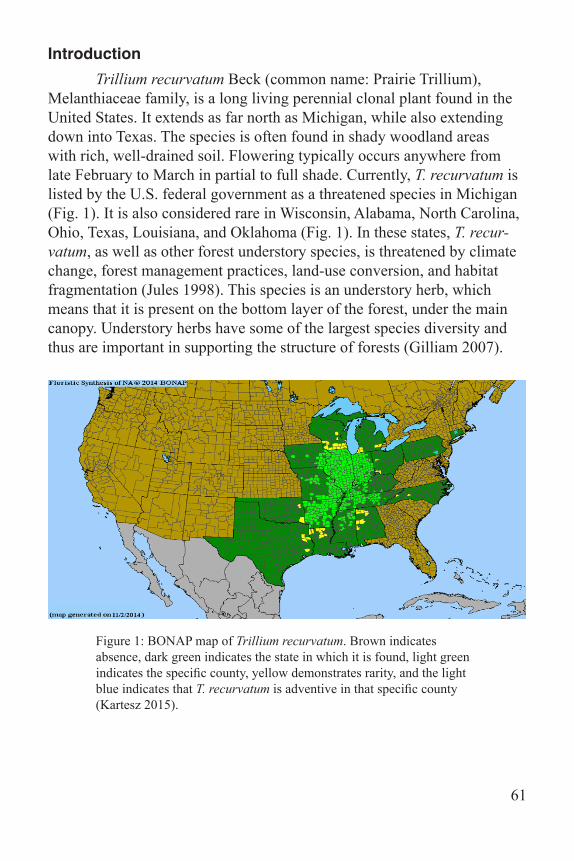
Prairie Trillium is characterized by maroon flowers and mottled leaves. The flowers are pollinated by insects and produce a capsule-like berry. Ants feed on the eliasomes, which are fleshy structures attached to the seed. Once the seeds are discarded, it takes approximately two springs for a juvenile to appear and a minimum of four years for flowers to devel-op (O’Connor 2007). The stems originate from underground rhizomes that slowly spread through the soil. The underground rhizomes then connect multiple T. recurvatum individuals making it a clonal plant. This species has three life history stages: juvenile, flowering, and non-flowering. The juvenile stage is characterized by a single leaf, the non-flowering has three mottled leaves, and the flowering has three mot-tled leaves with a maroon flower in the center (Fig. 2). Flowering plants can revert to non-flowering and vice versa; however, the mechanism by which this occurs is unknown.
An ongoing population demography study has been carried out on a population of T. recurvatum at the University of Memphis Meeman Biological Field Station (referred to hereafter as the Meeman Trillium Population) since 1996. From this study, it was discovered that non-flow-ering ramets had the greatest population growth rate and flowering plants comprised 18% of the population on average (Moore et al. 2012). Al-though T. recurvatum is not rare in Tennessee, understanding patterns of
Figure 2: Life stages of Trillium recurvatum. Red circle represents juvenile, blue circle represents non-flowering adult, and white circle represents flowering adult.
63
clonal genetic diversity in the Meeman Trillium Population coupled with the long-term demographic data offer the possibility of providing unique insight into population genetic dynamics in a clonal species. Moreover, populations of T. recurvatum may display pollen limitation; because the species is self-incompatible, one genetic individual must be pollinated by a different genetic individual (Sawyer 2009). If T. recurvatum demon-strates a high degree of clonality, insect pollinators flying from plant to plant might actually transfer pollen to the same genetic individual where fertilization would be unsuccessful. An understanding of pollen limitation and clonal genetic structuring is also important for extrapolating to popu-lations/sites where the species is rare. Clonal plants are abundant across the planet, often dominating in forest understory, aquatic environments, and extreme conditions (Cook 1983). Without the need for sexual reproduction, which can be a risky strategy in some environments, clonal plants can propagate by rhizomes, tillers, surface runners, etc. (Cook 1983). Each group of genetically iden-tical individuals is called a genet; whereas, an individual stem is known as a ramet. Traditionally, “stem counts” were used to measure population numbers; however, those can overestimate the level of diversity of clonal plants (Mandel 2010). Genetic markers, which are non-invasive, can be used to better estimate the number of genetic individuals and calculate levels of genetic diversity. Clonality can, sometimes, be associated with a low level of genet-ic diversity -- an entire plot could be one genetic individual, connected underground by rhizomes. The ramets possess identical phenotypic and genotypic characteristics; this could be problematic if the specific geno-type were to be adversely affected by a predator or by the environment. The focus of this research is on the genetic diversity of T. recurvatum at the University of Memphis Meeman Biological Field Station. Population genetic markers were used to differentiate genetic individuals, determine the number of genotypes in populations, and measure population levels of genetic diversity. We hypothesized that there would be low levels of genet-ic diversity in the T. recurvatum populations and that the population would consist of just a few distinct genetic individuals i.e., high clonality. In this research, simple sequence repeats (SSR) were used as genetic markers to identify genetic diversity and clonal structure (Mandel 2010). The SSRs, also known as microsatellites, are repeated segments of
64
DNA where each repeat unit is usually 2-5 base pairs long (for example AT, GCC, or CAGT). The microsatellite markers used in this study are the first microsatellites to be developed for this species. Because of the high mutation rate of microsatellites, individuals will vary by the number of re-peat units they contain (Brooker 1999). One can isolate and amplify these repeated regions of the genome via the polymerase chain reaction (PCR) and subject the resulting product to gel electrophoresis. When different individuals differ by one or more repeat units, the PCR products of dif-ferent sizes will migrate at different rates and be distinguishable from one another. The microsatellite markers that were used in the study were devel-oped using a microsatellite enrichment method and subsequent next-gen-eration sequencing provided by the microsatellite discovery services at the Evolutionary Genetics Core Facility (EGCF) at Cornell University. The Core digested two pooled samples of whole genomic T. recurvatum DNA with several restriction enzymes and ligated appropriate adaptors for next-generation sequencing on the Illumina platform. Following this, they performed microsatellite enrichment by hybridization to 3’-biotinylated oligonucleotide repeat probes (for example, ATATATAT). These hybrid-ized fragments were captured by streptavidin-coated magnetic beads and a magnet was used to wash away the unwanted portion of the T. recurvatum genome. After this, the capture fragments were sequenced, and the EGCF used a bioinformatic pipeline to search the sequences for repeats. The EGCF then designed primers for PCR amplification of the microsatellites, and ten of these regions, or loci, were chosen for this project.
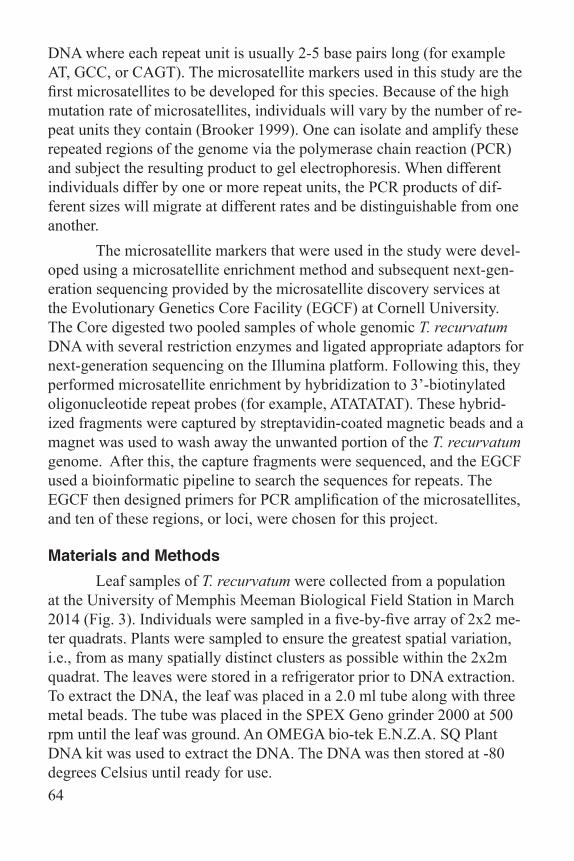
Materials and Methods Leaf samples of T. recurvatum were collected from a population at the University of Memphis Meeman Biological Field Station in March 2014 (Fig. 3). Individuals were sampled in a five-by-five array of 2x2 me-ter quadrats. Plants were sampled to ensure the greatest spatial variation, i.e., from as many spatially distinct clusters as possible within the 2x2m quadrat. The leaves were stored in a refrigerator prior to DNA extraction. To extract the DNA, the leaf was placed in a 2.0 ml tube along with three metal beads. The tube was placed in the SPEX Geno grinder 2000 at 500 rpm until the leaf was ground. An OMEGA bio-tek E.N.Z.A. SQ Plant DNA kit was used to extract the DNA. The DNA was then stored at -80 degrees Celsius until ready for use.
65
Each individual was assessed for purity and measured for nucleic acid concentration by testing it on a NanoDrop Spectrophotometer. One µl of DNA was used in this process. Following the results of the Spectropho-tometer, the DNA was diluted by a factor of 10 based on the concentration of nucleic acids. The individuals were split up into 3 master plates. Master Plates 1 and 2 contain 95 individuals, each with a water control. Master Plate 3 contains 26 individuals and a water control. Polymerase Chain Reaction (PCR) was used to amplify the ex-tracted DNA. Loci 1-10 were run on sample E11 and T4, from Master Plate 3. A master mix composed of 9.55 µl deionized water, 1.5 µl buffer, 0.35 µl MgCl2, 0.2 µl dNTPs, 0.35 µl forward primer at 5 µM, 0.35 µl of reverse primer at 20 µM, 0.70 µl M13 (FAM, NED, or VIC), and 1.0 µl Taq polymerase in a micro-centrifuge tube. Primers with and without extra base pairs were used in this experiment (Table 1). The reverse primer had extra base pairs (GTTTCTT) so that it would further stabilize the primer annealing; however, the primer annealing was unsuccessful so the primers without extra base pairs were used. Each value was multiplied by 11 in order to provide enough solution for 10 individuals. 1.0 µl of DNA from each individual was mixed with 14 µl of the master mixer and run on the thermocycler using the program Td_50_1min. The temperature cycles for the program were as follows: 95º C for 3 min, [94ºC for 30 sec, 60ºC for
Figure 3: Collection site for T. recurvatum at University of Memphis Meeman Biological Field Station. White box indicates one 2x2 meter quadrat.1
66
30 sec, 72ºC for 1 min] x 9, [94ºC for 30 sec, 50ºC for 30 sec, 72ºC for 1 min] x 29, 72ºC for 10 min, and 4ºC for 15 min. This process was repeated with samples A9 and T3, from Master Plates 1 and 3 respectively. Following the results of that trial, Loci 2, 3, 4, 7, and 9 were select-ed to be amplified on all of the T. recurvatum samples. Loci 2 and 3 were amplified using the same protocol and thermocycler program as used when testing Loci 1-10. Locus 9 was slightly modified by using .27 µl MgCl2 in order to decrease double banding. Additionally, .20 µl of forward primer, reverse primer, and M13 were used instead of the .35 µl used previously. The primers used in Locus 9 also contained extra base pairs. The decrease in solution yielded a 13 µl reaction. Program Td_55_1min was used to amplify Locus 9 on the thermocycler. Individuals from Master Plates 2 and 3 were amplified at Loci 2, 3, and 9 using the same protocol and ther-mocycler program used for Master Plate 1. Locus 4 was amplified using a master mix of 9.80 µl of deionized water, 1.5 µl of buffer, .30 µl of MgCl2, .20 µl dNTPs, .20 µl of forward primer at 5 µM, .20 µl of reverse primers with extra base pairs at 20 µM, .20 M13 (NED) at 10 µM, and .60 µl of Taq polymerase. 1 µl of DNA was added to 13 µl of the master mix. Individuals were run on the program Td_57_45sec. Instead of lasting 1 minute, the 94 º C, 67-57 º C, and 72 º C cycle lasted 45 seconds. This protocol and program was used for all individuals from Master Plates 1, 2, and 3. Locus 7 was amplified using a master mix of 9.35 µl of deionized water, 1.5 µl of buffer, .35 µl of MgCl2, .20 µl of dNTPs, .20 µl of forward primer at 5 µM, .20 µl of reverse prim-er with extra bases at 20 µM, .20 µl of M13 (VIC) at 10 µM, and 1.0 µl of Taq polymerase. One µl of DNA was added to 13 µl of the master mix. Individuals were on the thermocycler program Td_50_1min. This protocol and program was used for all individuals from Master Plates 1, 2, and 3. Locus 6 was amplified using a master mix of 9.85 µl of deionized water, 1.5 µl of buffer, .35 µl of MgCl2, .20 µl dNTPs, .20 µl of forward primer at 5 µM, .20 µl of reverse primers at 20 µM, .20 µl M13 (NED), and .50 µl of Taq polymerase. 1.0 µl of DNA was added to 13 µl of the master mix. Individuals were run on the program Td_57_45sec. This pro-tocol was used for Master Plates 1, 2, and 3. Table 2 indicates the fluoro-phore (M13) used with each locus.
67
Gel electrophoresis was used to ensure that the PCR was success-ful and to estimate fragment length. The PCR products were mixed with loading dye and loaded into a 1% agarose gel along with TAEx buffer. The first well of each gel contained a ladder, which is a standard by which fragment lengths are measured. The last well of the gel contained a water control, unless otherwise specified. The gel electrophoresis was run at 80 volts and the results were visualized by placing the gel in a UV light box (Fig. 4). A dilution plate was created by adding 3 µl from each plate (Loci 2, 3, and 9) and then 21 µl of water. One µl of the dilution plate and 12 µl
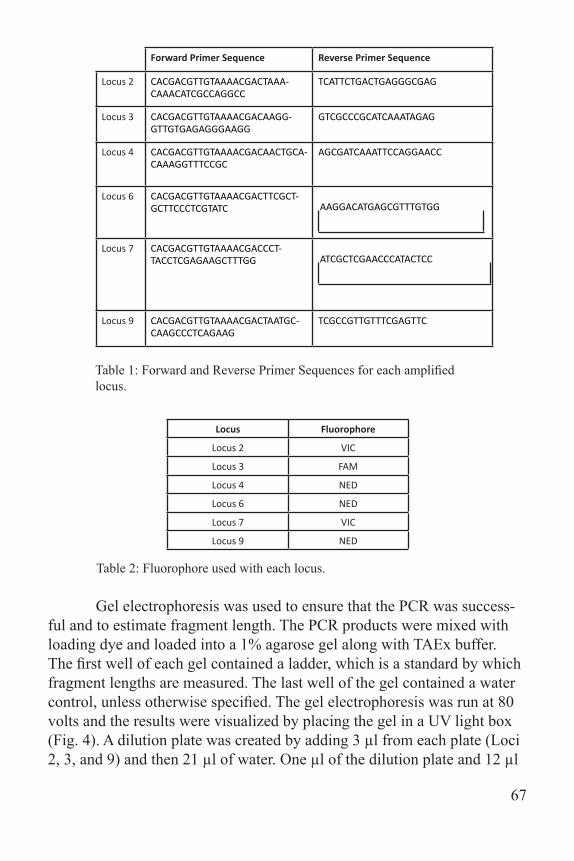
Forward Primer Sequence Reverse Primer Sequence
Locus 2 CACGACGTTGTAAAACGACTAAA-CAAACATCGCCAGGCC
TCATTCTGACTGAGGGCGAG
Locus 3 CACGACGTTGTAAAACGACAAGG-GTTGTGAGAGGGAAGG
GTCGCCCGCATCAAATAGAG
Locus 4 CACGACGTTGTAAAACGACAACTGCA-CAAAGGTTTCCGC
AGCGATCAAATTCCAGGAACC
Locus 6 CACGACGTTGTAAAACGACTTCGCT-GCTTCCCTCGTATC AAGGACATGAGCGTTTGTGG
Locus 7 CACGACGTTGTAAAACGACCCT-TACCTCGAGAAGCTTTGG ATCGCTCGAACCCATACTCC
Locus 9 CACGACGTTGTAAAACGACTAATGC-CAAGCCCTCAGAAG
TCGCCGTTGTTTCGAGTTC
Table 1: Forward and Reverse Primer Sequences for each amplified locus.
Locus Fluorophore
Locus 2 VIC
Locus 3 FAM
Locus 4 NED
Locus 6 NED
Locus 7 VIC
Locus 9 NED
Table 2: Fluorophore used with each locus.
68
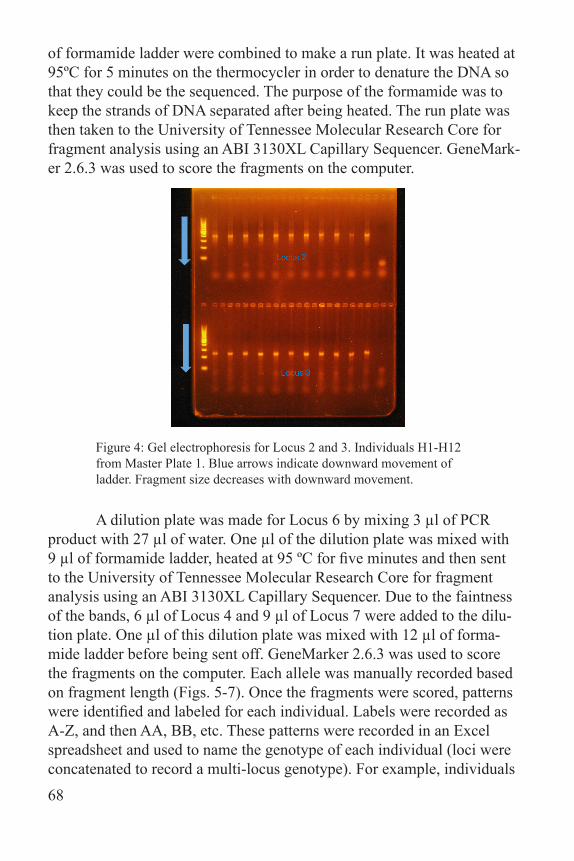
of formamide ladder were combined to make a run plate. It was heated at 95ºC for 5 minutes on the thermocycler in order to denature the DNA so that they could be the sequenced. The purpose of the formamide was to keep the strands of DNA separated after being heated. The run plate was then taken to the University of Tennessee Molecular Research Core for fragment analysis using an ABI 3130XL Capillary Sequencer. GeneMark-er 2.6.3 was used to score the fragments on the computer.
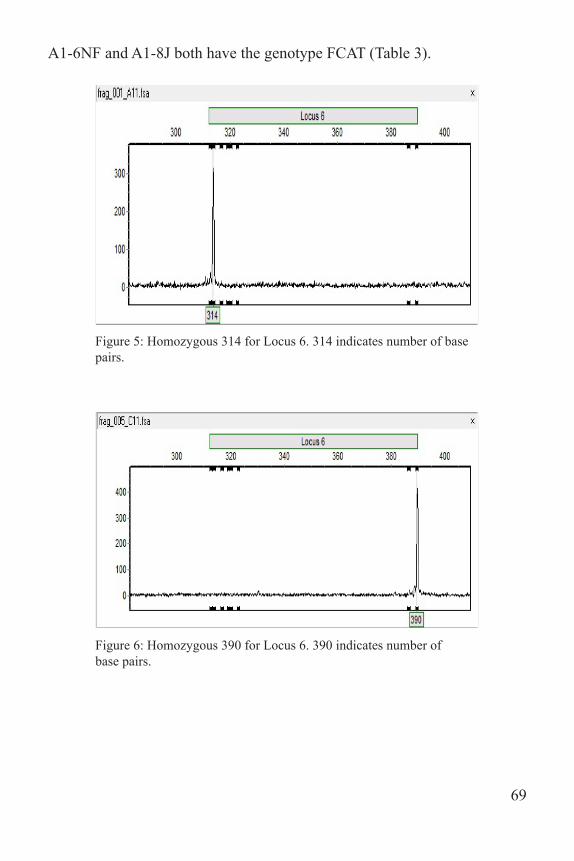
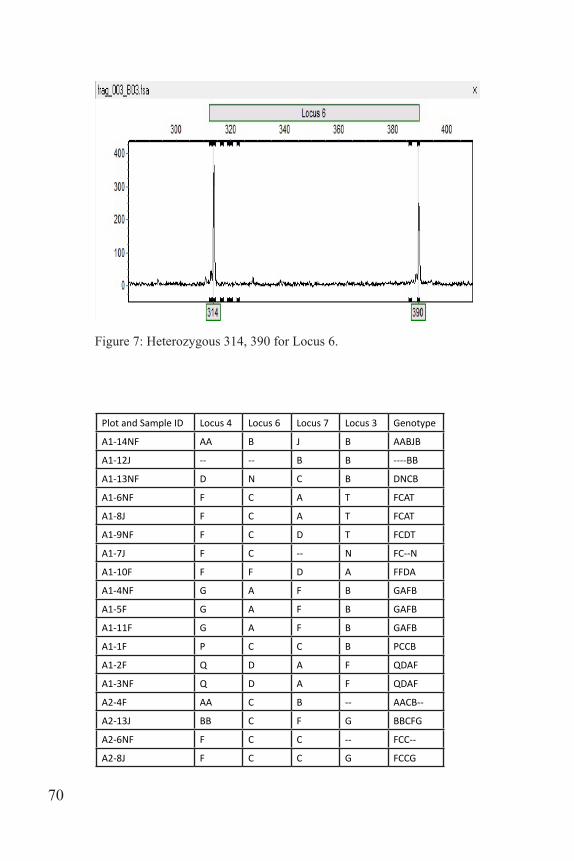
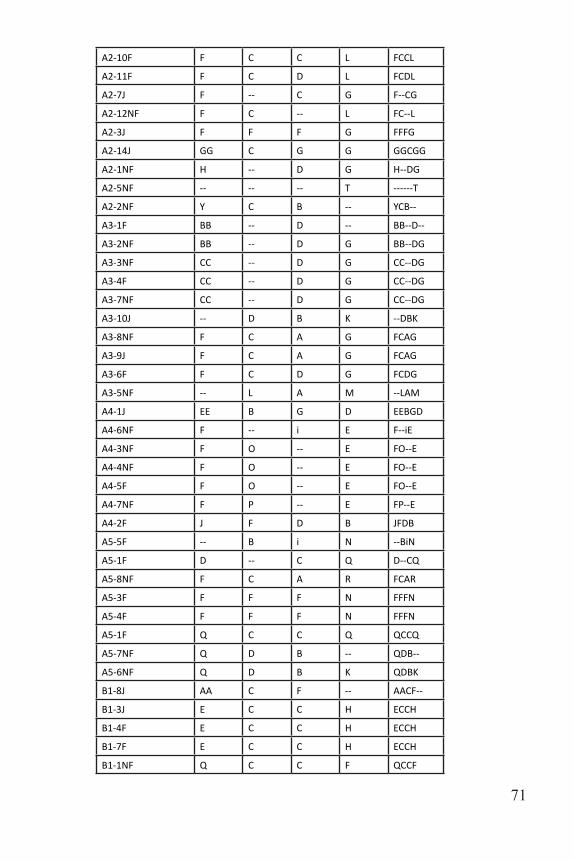
A dilution plate was made for Locus 6 by mixing 3 µl of PCR product with 27 µl of water. One µl of the dilution plate was mixed with 9 µl of formamide ladder, heated at 95 ºC for five minutes and then sent to the University of Tennessee Molecular Research Core for fragment analysis using an ABI 3130XL Capillary Sequencer. Due to the faintness of the bands, 6 µl of Locus 4 and 9 µl of Locus 7 were added to the dilu-tion plate. One µl of this dilution plate was mixed with 12 µl of forma-mide ladder before being sent off. GeneMarker 2.6.3 was used to score the fragments on the computer. Each allele was manually recorded based on fragment length (Figs. 5-7). Once the fragments were scored, patterns were identified and labeled for each individual. Labels were recorded as A-Z, and then AA, BB, etc. These patterns were recorded in an Excel spreadsheet and used to name the genotype of each individual (loci were concatenated to record a multi-locus genotype). For example, individuals
Figure 4: Gel electrophoresis for Locus 2 and 3. Individuals H1-H12 from Master Plate 1. Blue arrows indicate downward movement of ladder. Fragment size decreases with downward movement.
69
A1-6NF and A1-8J both have the genotype FCAT (Table 3).
Figure 6: Homozygous 390 for Locus 6. 390 indicates number of base pairs.
Figure 5: Homozygous 314 for Locus 6. 314 indicates number of base pairs.
70
Figure 7: Heterozygous 314, 390 for Locus 6.
Plot and Sample ID Locus 4 Locus 6 Locus 7 Locus 3 Genotype
A1-14NF AA B J B AABJB
A1-12J -- -- B B ----BB
A1-13NF D N C B DNCB
A1-6NF F C A T FCAT
A1-8J F C A T FCAT
A1-9NF F C D T FCDT
A1-7J F C -- N FC--N
A1-10F F F D A FFDA
A1-4NF G A F B GAFB
A1-5F G A F B GAFB
A1-11F G A F B GAFB
A1-1F P C C B PCCB
A1-2F Q D A F QDAF
A1-3NF Q D A F QDAF
A2-4F AA C B -- AACB--
A2-13J BB C F G BBCFG
A2-6NF F C C -- FCC--
A2-8J F C C G FCCG
71
A2-10F F C C L FCCL
A2-11F F C D L FCDL
A2-7J F -- C G F--CG
A2-12NF F C -- L FC--L
A2-3J F F F G FFFG
A2-14J GG C G G GGCGG
A2-1NF H -- D G H--DG
A2-5NF -- -- -- T ------T
A2-2NF Y C B -- YCB--
A3-1F BB -- D -- BB--D--
A3-2NF BB -- D G BB--DG
A3-3NF CC -- D G CC--DG
A3-4F CC -- D G CC--DG
A3-7NF CC -- D G CC--DG
A3-10J -- D B K --DBK
A3-8NF F C A G FCAG
A3-9J F C A G FCAG
A3-6F F C D G FCDG
A3-5NF -- L A M --LAM
A4-1J EE B G D EEBGD
A4-6NF F -- i E F--iE
A4-3NF F O -- E FO--E
A4-4NF F O -- E FO--E
A4-5F F O -- E FO--E
A4-7NF F P -- E FP--E
A4-2F J F D B JFDB
A5-5F -- B i N --BiN
A5-1F D -- C Q D--CQ
A5-8NF F C A R FCAR
A5-3F F F F N FFFN
A5-4F F F F N FFFN
A5-1F Q C C Q QCCQ
A5-7NF Q D B -- QDB--
A5-6NF Q D B K QDBK
B1-8J AA C F -- AACF--
B1-3J E C C H ECCH
B1-4F E C C H ECCH
B1-7F E C C H ECCH
B1-1NF Q C C F QCCF
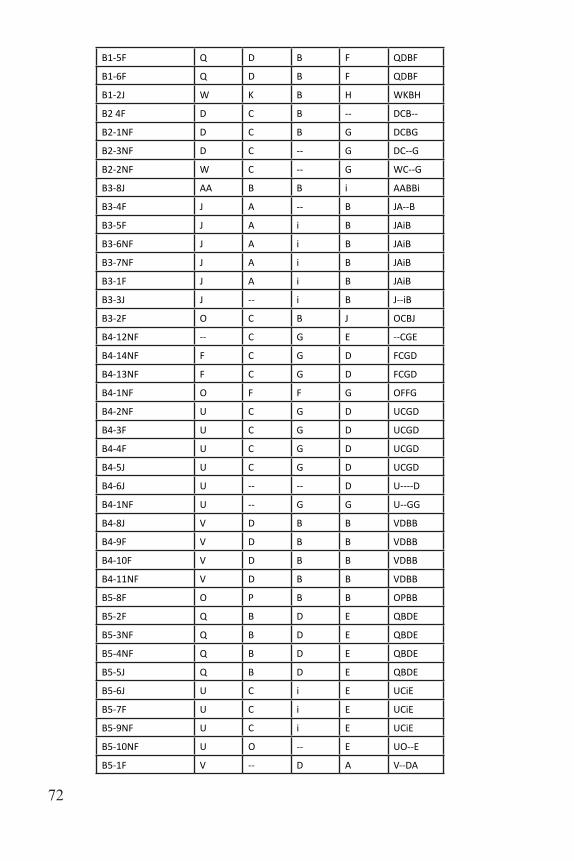
72
B1-5F Q D B F QDBF
B1-6F Q D B F QDBF
B1-2J W K B H WKBH
B2 4F D C B -- DCB--
B2-1NF D C B G DCBG
B2-3NF D C -- G DC--G
B2-2NF W C -- G WC--G
B3-8J AA B B i AABBi
B3-4F J A -- B JA--B
B3-5F J A i B JAiB
B3-6NF J A i B JAiB
B3-7NF J A i B JAiB
B3-1F J A i B JAiB
B3-3J J -- i B J--iB
B3-2F O C B J OCBJ
B4-12NF -- C G E --CGE
B4-14NF F C G D FCGD
B4-13NF F C G D FCGD
B4-1NF O F F G OFFG
B4-2NF U C G D UCGD
B4-3F U C G D UCGD
B4-4F U C G D UCGD
B4-5J U C G D UCGD
B4-6J U -- -- D U----D
B4-1NF U -- G G U--GG
B4-8J V D B B VDBB
B4-9F V D B B VDBB
B4-10F V D B B VDBB
B4-11NF V D B B VDBB
B5-8F O P B B OPBB
B5-2F Q B D E QBDE
B5-3NF Q B D E QBDE
B5-4NF Q B D E QBDE
B5-5J Q B D E QBDE
B5-6J U C i E UCiE
B5-7F U C i E UCiE
B5-9NF U C i E UCiE
B5-10NF U O -- E UO--E
B5-1F V -- D A V--DA
73
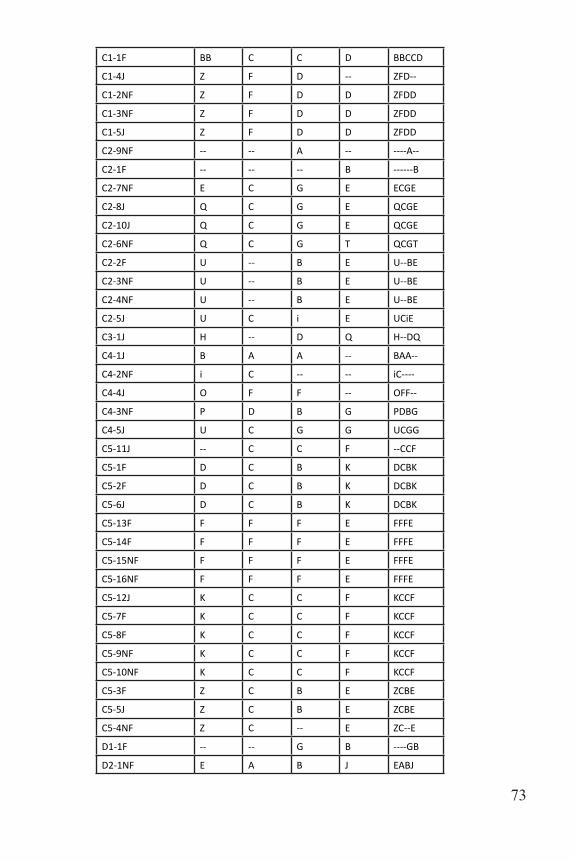
C1-1F BB C C D BBCCD
C1-4J Z F D -- ZFD--
C1-2NF Z F D D ZFDD
C1-3NF Z F D D ZFDD
C1-5J Z F D D ZFDD
C2-9NF -- -- A -- ----A--
C2-1F -- -- -- B ------B
C2-7NF E C G E ECGE
C2-8J Q C G E QCGE
C2-10J Q C G E QCGE
C2-6NF Q C G T QCGT
C2-2F U -- B E U--BE
C2-3NF U -- B E U--BE
C2-4NF U -- B E U--BE
C2-5J U C i E UCiE
C3-1J H -- D Q H--DQ
C4-1J B A A -- BAA--
C4-2NF i C -- -- iC----
C4-4J O F F -- OFF--
C4-3NF P D B G PDBG
C4-5J U C G G UCGG
C5-11J -- C C F --CCF
C5-1F D C B K DCBK
C5-2F D C B K DCBK
C5-6J D C B K DCBK
C5-13F F F F E FFFE
C5-14F F F F E FFFE
C5-15NF F F F E FFFE
C5-16NF F F F E FFFE
C5-12J K C C F KCCF
C5-7F K C C F KCCF
C5-8F K C C F KCCF
C5-9NF K C C F KCCF
C5-10NF K C C F KCCF
C5-3F Z C B E ZCBE
C5-5J Z C B E ZCBE
C5-4NF Z C -- E ZC--E
D1-1F -- -- G B ----GB
D2-1NF E A B J EABJ
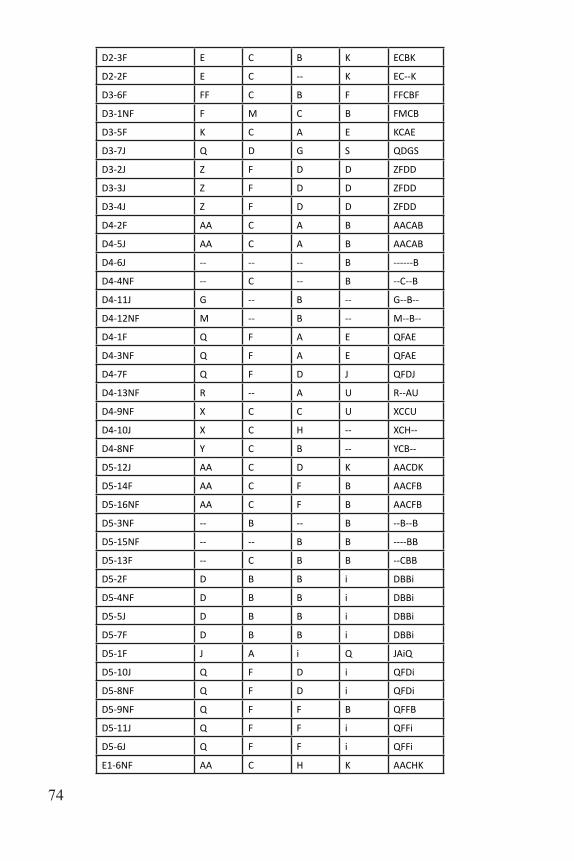
74
D2-3F E C B K ECBK
D2-2F E C -- K EC--K
D3-6F FF C B F FFCBF
D3-1NF F M C B FMCB
D3-5F K C A E KCAE
D3-7J Q D G S QDGS
D3-2J Z F D D ZFDD
D3-3J Z F D D ZFDD
D3-4J Z F D D ZFDD
D4-2F AA C A B AACAB
D4-5J AA C A B AACAB
D4-6J -- -- -- B ------B
D4-4NF -- C -- B --C--B
D4-11J G -- B -- G--B--
D4-12NF M -- B -- M--B--
D4-1F Q F A E QFAE
D4-3NF Q F A E QFAE
D4-7F Q F D J QFDJ
D4-13NF R -- A U R--AU
D4-9NF X C C U XCCU
D4-10J X C H -- XCH--
D4-8NF Y C B -- YCB--
D5-12J AA C D K AACDK
D5-14F AA C F B AACFB
D5-16NF AA C F B AACFB
D5-3NF -- B -- B --B--B
D5-15NF -- -- B B ----BB
D5-13F -- C B B --CBB
D5-2F D B B i DBBi
D5-4NF D B B i DBBi
D5-5J D B B i DBBi
D5-7F D B B i DBBi
D5-1F J A i Q JAiQ
D5-10J Q F D i QFDi
D5-8NF Q F D i QFDi
D5-9NF Q F F B QFFB
D5-11J Q F F i QFFi
D5-6J Q F F i QFFi
E1-6NF AA C H K AACHK
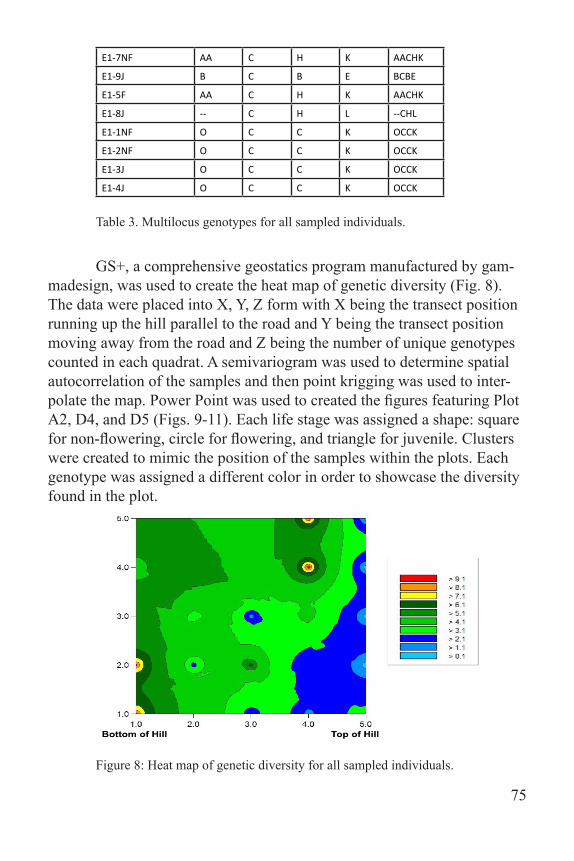
75
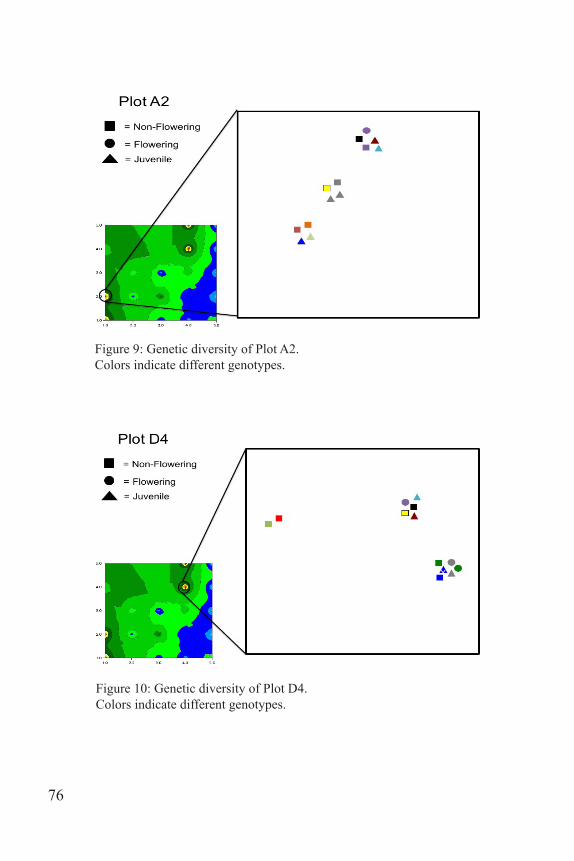
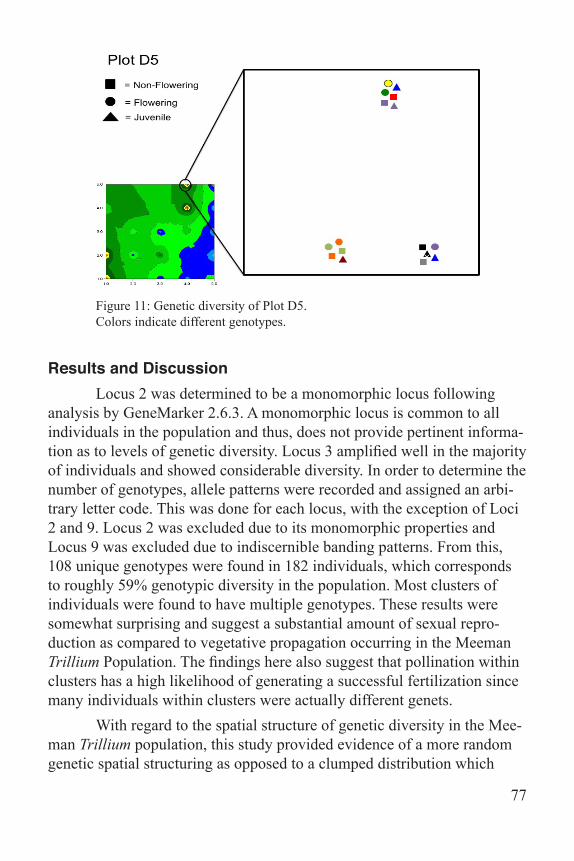
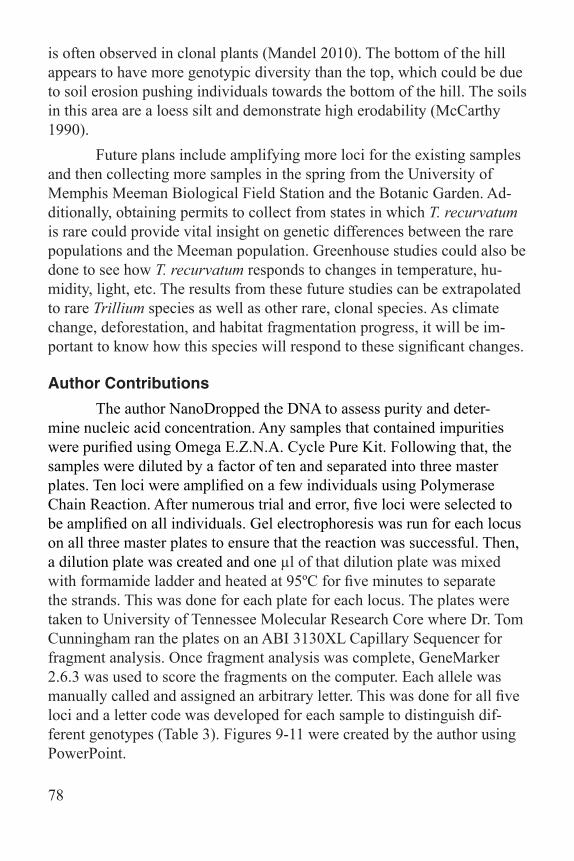
GS+, a comprehensive geostatics program manufactured by gam-madesign, was used to create the heat map of genetic diversity (Fig. 8). The data were placed into X, Y, Z form with X being the transect position running up the hill parallel to the road and Y being the transect position moving away from the road and Z being the number of unique genotypes counted in each quadrat. A semivariogram was used to determine spatial autocorrelation of the samples and then point krigging was used to inter-polate the map. Power Point was used to created the figures featuring Plot A2, D4, and D5 (Figs. 9-11). Each life stage was assigned a shape: square for non-flowering, circle for flowering, and triangle for juvenile. Clusters were created to mimic the position of the samples within the plots. Each genotype was assigned a different color in order to showcase the diversity found in the plot.
E1-7NF AA C H K AACHK
E1-9J B C B E BCBE
E1-5F AA C H K AACHK
E1-8J -- C H L --CHL
E1-1NF O C C K OCCK
E1-2NF O C C K OCCK
E1-3J O C C K OCCK
E1-4J O C C K OCCK
Table 3. Multilocus genotypes for all sampled individuals.
Figure 8: Heat map of genetic diversity for all sampled individuals.
76
Figure 9: Genetic diversity of Plot A2. Colors indicate different genotypes.
Figure 10: Genetic diversity of Plot D4. Colors indicate different genotypes.
77
Results and Discussion Locus 2 was determined to be a monomorphic locus following analysis by GeneMarker 2.6.3. A monomorphic locus is common to all individuals in the population and thus, does not provide pertinent informa-tion as to levels of genetic diversity. Locus 3 amplified well in the majority of individuals and showed considerable diversity. In order to determine the number of genotypes, allele patterns were recorded and assigned an arbi-trary letter code. This was done for each locus, with the exception of Loci 2 and 9. Locus 2 was excluded due to its monomorphic properties and Locus 9 was excluded due to indiscernible banding patterns. From this, 108 unique genotypes were found in 182 individuals, which corresponds to roughly 59% genotypic diversity in the population. Most clusters of individuals were found to have multiple genotypes. These results were somewhat surprising and suggest a substantial amount of sexual repro-duction as compared to vegetative propagation occurring in the Meeman Trillium Population. The findings here also suggest that pollination within clusters has a high likelihood of generating a successful fertilization since many individuals within clusters were actually different genets. With regard to the spatial structure of genetic diversity in the Mee-man Trillium population, this study provided evidence of a more random genetic spatial structuring as opposed to a clumped distribution which
Figure 11: Genetic diversity of Plot D5. Colors indicate different genotypes.
78
is often observed in clonal plants (Mandel 2010). The bottom of the hill appears to have more genotypic diversity than the top, which could be due to soil erosion pushing individuals towards the bottom of the hill. The soils in this area are a loess silt and demonstrate high erodability (McCarthy 1990). Future plans include amplifying more loci for the existing samples and then collecting more samples in the spring from the University of Memphis Meeman Biological Field Station and the Botanic Garden. Ad-ditionally, obtaining permits to collect from states in which T. recurvatum is rare could provide vital insight on genetic differences between the rare populations and the Meeman population. Greenhouse studies could also be done to see how T. recurvatum responds to changes in temperature, hu-midity, light, etc. The results from these future studies can be extrapolated to rare Trillium species as well as other rare, clonal species. As climate change, deforestation, and habitat fragmentation progress, it will be im-portant to know how this species will respond to these significant changes.
Author Contributions The author NanoDropped the DNA to assess purity and deter-mine nucleic acid concentration. Any samples that contained impurities were purified using Omega E.Z.N.A. Cycle Pure Kit. Following that, the samples were diluted by a factor of ten and separated into three master plates. Ten loci were amplified on a few individuals using Polymerase Chain Reaction. After numerous trial and error, five loci were selected to be amplified on all individuals. Gel electrophoresis was run for each locus on all three master plates to ensure that the reaction was successful. Then, a dilution plate was created and one µl of that dilution plate was mixed with formamide ladder and heated at 95ºC for five minutes to separate the strands. This was done for each plate for each locus. The plates were taken to University of Tennessee Molecular Research Core where Dr. Tom Cunningham ran the plates on an ABI 3130XL Capillary Sequencer for fragment analysis. Once fragment analysis was complete, GeneMarker 2.6.3 was used to score the fragments on the computer. Each allele was manually called and assigned an arbitrary letter. This was done for all five loci and a letter code was developed for each sample to distinguish dif-ferent genotypes (Table 3). Figures 9-11 were created by the author using PowerPoint.

79
Endnotes1. Two quadrats are missing at the bottom due to picture angle. Inclusion of those yields a 5x5 array of 2x2 meter quadrats.
80
ReferencesBrooker, R.J. “Genetics: Analysis and Principles.” 2d. ed. Boston.: Mc-
graw Hill, (1999). Print.
Cook, R.E. “Clonal Plant Populations: A Knowledge of Clonal Structure Can Affect the Interpretation of Data in a Broad Range of Ecological and Evolutionary Studies.” American Scientist 71.3 (1983). 244–253. Web.
Gilliam, F.S. “The Ecological Significance of the Herbaceous Layer in Temperate Forest Ecosystems.” Bioscience 57.10 (2007). 845-858. Web.
Jules, E.S. “Habitat Fragmentation and Demographic Change for a Com-mon Plant: Trillium in Old-growth Forest.” Ecology 79.5 (1998). 1645–1656. Web.
Kartesz, J.T. The Biota of North America Program (BONAP). 2015. North American Plant Atlas. (http://bonap.net/napa). Chapel Hill, N.C. [maps generated from Kartesz, J.T. 2015. Floristic Synthesis of North America, Version 1.0. Biota of North America Program (BONAP). (in press)].
Mandel, J.R. “Clonal diversity, spatial dynamics, and small genetic popu-lation size in the rare sunflower, Helianthus verticillatus.” Conserva-tion Genetics 11.5 (2010). 2055-2059. Web.
McCarthy, K.P. “An analysis of gully development in Meeman-Shelby Forest State Park, Tennessee.” Master’s Thesis, The University of Memphis, Memphis, TN. 1990.
Moore, J.E., Franklin S.B., Wein, G., Collins, B.S. “Long-term popula-tion demography of Trillium recurvatum on loess bluffs in western Tennessee, USA.” AoB PLANTS 2012: pls015; doi:10.1093/aobpla/pls015 2012.
O’Connor, R.P. Special Plant Abstract for Trillium recurvatum (prairie trillium). Lansing, MI: Michigan Natural Features Inventory. 2007. 3 pp.
Sawyer, N.W. “Reproductive Ecology of Trillium Recurvatum (Trilliace-ae) in Wisconsin.” The American Midland Naturalist 175.1 (2009). 146-160. Web.