Embed Size (px)
Citation preview
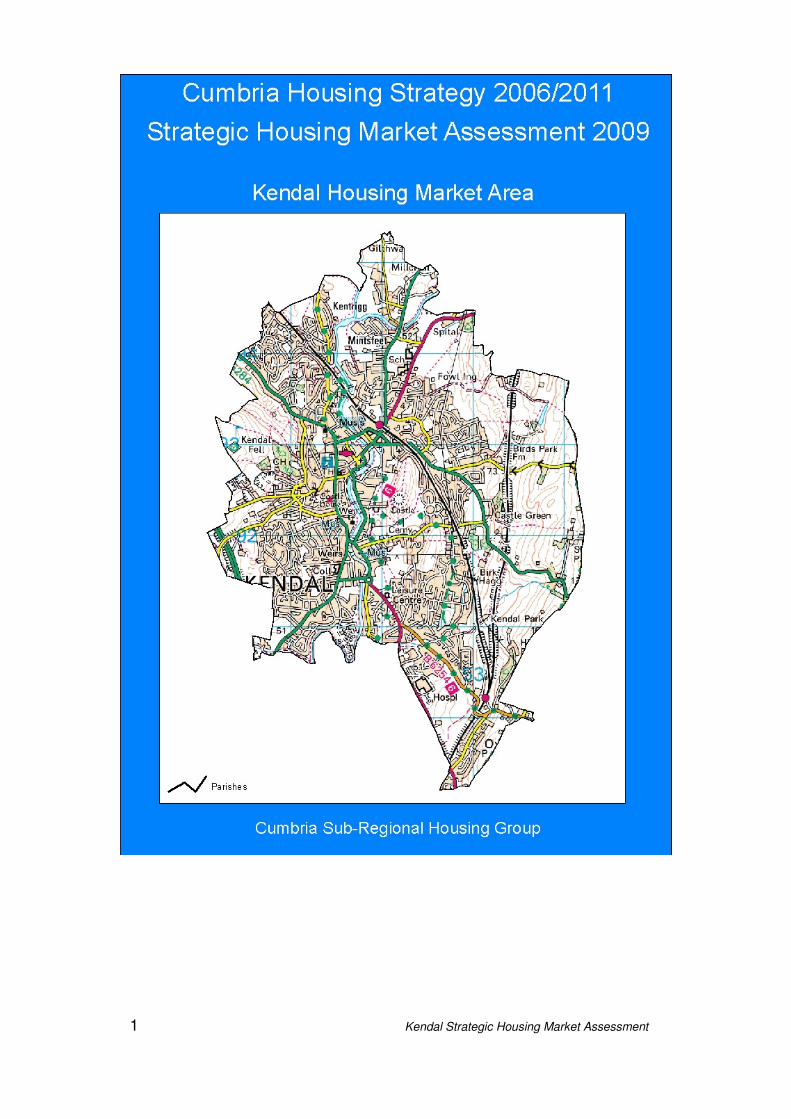
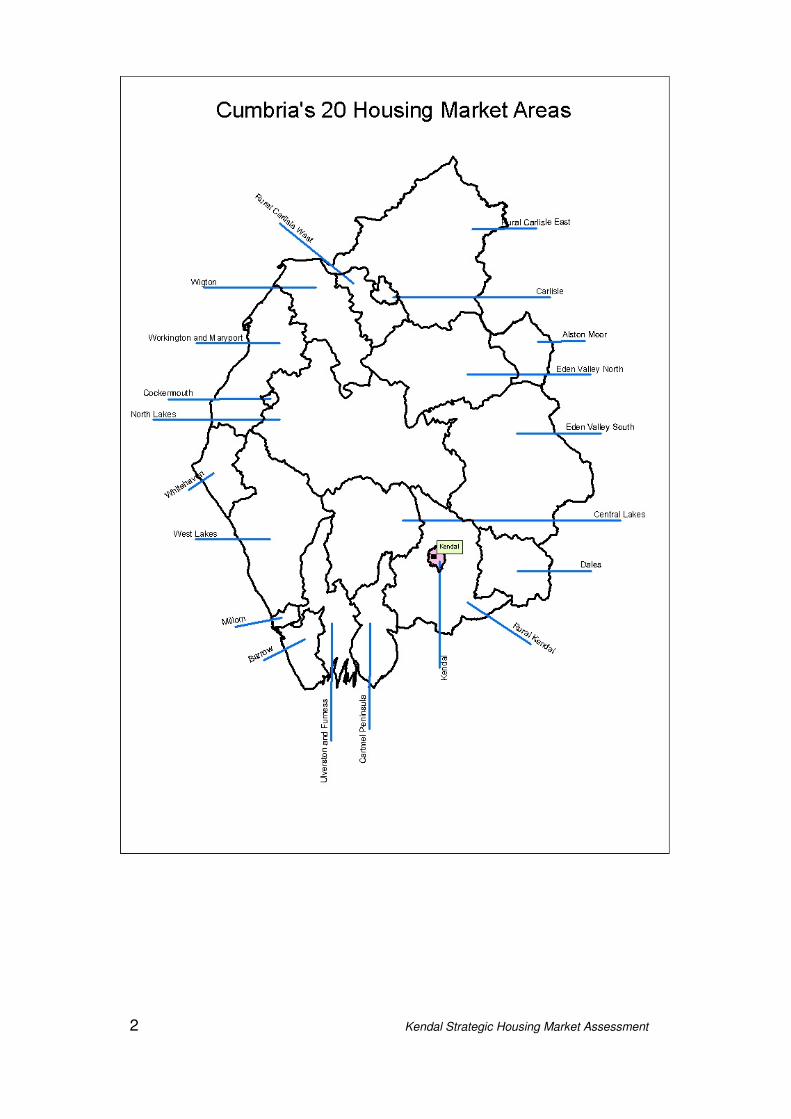
1 Kendal Strategic Housing Market Assessment
2 Kendal Strategic Housing Market Assessment
3 Kendal Strategic Housing Market Assessment
Kendal Housing Market Assessment Contents
1. Current Market Profile
• Headline Findings
• Targets
• Key Issues 2. Balanced Housing Market Indicators 3. The Current Housing Market
Stage 1: The Demographic and Economic Context
1.1 Demography and Household Types 1.2 National and Regional Economic Policy 1.3 Employment Levels and Structure 1.4 Incomes and Earnings
Stage 2: The Housing Stock
2.1 The Dwelling Profile 2.2 Stock Condition 2.3 Shared Housing and Communal Establishments
Stage 3: The Active Market
3.1-3.2 The cost of buying or renting a property and affordability 3.3 Overcrowding and under-occupation 3.4 Vacancies, available supply and turnover by tenure 3.5 Second Homes and Vacant Dwellings
Stage 4: Bringing the Evidence Together
4.1 Mapping Market Characteristics 4.2 Trends and Drivers 4.3 Issues of Future Policy/ Strategy
4. The Future Housing Market
Stage 1: Projecting changes in future numbers of households Stage 2: Future Economic Performance Stage 3: Future Affordability Stage 4: Bringing the Evidence Together
5. Housing Need (affordable housing) Stage 1: Current Housing Need Stage 2: Future Housing Need Stage 3: Affordable Housing Supply Permissions and Completions:
• Market led and affordable housing
• Affordable housing only- permissions and completions 2006-08
4 Kendal Strategic Housing Market Assessment
• Market led and affordable housing delivery
• Units taken out of management 2006-2008
Stage 4: Housing Requirements of Households in Need Stage 5: Bringing the Evidence Together
• Updated estimate of net annual housing need
• Key issues for future policy/ strategy
• Joining up across the assessment
6. Housing Requirements of Specific Household Groups
6.1 Homelessness 6.2 Families, older people, minority and hard to reach groups and
households with specific needs 6.3 Low cost market housing
7. Report Conclusions – Bringing the Evidence Together
Bibliography Appendices
Acknowledgements Paula Kennerley, Cumbria County Council Stuart Frank, Cumbria Vision
Note to the Strategic Housing Market Assessment The SHMA documents have been prepared jointly by each Cumbrian district in consultation with local and county stakeholders and have been compiled using the Governments’ Strategic Housing Market Assessments Practice Guidance Version 2, August 2007. The documents are not intended to provide definitive estimates of housing need, demand and market conditions. However they aim to provide insights into how housing markets operate both now and in the future. They are intended to allow an evidence base upon which to develop planning and housing policies by considering the characteristics of the housing market, how key factors work together and the probable scale of change in future housing needs and demand (SHMA Guidance, 2007, pp7-9). To allow ease of reference each stage of the assessment follows the same order as the Guidance. Data sources occasionally differ from those recommended in the Guidance where they have been unavailable or where more robust up to date information has been accessed. The following analysis looks at the housing market area and provides information on the wider District and Cumbrian level where this adds contextual information. For a full methodology and checklist of core outputs and process please see appendix 1. Abbreviations SLDC South Lakeland District Council HMA Housing market area LDNPA Lake District National Park Authority YDNPA Yorkshire Dales National Park Authority SHMA Strategic Housing Market Assessment TTWAs Travel to work areas
5 Kendal Strategic Housing Market Assessment
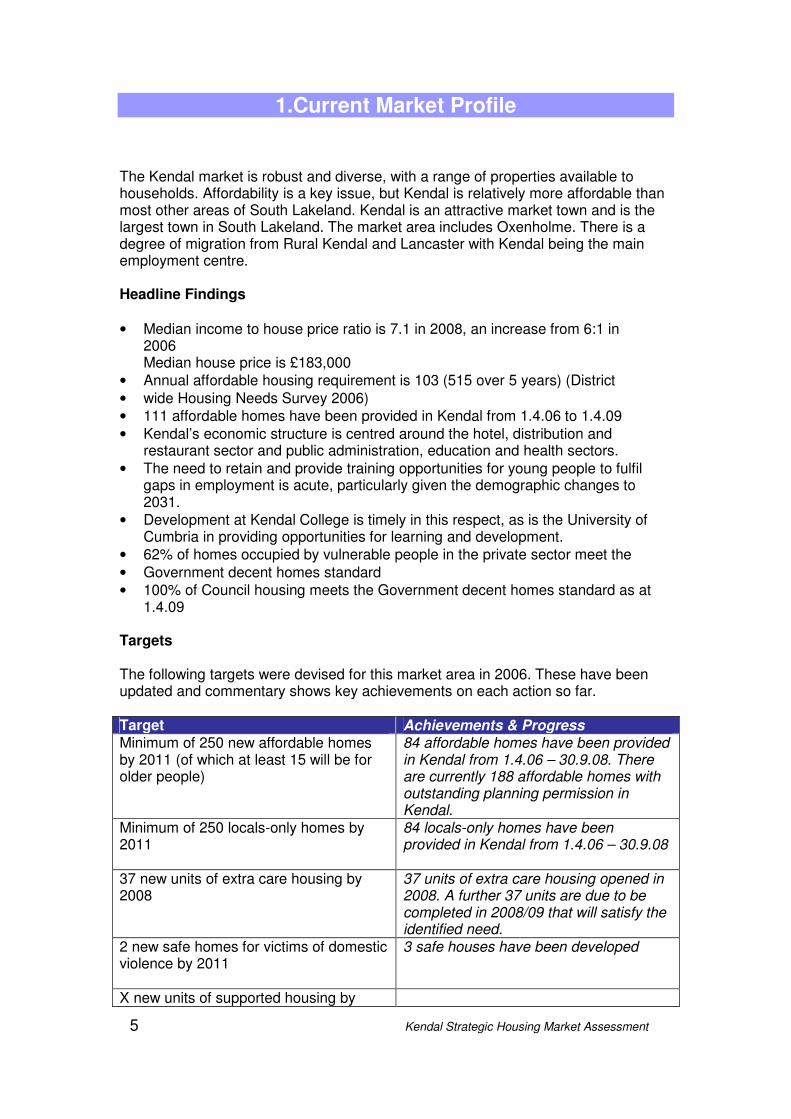
1.Current Market Profile The Kendal market is robust and diverse, with a range of properties available to households. Affordability is a key issue, but Kendal is relatively more affordable than most other areas of South Lakeland. Kendal is an attractive market town and is the largest town in South Lakeland. The market area includes Oxenholme. There is a degree of migration from Rural Kendal and Lancaster with Kendal being the main employment centre. Headline Findings
• Median income to house price ratio is 7.1 in 2008, an increase from 6:1 in 2006 Median house price is £183,000
• Annual affordable housing requirement is 103 (515 over 5 years) (District
• wide Housing Needs Survey 2006)
• 111 affordable homes have been provided in Kendal from 1.4.06 to 1.4.09
• Kendal’s economic structure is centred around the hotel, distribution and restaurant sector and public administration, education and health sectors.
• The need to retain and provide training opportunities for young people to fulfil gaps in employment is acute, particularly given the demographic changes to 2031.
• Development at Kendal College is timely in this respect, as is the University of Cumbria in providing opportunities for learning and development.
• 62% of homes occupied by vulnerable people in the private sector meet the
• Government decent homes standard
• 100% of Council housing meets the Government decent homes standard as at 1.4.09
Targets
The following targets were devised for this market area in 2006. These have been updated and commentary shows key achievements on each action so far. Target Achievements & Progress Minimum of 250 new affordable homes by 2011 (of which at least 15 will be for older people)
84 affordable homes have been provided in Kendal from 1.4.06 – 30.9.08. There are currently 188 affordable homes with outstanding planning permission in Kendal.
Minimum of 250 locals-only homes by 2011
84 locals-only homes have been provided in Kendal from 1.4.06 – 30.9.08
37 new units of extra care housing by 2008
37 units of extra care housing opened in 2008. A further 37 units are due to be completed in 2008/09 that will satisfy the identified need.
2 new safe homes for victims of domestic violence by 2011
3 safe houses have been developed
X new units of supported housing by
6 Kendal Strategic Housing Market Assessment
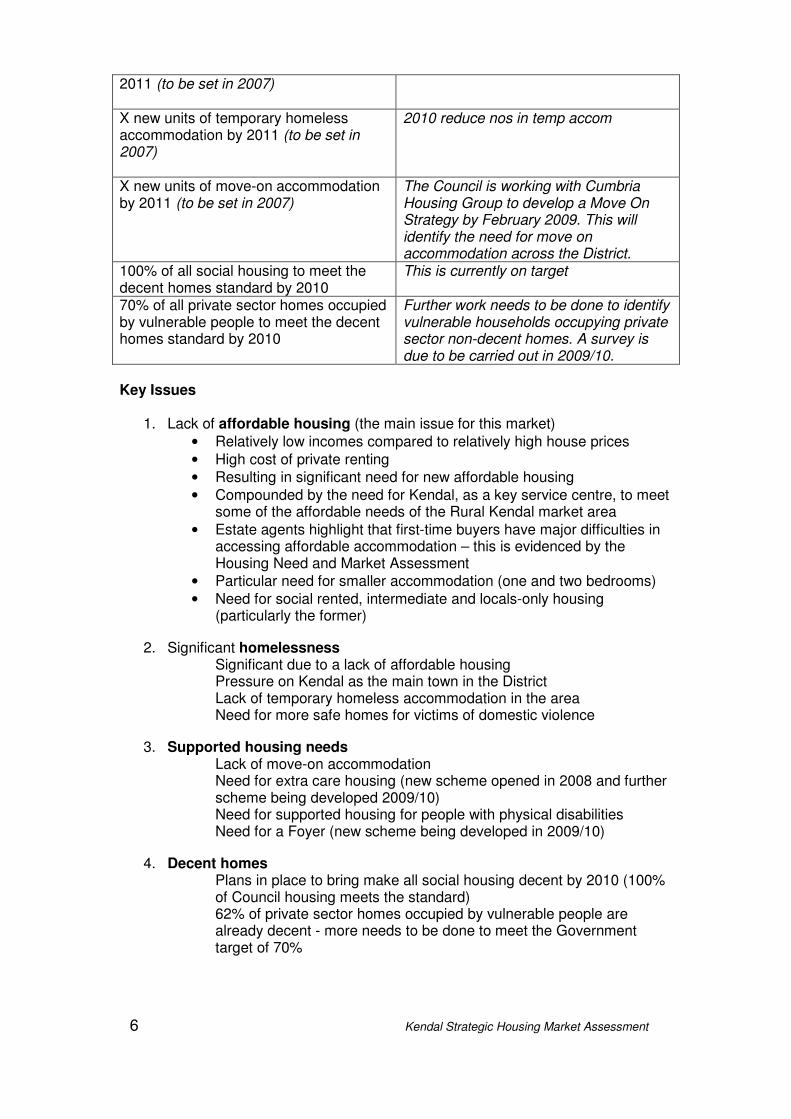
2011 (to be set in 2007) X new units of temporary homeless accommodation by 2011 (to be set in 2007)
2010 reduce nos in temp accom
X new units of move-on accommodation by 2011 (to be set in 2007)
The Council is working with Cumbria Housing Group to develop a Move On Strategy by February 2009. This will identify the need for move on accommodation across the District.
100% of all social housing to meet the decent homes standard by 2010
This is currently on target
70% of all private sector homes occupied by vulnerable people to meet the decent homes standard by 2010
Further work needs to be done to identify vulnerable households occupying private sector non-decent homes. A survey is due to be carried out in 2009/10.
Key Issues
1. Lack of affordable housing (the main issue for this market)
• Relatively low incomes compared to relatively high house prices
• High cost of private renting
• Resulting in significant need for new affordable housing
• Compounded by the need for Kendal, as a key service centre, to meet some of the affordable needs of the Rural Kendal market area
• Estate agents highlight that first-time buyers have major difficulties in accessing affordable accommodation – this is evidenced by the Housing Need and Market Assessment
• Particular need for smaller accommodation (one and two bedrooms)
• Need for social rented, intermediate and locals-only housing (particularly the former)
2. Significant homelessness Significant due to a lack of affordable housing Pressure on Kendal as the main town in the District Lack of temporary homeless accommodation in the area Need for more safe homes for victims of domestic violence
3. Supported housing needs Lack of move-on accommodation Need for extra care housing (new scheme opened in 2008 and further
scheme being developed 2009/10) Need for supported housing for people with physical disabilities Need for a Foyer (new scheme being developed in 2009/10)
4. Decent homes Plans in place to bring make all social housing decent by 2010 (100%
of Council housing meets the standard) 62% of private sector homes occupied by vulnerable people are
already decent - more needs to be done to meet the Government target of 70%

7 Kendal Strategic Housing Market Assessment
5. Regeneration
• South Lakeland District Council is preparing a Kendal Canal Head Area Action Plan (AAP), which will form part of the South Lakeland Local Development Framework (LDF).
• The AAP will provide a planning framework for the regeneration of an area of Kendal between Canal Head and Change Bridge off Parkside Road, including the potential restoration of a section of the former Lancaster Canal. The AAP has developed from earlier work between the District Council, the North West Development Agency and the Lancaster Canal Restoration Partnership – including British Waterways, which has assisted with this consultation.
• The Kendal Economic Regeneration Action Plan (KeRAP) establishes a ten year vision for the town, and identifies priorities and examines how key initiatives can be integrated and delivered to maximise value for money. A number of significant issues for the Preferred Options for the Canal are identified, including:
� A need for additional business space; � A balanced mix of land uses compatible with the town centre
and the KeRAP � proposals for Kirkland and Highgate, with aims to reuse the
more important buildings in the area. � Major highway network and strategic parking provision
constraints were also identified. � The Preferred Options aim to provide excellent links to public
transport, particularly to Kendal Rail and Bus Stations and Oxenholme Station.
• The Interim Approach to Housing Development (IPATH) 2005 requires that 50% of new residential homes are affordable. Of these, 66.6% should be within the lower affordable price range and 33.3% in t he upper affordable house range. It has been agreed that for the Kendal Canal area a figure of 30% affordable homes should be developed. A total of 539 homes are identified in the AAP comprising 377 market properties and 162 affordable properties. The total of 539 includes 383 apartments (of which 48 would be affordable) and 156 houses (of which 114 would be affordable).
6. Employment Needs
• The District as a whole has low unemployment and is a net exporter of labour
• There are more jobs than workforce with evidence that jobs are being filled by migrant workers, double jobbing, and student workforce
• Predominance of distribution/hotels/restaurant and public administration, education and health industries
• There is a high demand for skilled and high level occupations throughout the District. Kendal has suffered losses in recent years, such as Provident.
• The need to retain and provide training opportunities for young people to fulfil gaps in employment is acute, particularly given the demographic changes to 2031.
7. Impact of Proposed Development
• New permissions given (2007-08) for affordable new build are expected to supply 40 units.
• There is a need for the size and type of units built to be balanced to allow residents to meet their needs across a range of size, type and tenures.

8 Kendal Strategic Housing Market Assessment
Market Drivers
• Kendal is the main town and source of employment in the District
• Good access from M6 motorway and mainline railway has led to a commuter market
• Retirement inward migration as cheaper than the Lake District
• Net outward migration to Lancaster where cheaper homes can be found
• Wide range of shops and services - seen as adequate by local people
• General satisfaction but concerns over traffic, public transport and car parking
• Educational facilities including the reputation of local schools - seen as very good
• Balanced supply of house types although relatively low supply of bungalows (Source: South Lakeland Housing Needs and Market Assessment 2006)
In summary, the housing market is not balanced due to a lack of affordable housing, the level of homelessness and the number of homes not meeting the Government’s decent homes standard.

9 Kendal Strategic Housing Market Assessment
2. Local Housing Market Indicators
A set of Local Housing Market Indicators are in the process of development to assess the extent to which a housing market is balanced. The proposed indicators are contained at Appendix 3. Further work is needed on these to ensure that the indicators can be monitored regularly and the information collected consistently across Cumbria. This will need the co-operation of social housing landlords, housing strategy and planning departments in collecting the data at the Housing Market Area level.
10 Kendal Strategic Housing Market Assessment
3. The Current Housing Market Stage 1: The demographic and economic context This section outlines the demographic and economic context. As outlined in the Practice Guidance Version 2, demographic make-up has a bearing on the demand and type of housing required. Throughout the District the prevalence of the older age cohorts impacts on the need for housing that is reflective of the needs of older people, and demand for bungalow accommodation. Prevalence of smaller households is indicative of the national trend and growing older population. It is important to set the economic context nationally, regionally and at a local level to understand how this can drive the housing market.
1.1 Demography and household types
• There has been a small increase in population 2001 to 2006
• The working age population is lower than the region as a whole reflecting the older age profile
• Significant implications of a reducing working age population and substantial increase in older people, particularly 75+ age group across the District
• Larger number of family and one person households than the District figure and lower number of pensioner households than the District figure
• CACI Acorn data provides some interesting demographic profiles and for Kendal certain wards have a significant number of ‘struggling families’, for instance Kendal Far Cross (54.7% compared to 15% Cumbrian figure) whilst others such as Kendal Castle have comfortably off families (29% compared to 14.6% for Cumbria). Unlike Rural Kendal the presence of wealthy executives is not particularly apparent
• Significant White ‘Other’ community
(Sources include Cumbria Economic Bulletin, Sep 2006, & Information & Intelligence, Policy & Performance Unit, Cumbria County Council).
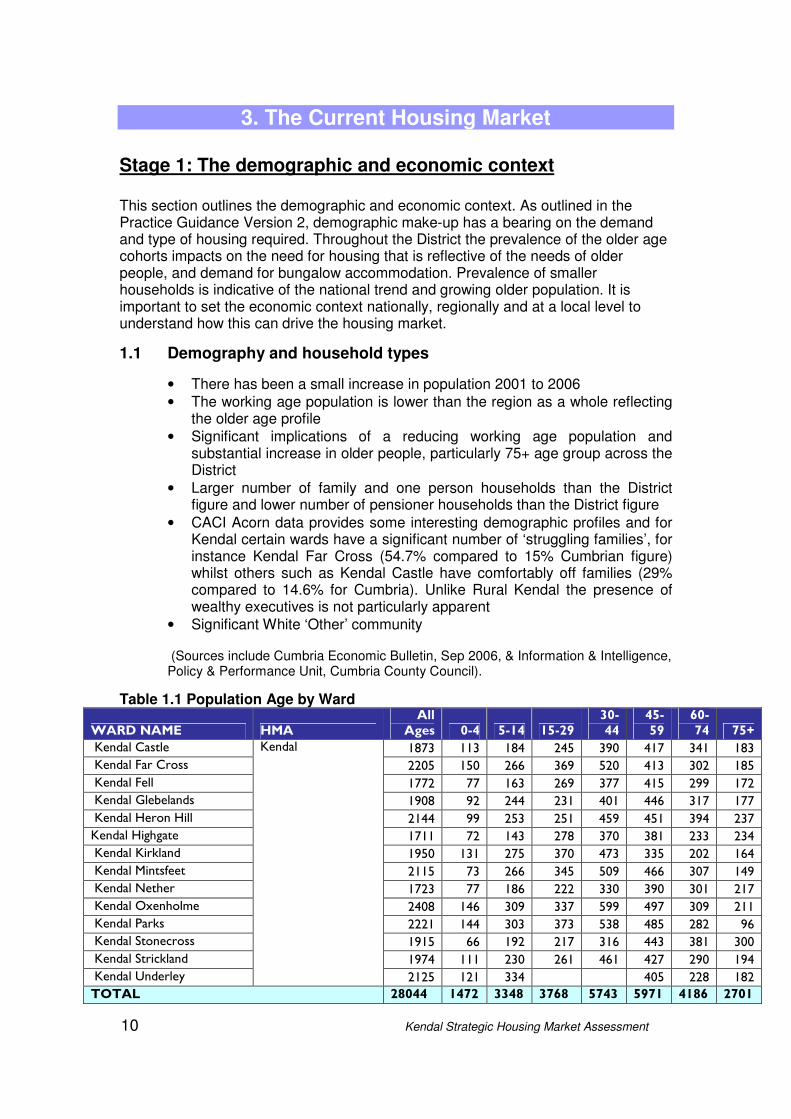
Table 1.1 Population Age by Ward
WARD NAME HMA All Ages 0-4 5-14 15-29
30-44
45-59
60-74 75+
Kendal Castle 1873 113 184 245 390 417 341 183
Kendal Far Cross 2205 150 266 369 520 413 302 185
Kendal Fell 1772 77 163 269 377 415 299 172
Kendal Glebelands 1908 92 244 231 401 446 317 177
Kendal Heron Hill 2144 99 253 251 459 451 394 237
Kendal Highgate 1711 72 143 278 370 381 233 234
Kendal Kirkland 1950 131 275 370 473 335 202 164
Kendal Mintsfeet 2115 73 266 345 509 466 307 149
Kendal Nether 1723 77 186 222 330 390 301 217
Kendal Oxenholme 2408 146 309 337 599 497 309 211
Kendal Parks 2221 144 303 373 538 485 282 96
Kendal Stonecross 1915 66 192 217 316 443 381 300
Kendal Strickland 1974 111 230 261 461 427 290 194
Kendal Underley
Kendal
2125 121 334 405 228 182
TOTAL 28044 1472 3348 3768 5743 5971 4186 2701

11 Kendal Strategic Housing Market Assessment
(Source: ONS 2006)
Table 1.2 Household Composition Housing Market Area
Count Housing Market Area %
South Lakeland %
Cumbria %
North West
%
All Households 11,947 100 100 100% 100%
One person households 3,729 31.2% 29.9% 30.1 30.9
- of which Pensioners living alone % of total households
1,867 15.6% 17.0% 15.8 15.1
All other Pensioner households 1,215 10.2% 13.1% 10.8 8.9
Households with dependent children 3,269 27.4% 24.4% 27.5 30.4
- of which Lone Parent households with dependent children - % of total households
571 4.8% 3.7% 5.5 7.7
Households with non dependent children
1,049 8.8% 8.4% 9.8 10.3
- of which Lone Parent households with non-dependent children - % of total households
334 2.8% 2.6% 3.0 3.5
Households with no children 2,343 19.6% 21.3% 19.3 16.4
All other Households 342 2.9% 2.9% 2.5 3.0
(Source, 2001 Census, ONS)
Table 1.3 Ethnic Group Ethnic Group Housing
Market Area
%
South Lakeland
%
North West
%
England and Wales
%
All People (27,517) (102,283) (6,729,766) (52,041,916)
White - British 97.54% 97.58% 92.17% 87.49%
White - Irish 0.44% 0.44% 1.15% 1.23%
White - Other 1.10% 1.19% 1.11% 2.59%
Mixed - White and Black Caribbean 0.12% 0.08% 0.33% 0.46%
Mixed - White and Black African 0.08% 0.07% 0.15% 0.15%
Mixed - White and Asian 0.08% 0.11% 0.26% 0.36%
Mixed - Other 0.11% 0.10% 0.20% 0.30%
Asian or Asian British - Indian 0.09% 0.06% 1.07% 1.99%
Asian or Asian British - Pakistani 0.04% 0.03% 1.74% 1.37%
Asian or Asian British - Bangladeshi 0.01% 0.01% 0.39% 0.54%
Asian or Asian British - Other 0.01% 0.02% 0.22% 0.46%
Black or Black British - Black Caribbean
0.04% 0.04% 0.30% 1.08%
Black or Black British - Black African
0.03% 0.02% 0.24% 0.92%
Black or Black British - Other 0.00% 0.01% 0.08% 0.18%
Chinese or other ethnic group - Chinese
0.17% 0.17% 0.40% 0.44%
Chinese or other ethnic group - Other ethnic group
0.13% 0.07% 0.20% 0.42%
(Source, 2001 Census, ONS)
12 Kendal Strategic Housing Market Assessment
1.2 National and regional economic policy
Housing and the macro-economy
Housing plays a fundamental role in the labour market by providing the places where the workforce lives, however there is no straightforward numeric link between economic change and propensity towards household formation/migration. Nevertheless, a well functioning economy is likely to be one where there is both an appropriate and attractive range of housing to support a thriving and diverse labour market, and where housing provision responds to changes in economic structure and performance. With this in mind, economic strategies and planning policy in the North West and across the UK now routinely highlight the impact that issues such as high prices, inadequate supply and poor quality housing might have on the capacity of an area to attract and retain a viable labour force.
National Context
Despite strong economic growth and broad stability since 1994/1995, current economic indications suggest that this position has changed significantly, brought about by high oil, utility and food costs, combined with a continued restriction on the availability of new mortgages brought on by the international ‘credit crunch’ stemming from the USA, and the resultant loss of global business confidence. The UK economy has now entered a recession leading to increased levels of unemployment. As at September 2008, predictions are that average house prices will fall by up to 25%, and it will be 2010 before there may be signs of a recovery (Nationwide, September 2008). Other signals within the UK economy show that manufacturing output is declining as a further sign that the UK economy is entering a recession.
Recent news headlines would suggest that, with developers reducing staffing levels, the more alarming effects of the credit crunch, such as widespread job losses and large falls in land value are already being felt by the house building industry. With the recession it is likely that there would be further reductions in demand for housing, with resultant falls in house prices, until such time as a new equilibrium is reached between demand and supply and stability is achieved in the international markets. However, aside from the lending practices of major lenders, the underlying reasons behind the high house price inflation in recent years, is the fact that there has been insufficient housing provision to meet needs across the UK. Some economists predict that once the economy picks up again, there could be a further surge in house price inflation, which may be as serious as had been experienced in recent years. There is a need therefore to continue to build new houses in order to respond to underlying housing needs.
Monetary Policy
Interest rates reflect the effective cost of borrowing money and in the UK the base interest rate is set by the Bank of England’s, Monetary Policy Committee (MPC). The Bank usually sets interest rates in order to try and meet an inflation target which is based on the Consumer Price Index (CPI) being equal to 2.0% ± 1. If inflation is forecast to rise above the target, the Bank is likely to raise interest rates in order to reduce spending in the economy, and therefore moderate inflationary pressures.
13 Kendal Strategic Housing Market Assessment
Following some significant price rises in the food and energy sectors over the last year, the CPI has soared above its target value peaking, in September, at 5.2%. However the CPI has now begun to fall back with the most recent data for January showing inflation at 3.1% (still well above the target value). Due largely to a recent fall in oil prices related to falling demand linked to declines in global production levels, inflation is currently expected to fall rapidly over the coming months.
Rather than responding impulsively in the short term, the Bank’s overarching aim is to ensure inflation returns to target in the medium to long term. Thus principally as a result of the MPC’s forecast that the currently high level of inflation is a temporary phenomenon, interest rates have remained low and below the 10 year average of 5.2%. Unsurprisingly, there are also a number of other factors which play an important role in the balancing act between inflation and interest rates such as consumer confidence; time lags between rate changes and their effects on demand; the differential between the two rates and the ratio of fixed rate vs. variable rate mortgages (and in particular the proportion of sub-prime mortgages, where borrowers are paying a high proportion of their disposal income on repayments).
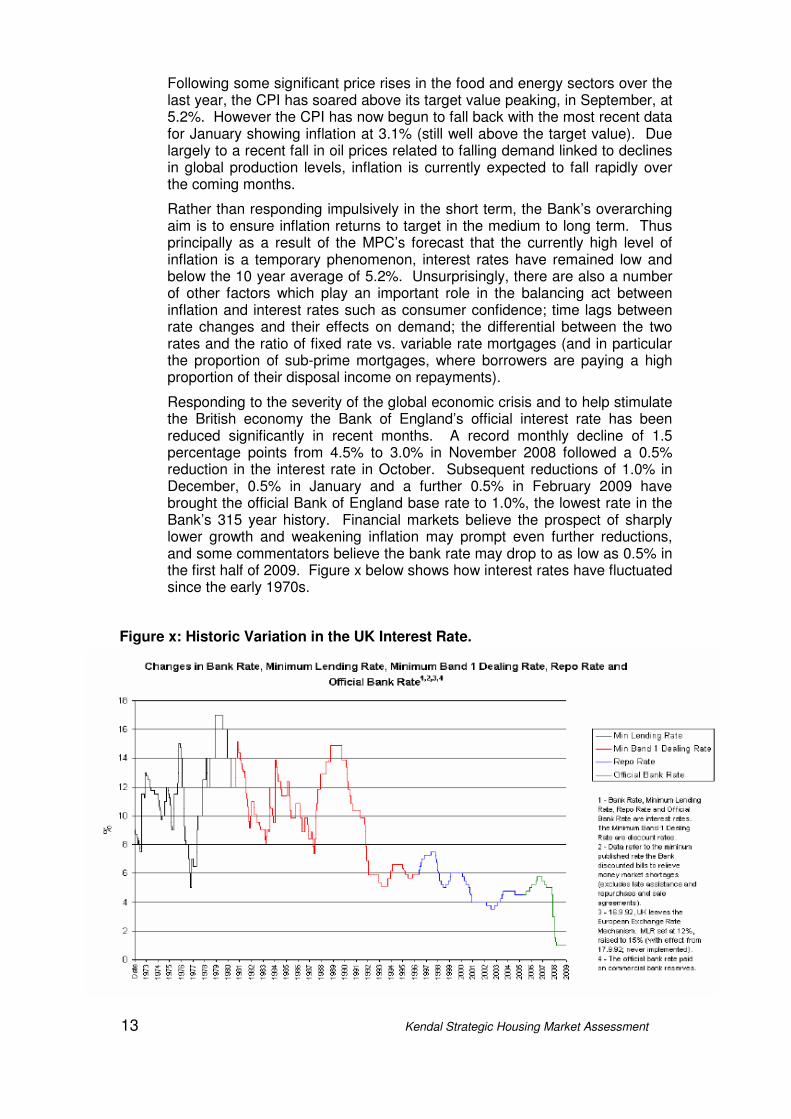
Responding to the severity of the global economic crisis and to help stimulate the British economy the Bank of England’s official interest rate has been reduced significantly in recent months. A record monthly decline of 1.5 percentage points from 4.5% to 3.0% in November 2008 followed a 0.5% reduction in the interest rate in October. Subsequent reductions of 1.0% in December, 0.5% in January and a further 0.5% in February 2009 have brought the official Bank of England base rate to 1.0%, the lowest rate in the Bank’s 315 year history. Financial markets believe the prospect of sharply lower growth and weakening inflation may prompt even further reductions, and some commentators believe the bank rate may drop to as low as 0.5% in the first half of 2009. Figure x below shows how interest rates have fluctuated since the early 1970s.
Figure x: Historic Variation in the UK Interest Rate.
14 Kendal Strategic Housing Market Assessment
Interest rates principally affect the housing market in one of two ways:
• Mortgage Payments: An increase in interest rates will increase monthly mortgage payments on a variable mortgage. For example, a quarter point rise on a £140,000 mortgage will increase monthly payments by approximately £30.
• Demand for Housing: A sustained rise in interest rates will affect the affordability of paying a mortgage. As interest rates rise, buying a house becomes less attractive and therefore demand falls. This can lead to falling house prices. For example, in the late 1980s interest rates rose to 15% causing house prices to collapse in the UK.
North West Regional Context
(Source: Northwest Regional Economic Forecasting Panel, Spring 2008)
The recent history of the regional economy includes a period of:
o Very rapid jobs growth, especially between 2001 and 2004. This may be exceptional and unlikely to be seen again. It followed marked recent increases in public spending such that a third of the region’s jobs are now in the public sector; and it also included the out- sourcing of jobs in financial and business services from higher cost places in the South, following a downturn in international financial markets in 2001.
o Net migration shift, which explain why the region’s population began to grow again from 2001. This also appears to have been closely related to this exceptional period of growth in job opportunities. While the growth in participation amongst men has remained low, a significant increase of the participation of women in the region’s labour force appears to have been a further response to this same peak in job opportunities. Nevertheless, the underlying trend in the growth of jobs in the North West has still been running on average around 0.1 percentage points a year below that in the UK.
o A fall in productivity, which accompanied the recent peak in jobs growth in the North West. Services now represent the bulk of jobs, and productivity levels in all broad service sectors in the region fell relative to the UK between 1995 and 2005. Also, there is little left of an advantage the region once enjoyed in the productivity stakes because of its once considerable concentration of employment in manufacturing, in which labour productivity is generally higher than in services.
The relative decline in the region’s productivity in services is attributed to:
o A gradual fall in its price level relative to the UK, which is bound to have had a general effect on relative wages.
o A shift in the balance between lower and higher level jobs in favour of the UK, and a widening disparity between earnings in higher-level jobs between London and other major cities, including Manchester and Liverpool. This effect has been particularly marked in top-end jobs in financial and business services, a sector that now provides almost half of GVA in London as against less than a fifth in the North West.
o The output gap between the region and the UK has generally grown faster than the North West. The main influence has been the performance of
15 Kendal Strategic Housing Market Assessment
London as a global city and as an international provider of high level services, together with consequential growth in the ‘super city region’ around London. Its direct influence now expands into parts of the East Midlands, the West Midlands, and the South West, as well as into Eastern England and much of the South East.
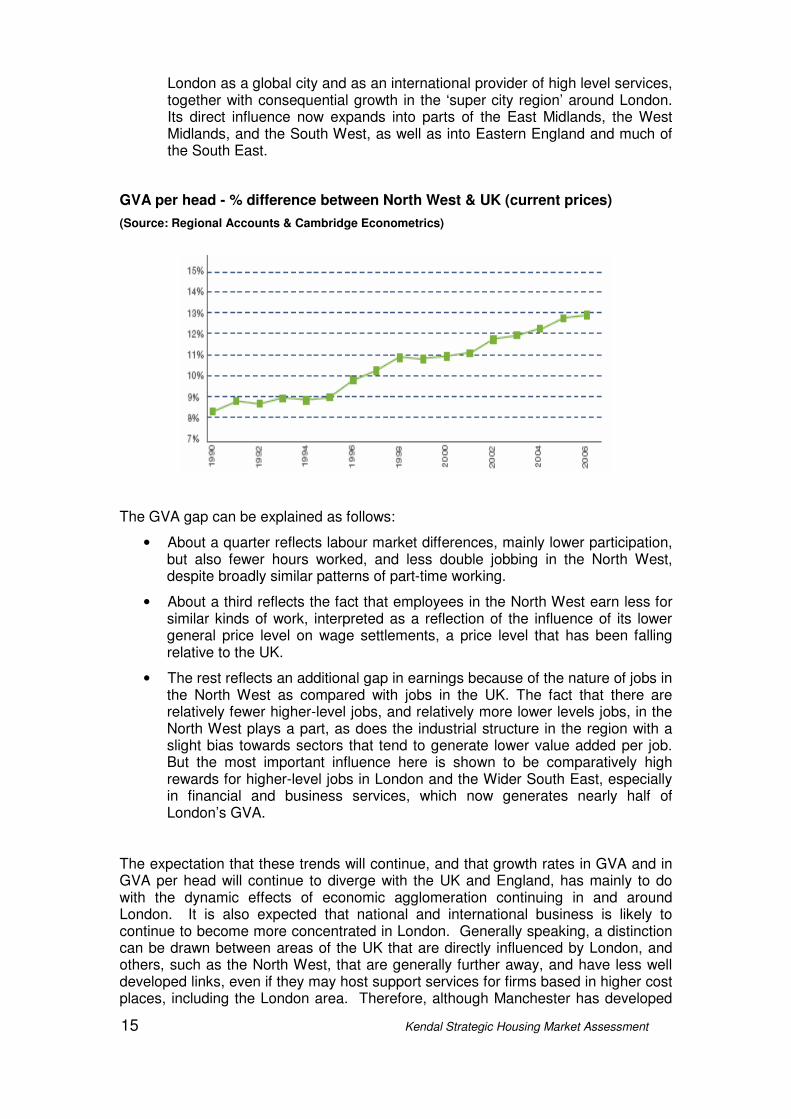
GVA per head - % difference between North West & UK (current prices)
(Source: Regional Accounts & Cambridge Econometrics)
The GVA gap can be explained as follows:
• About a quarter reflects labour market differences, mainly lower participation, but also fewer hours worked, and less double jobbing in the North West, despite broadly similar patterns of part-time working.
• About a third reflects the fact that employees in the North West earn less for similar kinds of work, interpreted as a reflection of the influence of its lower general price level on wage settlements, a price level that has been falling relative to the UK.
• The rest reflects an additional gap in earnings because of the nature of jobs in the North West as compared with jobs in the UK. The fact that there are relatively fewer higher-level jobs, and relatively more lower levels jobs, in the North West plays a part, as does the industrial structure in the region with a slight bias towards sectors that tend to generate lower value added per job. But the most important influence here is shown to be comparatively high rewards for higher-level jobs in London and the Wider South East, especially in financial and business services, which now generates nearly half of London’s GVA.
The expectation that these trends will continue, and that growth rates in GVA and in GVA per head will continue to diverge with the UK and England, has mainly to do with the dynamic effects of economic agglomeration continuing in and around London. It is also expected that national and international business is likely to continue to become more concentrated in London. Generally speaking, a distinction can be drawn between areas of the UK that are directly influenced by London, and others, such as the North West, that are generally further away, and have less well developed links, even if they may host support services for firms based in higher cost places, including the London area. Therefore, although Manchester has developed
16 Kendal Strategic Housing Market Assessment
into the equivalent centre for the North West and has some national and international business, it is on a much smaller scale. Based on projected trends in total and working age populations and likely developments in participation, the effective supply of labour and jobs is expected to continue growing more slowly in the region than in the UK. There is a risk that this expected divergence in jobs growth could be wider than expected, depending on where net immigration is concentrated.
The central forecast of the most likely gap in GVA growth between the North West and the UK over the next twenty years is an average of 0.4 percentage points per annum, or a little more. The results of public policy initiatives are implicit in these trends and the Forecasting Panel think change is unlikely mainly because many programmes are similar to those that have been in place for some time and economic performance seems to have been driven mainly by structural change responding to market forces. This may change if firms and other bodies in the region take increased advantage of strategic opportunities in which the region has strengths (for instance in nuclear, energy, and environment-related industries) and if we saw public policy concentrating an increased proportion of resources on growth, especially on accommodating and underpinning agglomeration through appropriate policies, such as transport and housing.
It is nonetheless implicit in this view that the North West’s economy will continue to grow more rapidly than in the 1990s, and also that living standards in the region will continue to improve on average even if the gap in GVA per head is expected to widen. Although the North West’s growth corridor may flourish, and its influence will spread geographically, especially given effective transport and spatial policies, the corridor is simply different in character and scale, and less of an integrated whole at present, than is London and its surroundings.
Construction and Housing
Since the first quarter of 2007 the rate of increase in house prices in the region declined, while in the final quarter of the year house price inflation in the UK declined for the first time in two years. Along with a fall in the numbers of housing transactions, this confirmed that the housing market was weakening. The most recent national data in September 2008 shows that the annual rate at which house prices are falling continued to accelerate to hit a new record of 5.1 per cent. However, homes lost only 0.1 per cent of their value during September itself, well down on August's drop of 2.7 per cent.
Construction: Growth in 2007 was sustained by private commercial orders
Construction orders in the North West increased through the first half of 2007, but have since fallen back. In 2007 private sector new housing orders declined to below 2005 levels. However, the level of infrastructure and other public orders increased. Private industrial orders remained relatively unchanged from 2006; growth in private commercial orders was much more marked in the first half of the year, although they have since fallen back.
The value of construction output in 2007 was 12.8% higher than in 2006, due primarily to new public housing and other private sector repair and maintenance. Private commercial and industrial output growth more than offset a decline in infrastructure output.
GVA growth in construction was weak in 2006 at 1.0% but is estimated to have strengthened to 2.1% in 2007, although this was weaker than in the UK as a whole. Weaker growth is expected in 2008 (data not yet published); 1.5% for the North West and 1.0% for the UK. GVA is then expected to fall in 2009 in response to the impact
17 Kendal Strategic Housing Market Assessment
of the credit crisis and the weakening housing market, before recovering in 2010 and 2011.
House Prices: Inflation weakened through 2007
House price inflation slowed through 2007 despite reductions in interest rates during the year. At the end of 2007, prices were on average 5.0% higher than a year earlier in the North West compared with 9.9% in the UK. Along with slower price inflation since the beginning of 2007, figures (Q2 2007) for the number of transactions show a decline for both the North West and UK. This is consistent with the tightening of monetary policy during 2006/07 and tougher lending standards for mortgages after the recent difficulties in financial markets and points to a slowdown in the market.
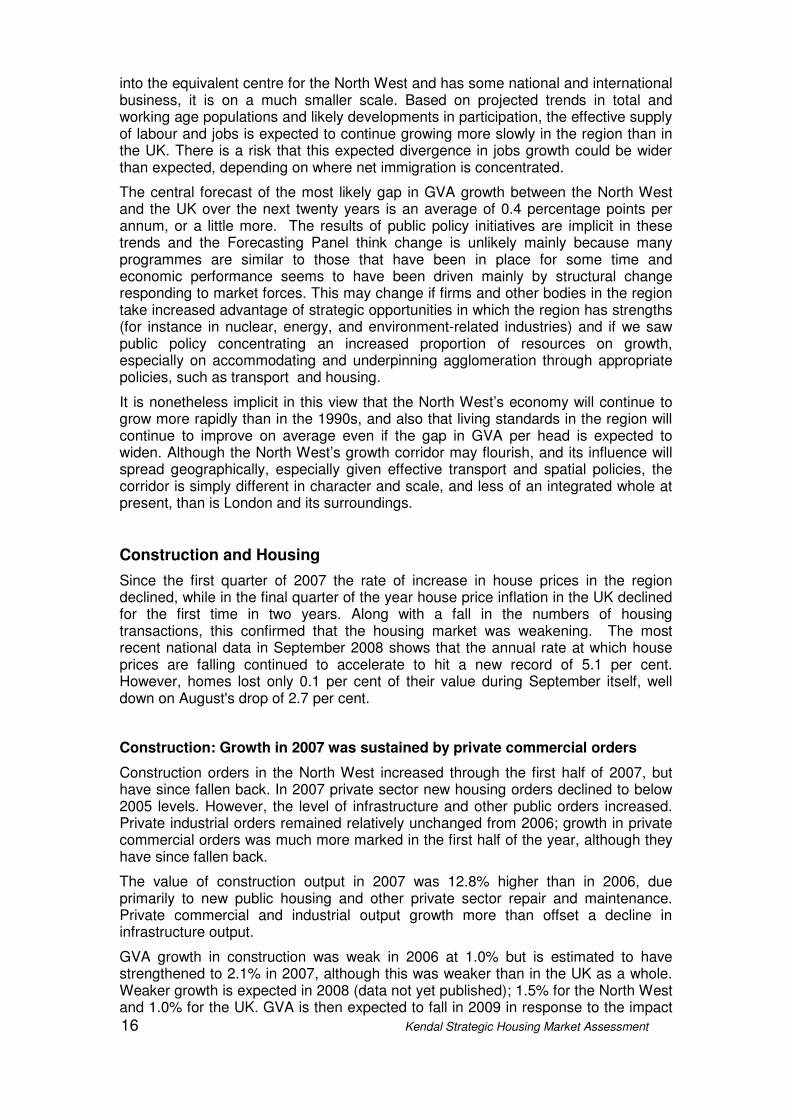
Housing Investment: The outlook is for weaker activity in the short term
Short-term prospects for housing investment in the region are considerably less favourable than in recent years. The number of new dwellings started declined by 19.0% compared to 6.0% nationally, representing the first decline in four years. Housing starts across all categories (private enterprise, registered social landlords and local authorities) declined by a larger amount in the region than nationally in 2006/07. Potential downside risks to the housing market remain including the current liquidity issues in capital markets and resultant reductions in mortgage packages available on the high street and high levels of consumer debt.
There have been sharp falls in housing starts this year with some smaller house builders already in difficulties and large nationally organised concerns scaling back new build.
Chart X: Recent development in the housing market
Cumbrian Context
“Whilst poor, GVA performance is showing improvement. Time will show how we perform in relation to other sub-regional economies due to the current recession; early indications are that we are not adversely affected …….”
18 Kendal Strategic Housing Market Assessment
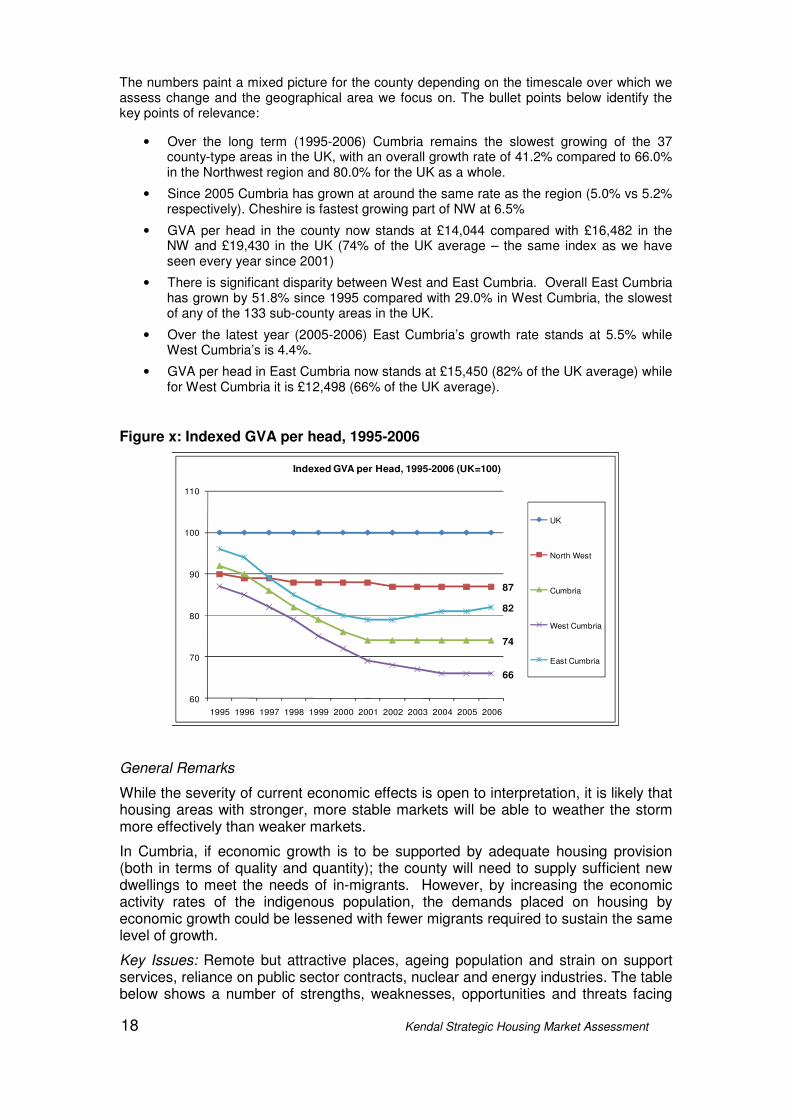
The numbers paint a mixed picture for the county depending on the timescale over which we assess change and the geographical area we focus on. The bullet points below identify the key points of relevance:
• Over the long term (1995-2006) Cumbria remains the slowest growing of the 37 county-type areas in the UK, with an overall growth rate of 41.2% compared to 66.0% in the Northwest region and 80.0% for the UK as a whole.
• Since 2005 Cumbria has grown at around the same rate as the region (5.0% vs 5.2% respectively). Cheshire is fastest growing part of NW at 6.5%
• GVA per head in the county now stands at £14,044 compared with £16,482 in the NW and £19,430 in the UK (74% of the UK average – the same index as we have seen every year since 2001)
• There is significant disparity between West and East Cumbria. Overall East Cumbria has grown by 51.8% since 1995 compared with 29.0% in West Cumbria, the slowest of any of the 133 sub-county areas in the UK.
• Over the latest year (2005-2006) East Cumbria’s growth rate stands at 5.5% while West Cumbria’s is 4.4%.
• GVA per head in East Cumbria now stands at £15,450 (82% of the UK average) while for West Cumbria it is £12,498 (66% of the UK average).
Figure x: Indexed GVA per head, 1995-2006
87
74
66
82
60
70
80
90
100
110
1995 1996 1997 1998 1999 2000 2001 2002 2003 2004 2005 2006
Indexed GVA per Head, 1995-2006 (UK=100)
UK
North West
Cumbria
West Cumbria
East Cumbria
General Remarks
While the severity of current economic effects is open to interpretation, it is likely that housing areas with stronger, more stable markets will be able to weather the storm more effectively than weaker markets.
In Cumbria, if economic growth is to be supported by adequate housing provision (both in terms of quality and quantity); the county will need to supply sufficient new dwellings to meet the needs of in-migrants. However, by increasing the economic activity rates of the indigenous population, the demands placed on housing by economic growth could be lessened with fewer migrants required to sustain the same level of growth.
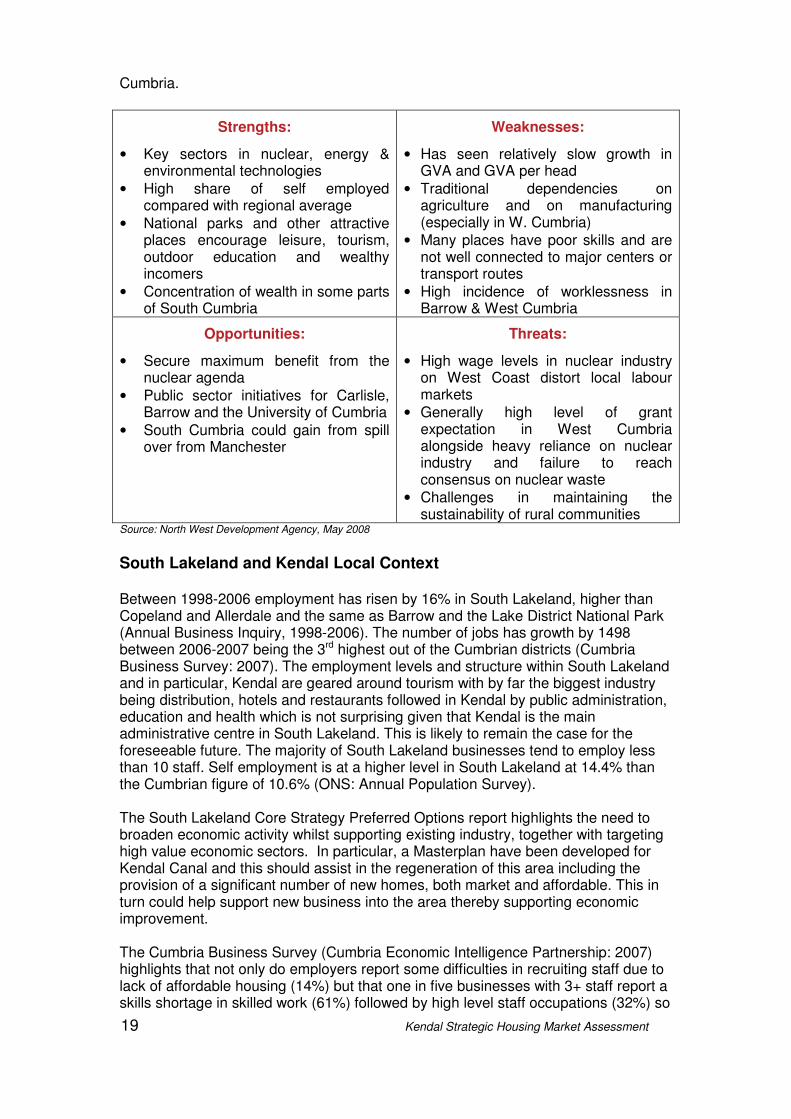
Key Issues: Remote but attractive places, ageing population and strain on support services, reliance on public sector contracts, nuclear and energy industries. The table below shows a number of strengths, weaknesses, opportunities and threats facing
19 Kendal Strategic Housing Market Assessment
Cumbria.
Strengths:
• Key sectors in nuclear, energy & environmental technologies
• High share of self employed compared with regional average
• National parks and other attractive places encourage leisure, tourism, outdoor education and wealthy incomers
• Concentration of wealth in some parts of South Cumbria
Weaknesses:
• Has seen relatively slow growth in GVA and GVA per head
• Traditional dependencies on agriculture and on manufacturing (especially in W. Cumbria)
• Many places have poor skills and are not well connected to major centers or transport routes
• High incidence of worklessness in Barrow & West Cumbria
Opportunities:
• Secure maximum benefit from the nuclear agenda
• Public sector initiatives for Carlisle, Barrow and the University of Cumbria
• South Cumbria could gain from spill over from Manchester
Threats:
• High wage levels in nuclear industry on West Coast distort local labour markets
• Generally high level of grant expectation in West Cumbria alongside heavy reliance on nuclear industry and failure to reach consensus on nuclear waste
• Challenges in maintaining the sustainability of rural communities
Source: North West Development Agency, May 2008 South Lakeland and Kendal Local Context Between 1998-2006 employment has risen by 16% in South Lakeland, higher than Copeland and Allerdale and the same as Barrow and the Lake District National Park (Annual Business Inquiry, 1998-2006). The number of jobs has growth by 1498 between 2006-2007 being the 3rd highest out of the Cumbrian districts (Cumbria Business Survey: 2007). The employment levels and structure within South Lakeland and in particular, Kendal are geared around tourism with by far the biggest industry being distribution, hotels and restaurants followed in Kendal by public administration, education and health which is not surprising given that Kendal is the main administrative centre in South Lakeland. This is likely to remain the case for the foreseeable future. The majority of South Lakeland businesses tend to employ less than 10 staff. Self employment is at a higher level in South Lakeland at 14.4% than the Cumbrian figure of 10.6% (ONS: Annual Population Survey). The South Lakeland Core Strategy Preferred Options report highlights the need to broaden economic activity whilst supporting existing industry, together with targeting high value economic sectors. In particular, a Masterplan have been developed for Kendal Canal and this should assist in the regeneration of this area including the provision of a significant number of new homes, both market and affordable. This in turn could help support new business into the area thereby supporting economic improvement. The Cumbria Business Survey (Cumbria Economic Intelligence Partnership: 2007) highlights that not only do employers report some difficulties in recruiting staff due to lack of affordable housing (14%) but that one in five businesses with 3+ staff report a skills shortage in skilled work (61%) followed by high level staff occupations (32%) so

20 Kendal Strategic Housing Market Assessment
clearly there is a need to address learning opportunity within Cumbria and South Lakeland, together with the encouragement of high level employers and the need for affordable housing. Specifically in South Lakeland there is a marked skills shortage in intermediate and high level occupations with 70% of employers reporting difficulty recruiting for intermediate level and 28% of employers reporting difficulty recruiting to higher level employment. The main reason cited by employers for recruitment difficulties are the low number of applicants generally and the number of applicants applying without the required skills. The Cumbria University may go some way to address skills shortages within the District and within Cumbria and Cumbrian businesses have welcomed this development in the retention and attraction of young people with the right skills base, provided that the courses were sufficiently relevant. The expansion of Kendal College provides opportunity for improved facilities for learning and development to support economic growth. The nature of employment remains unbalanced with the main sectors biased towards hospitality and public services and a lack of knowledge-based employment. The Kendal housing market area is well served with regard to transportation with linkage to the main trunk roads and M6, together with other forms of transport, resulting in a commuter market primarily to Carlisle, Penrith and Lancaster. There is some issues with traffic congestion. This is cited by employers as a barrier to business efficiency in 28% of cases. Traffic congestion is particularly bad within Kendal during the main tourist season. Whilst this may be good news for tourism it may be bad news for other industries who rely on good transport links. There is clearly a need to address issues of transportation during the tourist season, such as the encouragement of other modes of transport for tourists such as park and ride and public transport. In terms of location of businesses, 15% of South Lakeland businesses report that the unavailability of business premises is a barrier to business performance, the highest figure in Cumbria. In addition, 31% of South Lakeland businesses report that although business premises are not bad, they could be better. This is the second highest figure in Cumbria. Evidence suggests that there is insufficient employment land in the Kendal area and the draft Core Strategy highlights the need for greater provision.
South Lakeland District’s key strategy reflected in the Community Strategy and Corporate Plan is as follows:- “We need to grow the economy in a sustainable way to create prosperity by supporting local businesses, providing more sites for new development to encourage the growth of indigenous businesses and attract inward investment to directly improve the number of better paid jobs with an aim of reducing the growing gap between earnings and house prices.” (South Lakeland Sustainable Community Strategy 2008 – 2028). South Lakeland is a net exporter of labour and looking at wage levels of place of work the District is the second lowest paid in Cumbria. In attracting higher value industry, not only will the general prosperity of the District improve, but the District could retain labour within the District and even import labour to the District. However, to support such a strategy there needs to be sufficient supply of homes to meet the needs of residents and future population growth including affordable and market housing. Planning policies support the overall aim to encourage more high value industry.
21 Kendal Strategic Housing Market Assessment
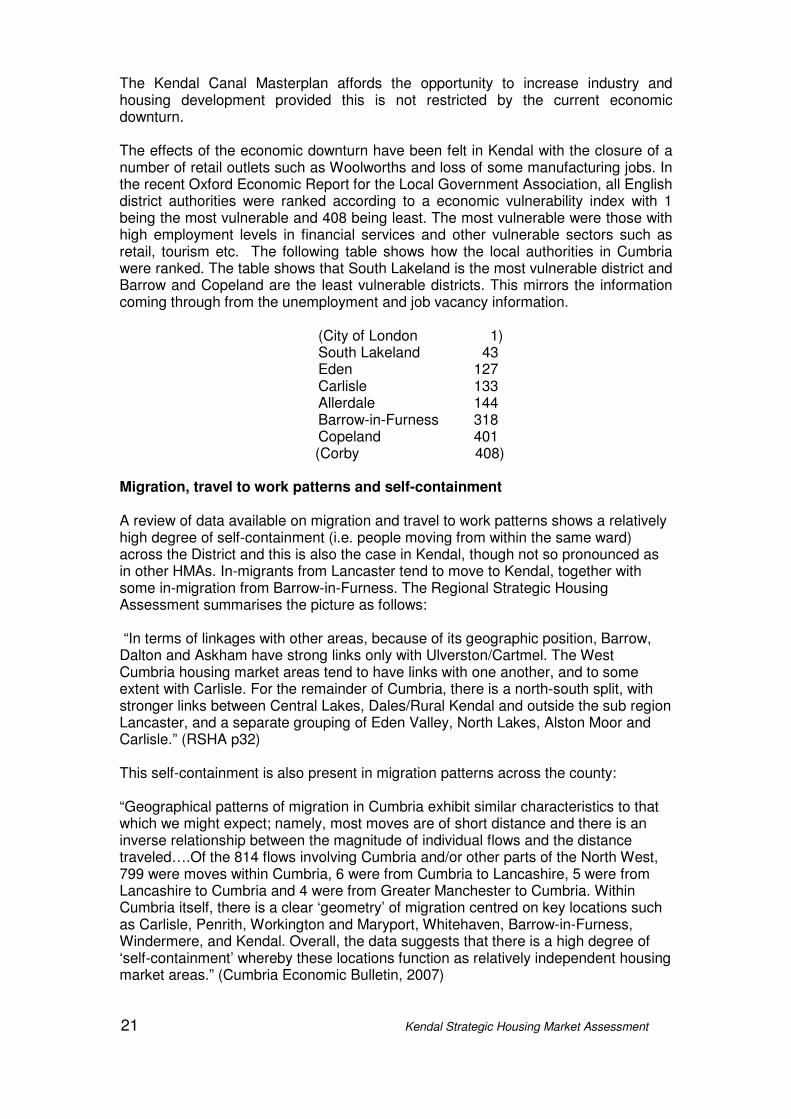
The Kendal Canal Masterplan affords the opportunity to increase industry and housing development provided this is not restricted by the current economic downturn. The effects of the economic downturn have been felt in Kendal with the closure of a number of retail outlets such as Woolworths and loss of some manufacturing jobs. In the recent Oxford Economic Report for the Local Government Association, all English district authorities were ranked according to a economic vulnerability index with 1 being the most vulnerable and 408 being least. The most vulnerable were those with high employment levels in financial services and other vulnerable sectors such as retail, tourism etc. The following table shows how the local authorities in Cumbria were ranked. The table shows that South Lakeland is the most vulnerable district and Barrow and Copeland are the least vulnerable districts. This mirrors the information coming through from the unemployment and job vacancy information.
(City of London 1) South Lakeland 43 Eden 127 Carlisle 133 Allerdale 144 Barrow-in-Furness 318 Copeland 401
(Corby 408) Migration, travel to work patterns and self-containment A review of data available on migration and travel to work patterns shows a relatively high degree of self-containment (i.e. people moving from within the same ward) across the District and this is also the case in Kendal, though not so pronounced as in other HMAs. In-migrants from Lancaster tend to move to Kendal, together with some in-migration from Barrow-in-Furness. The Regional Strategic Housing Assessment summarises the picture as follows: “In terms of linkages with other areas, because of its geographic position, Barrow, Dalton and Askham have strong links only with Ulverston/Cartmel. The West Cumbria housing market areas tend to have links with one another, and to some extent with Carlisle. For the remainder of Cumbria, there is a north-south split, with stronger links between Central Lakes, Dales/Rural Kendal and outside the sub region Lancaster, and a separate grouping of Eden Valley, North Lakes, Alston Moor and Carlisle.” (RSHA p32) This self-containment is also present in migration patterns across the county: “Geographical patterns of migration in Cumbria exhibit similar characteristics to that which we might expect; namely, most moves are of short distance and there is an inverse relationship between the magnitude of individual flows and the distance traveled….Of the 814 flows involving Cumbria and/or other parts of the North West, 799 were moves within Cumbria, 6 were from Cumbria to Lancashire, 5 were from Lancashire to Cumbria and 4 were from Greater Manchester to Cumbria. Within Cumbria itself, there is a clear ‘geometry’ of migration centred on key locations such as Carlisle, Penrith, Workington and Maryport, Whitehaven, Barrow-in-Furness, Windermere, and Kendal. Overall, the data suggests that there is a high degree of ‘self-containment’ whereby these locations function as relatively independent housing market areas.” (Cumbria Economic Bulletin, 2007)
22 Kendal Strategic Housing Market Assessment
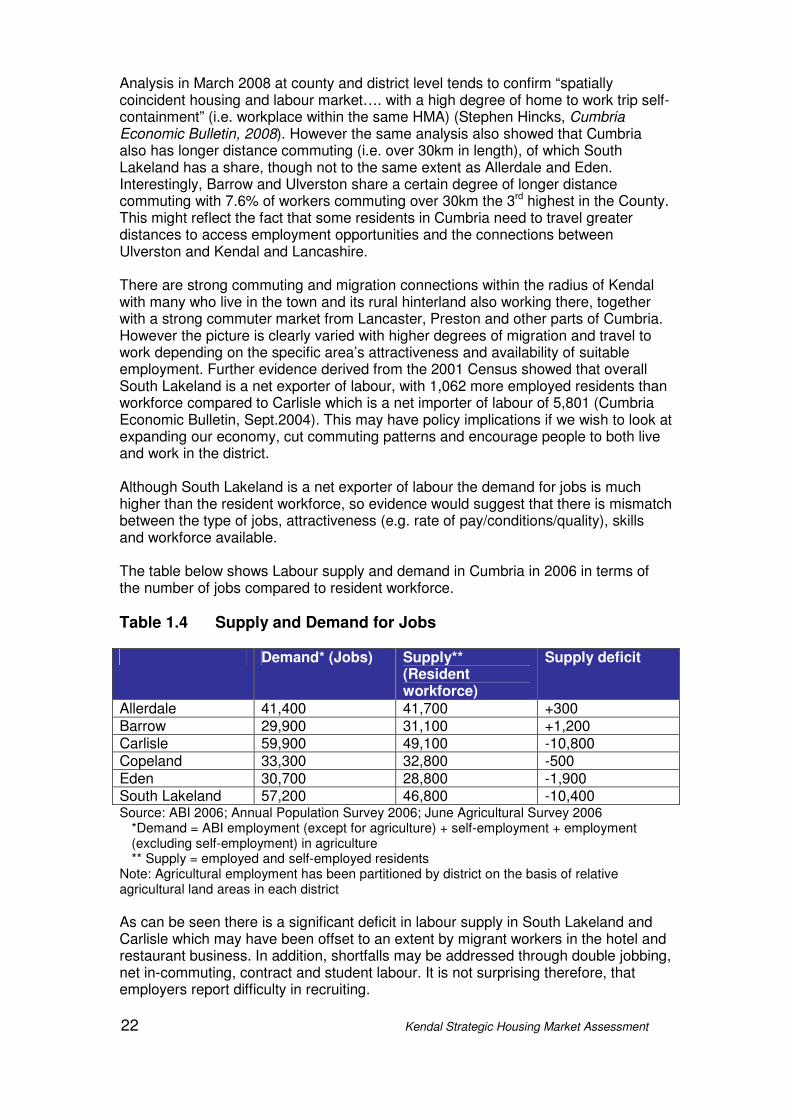
Analysis in March 2008 at county and district level tends to confirm “spatially coincident housing and labour market…. with a high degree of home to work trip self-containment” (i.e. workplace within the same HMA) (Stephen Hincks, Cumbria Economic Bulletin, 2008). However the same analysis also showed that Cumbria also has longer distance commuting (i.e. over 30km in length), of which South Lakeland has a share, though not to the same extent as Allerdale and Eden. Interestingly, Barrow and Ulverston share a certain degree of longer distance commuting with 7.6% of workers commuting over 30km the 3rd highest in the County. This might reflect the fact that some residents in Cumbria need to travel greater distances to access employment opportunities and the connections between Ulverston and Kendal and Lancashire. There are strong commuting and migration connections within the radius of Kendal with many who live in the town and its rural hinterland also working there, together with a strong commuter market from Lancaster, Preston and other parts of Cumbria. However the picture is clearly varied with higher degrees of migration and travel to work depending on the specific area’s attractiveness and availability of suitable employment. Further evidence derived from the 2001 Census showed that overall South Lakeland is a net exporter of labour, with 1,062 more employed residents than workforce compared to Carlisle which is a net importer of labour of 5,801 (Cumbria Economic Bulletin, Sept.2004). This may have policy implications if we wish to look at expanding our economy, cut commuting patterns and encourage people to both live and work in the district. Although South Lakeland is a net exporter of labour the demand for jobs is much higher than the resident workforce, so evidence would suggest that there is mismatch between the type of jobs, attractiveness (e.g. rate of pay/conditions/quality), skills and workforce available. The table below shows Labour supply and demand in Cumbria in 2006 in terms of the number of jobs compared to resident workforce.
Table 1.4 Supply and Demand for Jobs Demand* (Jobs) Supply**
(Resident workforce)
Supply deficit
Allerdale 41,400 41,700 +300 Barrow 29,900 31,100 +1,200 Carlisle 59,900 49,100 -10,800 Copeland 33,300 32,800 -500 Eden 30,700 28,800 -1,900 South Lakeland 57,200 46,800 -10,400 Source: ABI 2006; Annual Population Survey 2006; June Agricultural Survey 2006
*Demand = ABI employment (except for agriculture) + self-employment + employment (excluding self-employment) in agriculture ** Supply = employed and self-employed residents
Note: Agricultural employment has been partitioned by district on the basis of relative agricultural land areas in each district
As can be seen there is a significant deficit in labour supply in South Lakeland and Carlisle which may have been offset to an extent by migrant workers in the hotel and restaurant business. In addition, shortfalls may be addressed through double jobbing, net in-commuting, contract and student labour. It is not surprising therefore, that employers report difficulty in recruiting.
23 Kendal Strategic Housing Market Assessment
1.3 Employment levels and structure 1.3.1 Industry of employment
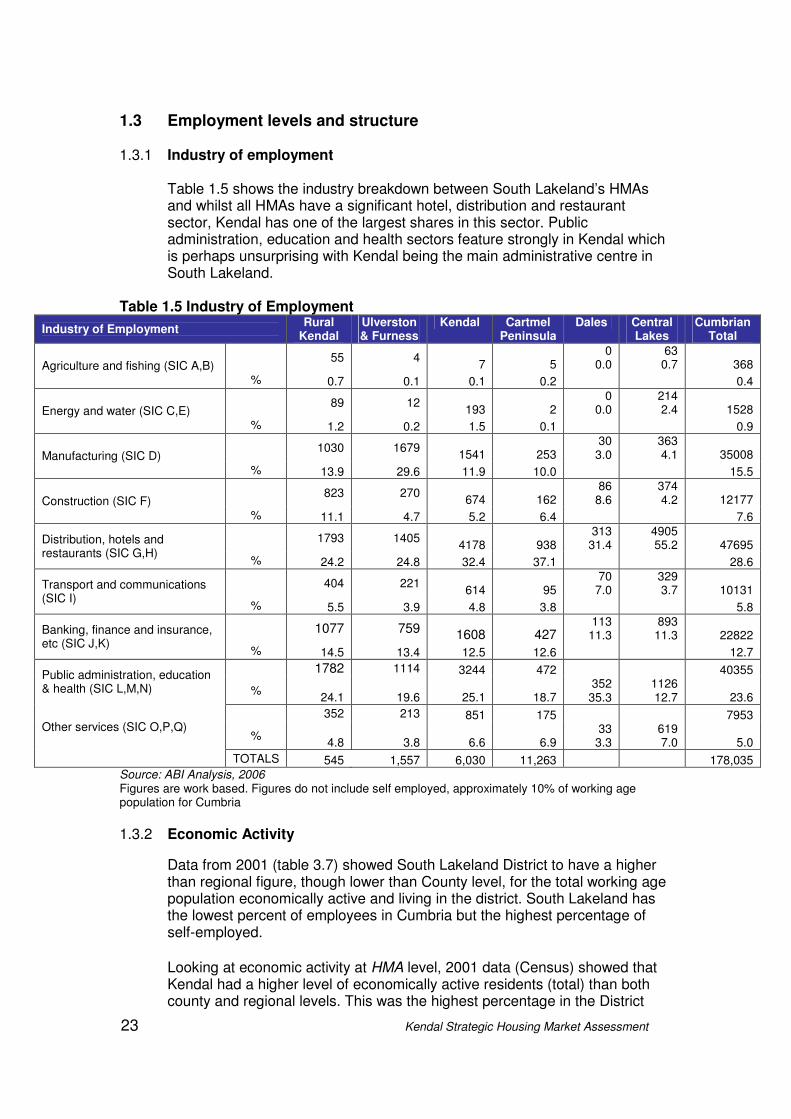
Table 1.5 shows the industry breakdown between South Lakeland’s HMAs and whilst all HMAs have a significant hotel, distribution and restaurant sector, Kendal has one of the largest shares in this sector. Public administration, education and health sectors feature strongly in Kendal which is perhaps unsurprising with Kendal being the main administrative centre in South Lakeland.
Table 1.5 Industry of Employment
Industry of Employment Rural
Kendal Ulverston & Furness
Kendal Cartmel Peninsula
Dales Central Lakes
Cumbrian Total
55 4 7 5
0 0.0
63 0.7 368 Agriculture and fishing (SIC A,B)
% 0.7 0.1 0.1 0.2 0.4
89 12 193 2
0 0.0
214 2.4 1528 Energy and water (SIC C,E)
% 1.2 0.2 1.5 0.1 0.9
1030 1679 1541 253
30 3.0
363 4.1 35008 Manufacturing (SIC D)
% 13.9 29.6 11.9 10.0 15.5
823 270 674 162
86 8.6
374 4.2 12177 Construction (SIC F)
% 11.1 4.7 5.2 6.4 7.6
1793 1405 4178 938
313 31.4
4905 55.2 47695 Distribution, hotels and
restaurants (SIC G,H) % 24.2 24.8 32.4 37.1 28.6
404 221 614 95
70 7.0
329 3.7 10131 Transport and communications
(SIC I) % 5.5 3.9 4.8 3.8 5.8
1077 759 1608 427 113
11.3 893
11.3 22822 Banking, finance and insurance, etc (SIC J,K)
% 14.5 13.4 12.5 12.6 12.7
1782 1114 3244 472 40355 Public administration, education & health (SIC L,M,N) %
24.1 19.6 25.1 18.7 352
35.3 1126 12.7 23.6
352 213 851 175 7953 Other services (SIC O,P,Q)
% 4.8 3.8 6.6 6.9
33 3.3
619 7.0 5.0
TOTALS 545 1,557 6,030 11,263 178,035 Source: ABI Analysis, 2006 Figures are work based. Figures do not include self employed, approximately 10% of working age population for Cumbria
1.3.2 Economic Activity
Data from 2001 (table 3.7) showed South Lakeland District to have a higher than regional figure, though lower than County level, for the total working age population economically active and living in the district. South Lakeland has the lowest percent of employees in Cumbria but the highest percentage of self-employed.
Looking at economic activity at HMA level, 2001 data (Census) showed that Kendal had a higher level of economically active residents (total) than both county and regional levels. This was the highest percentage in the District
24 Kendal Strategic Housing Market Assessment
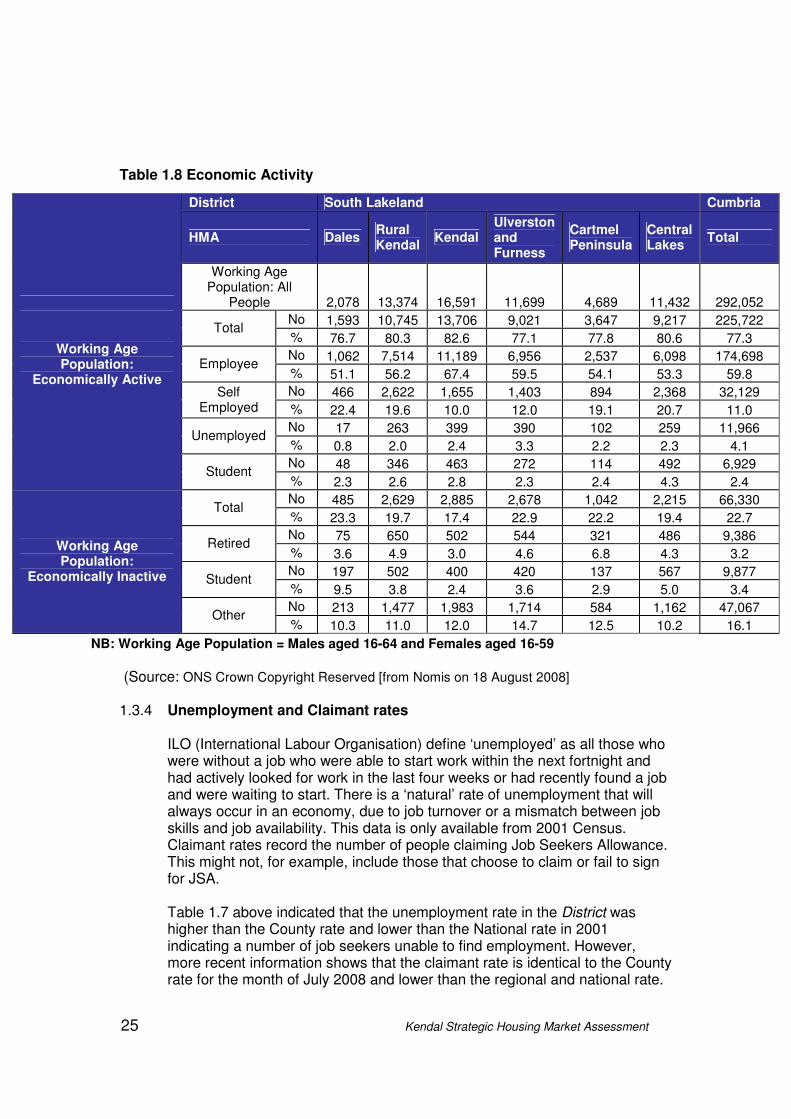
which would be expected being the main administrative centre in the District. Conversely the area contained one of the highest percentage of economically inactive residents. Kendal contains the lowest percentage of retired people (of working age) in the District. Economically inactive includes those looking after a house, those in retirement but also includes those without work who are not actively seeking or available for employment. The HMA contains the lowest number of self-employed people and this was still slightly lower than the County levels but higher than Regional levels. Unemployment was fairly low across the District although the HMA is second highest in the District though lower than the County and Regional percentages.
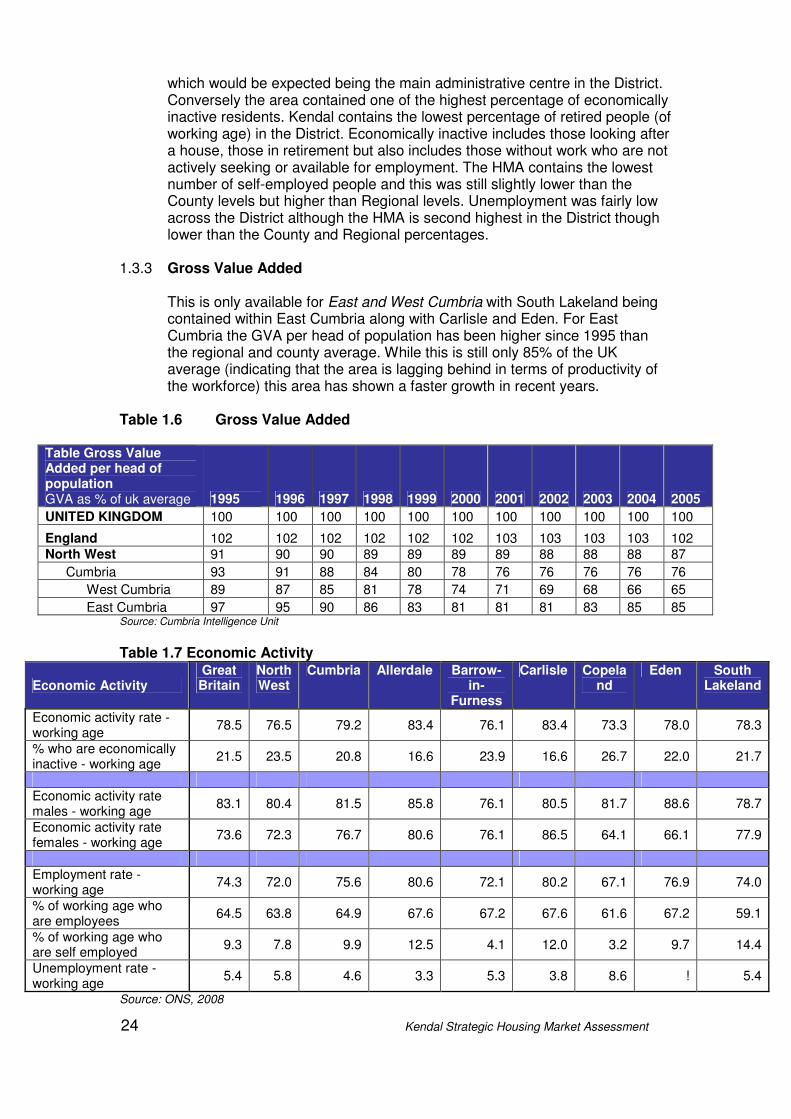
1.3.3 Gross Value Added
This is only available for East and West Cumbria with South Lakeland being contained within East Cumbria along with Carlisle and Eden. For East Cumbria the GVA per head of population has been higher since 1995 than the regional and county average. While this is still only 85% of the UK average (indicating that the area is lagging behind in terms of productivity of the workforce) this area has shown a faster growth in recent years.
Table 1.6 Gross Value Added
Table Gross Value Added per head of population GVA as % of uk average 1995 1996 1997 1998 1999 2000 2001 2002 2003 2004 2005
UNITED KINGDOM 100 100 100 100 100 100 100 100 100 100 100
England 102 102 102 102 102 102 103 103 103 103 102 North West 91 90 90 89 89 89 89 88 88 88 87
Cumbria 93 91 88 84 80 78 76 76 76 76 76
West Cumbria 89 87 85 81 78 74 71 69 68 66 65
East Cumbria 97 95 90 86 83 81 81 81 83 85 85 Source: Cumbria Intelligence Unit
Table 1.7 Economic Activity
Economic Activity Great Britain
North West
Cumbria Allerdale Barrow-in-
Furness
Carlisle Copeland
Eden South Lakeland
Economic activity rate - working age
78.5 76.5 79.2 83.4 76.1 83.4 73.3 78.0 78.3
% who are economically inactive - working age
21.5 23.5 20.8 16.6 23.9 16.6 26.7 22.0 21.7
Economic activity rate males - working age
83.1 80.4 81.5 85.8 76.1 80.5 81.7 88.6 78.7
Economic activity rate females - working age
73.6 72.3 76.7 80.6 76.1 86.5 64.1 66.1 77.9
Employment rate - working age
74.3 72.0 75.6 80.6 72.1 80.2 67.1 76.9 74.0
% of working age who are employees
64.5 63.8 64.9 67.6 67.2 67.6 61.6 67.2 59.1
% of working age who are self employed
9.3 7.8 9.9 12.5 4.1 12.0 3.2 9.7 14.4
Unemployment rate - working age
5.4 5.8 4.6 3.3 5.3 3.8 8.6 ! 5.4
Source: ONS, 2008
25 Kendal Strategic Housing Market Assessment
Table 1.8 Economic Activity
(Source: ONS Crown Copyright Reserved [from Nomis on 18 August 2008]
1.3.4 Unemployment and Claimant rates
ILO (International Labour Organisation) define ‘unemployed’ as all those who were without a job who were able to start work within the next fortnight and had actively looked for work in the last four weeks or had recently found a job and were waiting to start. There is a ‘natural’ rate of unemployment that will always occur in an economy, due to job turnover or a mismatch between job skills and job availability. This data is only available from 2001 Census. Claimant rates record the number of people claiming Job Seekers Allowance. This might not, for example, include those that choose to claim or fail to sign for JSA.
Table 1.7 above indicated that the unemployment rate in the District was higher than the County rate and lower than the National rate in 2001 indicating a number of job seekers unable to find employment. However, more recent information shows that the claimant rate is identical to the County rate for the month of July 2008 and lower than the regional and national rate.
District South Lakeland Cumbria
HMA Dales Rural Kendal
Kendal Ulverston and Furness
Cartmel Peninsula
Central Lakes
Total
Working Age Population: All
People 2,078 13,374 16,591 11,699 4,689 11,432 292,052
No 1,593 10,745 13,706 9,021 3,647 9,217 225,722 Total
% 76.7 80.3 82.6 77.1 77.8 80.6 77.3
No 1,062 7,514 11,189 6,956 2,537 6,098 174,698 Employee
% 51.1 56.2 67.4 59.5 54.1 53.3 59.8
No 466 2,622 1,655 1,403 894 2,368 32,129 Self Employed % 22.4 19.6 10.0 12.0 19.1 20.7 11.0
No 17 263 399 390 102 259 11,966 Unemployed
% 0.8 2.0 2.4 3.3 2.2 2.3 4.1
No 48 346 463 272 114 492 6,929
Working Age Population:
Economically Active
Student % 2.3 2.6 2.8 2.3 2.4 4.3 2.4
No 485 2,629 2,885 2,678 1,042 2,215 66,330 Total
% 23.3 19.7 17.4 22.9 22.2 19.4 22.7
No 75 650 502 544 321 486 9,386 Retired
% 3.6 4.9 3.0 4.6 6.8 4.3 3.2
No 197 502 400 420 137 567 9,877 Student
% 9.5 3.8 2.4 3.6 2.9 5.0 3.4
No 213 1,477 1,983 1,714 584 1,162 47,067
Working Age Population:
Economically Inactive
Other % 10.3 11.0 12.0 14.7 12.5 10.2 16.1
NB: Working Age Population = Males aged 16-64 and Females aged 16-59
26 Kendal Strategic Housing Market Assessment
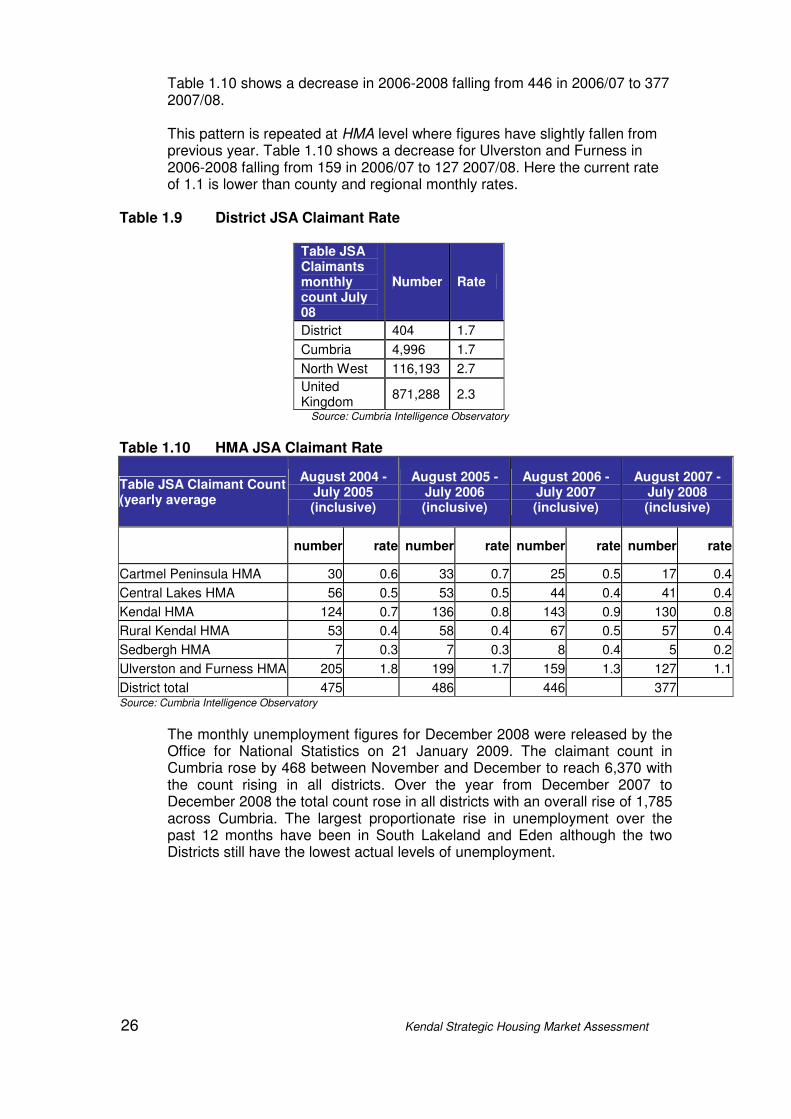
Table 1.10 shows a decrease in 2006-2008 falling from 446 in 2006/07 to 377 2007/08.
This pattern is repeated at HMA level where figures have slightly fallen from previous year. Table 1.10 shows a decrease for Ulverston and Furness in 2006-2008 falling from 159 in 2006/07 to 127 2007/08. Here the current rate of 1.1 is lower than county and regional monthly rates.
Table 1.9 District JSA Claimant Rate
Source: Cumbria Intelligence Observatory
Table 1.10 HMA JSA Claimant Rate
Table JSA Claimant Count (yearly average
August 2004 - July 2005 (inclusive)
August 2005 - July 2006 (inclusive)
August 2006 - July 2007 (inclusive)
August 2007 - July 2008 (inclusive)
number rate number rate number rate number rate
Cartmel Peninsula HMA 30 0.6 33 0.7 25 0.5 17 0.4
Central Lakes HMA 56 0.5 53 0.5 44 0.4 41 0.4
Kendal HMA 124 0.7 136 0.8 143 0.9 130 0.8
Rural Kendal HMA 53 0.4 58 0.4 67 0.5 57 0.4
Sedbergh HMA 7 0.3 7 0.3 8 0.4 5 0.2
Ulverston and Furness HMA 205 1.8 199 1.7 159 1.3 127 1.1
District total 475 486 446 377 Source: Cumbria Intelligence Observatory
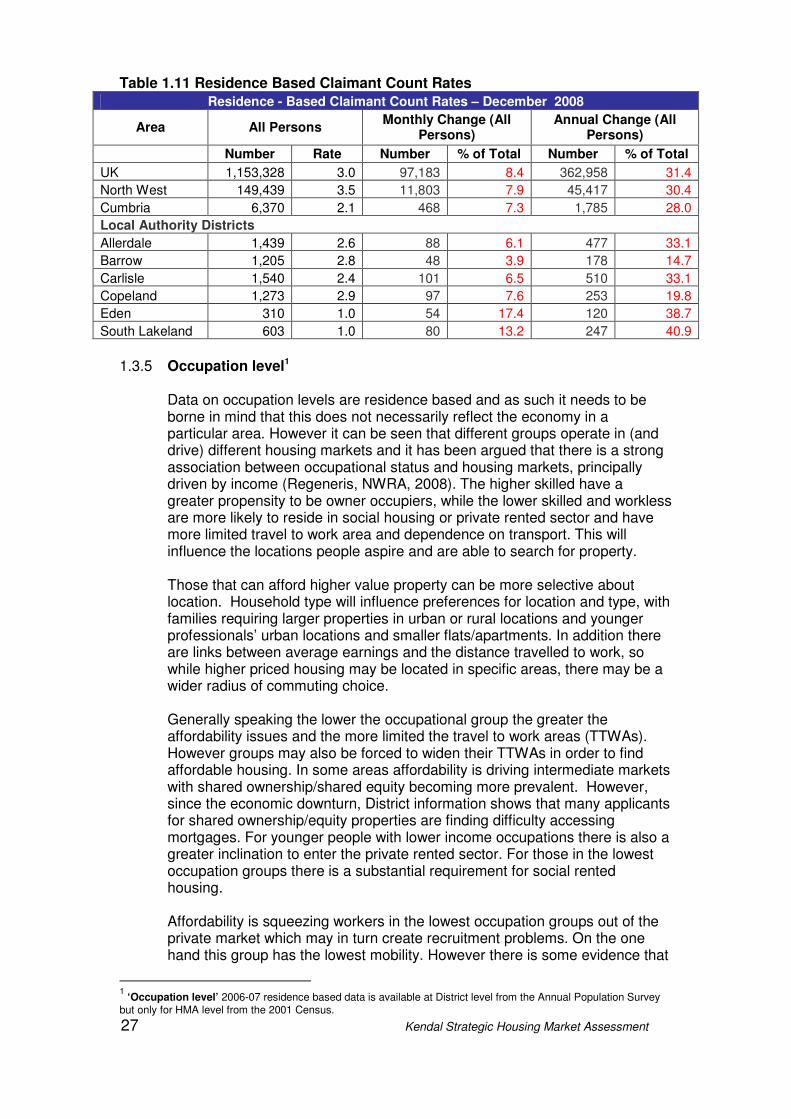
The monthly unemployment figures for December 2008 were released by the Office for National Statistics on 21 January 2009. The claimant count in Cumbria rose by 468 between November and December to reach 6,370 with the count rising in all districts. Over the year from December 2007 to December 2008 the total count rose in all districts with an overall rise of 1,785 across Cumbria. The largest proportionate rise in unemployment over the past 12 months have been in South Lakeland and Eden although the two Districts still have the lowest actual levels of unemployment.
Table JSA Claimants monthly count July 08
Number Rate
District 404 1.7
Cumbria 4,996 1.7
North West 116,193 2.7
United Kingdom
871,288 2.3
27 Kendal Strategic Housing Market Assessment
Table 1.11 Residence Based Claimant Count Rates
1.3.5 Occupation level1
Data on occupation levels are residence based and as such it needs to be borne in mind that this does not necessarily reflect the economy in a particular area. However it can be seen that different groups operate in (and drive) different housing markets and it has been argued that there is a strong association between occupational status and housing markets, principally driven by income (Regeneris, NWRA, 2008). The higher skilled have a greater propensity to be owner occupiers, while the lower skilled and workless are more likely to reside in social housing or private rented sector and have more limited travel to work area and dependence on transport. This will influence the locations people aspire and are able to search for property.
Those that can afford higher value property can be more selective about location. Household type will influence preferences for location and type, with families requiring larger properties in urban or rural locations and younger professionals’ urban locations and smaller flats/apartments. In addition there are links between average earnings and the distance travelled to work, so while higher priced housing may be located in specific areas, there may be a wider radius of commuting choice.
Generally speaking the lower the occupational group the greater the affordability issues and the more limited the travel to work areas (TTWAs). However groups may also be forced to widen their TTWAs in order to find affordable housing. In some areas affordability is driving intermediate markets with shared ownership/shared equity becoming more prevalent. However, since the economic downturn, District information shows that many applicants for shared ownership/equity properties are finding difficulty accessing mortgages. For younger people with lower income occupations there is also a greater inclination to enter the private rented sector. For those in the lowest occupation groups there is a substantial requirement for social rented housing.
Affordability is squeezing workers in the lowest occupation groups out of the private market which may in turn create recruitment problems. On the one hand this group has the lowest mobility. However there is some evidence that
1 ‘Occupation level’ 2006-07 residence based data is available at District level from the Annual Population Survey
but only for HMA level from the 2001 Census.
Residence - Based Claimant Count Rates – December 2008
Area All Persons Monthly Change (All
Persons) Annual Change (All
Persons)
Number Rate Number % of Total Number % of Total
UK 1,153,328 3.0 97,183 8.4 362,958 31.4
North West 149,439 3.5 11,803 7.9 45,417 30.4
Cumbria 6,370 2.1 468 7.3 1,785 28.0
Local Authority Districts
Allerdale 1,439 2.6 88 6.1 477 33.1
Barrow 1,205 2.8 48 3.9 178 14.7
Carlisle 1,540 2.4 101 6.5 510 33.1
Copeland 1,273 2.9 97 7.6 253 19.8
Eden 310 1.0 54 17.4 120 38.7
South Lakeland 603 1.0 80 13.2 247 40.9
28 Kendal Strategic Housing Market Assessment
TTWAs have extended due to a lack of affordable housing near their place of work. Some employers, for example, may need to provide transport for lower skilled employees. For these groups shared ownership/shared equity may not be an option.
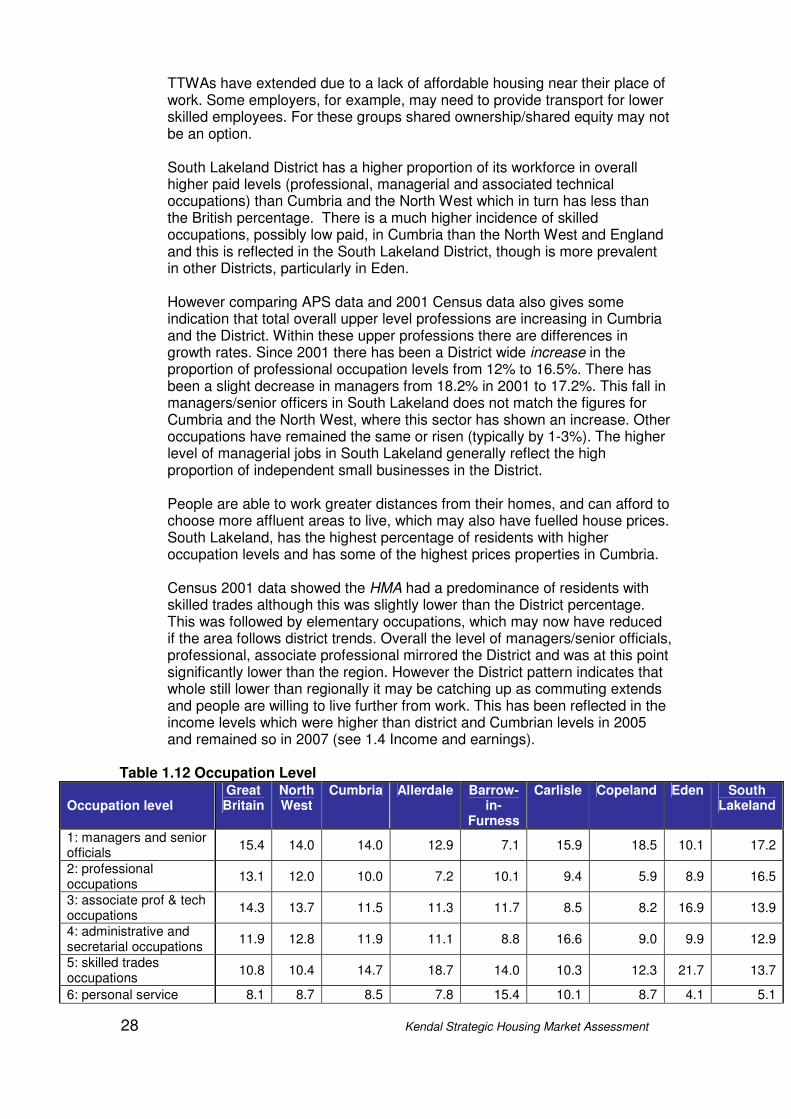
South Lakeland District has a higher proportion of its workforce in overall higher paid levels (professional, managerial and associated technical occupations) than Cumbria and the North West which in turn has less than the British percentage. There is a much higher incidence of skilled occupations, possibly low paid, in Cumbria than the North West and England and this is reflected in the South Lakeland District, though is more prevalent in other Districts, particularly in Eden.
However comparing APS data and 2001 Census data also gives some indication that total overall upper level professions are increasing in Cumbria and the District. Within these upper professions there are differences in growth rates. Since 2001 there has been a District wide increase in the proportion of professional occupation levels from 12% to 16.5%. There has been a slight decrease in managers from 18.2% in 2001 to 17.2%. This fall in managers/senior officers in South Lakeland does not match the figures for Cumbria and the North West, where this sector has shown an increase. Other occupations have remained the same or risen (typically by 1-3%). The higher level of managerial jobs in South Lakeland generally reflect the high proportion of independent small businesses in the District.
People are able to work greater distances from their homes, and can afford to choose more affluent areas to live, which may also have fuelled house prices. South Lakeland, has the highest percentage of residents with higher occupation levels and has some of the highest prices properties in Cumbria.
Census 2001 data showed the HMA had a predominance of residents with skilled trades although this was slightly lower than the District percentage. This was followed by elementary occupations, which may now have reduced if the area follows district trends. Overall the level of managers/senior officials, professional, associate professional mirrored the District and was at this point significantly lower than the region. However the District pattern indicates that whole still lower than regionally it may be catching up as commuting extends and people are willing to live further from work. This has been reflected in the income levels which were higher than district and Cumbrian levels in 2005 and remained so in 2007 (see 1.4 Income and earnings).
Table 1.12 Occupation Level
Occupation level Great Britain
North West
Cumbria Allerdale Barrow-in-
Furness
Carlisle Copeland Eden South Lakeland
1: managers and senior officials
15.4 14.0 14.0 12.9 7.1 15.9 18.5 10.1 17.2
2: professional occupations
13.1 12.0 10.0 7.2 10.1 9.4 5.9 8.9 16.5
3: associate prof & tech occupations
14.3 13.7 11.5 11.3 11.7 8.5 8.2 16.9 13.9
4: administrative and secretarial occupations
11.9 12.8 11.9 11.1 8.8 16.6 9.0 9.9 12.9
5: skilled trades occupations
10.8 10.4 14.7 18.7 14.0 10.3 12.3 21.7 13.7
6: personal service 8.1 8.7 8.5 7.8 15.4 10.1 8.7 4.1 5.1

29 Kendal Strategic Housing Market Assessment
occupations
7: sales and customer service occupations
7.6 8.2 7.0 6.0 7.0 8.0 9.1 8.1 4.8
8: process, plant and machine operatives
7.1 8.2 10.1 11.7 9.3 8.9 15.6 13.4 4.9
9: elementary occupations
11.4 11.7 11.8 13.3 15.7 12.3 10.6 6.9 10.4
Source: ONS, 2008
NB percentages are of full time equivalents. Figures do not include self employment. Figures show that 14.4% of the working population in South Lakeland is self-employed, being the highest level of self employment across Cumbria. (ONS Crown Copyright reserved from Nomis 11.6.08)
1.3.6 Migrant Workers
Information on migrant workers is contained within Section 6 of this document. It is clear from economic data that migrant workers play a significant contribution to the businesses in the District, and in particular the distribution, hotel and restaurant industry. An outreach service has been established in Windermere of the Cumbria Multi-Cultural Centre in response to the demand from migrant workers. South Lakeland’s economic prosperity is classified by a recent Oxford Economic Report for the Local Government Association has being the most vulnerable in Cumbria. Part of the reason for this is that should the large migrant workforce return home, it is doubtful whether local labour would be able to fill the gaps. The Cumbria Business Survey (Cumbria Economic Intelligence Partnership: 2007) estimate that 6% of businesses employ migrant staff to supplement their workforce, from 3% in agriculture and in finance, business and professional services to 16% in hotels and restaurants. The mean number of migrants employed is just over 5 per business. The number of jobs in South Lakeland (57,200) compared to the number of resident workforce (46,800) shows a significant deficit of 10,400. Some of this number will be attributed to migrant workers and it could be that in some cases people are taking on more than one job, i.e. double-jobbing. Contract workers may be unreliably counted and working students may not be counted accurately. There is no definitive source of information on the number of migrant workers but one estimate suggests that 60% of migrant workers are employed in South Lakeland, approximately 3,220. (An Economic Assessment of Cumbria, Cumbria Economic Intelligence Partnership: 2007).
1.4 Incomes and earnings Table 1.13 Median Income Median Income 2006-08
2006 2007 2008
Housing Market Area 24,647 25,649 25,776
District 26,118 26,801 27,569
Cumbria 23,646 25,758 25,923
National 26,000 26,000 28,676
(Source: CACI Street Value/ CACI Paycheck supplied by Cumbria County Council; ASHE, ONS)
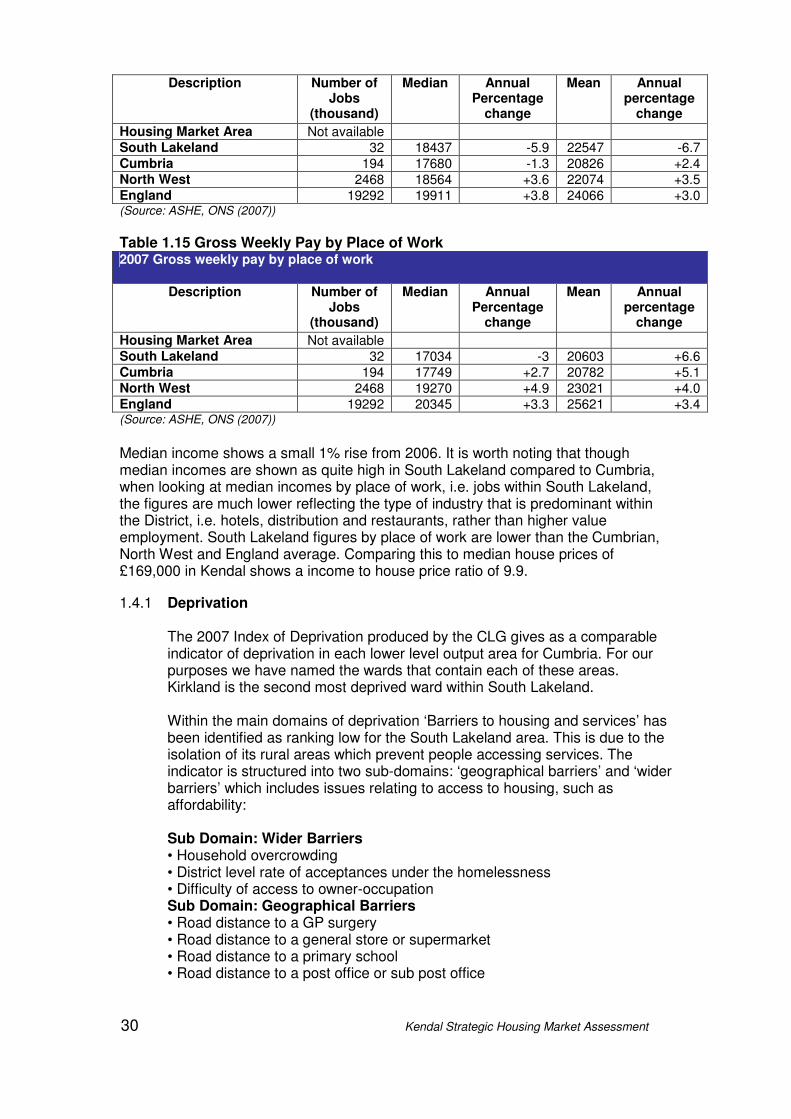
Table 1.14 Gross Weekly Pay by Place of Residence 2007 Gross weekly pay by place of residence
30 Kendal Strategic Housing Market Assessment
Description Number of Jobs
(thousand)
Median Annual Percentage
change
Mean Annual percentage
change
Housing Market Area Not available South Lakeland 32 18437 -5.9 22547 -6.7 Cumbria 194 17680 -1.3 20826 +2.4 North West 2468 18564 +3.6 22074 +3.5 England 19292 19911 +3.8 24066 +3.0 (Source: ASHE, ONS (2007))
Table 1.15 Gross Weekly Pay by Place of Work 2007 Gross weekly pay by place of work
Description Number of Jobs
(thousand)
Median Annual Percentage
change
Mean Annual percentage
change
Housing Market Area Not available South Lakeland 32 17034 -3 20603 +6.6 Cumbria 194 17749 +2.7 20782 +5.1 North West 2468 19270 +4.9 23021 +4.0 England 19292 20345 +3.3 25621 +3.4 (Source: ASHE, ONS (2007))
Median income shows a small 1% rise from 2006. It is worth noting that though median incomes are shown as quite high in South Lakeland compared to Cumbria, when looking at median incomes by place of work, i.e. jobs within South Lakeland, the figures are much lower reflecting the type of industry that is predominant within the District, i.e. hotels, distribution and restaurants, rather than higher value employment. South Lakeland figures by place of work are lower than the Cumbrian, North West and England average. Comparing this to median house prices of £169,000 in Kendal shows a income to house price ratio of 9.9.
1.4.1 Deprivation
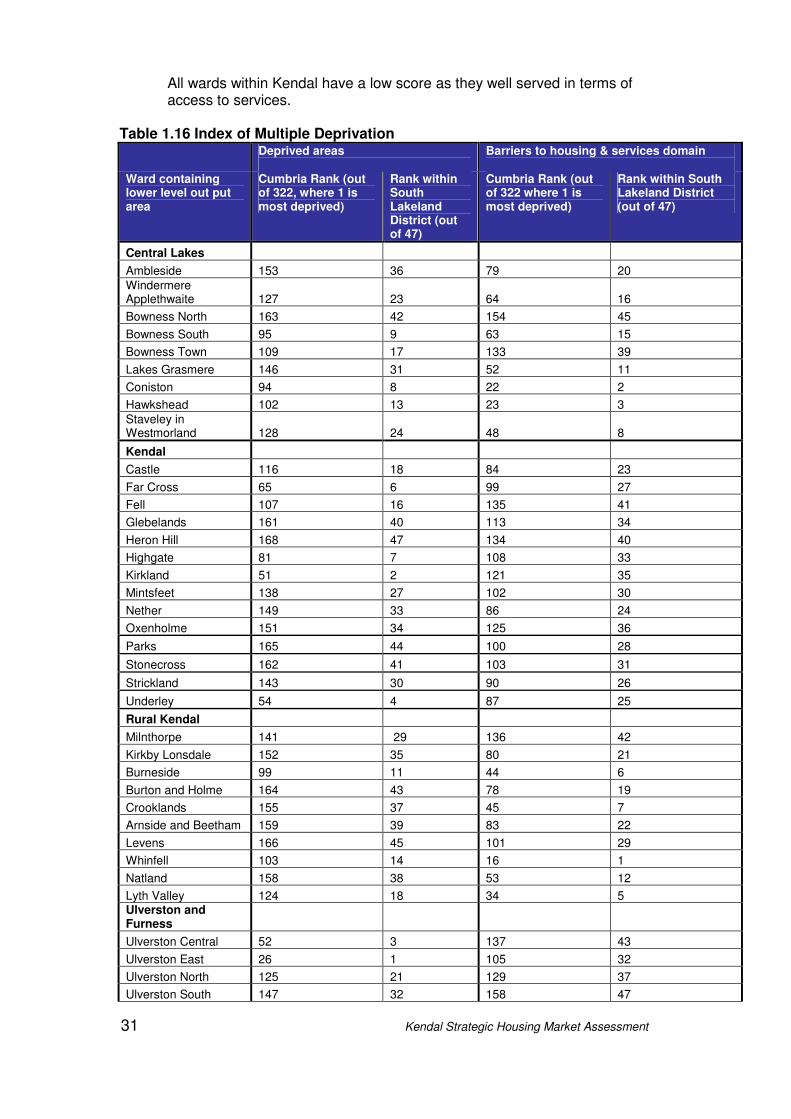
The 2007 Index of Deprivation produced by the CLG gives as a comparable indicator of deprivation in each lower level output area for Cumbria. For our purposes we have named the wards that contain each of these areas. Kirkland is the second most deprived ward within South Lakeland.
Within the main domains of deprivation ‘Barriers to housing and services’ has been identified as ranking low for the South Lakeland area. This is due to the isolation of its rural areas which prevent people accessing services. The indicator is structured into two sub-domains: ‘geographical barriers’ and ‘wider barriers’ which includes issues relating to access to housing, such as affordability:
Sub Domain: Wider Barriers • Household overcrowding • District level rate of acceptances under the homelessness • Difficulty of access to owner-occupation Sub Domain: Geographical Barriers • Road distance to a GP surgery • Road distance to a general store or supermarket • Road distance to a primary school • Road distance to a post office or sub post office
31 Kendal Strategic Housing Market Assessment
All wards within Kendal have a low score as they well served in terms of access to services.
Table 1.16 Index of Multiple Deprivation Deprived areas
Barriers to housing & services domain
Ward containing lower level out put area
Cumbria Rank (out of 322, where 1 is most deprived)
Rank within South Lakeland District (out of 47)
Cumbria Rank (out of 322 where 1 is most deprived)
Rank within South Lakeland District (out of 47)
Central Lakes
Ambleside 153 36 79 20
Windermere Applethwaite 127 23 64 16
Bowness North 163 42 154 45
Bowness South 95 9 63 15
Bowness Town 109 17 133 39
Lakes Grasmere 146 31 52 11
Coniston 94 8 22 2
Hawkshead 102 13 23 3
Staveley in Westmorland 128 24 48 8
Kendal
Castle 116 18 84 23
Far Cross 65 6 99 27
Fell 107 16 135 41
Glebelands 161 40 113 34
Heron Hill 168 47 134 40
Highgate 81 7 108 33
Kirkland 51 2 121 35
Mintsfeet 138 27 102 30
Nether 149 33 86 24
Oxenholme 151 34 125 36
Parks 165 44 100 28
Stonecross 162 41 103 31
Strickland 143 30 90 26
Underley 54 4 87 25
Rural Kendal
Milnthorpe 141 29 136 42
Kirkby Lonsdale 152 35 80 21
Burneside 99 11 44 6
Burton and Holme 164 43 78 19
Crooklands 155 37 45 7
Arnside and Beetham 159 39 83 22
Levens 166 45 101 29
Whinfell 103 14 16 1
Natland 158 38 53 12
Lyth Valley 124 18 34 5 Ulverston and Furness
Ulverston Central 52 3 137 43
Ulverston East 26 1 105 32
Ulverston North 125 21 129 37
Ulverston South 147 32 158 47
32 Kendal Strategic Housing Market Assessment
Ulverston Town 62 5 150 44
Ulverston West 167 46 129 38
Low Furness and Swarthmoor 104 15 156 46
Broughton 135 26 51 10
Crake Valley 126 22 50 9
Dales
Sedbergh 118 19 59 14
Cartmel Peninsula
Grange over Sands 132 25 77 18
Holker 101 12 75 17
Staveley in Cartmel 98 10 24 4
Cartmel 139 28 58 13
Source: Cumbria County Council 2007
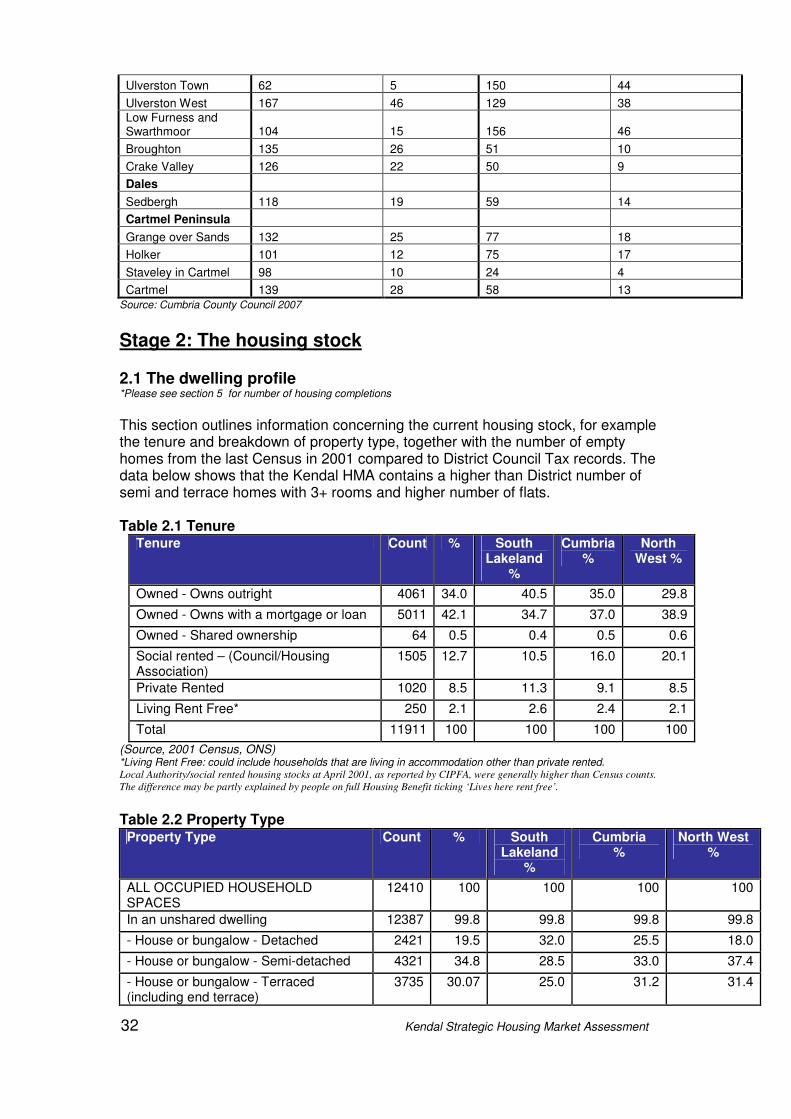
Stage 2: The housing stock 2.1 The dwelling profile *Please see section 5 for number of housing completions
This section outlines information concerning the current housing stock, for example the tenure and breakdown of property type, together with the number of empty homes from the last Census in 2001 compared to District Council Tax records. The data below shows that the Kendal HMA contains a higher than District number of semi and terrace homes with 3+ rooms and higher number of flats. Table 2.1 Tenure
Tenure Count % South Lakeland
%
Cumbria %
North West %
Owned - Owns outright 4061 34.0 40.5 35.0 29.8
Owned - Owns with a mortgage or loan 5011 42.1 34.7 37.0 38.9
Owned - Shared ownership 64 0.5 0.4 0.5 0.6
Social rented – (Council/Housing Association)
1505 12.7 10.5 16.0 20.1
Private Rented 1020 8.5 11.3 9.1 8.5
Living Rent Free* 250 2.1 2.6 2.4 2.1
Total 11911 100 100 100 100
(Source, 2001 Census, ONS) *Living Rent Free: could include households that are living in accommodation other than private rented. Local Authority/social rented housing stocks at April 2001, as reported by CIPFA, were generally higher than Census counts.
The difference may be partly explained by people on full Housing Benefit ticking ‘Lives here rent free’.
Table 2.2 Property Type Property Type Count % South
Lakeland %
Cumbria %
North West %
ALL OCCUPIED HOUSEHOLD SPACES
12410 100 100 100 100
In an unshared dwelling 12387 99.8 99.8 99.8 99.8
- House or bungalow - Detached 2421 19.5 32.0 25.5 18.0
- House or bungalow - Semi-detached 4321 34.8 28.5 33.0 37.4
- House or bungalow - Terraced (including end terrace)
3735 30.07 25.0 31.2 31.4
33 Kendal Strategic Housing Market Assessment
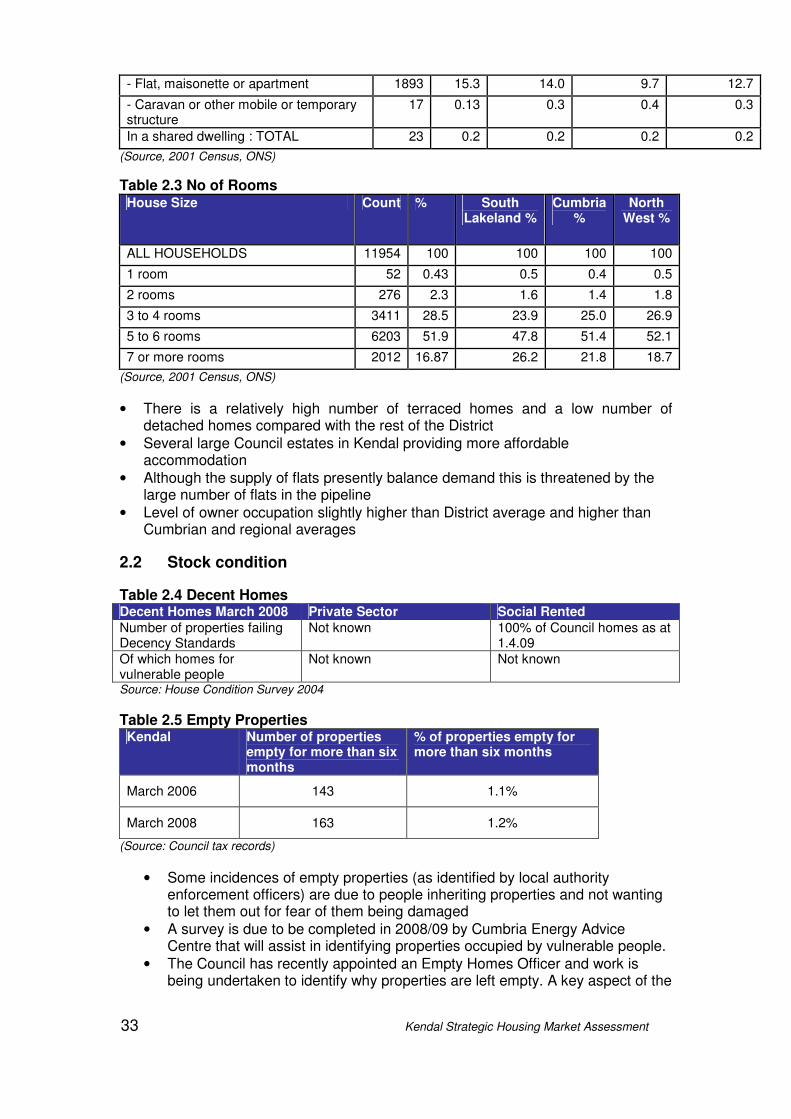
- Flat, maisonette or apartment 1893 15.3 14.0 9.7 12.7
- Caravan or other mobile or temporary structure
17 0.13 0.3 0.4 0.3
In a shared dwelling : TOTAL 23 0.2 0.2 0.2 0.2
(Source, 2001 Census, ONS)
Table 2.3 No of Rooms House Size Count % South
Lakeland % Cumbria
% North
West %
ALL HOUSEHOLDS 11954 100 100 100 100
1 room 52 0.43 0.5 0.4 0.5
2 rooms 276 2.3 1.6 1.4 1.8
3 to 4 rooms 3411 28.5 23.9 25.0 26.9
5 to 6 rooms 6203 51.9 47.8 51.4 52.1
7 or more rooms 2012 16.87 26.2 21.8 18.7
(Source, 2001 Census, ONS)
• There is a relatively high number of terraced homes and a low number of detached homes compared with the rest of the District
• Several large Council estates in Kendal providing more affordable accommodation
• Although the supply of flats presently balance demand this is threatened by the large number of flats in the pipeline
• Level of owner occupation slightly higher than District average and higher than Cumbrian and regional averages
2.2 Stock condition
Table 2.4 Decent Homes Decent Homes March 2008 Private Sector Social Rented
Number of properties failing Decency Standards
Not known 100% of Council homes as at 1.4.09
Of which homes for vulnerable people
Not known Not known
Source: House Condition Survey 2004
Table 2.5 Empty Properties Kendal Number of properties
empty for more than six months
% of properties empty for more than six months
March 2006 143 1.1%
March 2008 163 1.2%
(Source: Council tax records)
• Some incidences of empty properties (as identified by local authority enforcement officers) are due to people inheriting properties and not wanting to let them out for fear of them being damaged
• A survey is due to be completed in 2008/09 by Cumbria Energy Advice Centre that will assist in identifying properties occupied by vulnerable people.
• The Council has recently appointed an Empty Homes Officer and work is being undertaken to identify why properties are left empty. A key aspect of the
34 Kendal Strategic Housing Market Assessment
post will be bring empty properties back into use. This is particularly important across South Lakeland where affordable housing is in short supply.
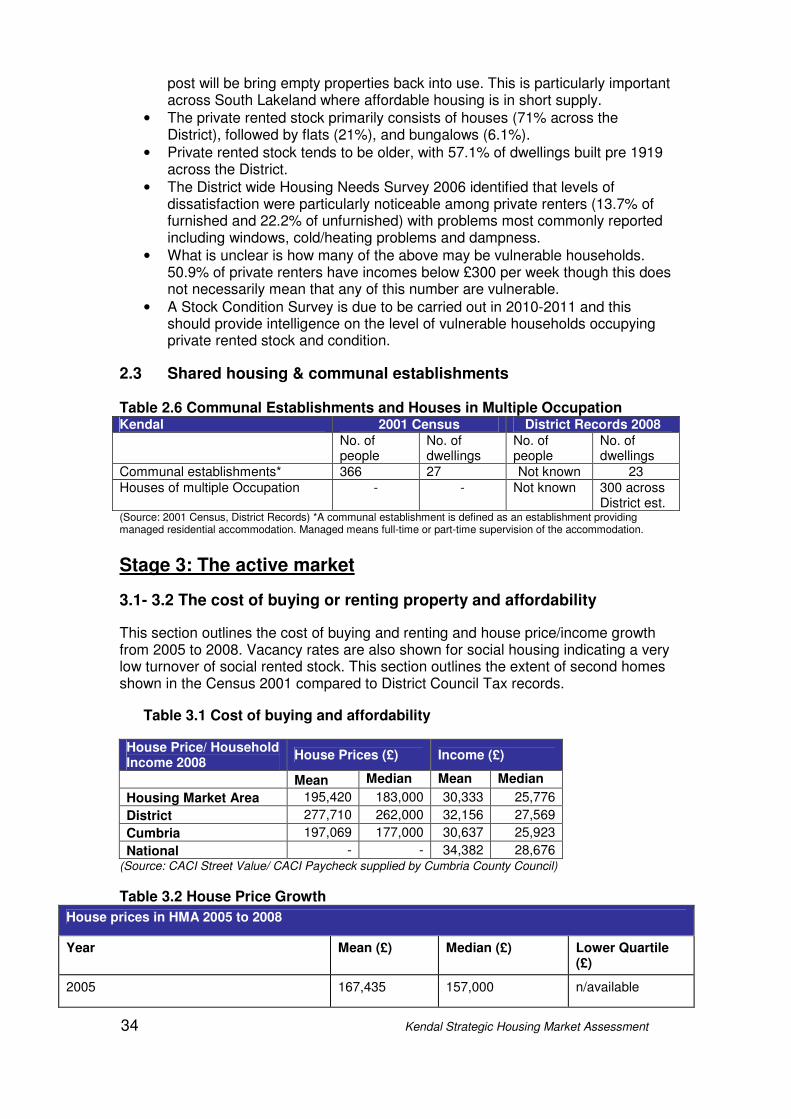
• The private rented stock primarily consists of houses (71% across the District), followed by flats (21%), and bungalows (6.1%).
• Private rented stock tends to be older, with 57.1% of dwellings built pre 1919 across the District.
• The District wide Housing Needs Survey 2006 identified that levels of dissatisfaction were particularly noticeable among private renters (13.7% of furnished and 22.2% of unfurnished) with problems most commonly reported including windows, cold/heating problems and dampness.
• What is unclear is how many of the above may be vulnerable households. 50.9% of private renters have incomes below £300 per week though this does not necessarily mean that any of this number are vulnerable.
• A Stock Condition Survey is due to be carried out in 2010-2011 and this should provide intelligence on the level of vulnerable households occupying private rented stock and condition.
2.3 Shared housing & communal establishments Table 2.6 Communal Establishments and Houses in Multiple Occupation Kendal 2001 Census District Records 2008
No. of people
No. of dwellings
No. of people
No. of dwellings
Communal establishments* 366 27 Not known 23
Houses of multiple Occupation - - Not known 300 across District est.
(Source: 2001 Census, District Records) *A communal establishment is defined as an establishment providing managed residential accommodation. Managed means full-time or part-time supervision of the accommodation.
Stage 3: The active market
3.1- 3.2 The cost of buying or renting property and affordability
This section outlines the cost of buying and renting and house price/income growth from 2005 to 2008. Vacancy rates are also shown for social housing indicating a very low turnover of social rented stock. This section outlines the extent of second homes shown in the Census 2001 compared to District Council Tax records.
Table 3.1 Cost of buying and affordability House Price/ Household Income 2008
House Prices (£) Income (£)
Mean Median Mean Median
Housing Market Area 195,420 183,000 30,333 25,776
District 277,710 262,000 32,156 27,569
Cumbria 197,069 177,000 30,637 25,923
National - - 34,382 28,676 (Source: CACI Street Value/ CACI Paycheck supplied by Cumbria County Council)
Table 3.2 House Price Growth
House prices in HMA 2005 to 2008
Year Mean (£) Median (£) Lower Quartile (£)
2005 167,435 157,000 n/available
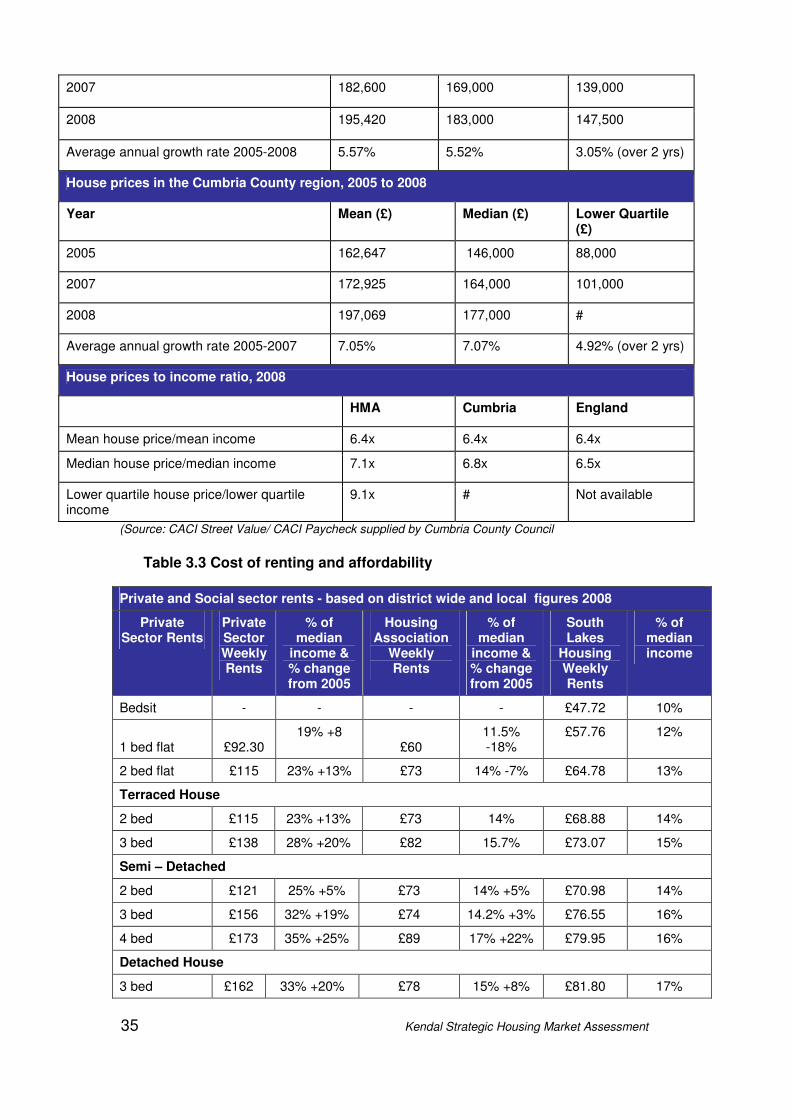
35 Kendal Strategic Housing Market Assessment
2007 182,600 169,000 139,000
2008 195,420 183,000 147,500
Average annual growth rate 2005-2008 5.57% 5.52% 3.05% (over 2 yrs)
House prices in the Cumbria County region, 2005 to 2008
Year Mean (£) Median (£) Lower Quartile (£)
2005 162,647 146,000 88,000
2007 172,925 164,000 101,000
2008 197,069 177,000 #
Average annual growth rate 2005-2007 7.05% 7.07% 4.92% (over 2 yrs)
House prices to income ratio, 2008
HMA Cumbria England
Mean house price/mean income 6.4x 6.4x 6.4x
Median house price/median income 7.1x 6.8x 6.5x
Lower quartile house price/lower quartile income
9.1x # Not available
(Source: CACI Street Value/ CACI Paycheck supplied by Cumbria County Council
Table 3.3 Cost of renting and affordability
Private and Social sector rents - based on district wide and local figures 2008
Private Sector Rents
Private Sector Weekly Rents
% of median
income & % change from 2005
Housing Association
Weekly Rents
% of median
income & % change from 2005
South Lakes
Housing Weekly Rents
% of median income
Bedsit - - - - £47.72 10%
1 bed flat £92.30 19% +8
£60 11.5% -18%
£57.76 12%
2 bed flat £115 23% +13% £73 14% -7% £64.78 13%
Terraced House
2 bed £115 23% +13% £73 14% £68.88 14%
3 bed £138 28% +20% £82 15.7% £73.07 15%
Semi – Detached
2 bed £121 25% +5% £73 14% +5% £70.98 14%
3 bed £156 32% +19% £74 14.2% +3% £76.55 16%
4 bed £173 35% +25% £89 17% +22% £79.95 16%
Detached House
3 bed £162 33% +20% £78 15% +8% £81.80 17%
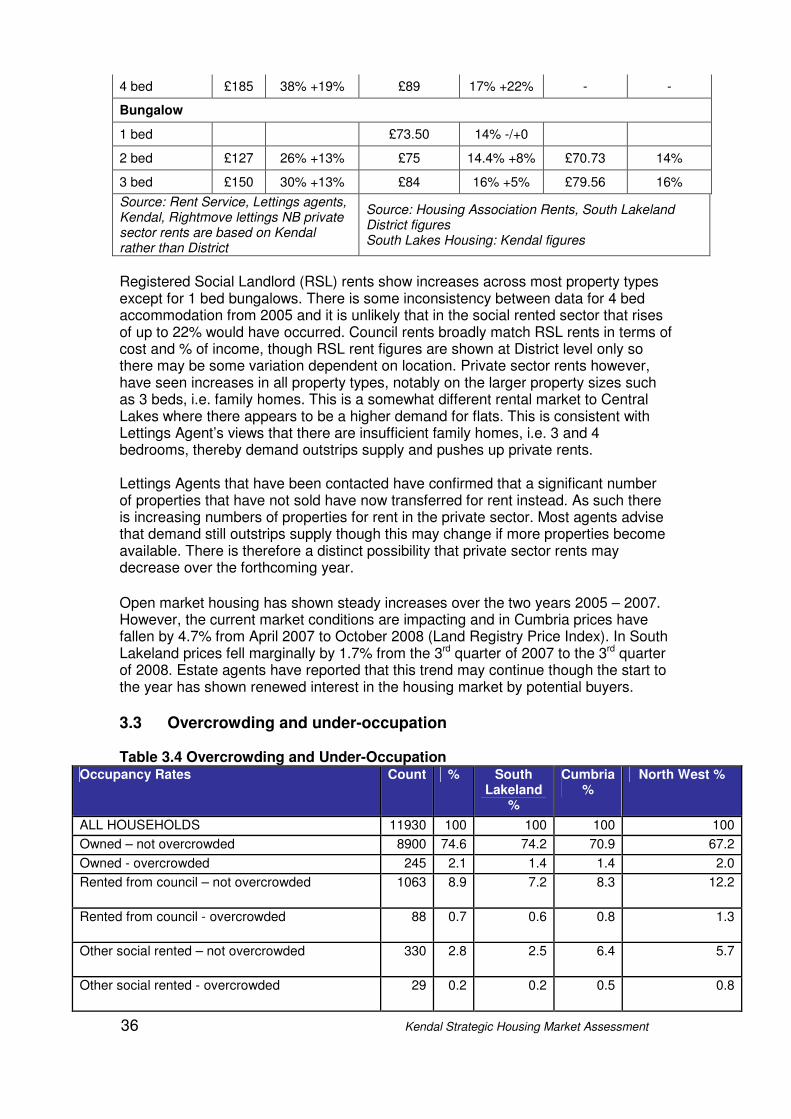
36 Kendal Strategic Housing Market Assessment
4 bed £185 38% +19% £89 17% +22% - -
Bungalow
1 bed £73.50 14% -/+0
2 bed £127 26% +13% £75 14.4% +8% £70.73 14%
3 bed £150 30% +13% £84 16% +5% £79.56 16%
Source: Rent Service, Lettings agents, Kendal, Rightmove lettings NB private sector rents are based on Kendal rather than District
Source: Housing Association Rents, South Lakeland District figures South Lakes Housing: Kendal figures
Registered Social Landlord (RSL) rents show increases across most property types except for 1 bed bungalows. There is some inconsistency between data for 4 bed accommodation from 2005 and it is unlikely that in the social rented sector that rises of up to 22% would have occurred. Council rents broadly match RSL rents in terms of cost and % of income, though RSL rent figures are shown at District level only so there may be some variation dependent on location. Private sector rents however, have seen increases in all property types, notably on the larger property sizes such as 3 beds, i.e. family homes. This is a somewhat different rental market to Central Lakes where there appears to be a higher demand for flats. This is consistent with Lettings Agent’s views that there are insufficient family homes, i.e. 3 and 4 bedrooms, thereby demand outstrips supply and pushes up private rents. Lettings Agents that have been contacted have confirmed that a significant number of properties that have not sold have now transferred for rent instead. As such there is increasing numbers of properties for rent in the private sector. Most agents advise that demand still outstrips supply though this may change if more properties become available. There is therefore a distinct possibility that private sector rents may decrease over the forthcoming year.
Open market housing has shown steady increases over the two years 2005 – 2007. However, the current market conditions are impacting and in Cumbria prices have fallen by 4.7% from April 2007 to October 2008 (Land Registry Price Index). In South Lakeland prices fell marginally by 1.7% from the 3rd quarter of 2007 to the 3rd quarter of 2008. Estate agents have reported that this trend may continue though the start to the year has shown renewed interest in the housing market by potential buyers.
3.3 Overcrowding and under-occupation Table 3.4 Overcrowding and Under-Occupation
Occupancy Rates Count % South Lakeland
%
Cumbria %
North West %
ALL HOUSEHOLDS 11930 100 100 100 100
Owned – not overcrowded 8900 74.6 74.2 70.9 67.2
Owned - overcrowded 245 2.1 1.4 1.4 2.0
Rented from council – not overcrowded 1063 8.9 7.2 8.3 12.2
Rented from council - overcrowded 88 0.7 0.6 0.8 1.3
Other social rented – not overcrowded 330 2.8 2.5 6.4 5.7
Other social rented - overcrowded 29 0.2 0.2 0.5 0.8
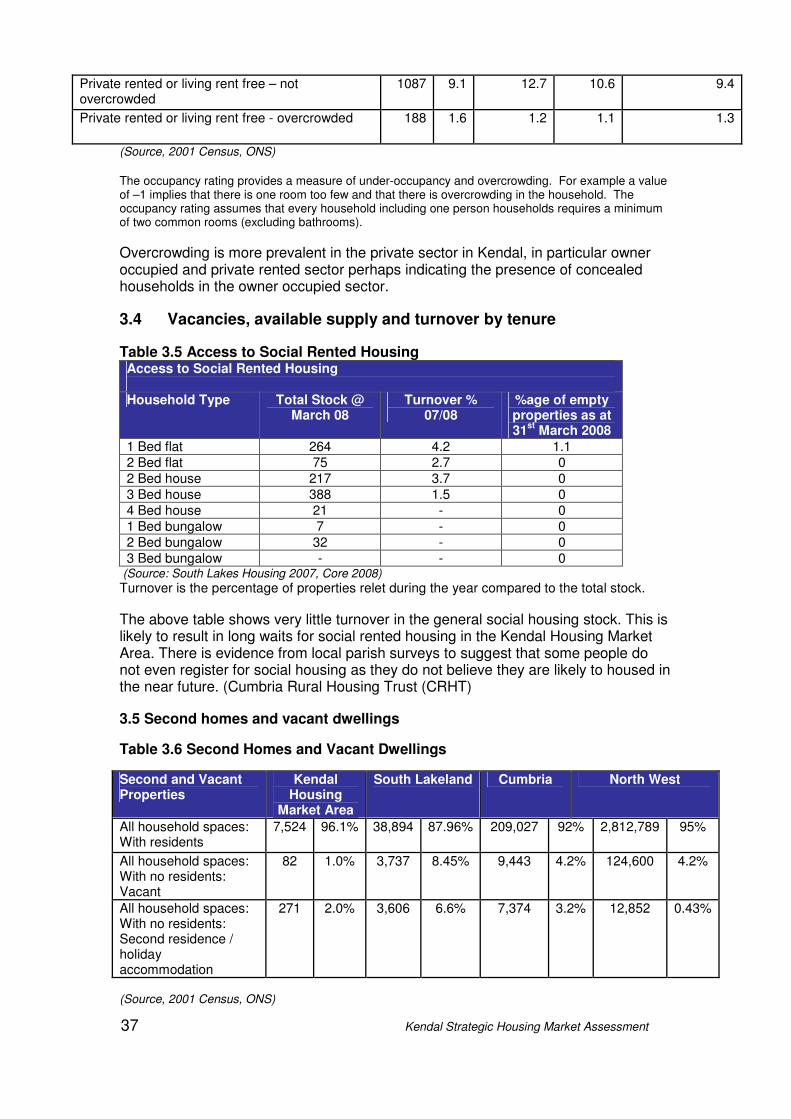
37 Kendal Strategic Housing Market Assessment
Private rented or living rent free – not overcrowded
1087 9.1 12.7 10.6 9.4
Private rented or living rent free - overcrowded 188 1.6 1.2 1.1 1.3
(Source, 2001 Census, ONS)
The occupancy rating provides a measure of under-occupancy and overcrowding. For example a value of –1 implies that there is one room too few and that there is overcrowding in the household. The occupancy rating assumes that every household including one person households requires a minimum of two common rooms (excluding bathrooms).
Overcrowding is more prevalent in the private sector in Kendal, in particular owner occupied and private rented sector perhaps indicating the presence of concealed households in the owner occupied sector.
3.4 Vacancies, available supply and turnover by tenure
Table 3.5 Access to Social Rented Housing Access to Social Rented Housing Household Type Total Stock @
March 08 Turnover %
07/08 %age of empty properties as at 31
st March 2008
1 Bed flat 264 4.2 1.1
2 Bed flat 75 2.7 0
2 Bed house 217 3.7 0
3 Bed house 388 1.5 0
4 Bed house 21 - 0
1 Bed bungalow 7 - 0
2 Bed bungalow 32 - 0
3 Bed bungalow - - 0 (Source: South Lakes Housing 2007, Core 2008)
Turnover is the percentage of properties relet during the year compared to the total stock.
The above table shows very little turnover in the general social housing stock. This is likely to result in long waits for social rented housing in the Kendal Housing Market Area. There is evidence from local parish surveys to suggest that some people do not even register for social housing as they do not believe they are likely to housed in the near future. (Cumbria Rural Housing Trust (CRHT)
3.5 Second homes and vacant dwellings
Table 3.6 Second Homes and Vacant Dwellings
(Source, 2001 Census, ONS)
Second and Vacant Properties
Kendal Housing
Market Area
South Lakeland Cumbria North West
All household spaces: With residents
7,524 96.1% 38,894 87.96% 209,027 92% 2,812,789 95%
All household spaces: With no residents: Vacant
82 1.0% 3,737 8.45% 9,443 4.2% 124,600 4.2%
All household spaces: With no residents: Second residence / holiday accommodation
271 2.0% 3,606 6.6% 7,374 3.2% 12,852 0.43%
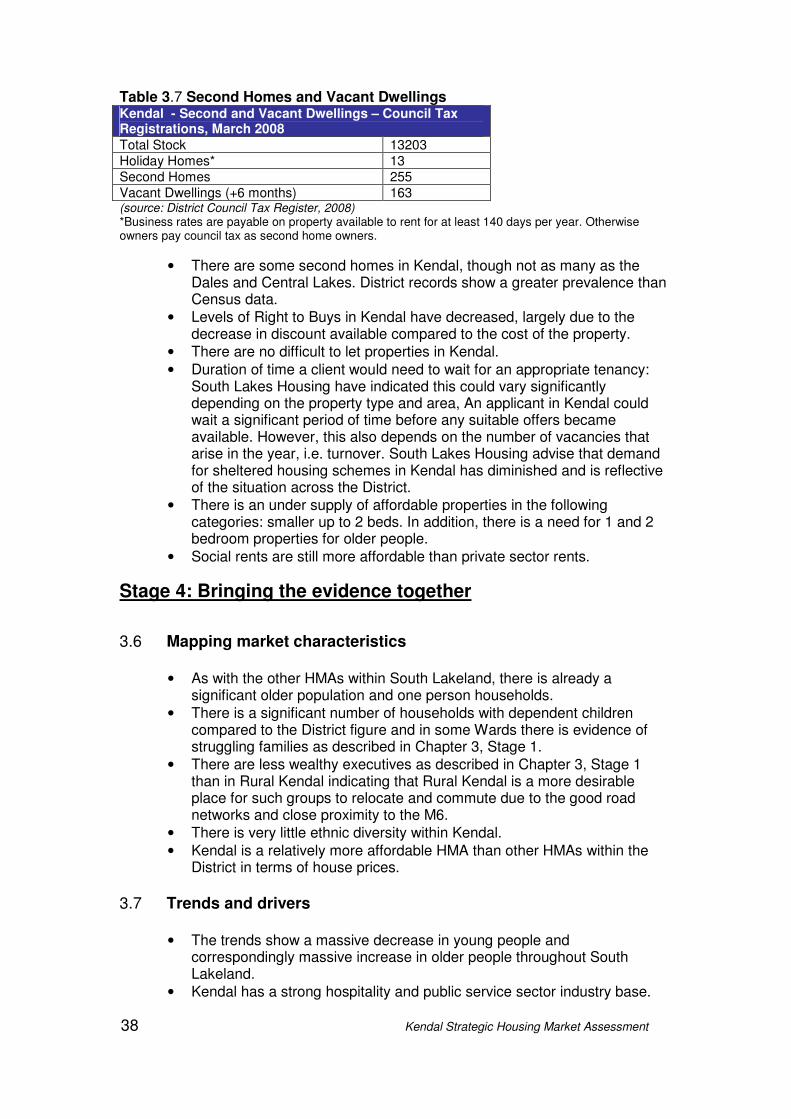
38 Kendal Strategic Housing Market Assessment
Table 3.7 Second Homes and Vacant Dwellings Kendal - Second and Vacant Dwellings – Council Tax Registrations, March 2008
Total Stock 13203
Holiday Homes* 13
Second Homes 255
Vacant Dwellings (+6 months) 163 (source: District Council Tax Register, 2008) *Business rates are payable on property available to rent for at least 140 days per year. Otherwise owners pay council tax as second home owners.
• There are some second homes in Kendal, though not as many as the Dales and Central Lakes. District records show a greater prevalence than Census data.
• Levels of Right to Buys in Kendal have decreased, largely due to the decrease in discount available compared to the cost of the property.
• There are no difficult to let properties in Kendal.
• Duration of time a client would need to wait for an appropriate tenancy: South Lakes Housing have indicated this could vary significantly depending on the property type and area, An applicant in Kendal could wait a significant period of time before any suitable offers became available. However, this also depends on the number of vacancies that arise in the year, i.e. turnover. South Lakes Housing advise that demand for sheltered housing schemes in Kendal has diminished and is reflective of the situation across the District.
• There is an under supply of affordable properties in the following categories: smaller up to 2 beds. In addition, there is a need for 1 and 2 bedroom properties for older people.
• Social rents are still more affordable than private sector rents.
Stage 4: Bringing the evidence together
3.6 Mapping market characteristics
• As with the other HMAs within South Lakeland, there is already a significant older population and one person households.
• There is a significant number of households with dependent children compared to the District figure and in some Wards there is evidence of struggling families as described in Chapter 3, Stage 1.
• There are less wealthy executives as described in Chapter 3, Stage 1 than in Rural Kendal indicating that Rural Kendal is a more desirable place for such groups to relocate and commute due to the good road networks and close proximity to the M6.
• There is very little ethnic diversity within Kendal.
• Kendal is a relatively more affordable HMA than other HMAs within the District in terms of house prices.
3.7 Trends and drivers
• The trends show a massive decrease in young people and correspondingly massive increase in older people throughout South Lakeland.
• Kendal has a strong hospitality and public service sector industry base.
39 Kendal Strategic Housing Market Assessment
• Kendal has a strong commuter market with connectivity with Barrow, Lancashire, Preston, Manchester and other parts of Cumbria.
• There is a large degree of self containment with people moving relocating within the same area.
• Incomes by place of work across the District are one of the lowest in Cumbria.
• Comparing incomes by place of work by house prices in Kendal, this would give a ratio of 9.9.
• Income to house price ratio has worsened since 2005 (median income/house price data).
3.8 Issues of future policy/ strategy
• The main issue is the lack of affordable housing in this HMA.
• There is an under supply of affordable properties in the following categories: smaller up to 2 beds and larger 3 bed+ properties. In addition, there is a need for 1 and 2 bedroom properties for older people.
• There is a need for extra care housing in Kendal which has been partially fulfilled with the development of Jenkins Cragg Court and will be fulfilled with the development of Lound Place.
• There is a need to attract higher value employers into the area, as with other HMAs in the Disrict.
• There are significant opportunities around Kendal Canal for employment and housing.
40 Kendal Strategic Housing Market Assessment
4. The Future Housing Market This chapter estimates the total number of new dwellings that may be required in the future in response to various scenarios reflecting the scale of housing demand. The scenarios have been generated using POPGROUP, a forecasting tool supplied by the University of Manchester. The analysis is only available down to a district level. The analysis has four stages: Stage 1: Projecting changes in population and future numbers of households Stage 2: Future economic performance Stage 3: Future affordability Stage 4: Bringing the evidence together Background to the POPGROUP Model The CLG publication ‘Strategic Housing Market Assessments Practice Guidance Version 2 (August 2007)’ advises on the use of ‘of-the-peg’ population and household models to forecast future numbers of household estimates down to District level. One of the CLG recommended Models includes POPGROUP/HOUSEGROUP/ LABGROUP, which is a family of software products designed to forecast population, households and the labour force for areas and social groups. It is provided by the Centre for Census & Survey Research, University of Manchester, and is based on Excel to build on users' existing spreadsheet skills. Cumbria County Council purchased the licence for the POPGROUP Model in 2008 following the unavailability of the Chelmer Model, which had been previously used for spatial planning purposes. Cumbria Intelligence Observatory has begun to use the POPGROUP suite of population, housing and labour market forecasting tools to generate a range of ‘what-if’ scenario’s for Cumbria’s population. The forecasting software comprises three separate modules: POPGROUP – for population projections and forecasts; HOUSEGROUP – for household projections and forecasts; LABGROUP - for labour force projections and forecasts. What does each module do? The POPGROUP Model provides a means to make estimates of the current population and forecasts of the future population for national, sub-national and local areas, for the whole population of an area and for sub-populations including ethnic groups. It uses standard demographic methods of cohort component projections, household headship rates and economic activity rates. Its flexibility allows integration of official statistics and ancillary data. It allows users to enter past information and their assumptions about the future for births and fertility, deaths and mortality, and migration. Users enter past information and their assumptions about the future for births and fertility, deaths and mortality, and migration into Excel data sheets. Information from population estimates can also be incorporated. POPGROUP uses a standard cohort component forecasting method to produce forecasts and provides results in Excel sheets with data extraction and chart routines available.
41 Kendal Strategic Housing Market Assessment
HOUSEGROUP provides a means to make estimates of the number and type of households. Users enter past information and their assumptions about the future for headship rates and the number of people living in communal establishments into Excel data sheets. HOUSEGROUP uses a standard headship rate model to produce forecasts, and may be used independently of POPGROUP or use from POPGROUP. LABGROUP provides a means to make projections of the future labour force. Users enter past information and their assumptions about future economic activity rates into excel data sheets. LABGROUP uses standard projection methods to produce forecasts. LABGROUP may also be used independently of POPGROUP or use output from POPGROUP. The need for local information The ONS population projections methodology does not take account of many local factors, for example if a new housing estate is to be built or demolished, or if a major new contract has been awarded which will result in the creation of a significant number of jobs. They are simply intended to be a representation of what will happen in the future if various trends in births, deaths and migration continue into the future. But it is this sort of information that can make a real difference to the way a population might look in twenty years time. POPGROUP gives us the capability to make assumptions on these variables. We are able to build into the model assumptions about, for example:
• Local differences in birth/death trends to national/regional figures.
• Implications of planning restrictions/developments.
• Regeneration/growth of local economy and/or the effects of national trends – e.g. economic downturn – at the local level.
It should be noted that caution must be used when using the results of any population forecasting scenario. Like the ONS population projections, the outputs from the POPGROUP model cannot be relied upon as fact. It may be that what actually occurs is considerably different to what is suggested by the model. However, they are the best available estimates available that take into account what is happening - and is likely to happen – locally. There are currently over 70 users, mainly public sector planners and those in economic development. For further information on the POPGROUP Model, please follow the following weblink: http://www.ccsr.ac.uk/popgroup/ 4.1 Stage 1: Projecting changes in future numbers of households
This stage gives projections of population, households and dwellings at a district level. POPGROUP population forecasting software has been used to create all the scenario’s contained in both this section (population led and dwelling led) and also section 4.4 (labour force led). All these scenarios contain estimates of local information to provide likely scenario’s for growth into the future. Like all population forecasting outputs, the results are simply a representation of what might happen in the future if various trends are played out as we expect. As a result, they cannot be relied upon as fact, and actual results may end up being significantly different to what the scenarios suggest will happen. This should be kept in mind at all times when using the
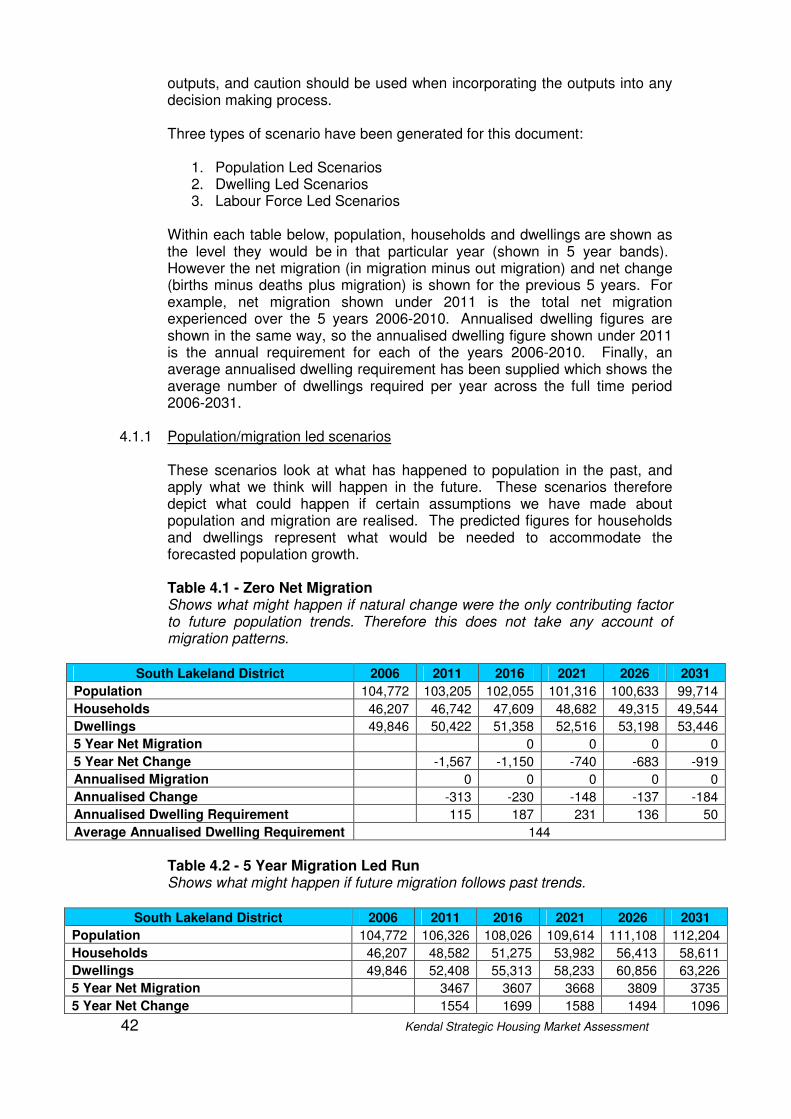
42 Kendal Strategic Housing Market Assessment
outputs, and caution should be used when incorporating the outputs into any decision making process.
Three types of scenario have been generated for this document:
1. Population Led Scenarios 2. Dwelling Led Scenarios 3. Labour Force Led Scenarios
Within each table below, population, households and dwellings are shown as the level they would be in that particular year (shown in 5 year bands). However the net migration (in migration minus out migration) and net change (births minus deaths plus migration) is shown for the previous 5 years. For example, net migration shown under 2011 is the total net migration experienced over the 5 years 2006-2010. Annualised dwelling figures are shown in the same way, so the annualised dwelling figure shown under 2011 is the annual requirement for each of the years 2006-2010. Finally, an average annualised dwelling requirement has been supplied which shows the average number of dwellings required per year across the full time period 2006-2031.
4.1.1 Population/migration led scenarios
These scenarios look at what has happened to population in the past, and apply what we think will happen in the future. These scenarios therefore depict what could happen if certain assumptions we have made about population and migration are realised. The predicted figures for households and dwellings represent what would be needed to accommodate the forecasted population growth.
Table 4.1 - Zero Net Migration Shows what might happen if natural change were the only contributing factor to future population trends. Therefore this does not take any account of migration patterns.
South Lakeland District 2006 2011 2016 2021 2026 2031
Population 104,772 103,205 102,055 101,316 100,633 99,714
Households 46,207 46,742 47,609 48,682 49,315 49,544
Dwellings 49,846 50,422 51,358 52,516 53,198 53,446
5 Year Net Migration 0 0 0 0
5 Year Net Change -1,567 -1,150 -740 -683 -919
Annualised Migration 0 0 0 0 0
Annualised Change -313 -230 -148 -137 -184
Annualised Dwelling Requirement 115 187 231 136 50
Average Annualised Dwelling Requirement 144
Table 4.2 - 5 Year Migration Led Run Shows what might happen if future migration follows past trends.
South Lakeland District 2006 2011 2016 2021 2026 2031
Population 104,772 106,326 108,026 109,614 111,108 112,204
Households 46,207 48,582 51,275 53,982 56,413 58,611
Dwellings 49,846 52,408 55,313 58,233 60,856 63,226
5 Year Net Migration 3467 3607 3668 3809 3735
5 Year Net Change 1554 1699 1588 1494 1096
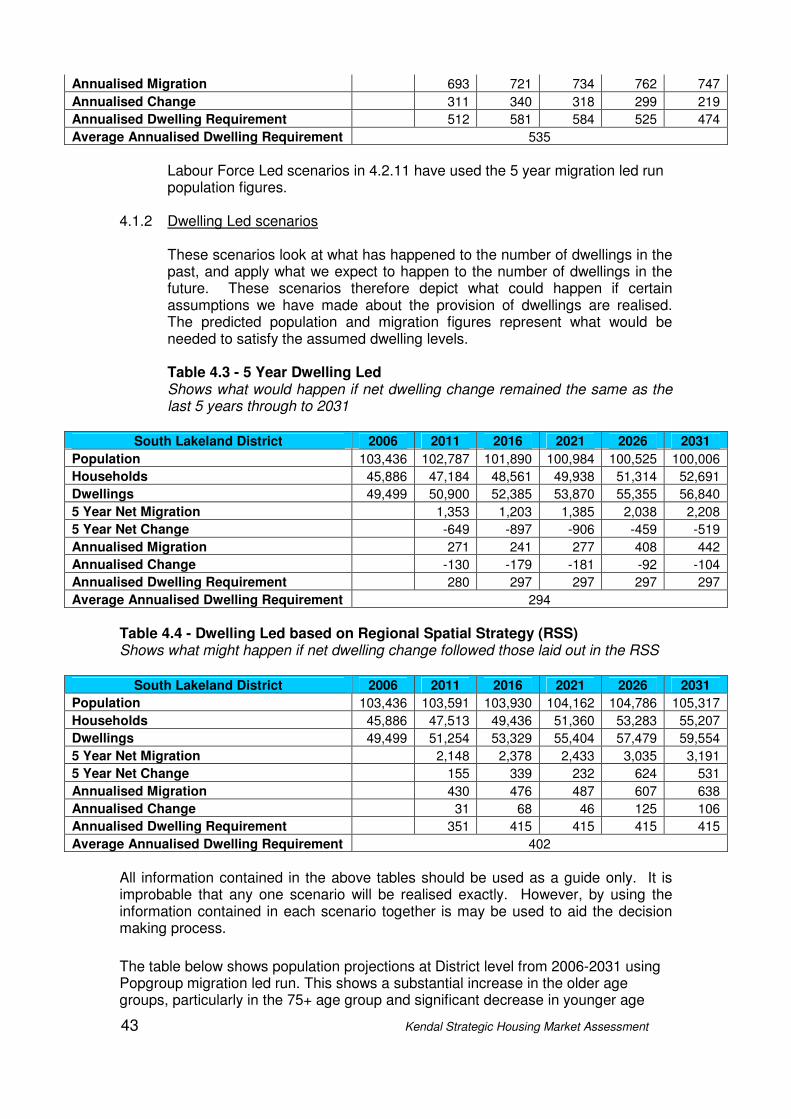
43 Kendal Strategic Housing Market Assessment
Annualised Migration 693 721 734 762 747
Annualised Change 311 340 318 299 219
Annualised Dwelling Requirement 512 581 584 525 474
Average Annualised Dwelling Requirement 535
Labour Force Led scenarios in 4.2.11 have used the 5 year migration led run population figures.
4.1.2 Dwelling Led scenarios
These scenarios look at what has happened to the number of dwellings in the past, and apply what we expect to happen to the number of dwellings in the future. These scenarios therefore depict what could happen if certain assumptions we have made about the provision of dwellings are realised. The predicted population and migration figures represent what would be needed to satisfy the assumed dwelling levels.
Table 4.3 - 5 Year Dwelling Led Shows what would happen if net dwelling change remained the same as the last 5 years through to 2031
South Lakeland District 2006 2011 2016 2021 2026 2031
Population 103,436 102,787 101,890 100,984 100,525 100,006
Households 45,886 47,184 48,561 49,938 51,314 52,691
Dwellings 49,499 50,900 52,385 53,870 55,355 56,840
5 Year Net Migration 1,353 1,203 1,385 2,038 2,208
5 Year Net Change -649 -897 -906 -459 -519
Annualised Migration 271 241 277 408 442
Annualised Change -130 -179 -181 -92 -104
Annualised Dwelling Requirement 280 297 297 297 297
Average Annualised Dwelling Requirement 294
Table 4.4 - Dwelling Led based on Regional Spatial Strategy (RSS) Shows what might happen if net dwelling change followed those laid out in the RSS
South Lakeland District 2006 2011 2016 2021 2026 2031
Population 103,436 103,591 103,930 104,162 104,786 105,317
Households 45,886 47,513 49,436 51,360 53,283 55,207
Dwellings 49,499 51,254 53,329 55,404 57,479 59,554
5 Year Net Migration 2,148 2,378 2,433 3,035 3,191
5 Year Net Change 155 339 232 624 531
Annualised Migration 430 476 487 607 638
Annualised Change 31 68 46 125 106
Annualised Dwelling Requirement 351 415 415 415 415
Average Annualised Dwelling Requirement 402
All information contained in the above tables should be used as a guide only. It is improbable that any one scenario will be realised exactly. However, by using the information contained in each scenario together is may be used to aid the decision making process.
The table below shows population projections at District level from 2006-2031 using Popgroup migration led run. This shows a substantial increase in the older age groups, particularly in the 75+ age group and significant decrease in younger age
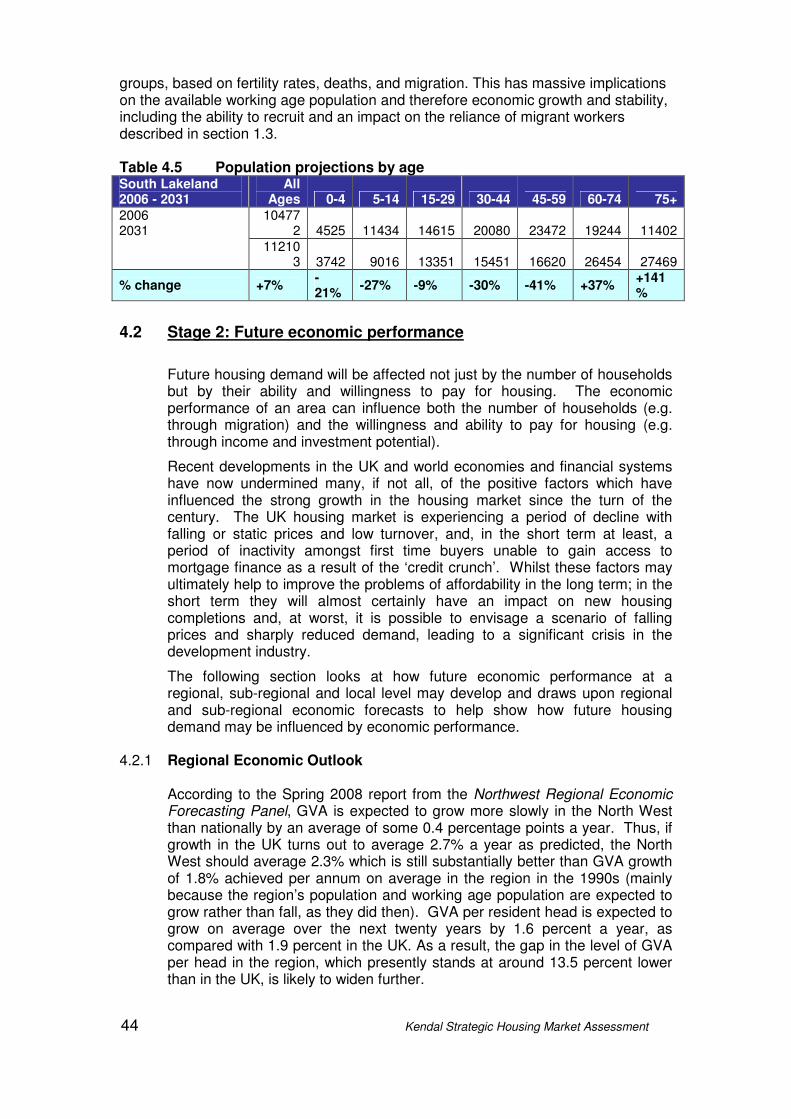
44 Kendal Strategic Housing Market Assessment
groups, based on fertility rates, deaths, and migration. This has massive implications on the available working age population and therefore economic growth and stability, including the ability to recruit and an impact on the reliance of migrant workers described in section 1.3. Table 4.5 Population projections by age South Lakeland 2006 - 2031
All Ages 0-4 5-14 15-29 30-44 45-59 60-74 75+
104772 4525 11434 14615 20080 23472 19244 11402
2006 2031
112103 3742 9016 13351 15451 16620 26454 27469
% change +7% -21%
-27% -9% -30% -41% +37% +141%
4.2 Stage 2: Future economic performance
Future housing demand will be affected not just by the number of households but by their ability and willingness to pay for housing. The economic performance of an area can influence both the number of households (e.g. through migration) and the willingness and ability to pay for housing (e.g. through income and investment potential).
Recent developments in the UK and world economies and financial systems have now undermined many, if not all, of the positive factors which have influenced the strong growth in the housing market since the turn of the century. The UK housing market is experiencing a period of decline with falling or static prices and low turnover, and, in the short term at least, a period of inactivity amongst first time buyers unable to gain access to mortgage finance as a result of the ‘credit crunch’. Whilst these factors may ultimately help to improve the problems of affordability in the long term; in the short term they will almost certainly have an impact on new housing completions and, at worst, it is possible to envisage a scenario of falling prices and sharply reduced demand, leading to a significant crisis in the development industry.
The following section looks at how future economic performance at a regional, sub-regional and local level may develop and draws upon regional and sub-regional economic forecasts to help show how future housing demand may be influenced by economic performance.
4.2.1 Regional Economic Outlook
According to the Spring 2008 report from the Northwest Regional Economic Forecasting Panel, GVA is expected to grow more slowly in the North West than nationally by an average of some 0.4 percentage points a year. Thus, if growth in the UK turns out to average 2.7% a year as predicted, the North West should average 2.3% which is still substantially better than GVA growth of 1.8% achieved per annum on average in the region in the 1990s (mainly because the region’s population and working age population are expected to grow rather than fall, as they did then). GVA per resident head is expected to grow on average over the next twenty years by 1.6 percent a year, as compared with 1.9 percent in the UK. As a result, the gap in the level of GVA per head in the region, which presently stands at around 13.5 percent lower than in the UK, is likely to widen further.
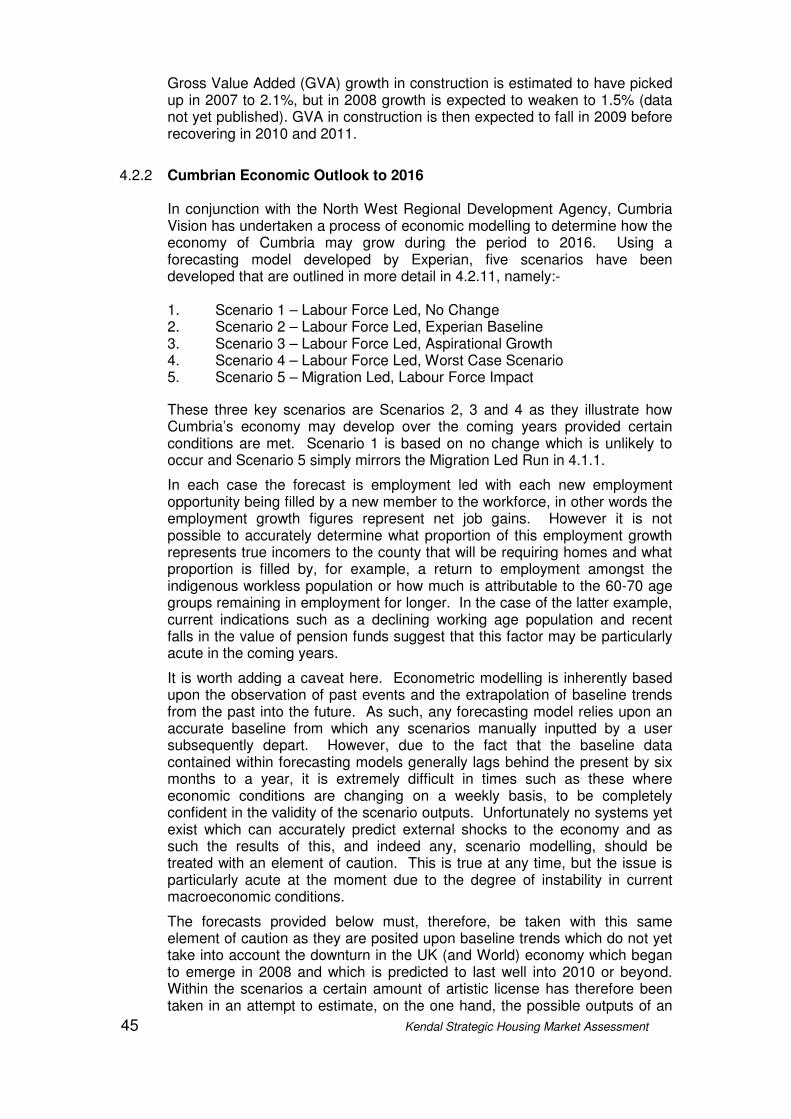
45 Kendal Strategic Housing Market Assessment
Gross Value Added (GVA) growth in construction is estimated to have picked up in 2007 to 2.1%, but in 2008 growth is expected to weaken to 1.5% (data not yet published). GVA in construction is then expected to fall in 2009 before recovering in 2010 and 2011.
4.2.2 Cumbrian Economic Outlook to 2016
In conjunction with the North West Regional Development Agency, Cumbria Vision has undertaken a process of economic modelling to determine how the economy of Cumbria may grow during the period to 2016. Using a forecasting model developed by Experian, five scenarios have been developed that are outlined in more detail in 4.2.11, namely:- 1. Scenario 1 – Labour Force Led, No Change 2. Scenario 2 – Labour Force Led, Experian Baseline 3. Scenario 3 – Labour Force Led, Aspirational Growth 4. Scenario 4 – Labour Force Led, Worst Case Scenario 5. Scenario 5 – Migration Led, Labour Force Impact
These three key scenarios are Scenarios 2, 3 and 4 as they illustrate how Cumbria’s economy may develop over the coming years provided certain conditions are met. Scenario 1 is based on no change which is unlikely to occur and Scenario 5 simply mirrors the Migration Led Run in 4.1.1.
In each case the forecast is employment led with each new employment opportunity being filled by a new member to the workforce, in other words the employment growth figures represent net job gains. However it is not possible to accurately determine what proportion of this employment growth represents true incomers to the county that will be requiring homes and what proportion is filled by, for example, a return to employment amongst the indigenous workless population or how much is attributable to the 60-70 age groups remaining in employment for longer. In the case of the latter example, current indications such as a declining working age population and recent falls in the value of pension funds suggest that this factor may be particularly acute in the coming years.
It is worth adding a caveat here. Econometric modelling is inherently based upon the observation of past events and the extrapolation of baseline trends from the past into the future. As such, any forecasting model relies upon an accurate baseline from which any scenarios manually inputted by a user subsequently depart. However, due to the fact that the baseline data contained within forecasting models generally lags behind the present by six months to a year, it is extremely difficult in times such as these where economic conditions are changing on a weekly basis, to be completely confident in the validity of the scenario outputs. Unfortunately no systems yet exist which can accurately predict external shocks to the economy and as such the results of this, and indeed any, scenario modelling, should be treated with an element of caution. This is true at any time, but the issue is particularly acute at the moment due to the degree of instability in current macroeconomic conditions.
The forecasts provided below must, therefore, be taken with this same element of caution as they are posited upon baseline trends which do not yet take into account the downturn in the UK (and World) economy which began to emerge in 2008 and which is predicted to last well into 2010 or beyond. Within the scenarios a certain amount of artistic license has therefore been taken in an attempt to estimate, on the one hand, the possible outputs of an
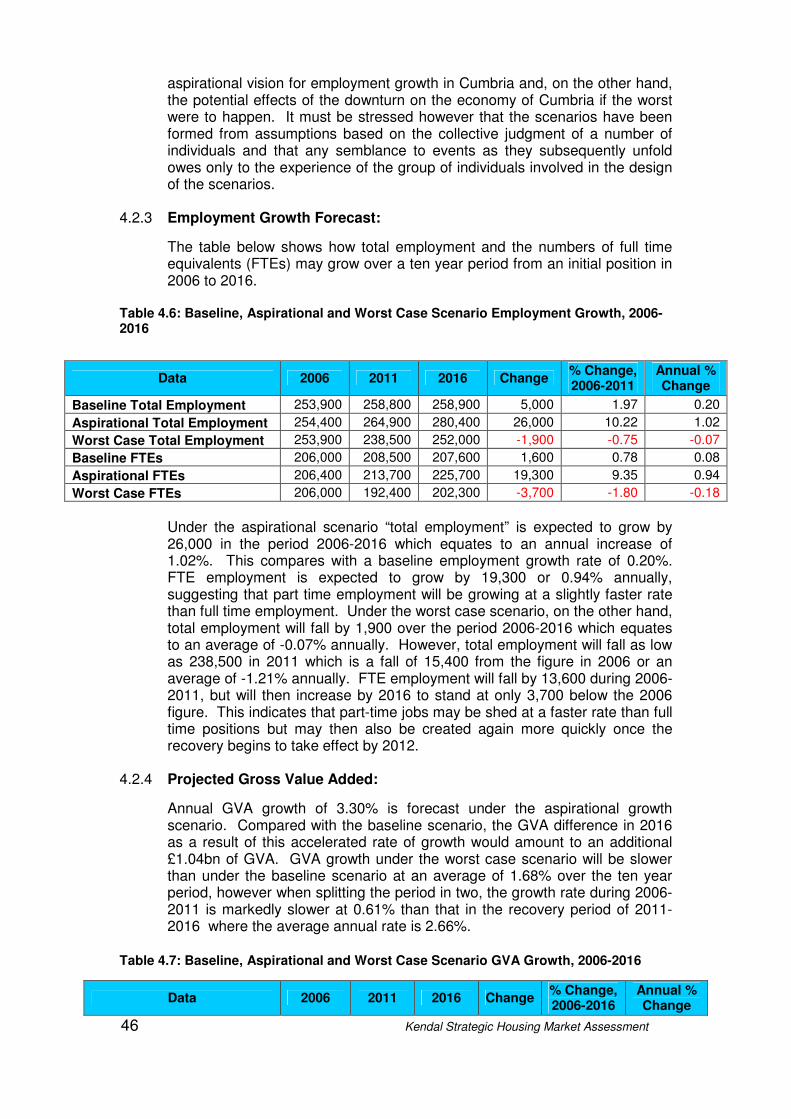
46 Kendal Strategic Housing Market Assessment
aspirational vision for employment growth in Cumbria and, on the other hand, the potential effects of the downturn on the economy of Cumbria if the worst were to happen. It must be stressed however that the scenarios have been formed from assumptions based on the collective judgment of a number of individuals and that any semblance to events as they subsequently unfold owes only to the experience of the group of individuals involved in the design of the scenarios.
4.2.3 Employment Growth Forecast:
The table below shows how total employment and the numbers of full time equivalents (FTEs) may grow over a ten year period from an initial position in 2006 to 2016.
Table 4.6: Baseline, Aspirational and Worst Case Scenario Employment Growth, 2006-2016
Data 2006 2011 2016 Change % Change, 2006-2011
Annual % Change
Baseline Total Employment 253,900 258,800 258,900 5,000 1.97 0.20
Aspirational Total Employment 254,400 264,900 280,400 26,000 10.22 1.02
Worst Case Total Employment 253,900 238,500 252,000 -1,900 -0.75 -0.07
Baseline FTEs 206,000 208,500 207,600 1,600 0.78 0.08
Aspirational FTEs 206,400 213,700 225,700 19,300 9.35 0.94
Worst Case FTEs 206,000 192,400 202,300 -3,700 -1.80 -0.18
Under the aspirational scenario “total employment” is expected to grow by 26,000 in the period 2006-2016 which equates to an annual increase of 1.02%. This compares with a baseline employment growth rate of 0.20%. FTE employment is expected to grow by 19,300 or 0.94% annually, suggesting that part time employment will be growing at a slightly faster rate than full time employment. Under the worst case scenario, on the other hand, total employment will fall by 1,900 over the period 2006-2016 which equates to an average of -0.07% annually. However, total employment will fall as low as 238,500 in 2011 which is a fall of 15,400 from the figure in 2006 or an average of -1.21% annually. FTE employment will fall by 13,600 during 2006-2011, but will then increase by 2016 to stand at only 3,700 below the 2006 figure. This indicates that part-time jobs may be shed at a faster rate than full time positions but may then also be created again more quickly once the recovery begins to take effect by 2012.
4.2.4 Projected Gross Value Added:
Annual GVA growth of 3.30% is forecast under the aspirational growth scenario. Compared with the baseline scenario, the GVA difference in 2016 as a result of this accelerated rate of growth would amount to an additional £1.04bn of GVA. GVA growth under the worst case scenario will be slower than under the baseline scenario at an average of 1.68% over the ten year period, however when splitting the period in two, the growth rate during 2006-2011 is markedly slower at 0.61% than that in the recovery period of 2011-2016 where the average annual rate is 2.66%.
Table 4.7: Baseline, Aspirational and Worst Case Scenario GVA Growth, 2006-2016
Data 2006 2011 2016 Change % Change, 2006-2016
Annual % Change

47 Kendal Strategic Housing Market Assessment
Baseline GVA (£million) 6,850 7,510 8,080 1,230 18.0 1.80
Aspirational GVA (£million) 6,870 7,790 9,140 2,270 33.0 3.30
Worst Case GVA (£million) 6,850 7,060 8,000 1,150 16.8 1.68
4.2.5 Economic Outlook – South Lakeland
South Lakeland enjoys a superb rural environment yet close proximity to the M6, West Coast Mainline and trans-Pennine routes bring significant connections and opportunities to this part of Cumbria. The area is sparsely populated and is characterized by small characterful towns and villages with deeply rural hinterlands.
The Lake District National Park and Area of Outstanding Natural Beauty designations complement a very high quality upland and lowland landscape throughout the area. The towns such as Kendal, Ulverston, supported by important settlements such as Grange-over-Sands, Milnthorpe, Kirkby Lonsdale, Windermere, Sedbergh, make up the key settlements and present a high quality built environment. Future economic development in the area will be delivered on a cross boundary basis and overseen by an Eden and South Lakeland delivery board comprising of private and public sector representatives.
4.2.6 Key opportunities
• High value manufacturing (sub sea engineering technologies, electronics, etc) particularly in Kendal and Ulverston. For example, Tronic has experienced significant growth in Ulverston and a new factory has been built creating around 200 jobs.
• Significant potential to add value to local products – food and drink, forestry and agriculture – production and marketing.
• Developing a high quality, world class, yet sustainable local tourism product– accommodation, infrastructure, engagement with the environment, public realm renewal/investment.
• Cultural and creative industries – existing strong cluster of world class cultural attractions and organizations.
• Knowledge based industry – environmental technologies, renewable energies
• Skills and education, including the development of the Cumbria University, together with addressing gaps in HE provision in the East of Cumbria.
• The marketing of Cumbria as the UK’s ‘Adventure Capital’ for outdoor and alternative sports aims to attract new visitors to the area.
• A new commitment and willingness for collaboration and joint working between local authorities and agencies.
4.2.7 Key Issues
• Limited supply of sites for modern business premises – addressing constraints and market failure in delivering sites.
• Supply of housing sites.
• Labour supply issues – tight labour market with low levels of unemployment/worklessness – constraints by education, skills and affordable housing.
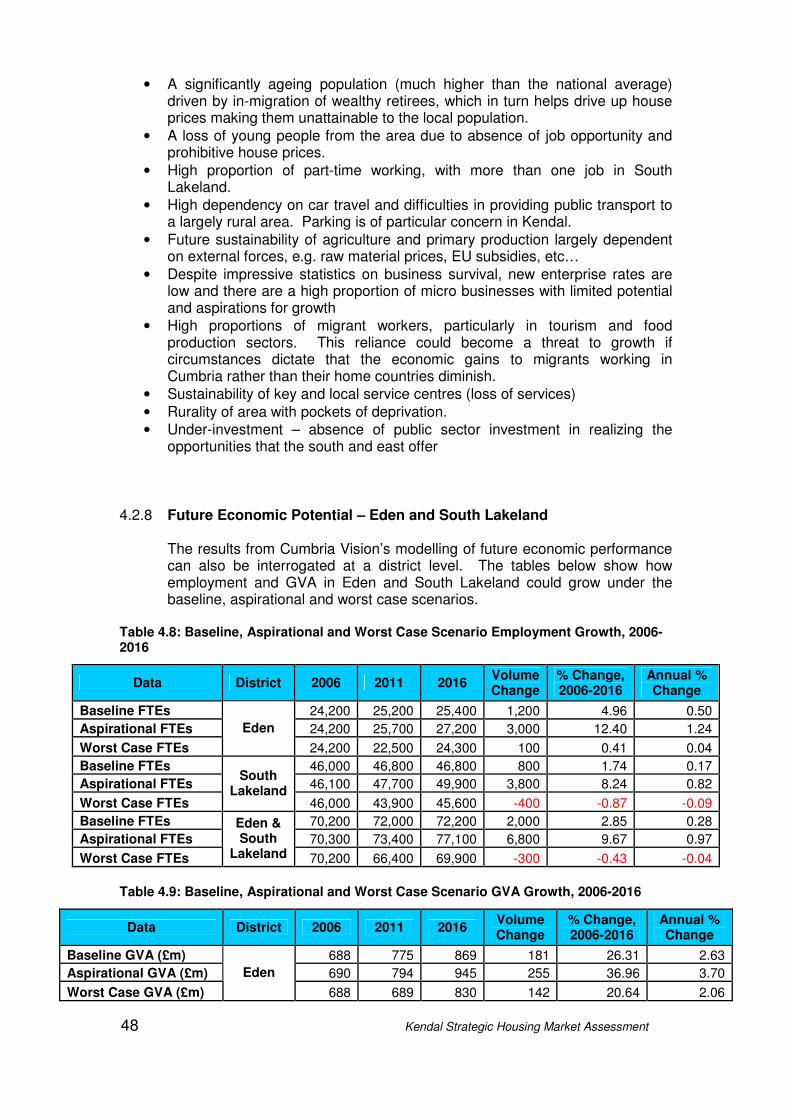
48 Kendal Strategic Housing Market Assessment
• A significantly ageing population (much higher than the national average) driven by in-migration of wealthy retirees, which in turn helps drive up house prices making them unattainable to the local population.
• A loss of young people from the area due to absence of job opportunity and prohibitive house prices.
• High proportion of part-time working, with more than one job in South Lakeland.
• High dependency on car travel and difficulties in providing public transport to a largely rural area. Parking is of particular concern in Kendal.
• Future sustainability of agriculture and primary production largely dependent on external forces, e.g. raw material prices, EU subsidies, etc…
• Despite impressive statistics on business survival, new enterprise rates are low and there are a high proportion of micro businesses with limited potential and aspirations for growth
• High proportions of migrant workers, particularly in tourism and food production sectors. This reliance could become a threat to growth if circumstances dictate that the economic gains to migrants working in Cumbria rather than their home countries diminish.
• Sustainability of key and local service centres (loss of services)
• Rurality of area with pockets of deprivation.
• Under-investment – absence of public sector investment in realizing the opportunities that the south and east offer
4.2.8 Future Economic Potential – Eden and South Lakeland
The results from Cumbria Vision’s modelling of future economic performance can also be interrogated at a district level. The tables below show how employment and GVA in Eden and South Lakeland could grow under the baseline, aspirational and worst case scenarios.
Table 4.8: Baseline, Aspirational and Worst Case Scenario Employment Growth, 2006-2016
Data District 2006 2011 2016 Volume Change
% Change, 2006-2016
Annual % Change
Baseline FTEs 24,200 25,200 25,400 1,200 4.96 0.50
Aspirational FTEs 24,200 25,700 27,200 3,000 12.40 1.24
Worst Case FTEs
Eden
24,200 22,500 24,300 100 0.41 0.04
Baseline FTEs 46,000 46,800 46,800 800 1.74 0.17
Aspirational FTEs 46,100 47,700 49,900 3,800 8.24 0.82
Worst Case FTEs
South Lakeland
46,000 43,900 45,600 -400 -0.87 -0.09
Baseline FTEs 70,200 72,000 72,200 2,000 2.85 0.28
Aspirational FTEs 70,300 73,400 77,100 6,800 9.67 0.97
Worst Case FTEs
Eden & South
Lakeland 70,200 66,400 69,900 -300 -0.43 -0.04
Table 4.9: Baseline, Aspirational and Worst Case Scenario GVA Growth, 2006-2016
Data District 2006 2011 2016 Volume Change
% Change, 2006-2016
Annual % Change
Baseline GVA (£m) 688 775 869 181 26.31 2.63
Aspirational GVA (£m) 690 794 945 255 36.96 3.70
Worst Case GVA (£m)
Eden
688 689 830 142 20.64 2.06
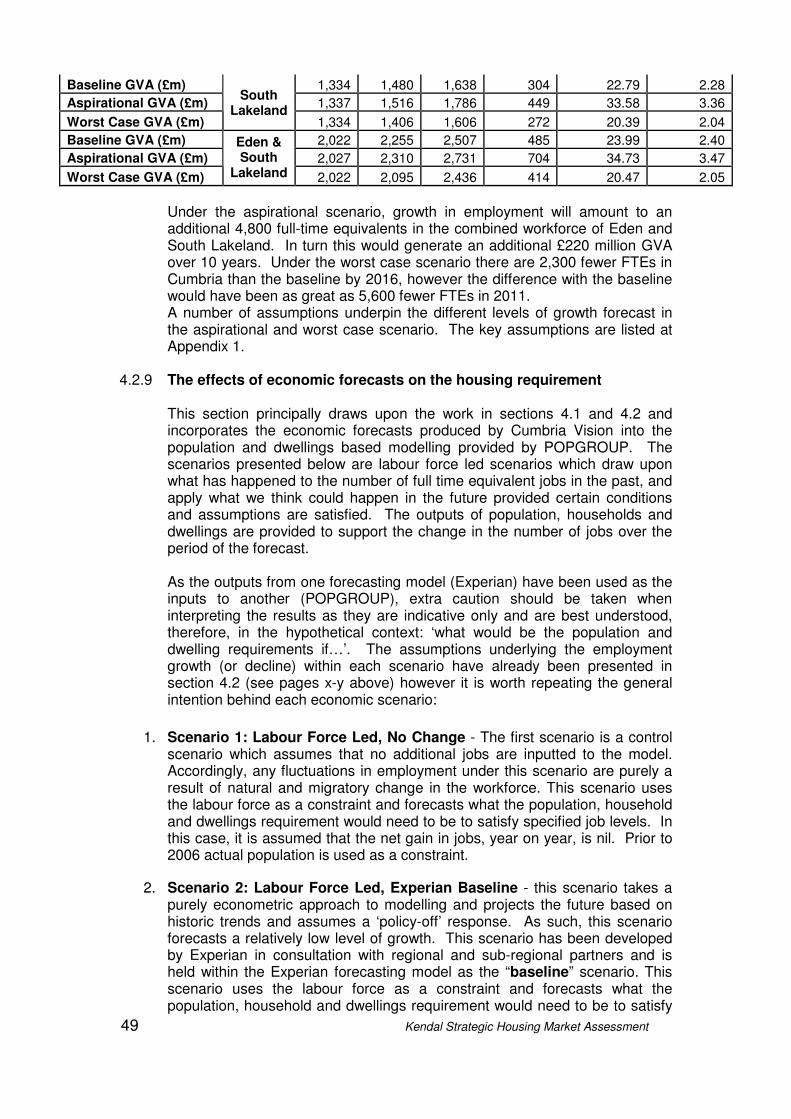
49 Kendal Strategic Housing Market Assessment
Baseline GVA (£m) 1,334 1,480 1,638 304 22.79 2.28
Aspirational GVA (£m) 1,337 1,516 1,786 449 33.58 3.36
Worst Case GVA (£m)
South Lakeland
1,334 1,406 1,606 272 20.39 2.04
Baseline GVA (£m) 2,022 2,255 2,507 485 23.99 2.40
Aspirational GVA (£m) 2,027 2,310 2,731 704 34.73 3.47
Worst Case GVA (£m)
Eden & South
Lakeland 2,022 2,095 2,436 414 20.47 2.05
Under the aspirational scenario, growth in employment will amount to an additional 4,800 full-time equivalents in the combined workforce of Eden and South Lakeland. In turn this would generate an additional £220 million GVA over 10 years. Under the worst case scenario there are 2,300 fewer FTEs in Cumbria than the baseline by 2016, however the difference with the baseline would have been as great as 5,600 fewer FTEs in 2011. A number of assumptions underpin the different levels of growth forecast in the aspirational and worst case scenario. The key assumptions are listed at Appendix 1.
4.2.9 The effects of economic forecasts on the housing requirement
This section principally draws upon the work in sections 4.1 and 4.2 and incorporates the economic forecasts produced by Cumbria Vision into the population and dwellings based modelling provided by POPGROUP. The scenarios presented below are labour force led scenarios which draw upon what has happened to the number of full time equivalent jobs in the past, and apply what we think could happen in the future provided certain conditions and assumptions are satisfied. The outputs of population, households and dwellings are provided to support the change in the number of jobs over the period of the forecast.
As the outputs from one forecasting model (Experian) have been used as the inputs to another (POPGROUP), extra caution should be taken when interpreting the results as they are indicative only and are best understood, therefore, in the hypothetical context: ‘what would be the population and dwelling requirements if…’. The assumptions underlying the employment growth (or decline) within each scenario have already been presented in section 4.2 (see pages x-y above) however it is worth repeating the general intention behind each economic scenario:
1. Scenario 1: Labour Force Led, No Change - The first scenario is a control scenario which assumes that no additional jobs are inputted to the model. Accordingly, any fluctuations in employment under this scenario are purely a result of natural and migratory change in the workforce. This scenario uses the labour force as a constraint and forecasts what the population, household and dwellings requirement would need to be to satisfy specified job levels. In this case, it is assumed that the net gain in jobs, year on year, is nil. Prior to 2006 actual population is used as a constraint.
2. Scenario 2: Labour Force Led, Experian Baseline - this scenario takes a purely econometric approach to modelling and projects the future based on historic trends and assumes a ‘policy-off’ response. As such, this scenario forecasts a relatively low level of growth. This scenario has been developed by Experian in consultation with regional and sub-regional partners and is held within the Experian forecasting model as the “baseline” scenario. This scenario uses the labour force as a constraint and forecasts what the population, household and dwellings requirement would need to be to satisfy
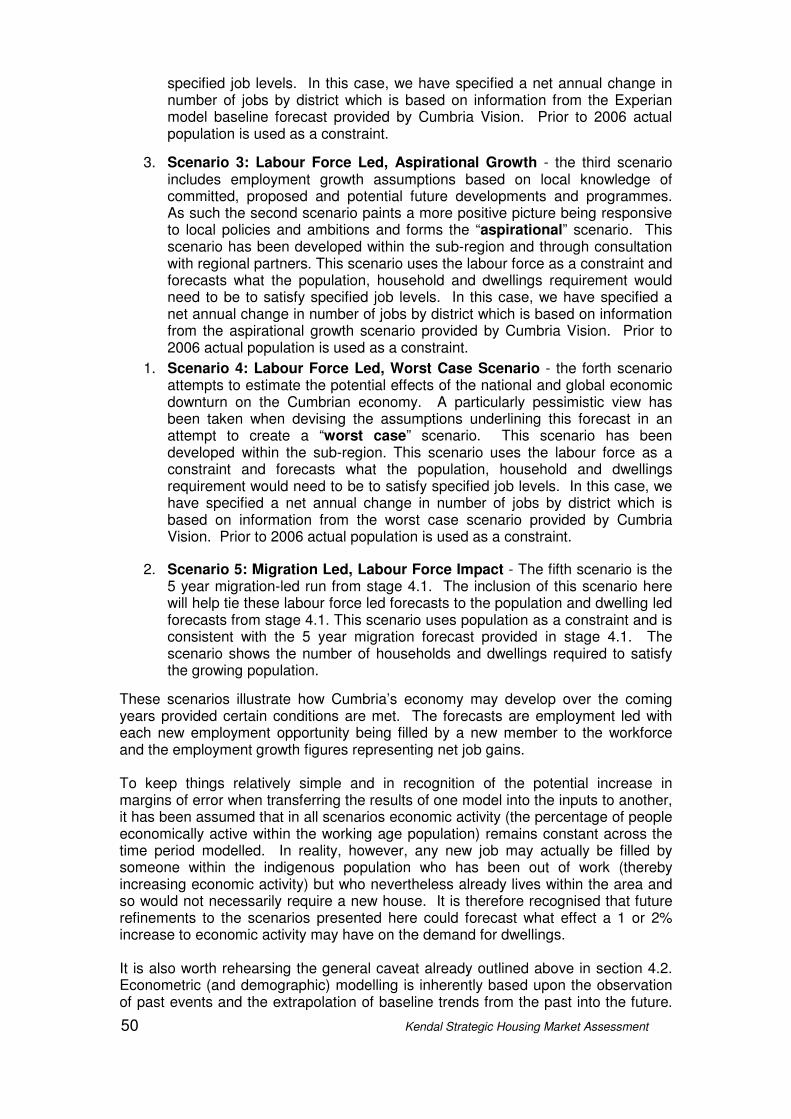
50 Kendal Strategic Housing Market Assessment
specified job levels. In this case, we have specified a net annual change in number of jobs by district which is based on information from the Experian model baseline forecast provided by Cumbria Vision. Prior to 2006 actual population is used as a constraint.
3. Scenario 3: Labour Force Led, Aspirational Growth - the third scenario includes employment growth assumptions based on local knowledge of committed, proposed and potential future developments and programmes. As such the second scenario paints a more positive picture being responsive to local policies and ambitions and forms the “aspirational” scenario. This scenario has been developed within the sub-region and through consultation with regional partners. This scenario uses the labour force as a constraint and forecasts what the population, household and dwellings requirement would need to be to satisfy specified job levels. In this case, we have specified a net annual change in number of jobs by district which is based on information from the aspirational growth scenario provided by Cumbria Vision. Prior to 2006 actual population is used as a constraint.
1. Scenario 4: Labour Force Led, Worst Case Scenario - the forth scenario attempts to estimate the potential effects of the national and global economic downturn on the Cumbrian economy. A particularly pessimistic view has been taken when devising the assumptions underlining this forecast in an attempt to create a “worst case” scenario. This scenario has been developed within the sub-region. This scenario uses the labour force as a constraint and forecasts what the population, household and dwellings requirement would need to be to satisfy specified job levels. In this case, we have specified a net annual change in number of jobs by district which is based on information from the worst case scenario provided by Cumbria Vision. Prior to 2006 actual population is used as a constraint.
2. Scenario 5: Migration Led, Labour Force Impact - The fifth scenario is the 5 year migration-led run from stage 4.1. The inclusion of this scenario here will help tie these labour force led forecasts to the population and dwelling led forecasts from stage 4.1. This scenario uses population as a constraint and is consistent with the 5 year migration forecast provided in stage 4.1. The scenario shows the number of households and dwellings required to satisfy the growing population.
These scenarios illustrate how Cumbria’s economy may develop over the coming years provided certain conditions are met. The forecasts are employment led with each new employment opportunity being filled by a new member to the workforce and the employment growth figures representing net job gains. To keep things relatively simple and in recognition of the potential increase in margins of error when transferring the results of one model into the inputs to another, it has been assumed that in all scenarios economic activity (the percentage of people economically active within the working age population) remains constant across the time period modelled. In reality, however, any new job may actually be filled by someone within the indigenous population who has been out of work (thereby increasing economic activity) but who nevertheless already lives within the area and so would not necessarily require a new house. It is therefore recognised that future refinements to the scenarios presented here could forecast what effect a 1 or 2% increase to economic activity may have on the demand for dwellings. It is also worth rehearsing the general caveat already outlined above in section 4.2. Econometric (and demographic) modelling is inherently based upon the observation of past events and the extrapolation of baseline trends from the past into the future.
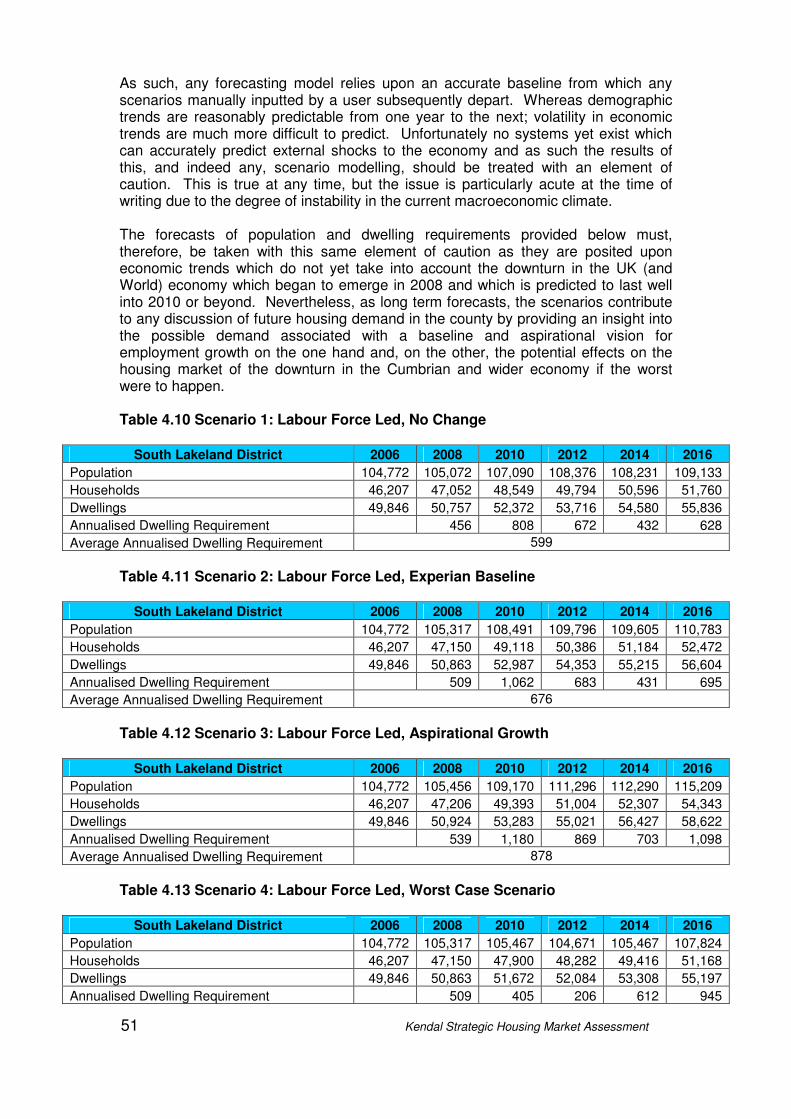
51 Kendal Strategic Housing Market Assessment
As such, any forecasting model relies upon an accurate baseline from which any scenarios manually inputted by a user subsequently depart. Whereas demographic trends are reasonably predictable from one year to the next; volatility in economic trends are much more difficult to predict. Unfortunately no systems yet exist which can accurately predict external shocks to the economy and as such the results of this, and indeed any, scenario modelling, should be treated with an element of caution. This is true at any time, but the issue is particularly acute at the time of writing due to the degree of instability in the current macroeconomic climate. The forecasts of population and dwelling requirements provided below must, therefore, be taken with this same element of caution as they are posited upon economic trends which do not yet take into account the downturn in the UK (and World) economy which began to emerge in 2008 and which is predicted to last well into 2010 or beyond. Nevertheless, as long term forecasts, the scenarios contribute to any discussion of future housing demand in the county by providing an insight into the possible demand associated with a baseline and aspirational vision for employment growth on the one hand and, on the other, the potential effects on the housing market of the downturn in the Cumbrian and wider economy if the worst were to happen. Table 4.10 Scenario 1: Labour Force Led, No Change
South Lakeland District 2006 2008 2010 2012 2014 2016
Population 104,772 105,072 107,090 108,376 108,231 109,133
Households 46,207 47,052 48,549 49,794 50,596 51,760
Dwellings 49,846 50,757 52,372 53,716 54,580 55,836
Annualised Dwelling Requirement 456 808 672 432 628
Average Annualised Dwelling Requirement 599
Table 4.11 Scenario 2: Labour Force Led, Experian Baseline
South Lakeland District 2006 2008 2010 2012 2014 2016
Population 104,772 105,317 108,491 109,796 109,605 110,783
Households 46,207 47,150 49,118 50,386 51,184 52,472
Dwellings 49,846 50,863 52,987 54,353 55,215 56,604
Annualised Dwelling Requirement 509 1,062 683 431 695
Average Annualised Dwelling Requirement 676
Table 4.12 Scenario 3: Labour Force Led, Aspirational Growth
South Lakeland District 2006 2008 2010 2012 2014 2016
Population 104,772 105,456 109,170 111,296 112,290 115,209
Households 46,207 47,206 49,393 51,004 52,307 54,343
Dwellings 49,846 50,924 53,283 55,021 56,427 58,622
Annualised Dwelling Requirement 539 1,180 869 703 1,098
Average Annualised Dwelling Requirement 878
Table 4.13 Scenario 4: Labour Force Led, Worst Case Scenario
South Lakeland District 2006 2008 2010 2012 2014 2016
Population 104,772 105,317 105,467 104,671 105,467 107,824
Households 46,207 47,150 47,900 48,282 49,416 51,168
Dwellings 49,846 50,863 51,672 52,084 53,308 55,197
Annualised Dwelling Requirement 509 405 206 612 945
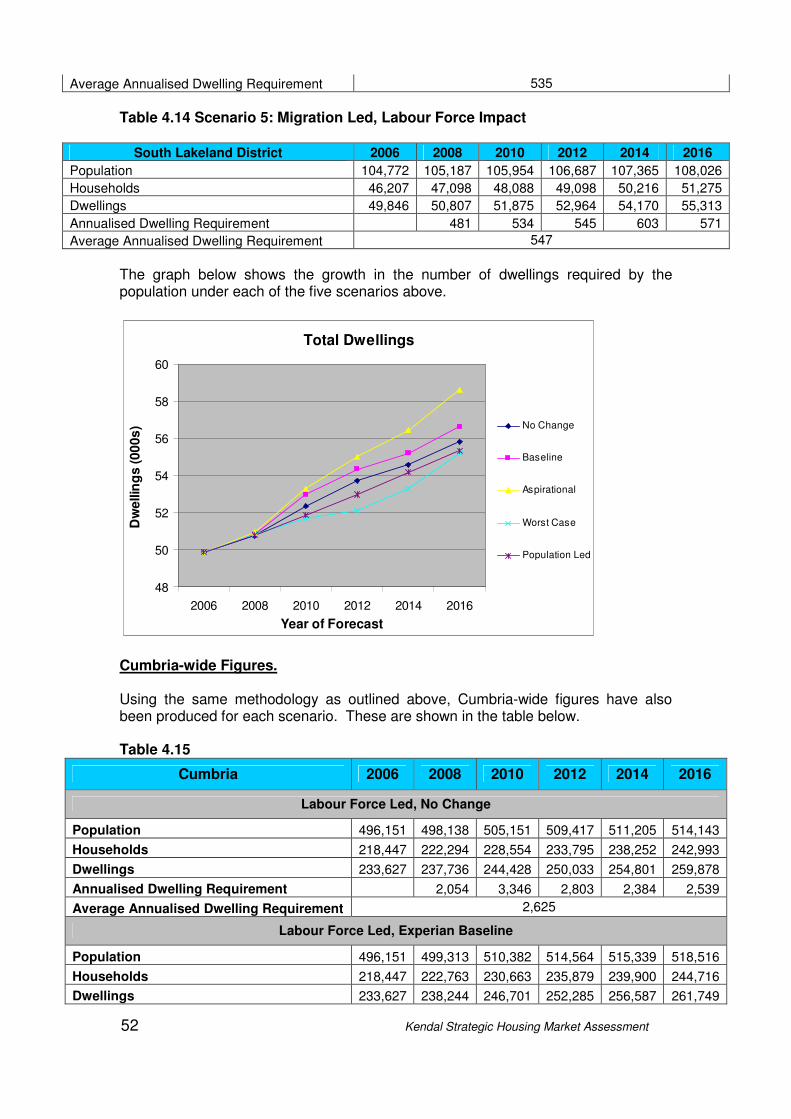
52 Kendal Strategic Housing Market Assessment
Average Annualised Dwelling Requirement 535
Table 4.14 Scenario 5: Migration Led, Labour Force Impact
South Lakeland District 2006 2008 2010 2012 2014 2016
Population 104,772 105,187 105,954 106,687 107,365 108,026
Households 46,207 47,098 48,088 49,098 50,216 51,275
Dwellings 49,846 50,807 51,875 52,964 54,170 55,313
Annualised Dwelling Requirement 481 534 545 603 571
Average Annualised Dwelling Requirement 547
The graph below shows the growth in the number of dwellings required by the population under each of the five scenarios above.
Total Dwellings
48
50
52
54
56
58
60
2006 2008 2010 2012 2014 2016
Year of Forecast
Dw
ellin
gs (
00
0s
) No Change
Baseline
Aspirational
Worst Case
Population Led
Cumbria-wide Figures. Using the same methodology as outlined above, Cumbria-wide figures have also been produced for each scenario. These are shown in the table below. Table 4.15
Cumbria 2006 2008 2010 2012 2014 2016
Labour Force Led, No Change
Population 496,151 498,138 505,151 509,417 511,205 514,143
Households 218,447 222,294 228,554 233,795 238,252 242,993
Dwellings 233,627 237,736 244,428 250,033 254,801 259,878
Annualised Dwelling Requirement 2,054 3,346 2,803 2,384 2,539
Average Annualised Dwelling Requirement 2,625
Labour Force Led, Experian Baseline
Population 496,151 499,313 510,382 514,564 515,339 518,516
Households 218,447 222,763 230,663 235,879 239,900 244,716
Dwellings 233,627 238,244 246,701 252,285 256,587 261,749
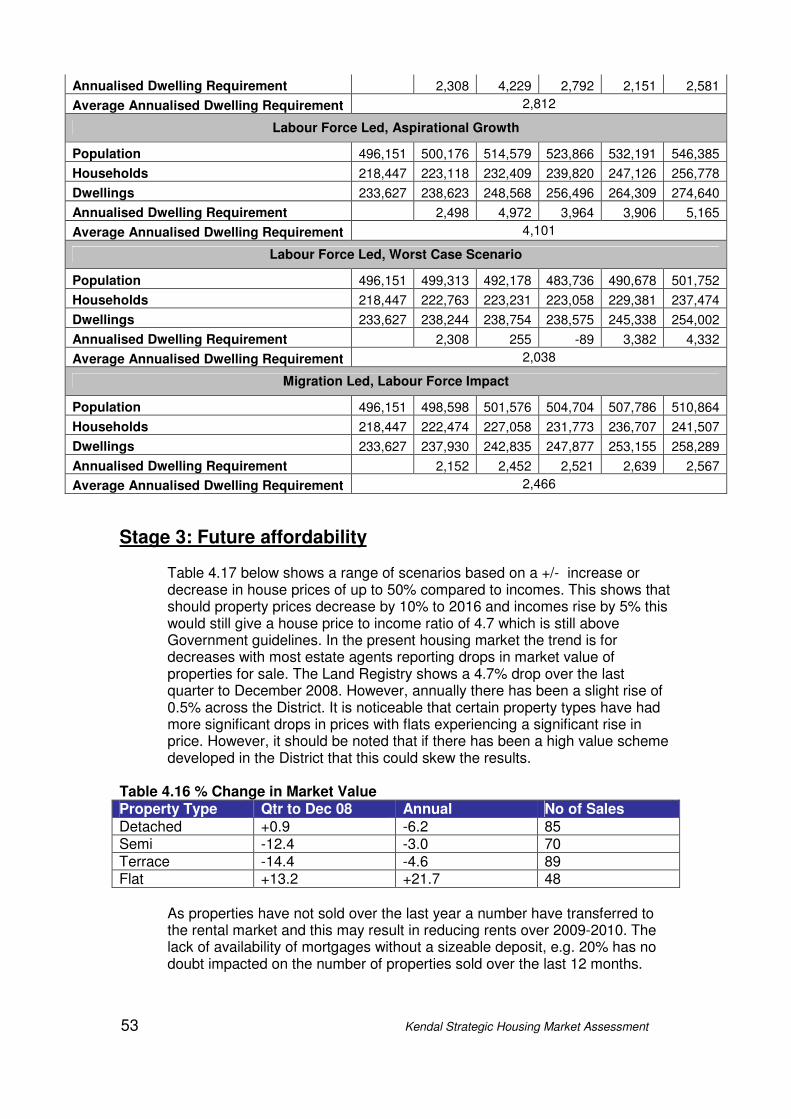
53 Kendal Strategic Housing Market Assessment
Annualised Dwelling Requirement 2,308 4,229 2,792 2,151 2,581
Average Annualised Dwelling Requirement 2,812
Labour Force Led, Aspirational Growth
Population 496,151 500,176 514,579 523,866 532,191 546,385
Households 218,447 223,118 232,409 239,820 247,126 256,778
Dwellings 233,627 238,623 248,568 256,496 264,309 274,640
Annualised Dwelling Requirement 2,498 4,972 3,964 3,906 5,165
Average Annualised Dwelling Requirement 4,101
Labour Force Led, Worst Case Scenario
Population 496,151 499,313 492,178 483,736 490,678 501,752
Households 218,447 222,763 223,231 223,058 229,381 237,474
Dwellings 233,627 238,244 238,754 238,575 245,338 254,002
Annualised Dwelling Requirement 2,308 255 -89 3,382 4,332
Average Annualised Dwelling Requirement 2,038
Migration Led, Labour Force Impact
Population 496,151 498,598 501,576 504,704 507,786 510,864
Households 218,447 222,474 227,058 231,773 236,707 241,507
Dwellings 233,627 237,930 242,835 247,877 253,155 258,289
Annualised Dwelling Requirement 2,152 2,452 2,521 2,639 2,567
Average Annualised Dwelling Requirement 2,466
Stage 3: Future affordability
Table 4.17 below shows a range of scenarios based on a +/- increase or decrease in house prices of up to 50% compared to incomes. This shows that should property prices decrease by 10% to 2016 and incomes rise by 5% this would still give a house price to income ratio of 4.7 which is still above Government guidelines. In the present housing market the trend is for decreases with most estate agents reporting drops in market value of properties for sale. The Land Registry shows a 4.7% drop over the last quarter to December 2008. However, annually there has been a slight rise of 0.5% across the District. It is noticeable that certain property types have had more significant drops in prices with flats experiencing a significant rise in price. However, it should be noted that if there has been a high value scheme developed in the District that this could skew the results.
Table 4.16 % Change in Market Value Property Type Qtr to Dec 08 Annual No of Sales
Detached +0.9 -6.2 85 Semi -12.4 -3.0 70 Terrace -14.4 -4.6 89 Flat +13.2 +21.7 48
As properties have not sold over the last year a number have transferred to the rental market and this may result in reducing rents over 2009-2010. The lack of availability of mortgages without a sizeable deposit, e.g. 20% has no doubt impacted on the number of properties sold over the last 12 months.

54 Kendal Strategic Housing Market Assessment
Buyers for low cost home ownership products are likely to be affected by the lack of mortgage finance and with 9955 unsold shared ownership properties nationally there is likely to be a local impact (Figure source: Housing Corporation Housing Association Financial Health report). It is therefore, likely that in the short term housing associations will need to use low cost home ownership stock for social and intermediate rent in future. The majority of local parish needs survey undertaken reveal that the majority of need is for rent with a minority of households being able to afford low cost home ownership such as shared equity/ownership.
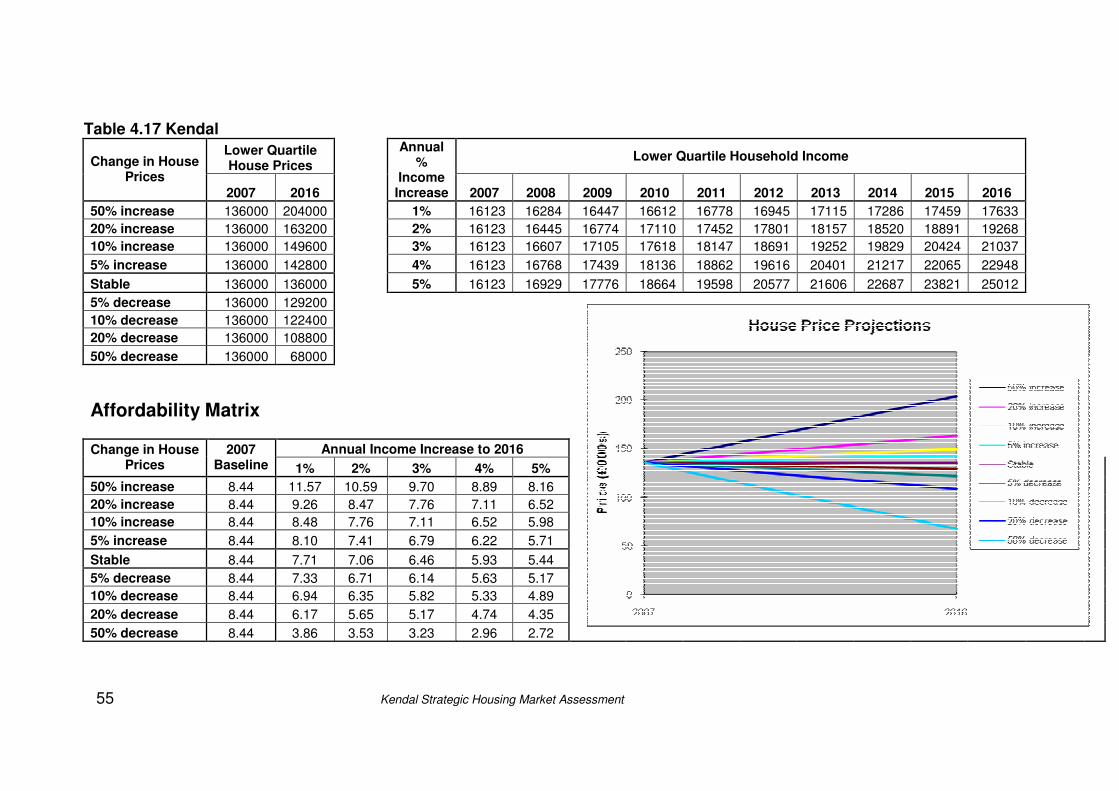
55 Kendal Strategic Housing Market Assessment
Table 4.17 Kendal
Lower Quartile House Prices
Lower Quartile Household Income Change in House
Prices
2007 2016
Annual %
Income Increase 2007 2008 2009 2010 2011 2012 2013 2014 2015 2016
50% increase 136000 204000 1% 16123 16284 16447 16612 16778 16945 17115 17286 17459 17633
20% increase 136000 163200 2% 16123 16445 16774 17110 17452 17801 18157 18520 18891 19268
10% increase 136000 149600 3% 16123 16607 17105 17618 18147 18691 19252 19829 20424 21037
5% increase 136000 142800 4% 16123 16768 17439 18136 18862 19616 20401 21217 22065 22948
Stable 136000 136000 5% 16123 16929 17776 18664 19598 20577 21606 22687 23821 25012
5% decrease 136000 129200
10% decrease 136000 122400
20% decrease 136000 108800
50% decrease 136000 68000
Affordability Matrix
Annual Income Increase to 2016 Change in House Prices
2007 Baseline 1% 2% 3% 4% 5%
50% increase 8.44 11.57 10.59 9.70 8.89 8.16
20% increase 8.44 9.26 8.47 7.76 7.11 6.52
10% increase 8.44 8.48 7.76 7.11 6.52 5.98
5% increase 8.44 8.10 7.41 6.79 6.22 5.71
Stable 8.44 7.71 7.06 6.46 5.93 5.44
5% decrease 8.44 7.33 6.71 6.14 5.63 5.17
10% decrease 8.44 6.94 6.35 5.82 5.33 4.89
20% decrease 8.44 6.17 5.65 5.17 4.74 4.35
50% decrease 8.44 3.86 3.53 3.23 2.96 2.72

56 Kendal Strategic Housing Market Assessment
Stage 4: Bringing the evidence together
• The substantial increase in the older age groups driven by in-migration and wealthy retirees, particularly in the 75+ age group and significant decrease in younger age groups has massive implications on the available working age population and therefore economic growth and stability, including the ability to recruit and an impact on the reliance of migrant workers described in section 1.3.
• This increase impacting on house prices affecting the scale of affordable housing need.
• A loss of young people from the area due to absence of job opportunity and prohibitive house prices.
• Cumbria prices have fallen by 4.7%. However this is not likely to have an impact on affordability. First time buyers are likely to have problems obtaining mortgages.
• Housing Associations may need to use low cost home ownership stock for social and intermediate rent. Parish surveys indicate that the majority of need is going to be for social rent.
• Recent economic performance and the effects of the ‘credit crunch’ will effect the willingness to pay for housing and place further pressure on affordable housing supply. There is also expected to be a weakened GVA growth in construction at least in the short term.
• The ‘aspirational’ growth scenario which forecasts 3800 additional jobs across the District (2006-2016) paints a positive picture. It is based on a number of opportunities and assumptions that need to be met before this employment forecast can be realised.
• However there are a number of issues that may undermine this – supply of business and housing sites, an aging population, dependence of agriculture on external forces, and pockets of rural deprivation etc. Supply of labour is an important issue and under Section 3 we found evidence that a skilled workforce may already live here but prefer to commute out of the area. If they were encouraged to work here for better pay rewards this might mitigate the undersupply of labour, but the evidence in Section 4 also highlights the acute decline in the working age population. Affordable housing for younger families is therefore vital to prevent out-migration and achieve sustainable economic growth.
57 Kendal Strategic Housing Market Assessment
5. Housing Need (affordable housing)
The requirement for affordable housing is based on the 2006 Housing Needs Survey. This presents data at Housing Market Area level. For Planning and development purposes further evidence may be required at a lower area level, for example based on parish or settlement needs. This data may be available for local authorities or from Cumbria Rural Housing Trust.
5.1 Stage 1 & 2: Updated housing requirements
The 2006 Housing Needs Survey gave housing requirements for the next 5 years. Government Guidance suggests that a comprehensive assessment exercise should not be required within this period, but that updating should be undertaken ‘regularly’. The table below uses the past trends on household increases derived from the PopGroup analysis to update previous estimates of affordable housing need. The percentage increase in households from 2006 – 2016 based on the ‘5 year migration led run’ has been used to give an average annual increase. This has also been applied to the figures for overall demand which will later be used to up date market led housing.
The ‘overall demand’ figure shows how many respondents to the original 2006 Housing Needs Survey said that they wished to move within five years. Within this a proportion were deemed to be in ‘unsuitable housing’ (overcrowded, requiring disabled access etc.) Analysis shows that a total of 4,876 or 9.9% of existing households in South Lakeland were in housing need (as at February 2006) of which some could afford their own housing solution on the open market while others required affordable housing. This stage of the analysis does not include supply side figures as the purpose here is to give an overall gross annual needs figure that can be worked towards before deductions are made for new build or social relets to give a net housing requirement. The update includes new figures for homeless households from 2006 to 2008.
The analysis shows the updated gross requirement for affordable housing in the District as a whole as 799 per annum. This represents 24% of total housing demand. Overall of all those wishing to move 49% are deemed to be in unsuitable housing, of which 50% are in need of affordable housing. This mirrors the 2006 District Wide Survey which showed that 54.7% of those in unsuitable housing required affordable housing.

58 Kendal Strategic Housing Market Assessment
Table 5.1 Gross Annual Market and Affordable Housing Table Updated housing demand, unsuitable housed and affordable housing need
Total (Existing, emerging and h’holds falling into need)
Popgroup migration run: add 1% annual household increase (2006-2011)
Sub-total Plus Homeless based on 3 year average acceptances
Annual total requirements
Overall housing demand (gross)
Central Lakes 880 8.8 889 22 911
Kendal 580 5.8 586 32 618
Rural Kendal 839 8.4 847 11 858
Ulverston and Furness 482 4.8 487 32 519
Dales 84 0.8 85 5 90
Cartmel Peninsula 282 2.8 285 5 290
District Total 3147 31.4 3179 107 3286
Of which those in unsuitable housing (gross)
Central Lakes 395 3.9 399 22 421
Kendal 367 3.7 371 32 403
Rural kendal 310 3.1 313 11 324
Ulverston and Furness 241 2.4 243 32 275
Dales 41 0.4 41 5 46
Cartmel Peninsula 121 1.2 122 5 127
District Total 1475 14.7 1489 107 1596
Of which require affordable housing need (gross)
Central Lakes 206 2.1 208.1 22 230
Kendal 91 0.9 91.9 32 124
Rural kendal 219 2.2 221.2 11 232
Ulverston and Furness 81 0.8 81.8 32 114
Dales 16 0.2 16.2 5 21
Cartmel Peninsula 72 0.7 72.7 5 78
District Total (gross) 685 6.9 691.9 107 799
The above analysis uses the original 2006 Survey as a starting point and applies a percentage increase in households to update housing requirements. By comparison the data contained in Chapter 4 stages 1 and 4 used PopGroup and Experian uses data on actual household formation trends and the effects of job levels as a starting point. It then used modelling techniques to estimate the number of dwellings required as a result of, for example, in-migration, to derive an average annualised total dwelling requirement (gross). This does not therefore include those in unsuitable housing ‘in-situ’. However the PopGroup and Experian analysis gives an alternative methodology, gauging the effects of household formation and employment growth on gross dwelling requirements.
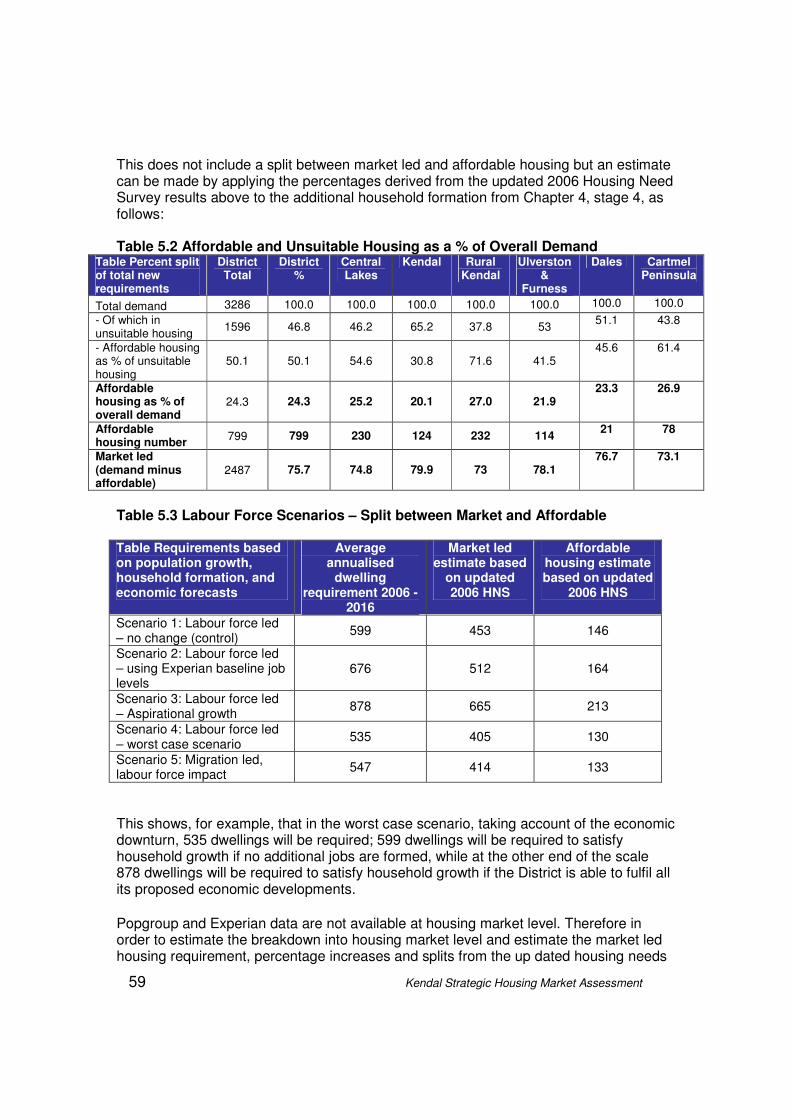
59 Kendal Strategic Housing Market Assessment
This does not include a split between market led and affordable housing but an estimate can be made by applying the percentages derived from the updated 2006 Housing Need Survey results above to the additional household formation from Chapter 4, stage 4, as follows: Table 5.2 Affordable and Unsuitable Housing as a % of Overall Demand
Table Percent split of total new requirements
District Total
District %
Central Lakes
Kendal Rural Kendal
Ulverston &
Furness
Dales Cartmel Peninsula
Total demand 3286 100.0 100.0 100.0 100.0 100.0 100.0 100.0
- Of which in unsuitable housing
1596 46.8 46.2 65.2 37.8 53 51.1 43.8
- Affordable housing as % of unsuitable housing
50.1 50.1 54.6 30.8 71.6 41.5 45.6 61.4
Affordable housing as % of overall demand
24.3 24.3 25.2 20.1 27.0 21.9 23.3 26.9
Affordable housing number
799 799 230 124 232 114 21 78
Market led (demand minus affordable)
2487 75.7 74.8 79.9 73 78.1 76.7 73.1
Table 5.3 Labour Force Scenarios – Split between Market and Affordable Table Requirements based on population growth, household formation, and economic forecasts
Average annualised
dwelling requirement 2006 -
2016
Market led estimate based
on updated 2006 HNS
Affordable housing estimate based on updated
2006 HNS
Scenario 1: Labour force led – no change (control)
599 453 146
Scenario 2: Labour force led – using Experian baseline job levels
676 512 164
Scenario 3: Labour force led – Aspirational growth
878 665 213
Scenario 4: Labour force led – worst case scenario
535 405 130
Scenario 5: Migration led, labour force impact
547 414 133
This shows, for example, that in the worst case scenario, taking account of the economic downturn, 535 dwellings will be required; 599 dwellings will be required to satisfy household growth if no additional jobs are formed, while at the other end of the scale 878 dwellings will be required to satisfy household growth if the District is able to fulfil all its proposed economic developments.
Popgroup and Experian data are not available at housing market level. Therefore in order to estimate the breakdown into housing market level and estimate the market led housing requirement, percentage increases and splits from the up dated housing needs
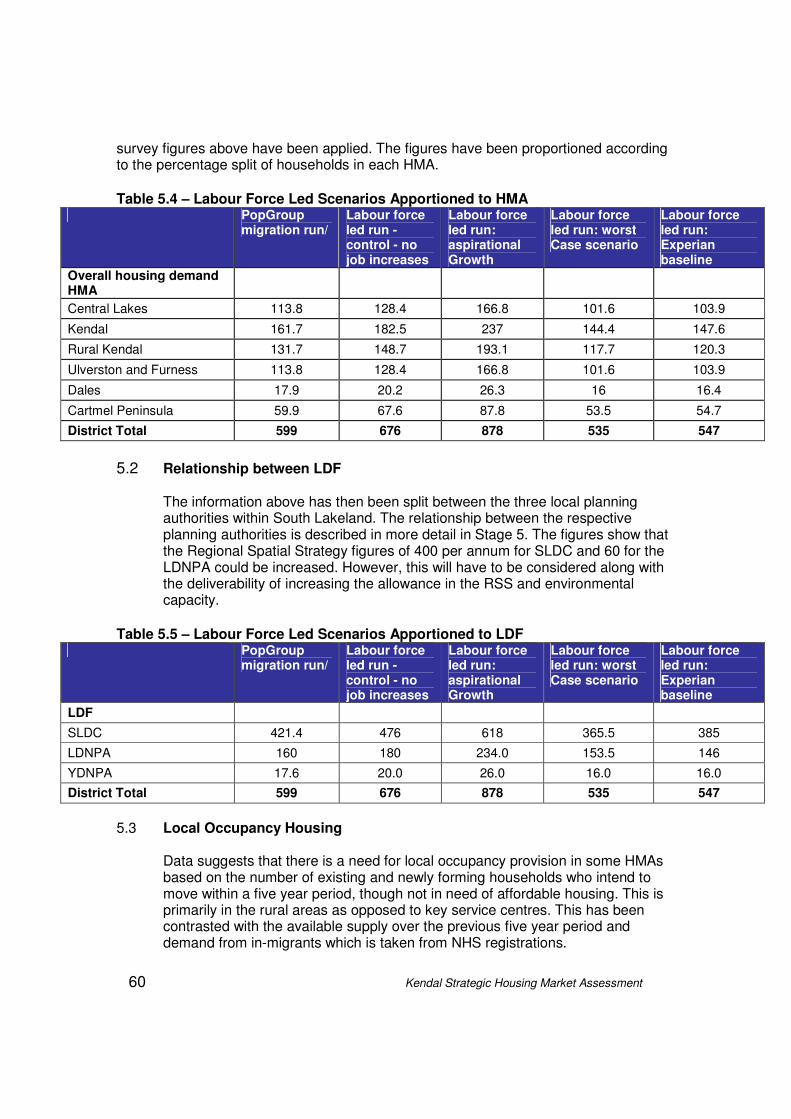
60 Kendal Strategic Housing Market Assessment
survey figures above have been applied. The figures have been proportioned according to the percentage split of households in each HMA.
Table 5.4 – Labour Force Led Scenarios Apportioned to HMA
PopGroup migration run/
Labour force led run - control - no job increases
Labour force led run: aspirational Growth
Labour force led run: worst Case scenario
Labour force led run: Experian baseline
Overall housing demand HMA
Central Lakes 113.8 128.4 166.8 101.6 103.9
Kendal 161.7 182.5 237 144.4 147.6
Rural Kendal 131.7 148.7 193.1 117.7 120.3
Ulverston and Furness 113.8 128.4 166.8 101.6 103.9
Dales 17.9 20.2 26.3 16 16.4
Cartmel Peninsula 59.9 67.6 87.8 53.5 54.7
District Total 599 676 878 535 547
5.2 Relationship between LDF
The information above has then been split between the three local planning authorities within South Lakeland. The relationship between the respective planning authorities is described in more detail in Stage 5. The figures show that the Regional Spatial Strategy figures of 400 per annum for SLDC and 60 for the LDNPA could be increased. However, this will have to be considered along with the deliverability of increasing the allowance in the RSS and environmental capacity.
Table 5.5 – Labour Force Led Scenarios Apportioned to LDF
PopGroup migration run/
Labour force led run - control - no job increases
Labour force led run: aspirational Growth
Labour force led run: worst Case scenario
Labour force led run: Experian baseline
LDF
SLDC 421.4 476 618 365.5 385
LDNPA 160 180 234.0 153.5 146
YDNPA 17.6 20.0 26.0 16.0 16.0
District Total 599 676 878 535 547
5.3 Local Occupancy Housing
Data suggests that there is a need for local occupancy provision in some HMAs based on the number of existing and newly forming households who intend to move within a five year period, though not in need of affordable housing. This is primarily in the rural areas as opposed to key service centres. This has been contrasted with the available supply over the previous five year period and demand from in-migrants which is taken from NHS registrations.
61 Kendal Strategic Housing Market Assessment
In particular localities demand from generally affluent in-migrants limits the availability of housing and drives prices upwards. As can be seen in the Dales HMA Section 3, there is a significant ‘affluent grey’ population and in-migration from areas such as Manchester evidenced by CACI data and the District Wide Housing Needs Survey 2006. Available supply is further restricted by the instances of second homes and holiday homes outlined in Chapter 3. Table 5.6a outlines those people who have moved away from the District due to being unable to find suitable accommodation. The evidence detailed below does not support local occupancy housing in Kendal, however, this should be reviewed when the next District Wide Housing Needs Survey is undertaken in 2010-11. Table 5.6 details shortfall and/or surplus in each HMA including information on Key Service Centres. The figures are over a 5 year period. Detailed below is an explanation relating to each line of Table 5.6:-
• Total in-migrant demand – this relates to in-migrant data from NHS registrations over the period from July 2000 – June 2004.
• Total existing household demand – this information has been extracted from the 2006 District wide Needs Survey. Section 4 of the household survey asks households’ intentions to move within the next 5 years from 2006. This data does not include those people who are unsuitably housed, an element of which would need affordable housing
• Total newly forming household demand – this information has been extracted from the 2006 District wide Needs Survey. Section 4 of the household survey asks if any members of the household wish to move to separate accommodation within a 5 year period from 2006. This data does not include affordable housing need
• Total demand from households unsuitably housed – this information relates to Table 5.1 showing those households who are deemed unsuitably housed but excluding those households in need of affordable housing, i.e. the unsuitably housed that can afford open market solutions. The unsuitably housed includes households who are homeless or threatened with homelessness, overcrowded, too expensive, difficult to maintain, households sharing facilities, mobility impairment/special need, lacking a bathroom/kitchen/wc, major disrepair, harassment/threat of harassment. This covers the 5 year period from 2006
• Total demand – is a sum of the four previous columns
• Total supply – this data relates to those households from the District Wide Housing Needs Survey who moved within the 5 year period to February 2006. Section 3 of the household survey asks households if they moved in the last 5 years.
• Minus demand – reiterates the total demand figure
• Shortfall/surplus – the resultant sum taking the demand figure away from the supply figure
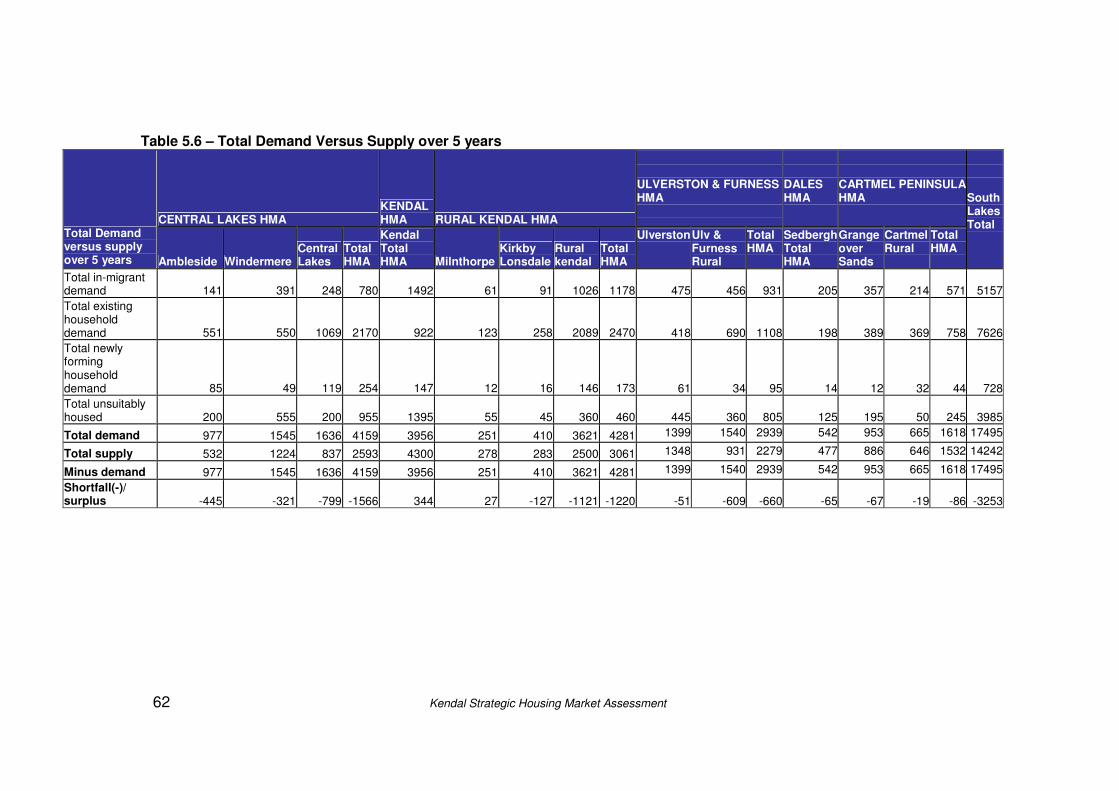
62 Kendal Strategic Housing Market Assessment
Table 5.6 – Total Demand Versus Supply over 5 years
CENTRAL LAKES HMA KENDAL HMA RURAL KENDAL HMA
ULVERSTON & FURNESS HMA
DALES HMA
CARTMEL PENINSULA HMA
Total Demand versus supply over 5 years Ambleside Windermere
Central Lakes
Total HMA
Kendal Total HMA Milnthorpe
Kirkby Lonsdale
Rural kendal
Total HMA
Ulverston Ulv & Furness Rural
Total HMA
Sedbergh Total HMA
Grange over Sands
Cartmel Rural
Total HMA
South Lakes Total
Total in-migrant demand 141 391 248 780 1492 61 91 1026 1178 475 456
931 205 357
214 571 5157
Total existing household demand 551 550 1069 2170 922 123 258 2089 2470 418 690
1108 198 389
369 758 7626
Total newly forming household demand 85 49 119 254 147 12 16 146 173 61 34
95 14 12
32 44 728
Total unsuitably housed 200 555 200 955 1395 55 45 360 460 445 360
805 125 195
50 245 3985
Total demand 977 1545 1636 4159 3956 251 410 3621 4281 1399 1540 2939 542 953 665 1618 17495
Total supply 532 1224 837 2593 4300 278 283 2500 3061 1348 931 2279 477 886 646 1532 14242
Minus demand 977 1545 1636 4159 3956 251 410 3621 4281 1399 1540 2939 542 953 665 1618 17495
Shortfall(-)/ surplus -445 -321 -799 -1566 344 27 -127 -1121 -1220 -51 -609
-660 -65 -67
-19 -86 -3253
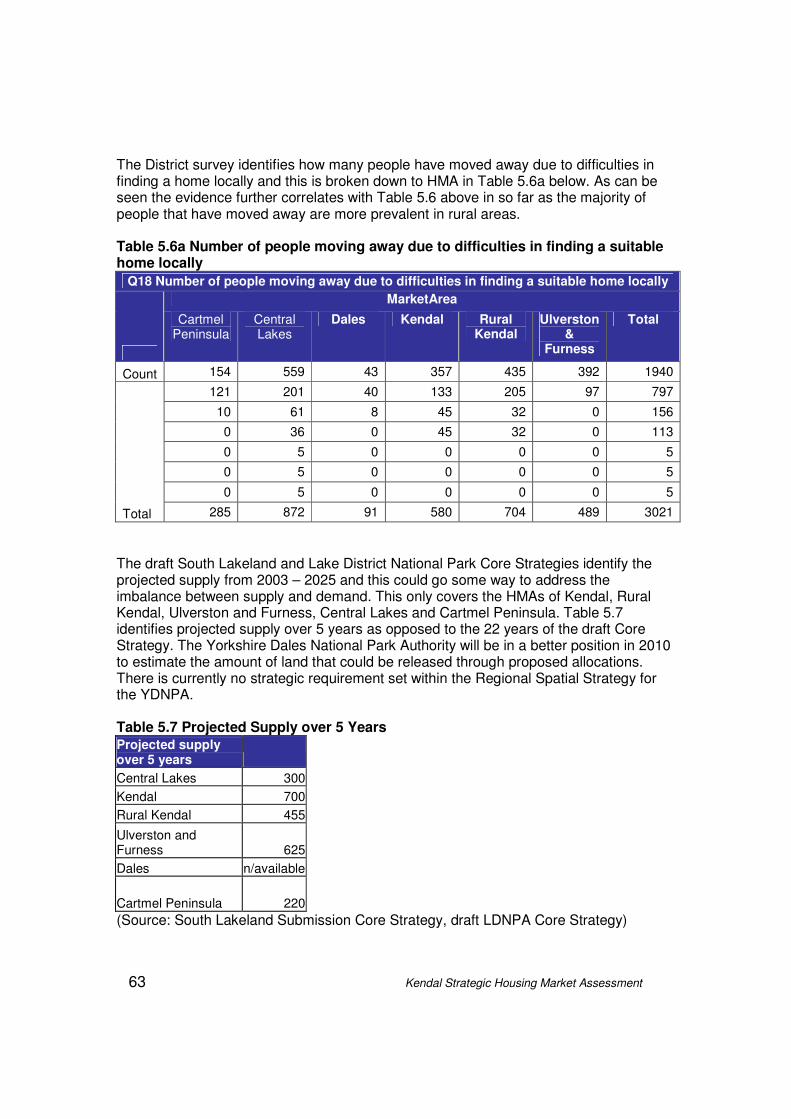
63 Kendal Strategic Housing Market Assessment
The District survey identifies how many people have moved away due to difficulties in finding a home locally and this is broken down to HMA in Table 5.6a below. As can be seen the evidence further correlates with Table 5.6 above in so far as the majority of people that have moved away are more prevalent in rural areas. Table 5.6a Number of people moving away due to difficulties in finding a suitable home locally
Q18 Number of people moving away due to difficulties in finding a suitable home locally
MarketArea
Cartmel Peninsula
Central Lakes
Dales Kendal Rural Kendal
Ulverston &
Furness
Total
Count 154 559 43 357 435 392 1940
121 201 40 133 205 97 797
10 61 8 45 32 0 156
0 36 0 45 32 0 113
0 5 0 0 0 0 5
0 5 0 0 0 0 5
0 5 0 0 0 0 5
Total 285 872 91 580 704 489 3021
The draft South Lakeland and Lake District National Park Core Strategies identify the projected supply from 2003 – 2025 and this could go some way to address the imbalance between supply and demand. This only covers the HMAs of Kendal, Rural Kendal, Ulverston and Furness, Central Lakes and Cartmel Peninsula. Table 5.7 identifies projected supply over 5 years as opposed to the 22 years of the draft Core Strategy. The Yorkshire Dales National Park Authority will be in a better position in 2010 to estimate the amount of land that could be released through proposed allocations. There is currently no strategic requirement set within the Regional Spatial Strategy for the YDNPA. Table 5.7 Projected Supply over 5 Years Projected supply over 5 years
Central Lakes 300
Kendal 700
Rural Kendal 455
Ulverston and Furness 625
Dales n/available
Cartmel Peninsula 220
(Source: South Lakeland Submission Core Strategy, draft LDNPA Core Strategy)
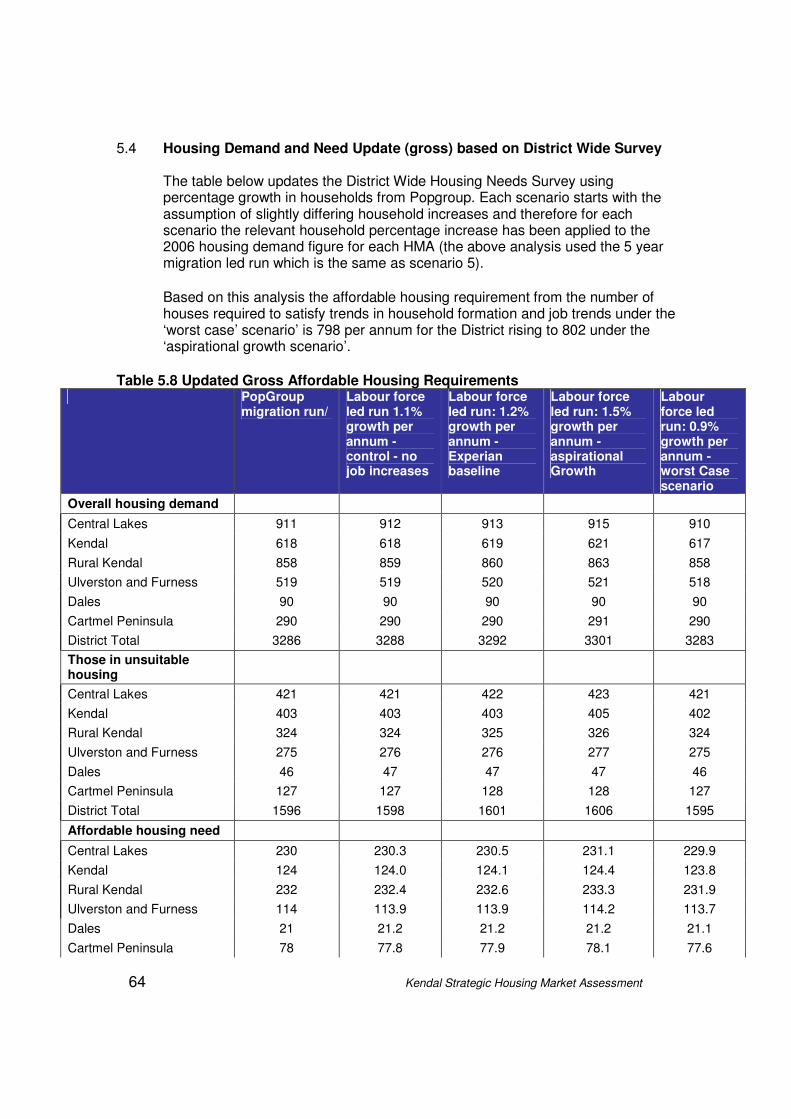
64 Kendal Strategic Housing Market Assessment
5.4 Housing Demand and Need Update (gross) based on District Wide Survey
The table below updates the District Wide Housing Needs Survey using percentage growth in households from Popgroup. Each scenario starts with the assumption of slightly differing household increases and therefore for each scenario the relevant household percentage increase has been applied to the 2006 housing demand figure for each HMA (the above analysis used the 5 year migration led run which is the same as scenario 5).
Based on this analysis the affordable housing requirement from the number of houses required to satisfy trends in household formation and job trends under the ‘worst case’ scenario’ is 798 per annum for the District rising to 802 under the ‘aspirational growth scenario’.
Table 5.8 Updated Gross Affordable Housing Requirements
PopGroup migration run/
Labour force led run 1.1% growth per annum - control - no job increases
Labour force led run: 1.2% growth per annum -Experian baseline
Labour force led run: 1.5% growth per annum - aspirational Growth
Labour force led run: 0.9% growth per annum - worst Case scenario
Overall housing demand
Central Lakes 911 912 913 915 910
Kendal 618 618 619 621 617
Rural Kendal 858 859 860 863 858
Ulverston and Furness 519 519 520 521 518
Dales 90 90 90 90 90
Cartmel Peninsula 290 290 290 291 290
District Total 3286 3288 3292 3301 3283
Those in unsuitable housing
Central Lakes 421 421 422 423 421
Kendal 403 403 403 405 402
Rural Kendal 324 324 325 326 324
Ulverston and Furness 275 276 276 277 275
Dales 46 47 47 47 46
Cartmel Peninsula 127 127 128 128 127
District Total 1596 1598 1601 1606 1595
Affordable housing need
Central Lakes 230 230.3 230.5 231.1 229.9
Kendal 124 124.0 124.1 124.4 123.8
Rural Kendal 232 232.4 232.6 233.3 231.9
Ulverston and Furness 114 113.9 113.9 114.2 113.7
Dales 21 21.2 21.2 21.2 21.1
Cartmel Peninsula 78 77.8 77.9 78.1 77.6
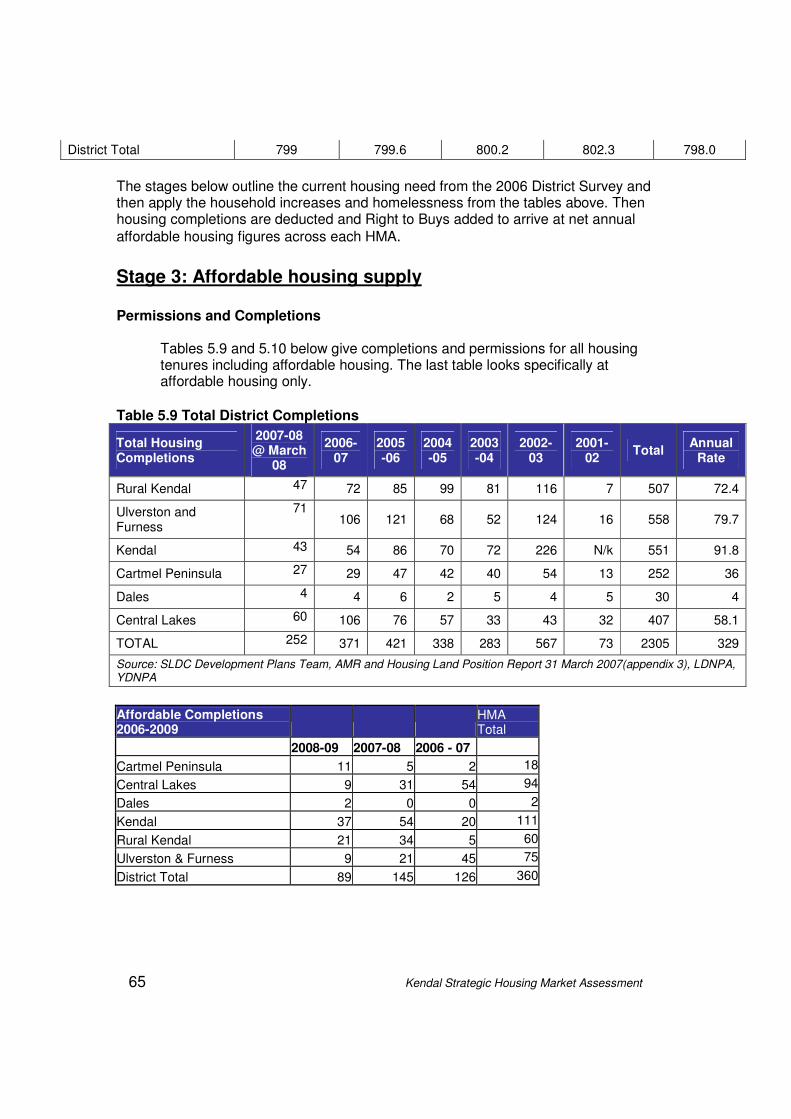
65 Kendal Strategic Housing Market Assessment
District Total 799 799.6 800.2 802.3 798.0
The stages below outline the current housing need from the 2006 District Survey and then apply the household increases and homelessness from the tables above. Then housing completions are deducted and Right to Buys added to arrive at net annual
affordable housing figures across each HMA.
Stage 3: Affordable housing supply Permissions and Completions
Tables 5.9 and 5.10 below give completions and permissions for all housing tenures including affordable housing. The last table looks specifically at affordable housing only.
Table 5.9 Total District Completions
Total Housing Completions
2007-08 @ March
08
2006-07
2005-06
2004-05
2003-04
2002-03
2001-02
Total Annual
Rate
Rural Kendal 47 72 85 99 81 116 7 507 72.4
Ulverston and Furness
71 106 121 68 52 124 16 558 79.7
Kendal 43 54 86 70 72 226 N/k 551 91.8
Cartmel Peninsula 27 29 47 42 40 54 13 252 36
Dales 4 4 6 2 5 4 5 30 4
Central Lakes 60 106 76 57 33 43 32 407 58.1
TOTAL 252 371 421 338 283 567 73 2305 329
Source: SLDC Development Plans Team, AMR and Housing Land Position Report 31 March 2007(appendix 3), LDNPA, YDNPA
Affordable Completions 2006-2009
HMA Total
2008-09 2007-08 2006 - 07
Cartmel Peninsula 11 5 2 18
Central Lakes 9 31 54 94
Dales 2 0 0 2
Kendal 37 54 20 111
Rural Kendal 21 34 5 60
Ulverston & Furness 9 21 45 75
District Total 89 145 126 360
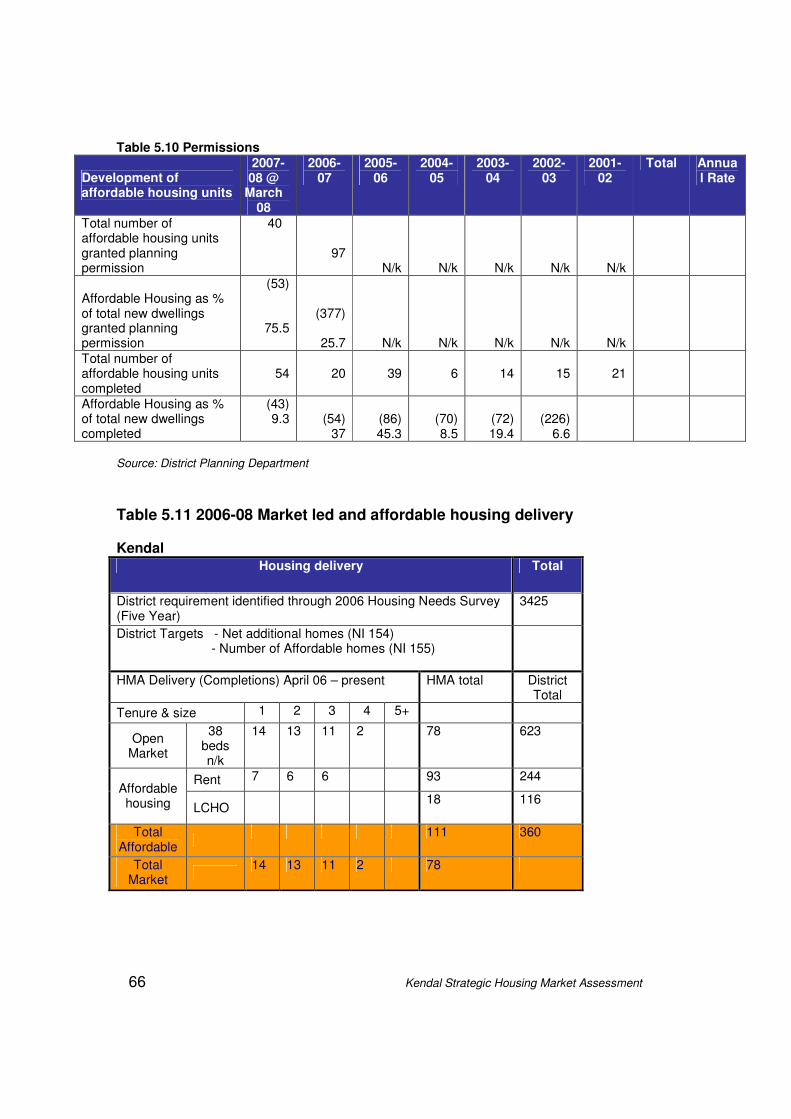
66 Kendal Strategic Housing Market Assessment
Table 5.10 Permissions
Development of affordable housing units
2007-08 @
March 08
2006-07
2005-06
2004-05
2003-04
2002-03
2001-02
Total Annual Rate
Total number of affordable housing units granted planning permission
40
97 N/k N/k N/k N/k N/k
Affordable Housing as % of total new dwellings granted planning permission
(53)
75.5
(377)
25.7 N/k N/k N/k N/k N/k
Total number of affordable housing units completed
54 20
39
6
14
15
21
Affordable Housing as % of total new dwellings completed
(43) 9.3 (54)
37 (86) 45.3
(70) 8.5
(72) 19.4
(226) 6.6
Source: District Planning Department
Table 5.11 2006-08 Market led and affordable housing delivery Kendal
Housing delivery Total
District requirement identified through 2006 Housing Needs Survey (Five Year)
3425
District Targets - Net additional homes (NI 154) - Number of Affordable homes (NI 155)
HMA Delivery (Completions) April 06 – present HMA total District Total
Tenure & size 1 2 3 4 5+
Open Market
38 beds n/k
14 13 11 2 78 623
Rent 7 6 6 93 244 Affordable housing LCHO
18 116
Total Affordable
111 360
Total Market
14 13 11 2 78
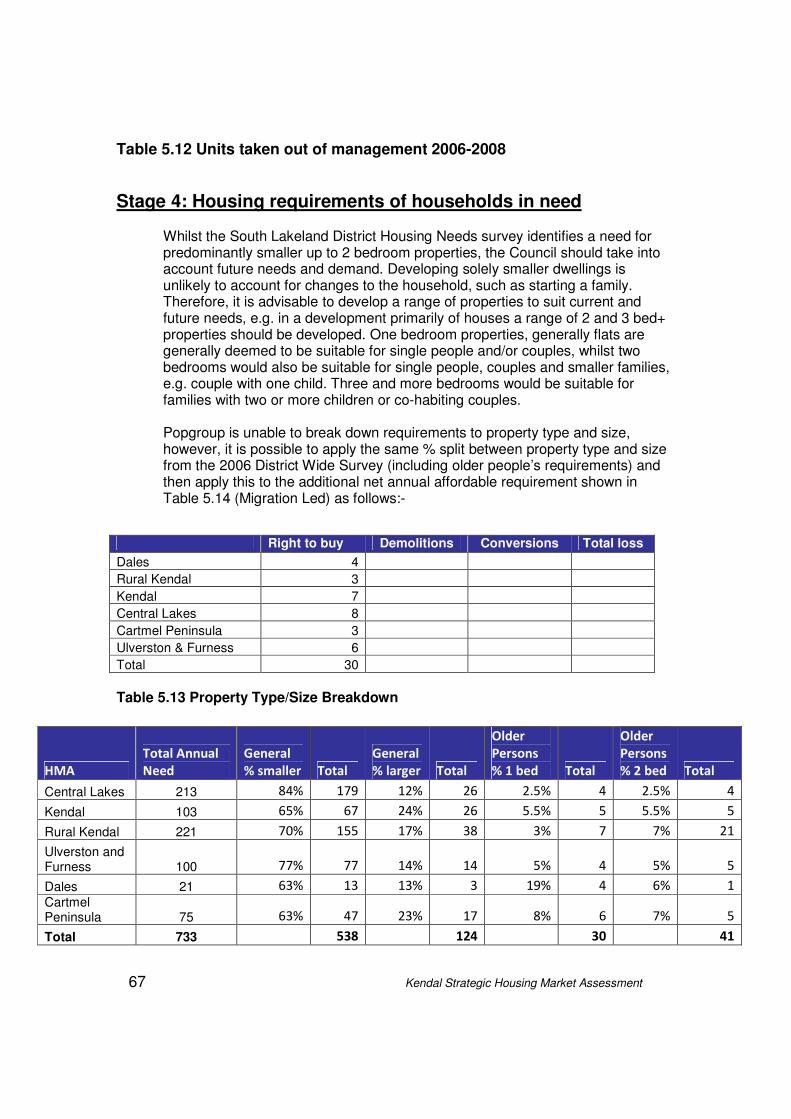
67 Kendal Strategic Housing Market Assessment
Table 5.12 Units taken out of management 2006-2008
Stage 4: Housing requirements of households in need
Whilst the South Lakeland District Housing Needs survey identifies a need for predominantly smaller up to 2 bedroom properties, the Council should take into account future needs and demand. Developing solely smaller dwellings is unlikely to account for changes to the household, such as starting a family. Therefore, it is advisable to develop a range of properties to suit current and future needs, e.g. in a development primarily of houses a range of 2 and 3 bed+ properties should be developed. One bedroom properties, generally flats are generally deemed to be suitable for single people and/or couples, whilst two bedrooms would also be suitable for single people, couples and smaller families, e.g. couple with one child. Three and more bedrooms would be suitable for families with two or more children or co-habiting couples.
Popgroup is unable to break down requirements to property type and size, however, it is possible to apply the same % split between property type and size from the 2006 District Wide Survey (including older people’s requirements) and then apply this to the additional net annual affordable requirement shown in Table 5.14 (Migration Led) as follows:-
Table 5.13 Property Type/Size Breakdown
HMA
Total Annual
Need
General
% smaller Total
General
% larger Total
Older
Persons
% 1 bed Total
Older
Persons
% 2 bed Total
Central Lakes 213 84% 179 12% 26 2.5% 4 2.5% 4
Kendal 103 65% 67 24% 26 5.5% 5 5.5% 5
Rural Kendal 221 70% 155 17% 38 3% 7 7% 21
Ulverston and Furness 100 77% 77 14% 14 5% 4 5% 5
Dales 21 63% 13 13% 3 19% 4 6% 1
Cartmel Peninsula 75 63% 47 23% 17 8% 6 7% 5
Total 733 538 124 30 41
Right to buy Demolitions Conversions Total loss
Dales 4
Rural Kendal 3
Kendal 7
Central Lakes 8
Cartmel Peninsula 3
Ulverston & Furness 6
Total 30
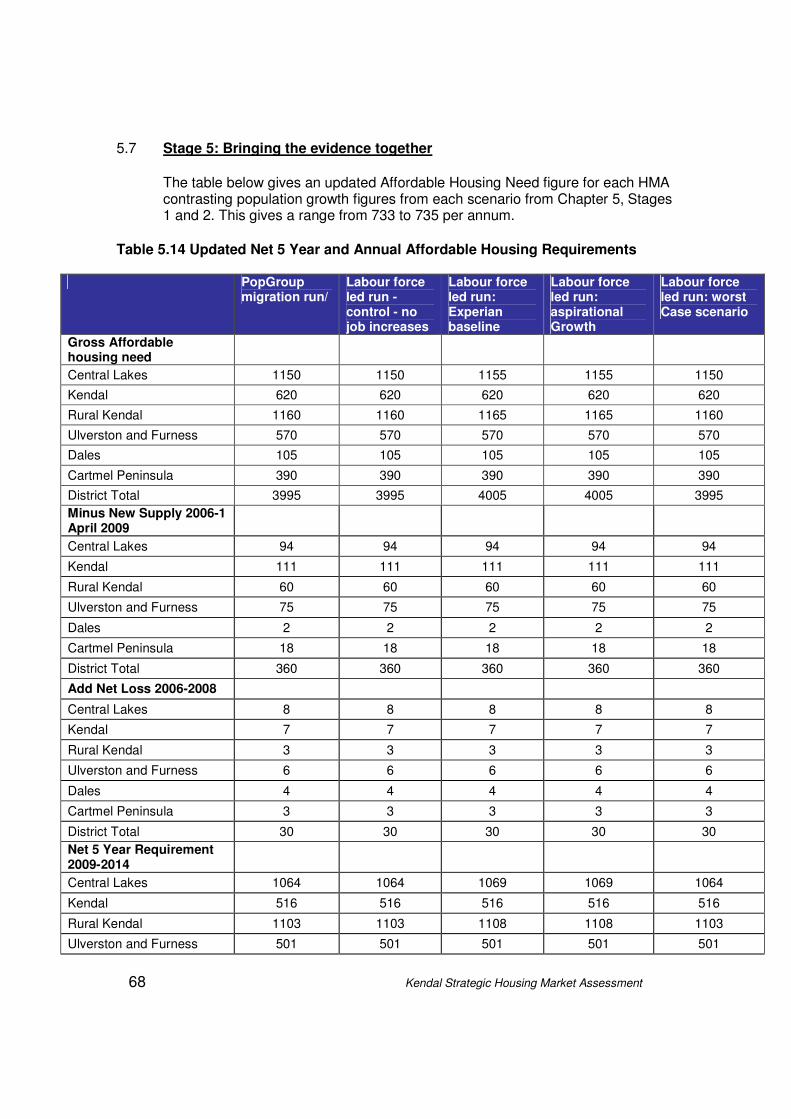
68 Kendal Strategic Housing Market Assessment
5.7 Stage 5: Bringing the evidence together
The table below gives an updated Affordable Housing Need figure for each HMA contrasting population growth figures from each scenario from Chapter 5, Stages 1 and 2. This gives a range from 733 to 735 per annum.
Table 5.14 Updated Net 5 Year and Annual Affordable Housing Requirements
PopGroup migration run/
Labour force led run - control - no job increases
Labour force led run: Experian baseline
Labour force led run: aspirational Growth
Labour force led run: worst Case scenario
Gross Affordable housing need
Central Lakes 1150 1150 1155 1155 1150
Kendal 620 620 620 620 620
Rural Kendal 1160 1160 1165 1165 1160
Ulverston and Furness 570 570 570 570 570
Dales 105 105 105 105 105
Cartmel Peninsula 390 390 390 390 390
District Total 3995 3995 4005 4005 3995
Minus New Supply 2006-1 April 2009
Central Lakes 94 94 94 94 94
Kendal 111 111 111 111 111
Rural Kendal 60 60 60 60 60
Ulverston and Furness 75 75 75 75 75
Dales 2 2 2 2 2
Cartmel Peninsula 18 18 18 18 18
District Total 360 360 360 360 360
Add Net Loss 2006-2008
Central Lakes 8 8 8 8 8
Kendal 7 7 7 7 7
Rural Kendal 3 3 3 3 3
Ulverston and Furness 6 6 6 6 6
Dales 4 4 4 4 4
Cartmel Peninsula 3 3 3 3 3
District Total 30 30 30 30 30
Net 5 Year Requirement 2009-2014
Central Lakes 1064 1064 1069 1069 1064
Kendal 516 516 516 516 516
Rural Kendal 1103 1103 1108 1108 1103
Ulverston and Furness 501 501 501 501 501

69 Kendal Strategic Housing Market Assessment
Dales 107 107 107 107 107
Cartmel Peninsula 375 375 375 375 375
District Total 3665 3665 3675 3675 3665
Net Annual Requirement 2009-2014
Central Lakes 213 213 214 214 213
Kendal 103 103 103 103 103
Rural Kendal 221 221 222 222 221
Ulverston and Furness 100 100 100 100 100
Dales 21 21 21 21 21
Cartmel Peninsula 75 75 75 75 75
District Total 733 733 735 735 733
It should be noted that should supply increase the figures will change and therefore the figures should be reviewed regularly as recommended in Government Guidance. A revised District wide Needs Survey is due to be undertaken in 2010-11 which will further update the figures projecting the need over a 5 year period. As we are in the midst of economic downturn the aspirational scenario is unlikely to occur in the short to medium term. Therefore, the tables below take the migration led scenario figures which mirror two of the labour led affordable housing figures and further analysis is carried out to identify the split between Local Development Framework and tenure.
5.7.1 Relationship with Local Development Framework
Table 5.15 below shows the relationship between each HMA and respective planning authority. This has then be used to proportion the net annual affordable housing need figures between planning authorities shown in Table 5.16.
Table 5.15 Proportionate Split between LDF
SLDC LDNPA YDNPA
Rural Kendal 84.4 15.6 0
Ulverston & Furness
91.7 8.3 0
Dales 1.4 0 98.6
Central Lakes 0 100 0
Cartmel Peninsula 74.1 25.9 0
Kendal 100 0 0
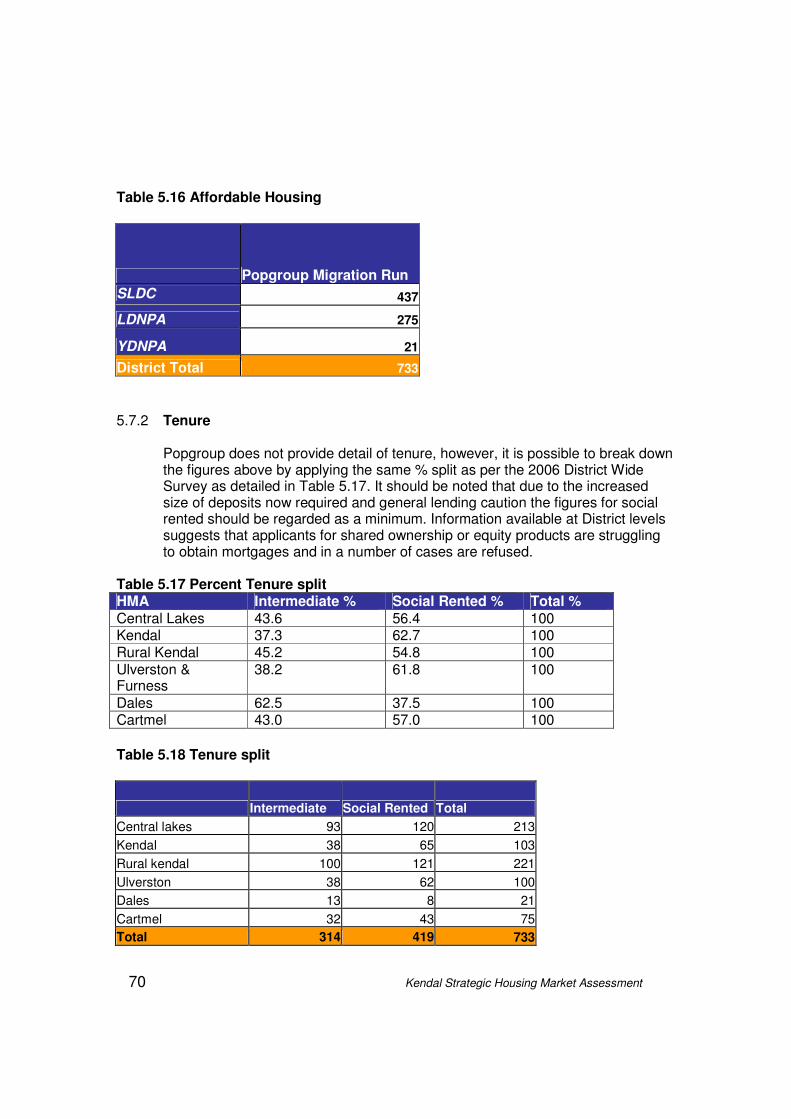
70 Kendal Strategic Housing Market Assessment
Table 5.16 Affordable Housing
Popgroup Migration Run
SLDC 437
LDNPA 275
YDNPA 21
District Total 733
5.7.2 Tenure
Popgroup does not provide detail of tenure, however, it is possible to break down the figures above by applying the same % split as per the 2006 District Wide Survey as detailed in Table 5.17. It should be noted that due to the increased size of deposits now required and general lending caution the figures for social rented should be regarded as a minimum. Information available at District levels suggests that applicants for shared ownership or equity products are struggling to obtain mortgages and in a number of cases are refused.
Table 5.17 Percent Tenure split HMA Intermediate % Social Rented % Total %
Central Lakes 43.6 56.4 100 Kendal 37.3 62.7 100 Rural Kendal 45.2 54.8 100 Ulverston & Furness
38.2 61.8 100
Dales 62.5 37.5 100 Cartmel 43.0 57.0 100
Table 5.18 Tenure split
Intermediate Social Rented Total
Central lakes 93 120 213
Kendal 38 65 103
Rural kendal 100 121 221
Ulverston 38 62 100
Dales 13 8 21
Cartmel 32 43 75
Total 314 419 733
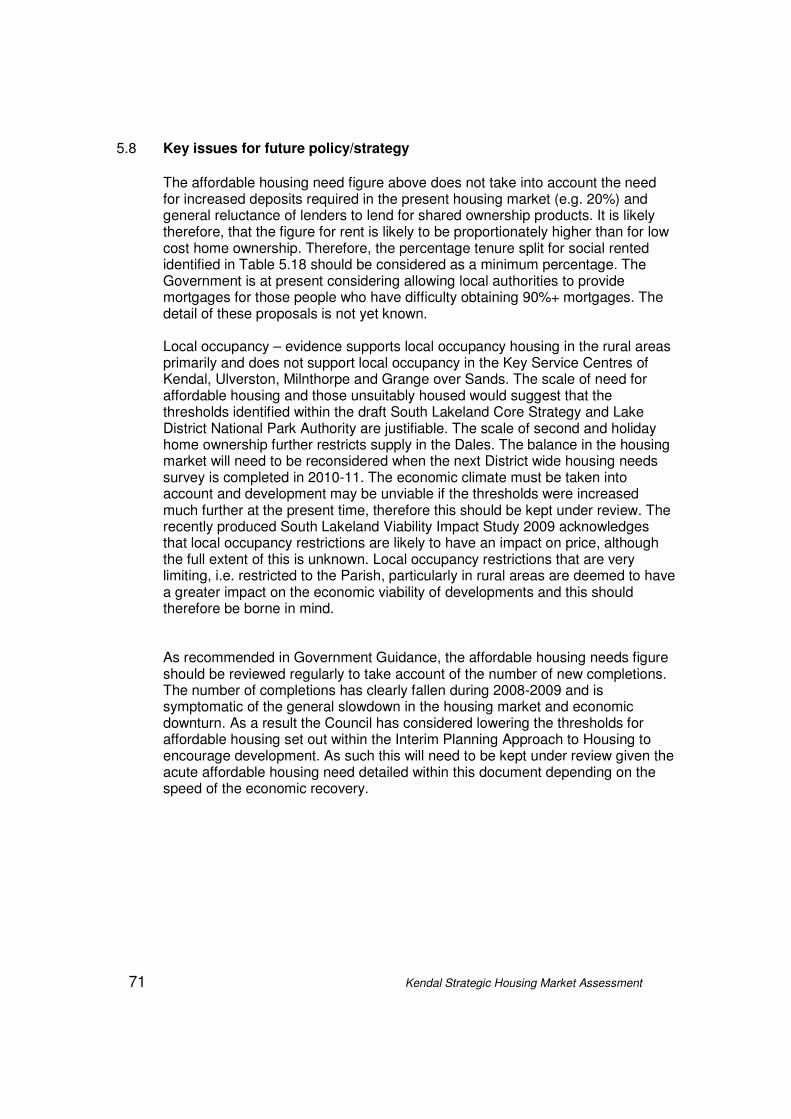
71 Kendal Strategic Housing Market Assessment
5.8 Key issues for future policy/strategy
The affordable housing need figure above does not take into account the need for increased deposits required in the present housing market (e.g. 20%) and general reluctance of lenders to lend for shared ownership products. It is likely therefore, that the figure for rent is likely to be proportionately higher than for low cost home ownership. Therefore, the percentage tenure split for social rented identified in Table 5.18 should be considered as a minimum percentage. The Government is at present considering allowing local authorities to provide mortgages for those people who have difficulty obtaining 90%+ mortgages. The detail of these proposals is not yet known.
Local occupancy – evidence supports local occupancy housing in the rural areas primarily and does not support local occupancy in the Key Service Centres of Kendal, Ulverston, Milnthorpe and Grange over Sands. The scale of need for affordable housing and those unsuitably housed would suggest that the thresholds identified within the draft South Lakeland Core Strategy and Lake District National Park Authority are justifiable. The scale of second and holiday home ownership further restricts supply in the Dales. The balance in the housing market will need to be reconsidered when the next District wide housing needs survey is completed in 2010-11. The economic climate must be taken into account and development may be unviable if the thresholds were increased much further at the present time, therefore this should be kept under review. The recently produced South Lakeland Viability Impact Study 2009 acknowledges that local occupancy restrictions are likely to have an impact on price, although the full extent of this is unknown. Local occupancy restrictions that are very limiting, i.e. restricted to the Parish, particularly in rural areas are deemed to have a greater impact on the economic viability of developments and this should therefore be borne in mind. As recommended in Government Guidance, the affordable housing needs figure should be reviewed regularly to take account of the number of new completions. The number of completions has clearly fallen during 2008-2009 and is symptomatic of the general slowdown in the housing market and economic downturn. As a result the Council has considered lowering the thresholds for affordable housing set out within the Interim Planning Approach to Housing to encourage development. As such this will need to be kept under review given the acute affordable housing need detailed within this document depending on the speed of the economic recovery.
72 Kendal Strategic Housing Market Assessment
6. Housing Requirements of Specific Household Groups 6.1 Homelessness
Table 6.1 Homeless Presentations and Acceptances
Homeless Cases Presentations Acceptances
2006-07
January - March 63 26
April - June 68 27
July - September 84 34
October - December 46 29
Total 261 116
2007-08
January - March 89 32
April - June 76 39
July - September 77 35
October - December 46 29
Total 288 135
2008-09
January – March 51 25
April – June 46 20
July – September 28 16
October – December 34 11
Total 159 72 (Source: District Council.
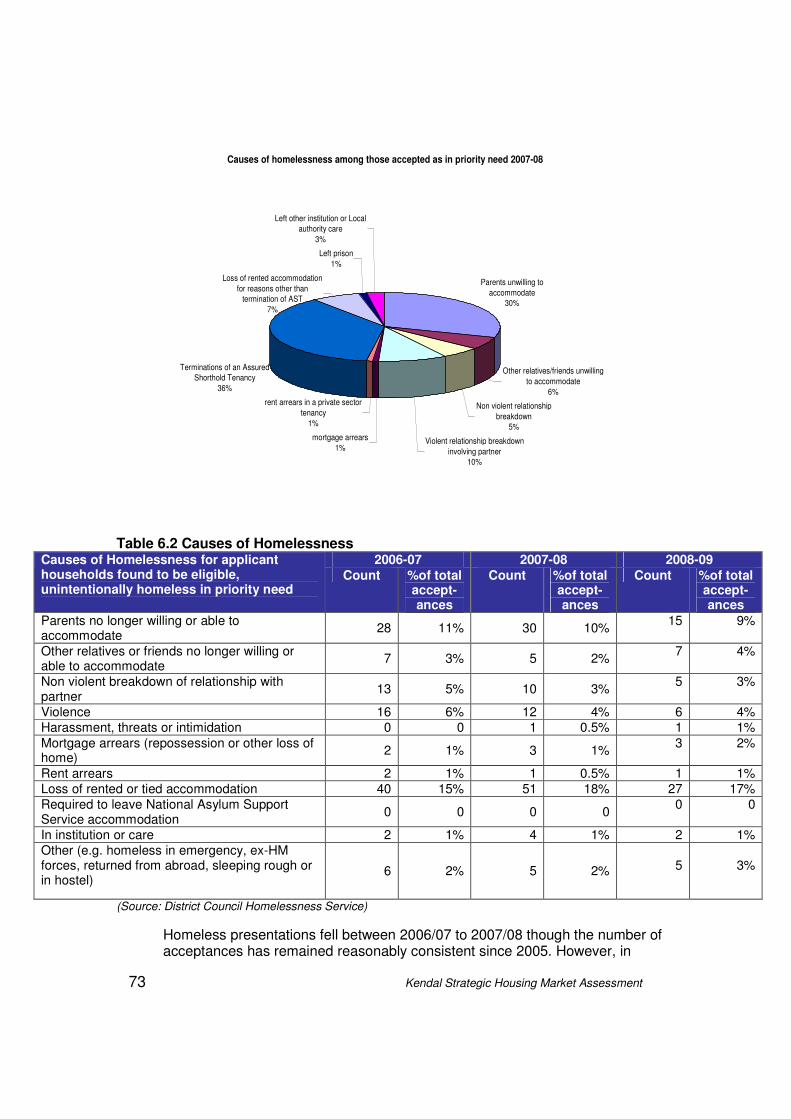
73 Kendal Strategic Housing Market Assessment
Causes of homelessness among those accepted as in priority need 2007-08
Parents unwilling to
accommodate
30%
Other relatives/friends unwilling
to accommodate
6%
Non violent relationship
breakdown
5%
Violent relationship breakdown
involving partner
10%
mortgage arrears
1%
rent arrears in a private sector
tenancy
1%
Terminations of an Assured
Shorthold Tenancy
36%
Loss of rented accommodation
for reasons other than
termination of AST
7%
Left prison
1%
Left other institution or Local
authority care
3%
Table 6.2 Causes of Homelessness
2006-07 2007-08 2008-09 Causes of Homelessness for applicant households found to be eligible, unintentionally homeless in priority need
Count %of total accept-ances
Count %of total accept-ances
Count %of total accept-ances
Parents no longer willing or able to accommodate
28 11% 30 10% 15 9%
Other relatives or friends no longer willing or able to accommodate
7 3% 5 2% 7 4%
Non violent breakdown of relationship with partner
13 5% 10 3% 5 3%
Violence 16 6% 12 4% 6 4%
Harassment, threats or intimidation 0 0 1 0.5% 1 1%
Mortgage arrears (repossession or other loss of home)
2 1% 3 1% 3 2%
Rent arrears 2 1% 1 0.5% 1 1%
Loss of rented or tied accommodation 40 15% 51 18% 27 17%
Required to leave National Asylum Support Service accommodation
0 0 0 0 0 0
In institution or care 2 1% 4 1% 2 1%
Other (e.g. homeless in emergency, ex-HM forces, returned from abroad, sleeping rough or in hostel)
6 2% 5 2%
5
3%
(Source: District Council Homelessness Service)
Homeless presentations fell between 2006/07 to 2007/08 though the number of acceptances has remained reasonably consistent since 2005. However, in
74 Kendal Strategic Housing Market Assessment
2008/09 homeless presentations show a significant decrease. This is primarily due to the emphasis being placed on preventing homeless. Consequently the number of people in housing difficulties receiving advice and assistance has risen dramatically and the figures do not reflect an absence of homelessness, rather a change in how cases are dealt with. The Council’s Housing Register has shown a steady rise in applicants reflecting the lack of affordable housing available and number in housing need.
The predominant reason for becoming homeless is the loss of an assured shorthold tenancy, followed by parents unwilling to accommodate. The Council’s Homeless Strategy aims to work with the private sector with a view to reducing homelessness as a result of loss of an assured shorthold tenancy.
6.2 Families, older people, minority and hard to reach households and
households with specific needs
This section identifies specific needs of a range of different households, including supported housing, migrant workers and other minority groups.
6.2.1 Older People
The degree of aging and projected growth in the older age groups has significant implications for housing services and support. The District Wide survey identified that most older people (80.5%) prefer to live independently and stay in their own homes, however, sometimes they lack the support to be able to do so successfully. A proportion of older people would consider options such as sheltered housing (20.9%) or buying a property in a specific development for older people (19.9%). A proportion (7.9%) would also consider extra care housing. The Council’s Older Persons’ Housing Strategy details the priorities for older people in terms of helping people to live independently and development of extra care housing. Issues around older in-migrants who are fit and healthy now but lack the support of family networks should their health deteriorate also needs consideration by Adult Social Care, Support People and the District in the development of services such as floating/visiting support. Most new developments have elements of the Lifetime Homes standard so that people can remain in their own homes but the extent to which a property can be adapted if a person becomes disabled remains an issue for new and existing homes. Most older people are forced to downsize if they wish to move a scheme that is specifically designed for older people, however, older people’s wishes borne out in national and local consultation work are for more two bedroom accommodation with a bit more space and storage. Given the higher proportion of homes owned outright in the District as a whole it is possible people will be able to afford additional space but discussions with housing providers should begin to explore options perhaps including equity release.
75 Kendal Strategic Housing Market Assessment
6.2.2 Migrant Workers
Cumbria Constabulary undertook a Social/Demographic Trend Analysis of the EU Immigrant Population in Cumbria 2003-2007. It is acknowledged that the availability of statistics on immigration is limited and generally relates to new migrants rather than existing migrants who may have relocated since first registering. The statistics available highlighted the following trends:
• There has been no change in the Cumbrian population with regards to pre 2004 EU member nationalities, but there has been a large increase in the number of post 2004 EU members in Cumbria; increasing eightfold between 2003/04 and 2004/05 and resulting in approximately 4500 Eastern Europeans arriving in Cumbria over the last 5 years, 3000 of whom were Polish.
• Based on the last 5 years data, the number of new Eastern Europeans arriving in Cumbria will reach over 3500 in 3 years time. However, the last 2 years has shown a steadying in the rate of new Eastern European arrivals, suggesting there will be 2000 new arrivals in 3 years time. Future. Analysis will be required to monitor this.
• South Lakeland has had the highest influx of Eastern Europeans in Cumbria. The migrants are employed primarily in short term tourism employment, suggesting that South Lakes Eastern European population is on a short term, transient basis.
• Carlisle is where the majority of Eastern Europeans in Cumbria are likely to settle on a long term basis, but only half of them are likely to work in the district, with the others commuting to work in neighbouring districts.
• Copeland and Barrow have the lowest numbers of Eastern Europeans residing or working there, due to limited job opportunities. If employment increases, these areas could see a large influx of migrant workers.
• Poles are the largest Eastern European group in Cumbria. They reside all over the county, but the largest Polish communities are in South Lakeland and Carlisle.
• Lithuanians mainly reside and work in factories in Allerdale, especially Maryport.
• Romanians are located in South Lakeland, but they only joined the EU in 2007, so it is difficult to tell if South Lakes will remain the only part of Cumbria where Romanians go to, or if a larger geographical spread will occur as time goes on. The arrival and movement of Romanians will have to be monitored over time.
• Influences upon immigration previously centred on family grounds, whereas the main influence upon Eastern European immigrants is now employment. Therefore any future change in employment opportunities in Cumbria is likely to impact on the constitution and location of our migrant population.
• Limited data suggests that summer sees an increase in Eastern Europeans coming to Cumbria in the summer and being employed in the tourism sector. This deduction will have to be tested further when more data is available.
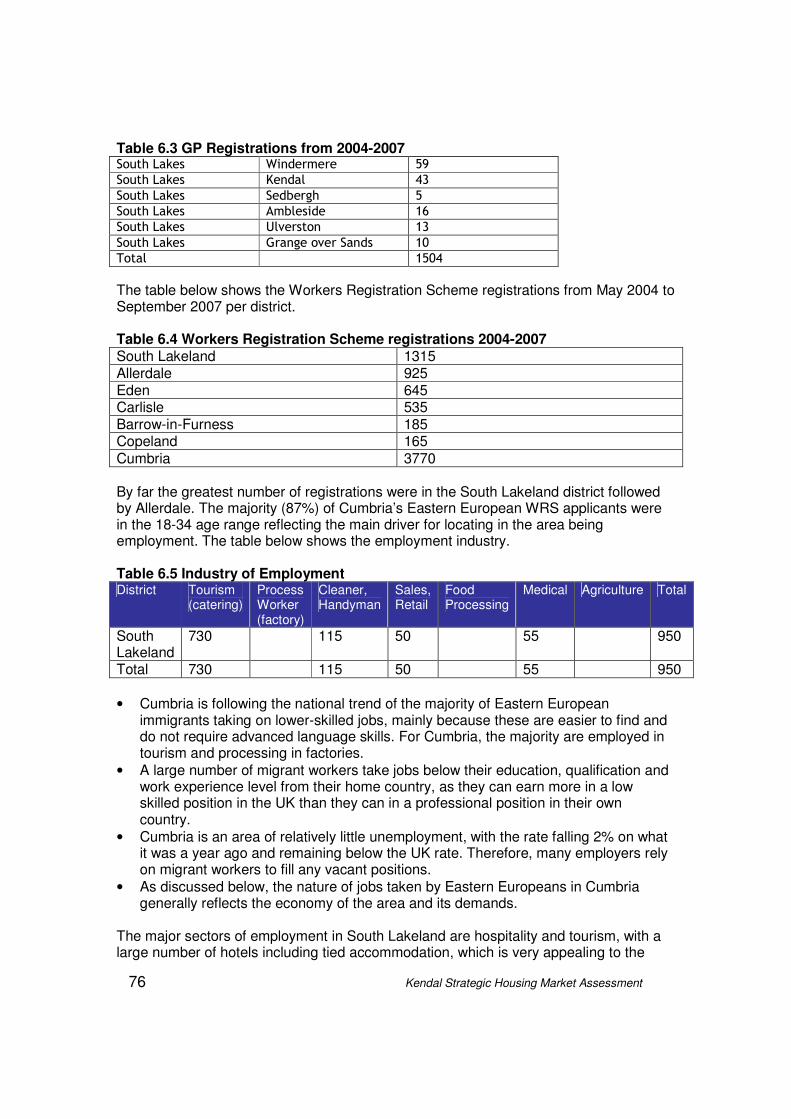
76 Kendal Strategic Housing Market Assessment
Table 6.3 GP Registrations from 2004-2007 South Lakes Windermere 59
South Lakes Kendal 43
South Lakes Sedbergh 5
South Lakes Ambleside 16
South Lakes Ulverston 13
South Lakes Grange over Sands 10
Total 1504
The table below shows the Workers Registration Scheme registrations from May 2004 to September 2007 per district. Table 6.4 Workers Registration Scheme registrations 2004-2007 South Lakeland 1315 Allerdale 925 Eden 645 Carlisle 535 Barrow-in-Furness 185 Copeland 165
Cumbria 3770 By far the greatest number of registrations were in the South Lakeland district followed by Allerdale. The majority (87%) of Cumbria’s Eastern European WRS applicants were in the 18-34 age range reflecting the main driver for locating in the area being employment. The table below shows the employment industry. Table 6.5 Industry of Employment District Tourism
(catering) Process Worker (factory)
Cleaner, Handyman
Sales, Retail
Food Processing
Medical Agriculture Total
South Lakeland
730 115 50 55 950
Total 730 115 50 55 950
• Cumbria is following the national trend of the majority of Eastern European immigrants taking on lower-skilled jobs, mainly because these are easier to find and do not require advanced language skills. For Cumbria, the majority are employed in tourism and processing in factories.
• A large number of migrant workers take jobs below their education, qualification and work experience level from their home country, as they can earn more in a low skilled position in the UK than they can in a professional position in their own country.
• Cumbria is an area of relatively little unemployment, with the rate falling 2% on what it was a year ago and remaining below the UK rate. Therefore, many employers rely on migrant workers to fill any vacant positions.
• As discussed below, the nature of jobs taken by Eastern Europeans in Cumbria generally reflects the economy of the area and its demands.
The major sectors of employment in South Lakeland are hospitality and tourism, with a large number of hotels including tied accommodation, which is very appealing to the
77 Kendal Strategic Housing Market Assessment
Eastern Europeans, as it means that getting a job in the area can often solve the problem of housing too.
• 56% of those employed in tourism were in South Lakeland, with it making up 77% of all South Lakeland Eastern European employment.
• The main employers for the area are generally hotels and guest houses, but there are a considerable amount of Eastern Europeans employed at Killington Motorway services and at Sunlight Laundry in Kendal.
Housing The key housing issues affecting migrant workers are:-
� Most of the migrant workers in the service industry are in tied accommodation. Although this has advantages, such as minimising travel costs, it may mean that workers are reliant on their employer for providing meals, and they could be paying higher rates for the type of accommodation they are in.
� Some migrant workers live on poor quality or overcrowded accommodation. This may be provided by their employer and rent deducted direct from pay, making the migrant worker likely to become homeless should their employment cease.
� Some interviewees are interested in purchasing their own property and settling in Cumbria.
� Housing is more affordable in Carlisle than it is in Eden, which could have influenced the fact that more Eastern Europeans have located in Carlisle than in Eden.
The above information reflects the findings from the Cumbria Equality and Diversity Partnership and Cumbria County Council study into the needs of migrant workers in Cumbria. (Sources: Social/Demographic Trend Analysis of the EU Immigrant Population in Cumbria 2003-2007 (Cumbria Constabulary), Cumbria Equality and Diversity Partnership Needs of Migrant Workers in Cumbria)
6.2.3 Gypsy and Travellers
The 2008 Gypsy and Traveller Accommodation Assessment (GTAA) highlights the need for 8 residential pitches in South Lakeland and 5 transit pitches. There is currently no provision for Gypsy and Travellers and evidence suggests that there are unauthorised encampments in the District. This includes unauthorised encampments for Appleby Fair and outside of the Appleby Fair. The review of the Regional Spatial Strategy is currently underway and this is suggesting a figure of 10 residential pitches with some rounding up of the figure based on undercounting and site viability issues.
6.2.4 Supported housing
The Supporting People Strategy 2008-2011 outlines the support needs of a range of different client groups. In 2008 some work was undertaken by the North
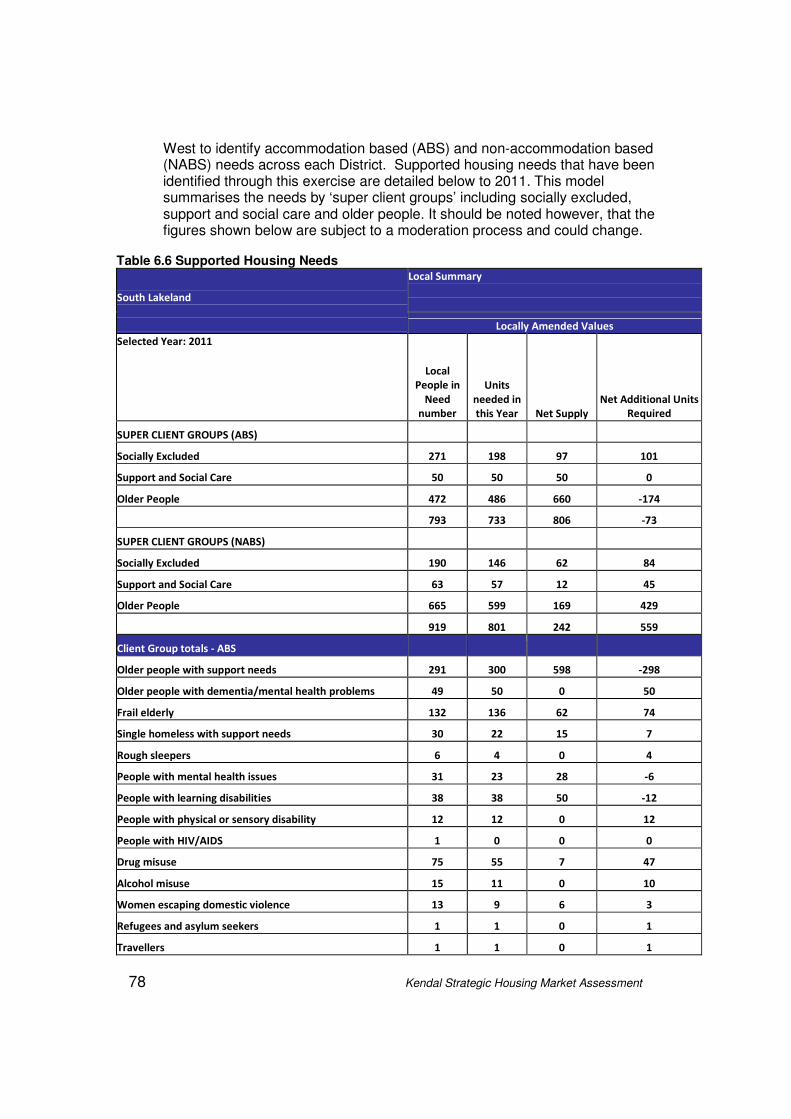
78 Kendal Strategic Housing Market Assessment
West to identify accommodation based (ABS) and non-accommodation based (NABS) needs across each District. Supported housing needs that have been identified through this exercise are detailed below to 2011. This model summarises the needs by ‘super client groups’ including socially excluded, support and social care and older people. It should be noted however, that the figures shown below are subject to a moderation process and could change.
Table 6.6 Supported Housing Needs
Local Summary
South Lakeland
Locally Amended Values
Selected Year: 2011
Local
People in
Need
number
Units
needed in
this Year Net Supply
Net Additional Units
Required
SUPER CLIENT GROUPS (ABS)
Socially Excluded 271 198 97 101
Support and Social Care 50 50 50 0
Older People 472 486 660 -174
793 733 806 -73
SUPER CLIENT GROUPS (NABS)
Socially Excluded 190 146 62 84
Support and Social Care 63 57 12 45
Older People 665 599 169 429
919 801 242 559
Client Group totals - ABS
Older people with support needs 291 300 598 -298
Older people with dementia/mental health problems 49 50 0 50
Frail elderly 132 136 62 74
Single homeless with support needs 30 22 15 7
Rough sleepers 6 4 0 4
People with mental health issues 31 23 28 -6
People with learning disabilities 38 38 50 -12
People with physical or sensory disability 12 12 0 12
People with HIV/AIDS 1 0 0 0
Drug misuse 75 55 7 47
Alcohol misuse 15 11 0 10
Women escaping domestic violence 13 9 6 3
Refugees and asylum seekers 1 1 0 1
Travellers 1 1 0 1
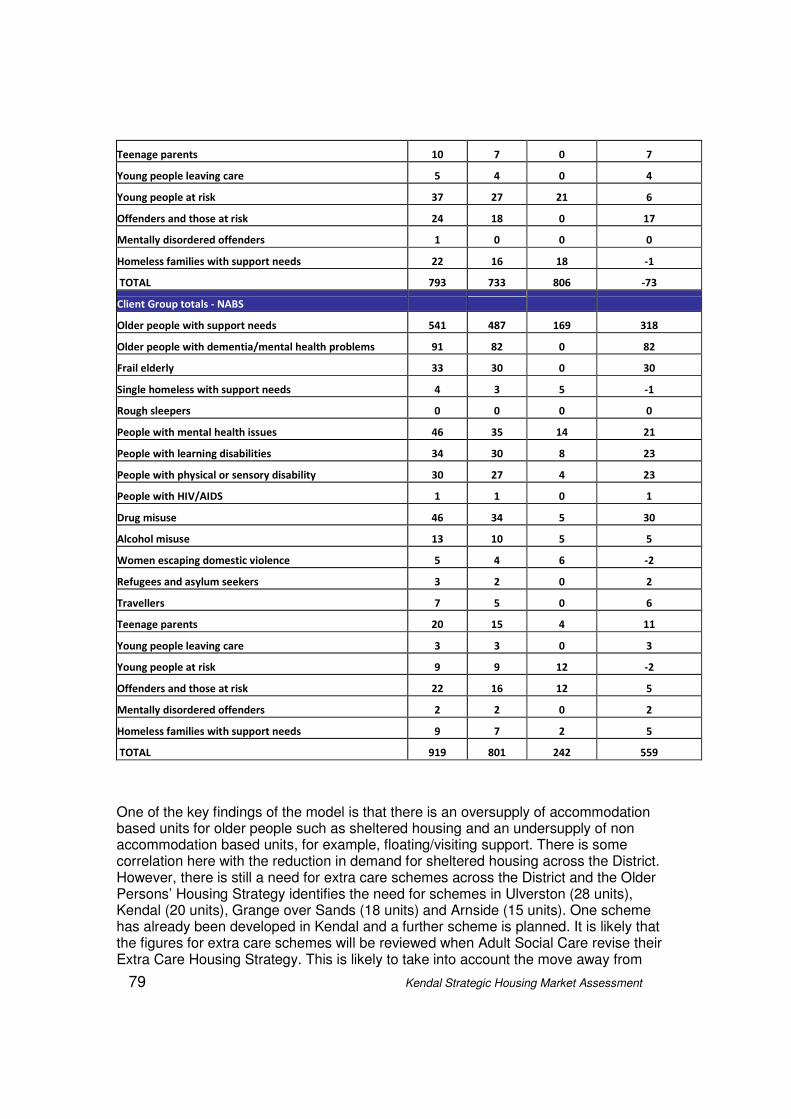
79 Kendal Strategic Housing Market Assessment
Teenage parents 10 7 0 7
Young people leaving care 5 4 0 4
Young people at risk 37 27 21 6
Offenders and those at risk 24 18 0 17
Mentally disordered offenders 1 0 0 0
Homeless families with support needs 22 16 18 -1
TOTAL 793 733 806 -73
Client Group totals - NABS
Older people with support needs 541 487 169 318
Older people with dementia/mental health problems 91 82 0 82
Frail elderly 33 30 0 30
Single homeless with support needs 4 3 5 -1
Rough sleepers 0 0 0 0
People with mental health issues 46 35 14 21
People with learning disabilities 34 30 8 23
People with physical or sensory disability 30 27 4 23
People with HIV/AIDS 1 1 0 1
Drug misuse 46 34 5 30
Alcohol misuse 13 10 5 5
Women escaping domestic violence 5 4 6 -2
Refugees and asylum seekers 3 2 0 2
Travellers 7 5 0 6
Teenage parents 20 15 4 11
Young people leaving care 3 3 0 3
Young people at risk 9 9 12 -2
Offenders and those at risk 22 16 12 5
Mentally disordered offenders 2 2 0 2
Homeless families with support needs 9 7 2 5
TOTAL 919 801 242 559
One of the key findings of the model is that there is an oversupply of accommodation based units for older people such as sheltered housing and an undersupply of non accommodation based units, for example, floating/visiting support. There is some correlation here with the reduction in demand for sheltered housing across the District. However, there is still a need for extra care schemes across the District and the Older Persons’ Housing Strategy identifies the need for schemes in Ulverston (28 units), Kendal (20 units), Grange over Sands (18 units) and Arnside (15 units). One scheme has already been developed in Kendal and a further scheme is planned. It is likely that the figures for extra care schemes will be reviewed when Adult Social Care revise their Extra Care Housing Strategy. This is likely to take into account the move away from
80 Kendal Strategic Housing Market Assessment
residential care to a more enabling and independent environment such as extra care housing.
The Council is working with Impact Housing Association to develop a Foyer for young people in Kendal in recognition for the needs of this group. Floating/visiting support services are to be expanded for those people with complex needs and in particular alcohol dependency issues. Supporting People have carried out a review of older people’s services and this could lead to an increase in floating/visiting support. In addition, Local Area Co-Ordinators are to be appointed to provide services for complex needs.
6.3 Low Cost Market Housing
It is possible that some of the supported need may be addressed through market and intermediate affordable housing, particularly in the case of elderly people who are often asset rich but income poor. Many older people already own their own homes and may wish to have retirement solution that they can buy and own. Indeed, the 2006 District Wide Survey identified that 88.3% of those aged 60 and over were owner occupiers, the majority of which own their home outright. In addition, 80.5% of respondents wished to continue living in their own homes, with a significant number 37.6% interested in buying a property in either a specific development for older people or retirement village.
81 Kendal Strategic Housing Market Assessment
7. Report Conclusions – Bringing the evidence together The Kendal Strategic Housing Market Assessment details the developments in the current and future housing market and places this within the context of South Lakeland and Cumbria. From this information a revised estimate of housing requirements has been made broken down by HMA, tenure and type. The relationship between local development framework has been examined and housing need figures have been broken down to LDF. The extent to which markets are balanced has been investigated and Further examination of specific groups has also been made. The following brings together the evidence in preceding chapters to draw overall conclusions regarding housing needs that will influence the direction of future policy and strategy. Cumbria is often seen as an affluent area but the local housing market assessments highlight pockets of deprivation, though this is particularly the case when it comes to access to services in the rural areas. While property prices are high and there are high wage earners living here this masks problems of affordability for local resident’s dependant on local wages. Looking at Table 1.15 on wages by place of work demonstrates the true picture that is masked by median incomes. The Regional study points to factors including drivers pushing migration out from larger centres and factors pulling people to more rural areas and it is the most affluent who are moving out. Historically this has certainly been felt within the South Lakeland District housing markets with the in-immigration of more affluent households and retirees choosing to relocate here. The study further characterises the housing markets in Cumbria as follows:
• Generally weak local economies expressed through low incomes, except for those people not dependant on the local labour market for resources
• An aging population fuelled by out-migration of younger people (caused by lack of higher education institutions, graduate employment opportunities, and affordable housing) and continuing in migration of older retirees/people seeking a high quality lifestyle.
• High proportions of second and holiday homes, reducing the size of the effectively available housing stock.
• Large social housing waiting lists, and high proportions of concealed households, brought about not only by high demand from those on low incomes but by a very limited supply.
• A significant degree of difference between the core and the periphery of the sub-region. The central area has a function based around tourism and retirement migration. The western coastal strip from Barrow, Dalton and Askham to Carlisle is struggling to establish a new economic function following the decline of older mining and manufacturing industries, and contains some areas of intense deprivation. The eastern periphery has high demand from tourism and in migration, but also a significant agricultural sector.
Current trends across the North West point to a continuing fall in house prices which may continue for the next two to three years. In some areas in the South Lakeland District there is clear evidence of some falling house prices. However even with a 10% reduction entry level prices remain unaffordable to people on lower incomes. Furthermore in areas where the property market has been strong and stable in the past,
82 Kendal Strategic Housing Market Assessment
people are reluctant to sell at a reduced value and are tending to ‘sit out’ the current economic climate – the picture here is one of a static rather than falling housing market. This may change if people need to sell urgently to move for employment opportunities, but this is unlikely to impact sufficiently on the supply of affordable housing and in the short term the effects of the ‘credit crunch’ will impact negatively on people unable to access finance and therefore increase the immediate pressure on the social and private rented stock. The extent of the current economic climate on investors and property developers in the District is uncertain but it is possible that speculative investors may take advantage of reduced prices. This makes it harder for those on lower incomes to enter home ownership, and therefore face longer period in private and social rented sectors or intermediate housing if this is an option. In the long term there are clear linkages between housing supply and economic development. The economy needs a sufficient workforce in order to grow which in term needs suitable accommodation. In this sense economic development and housing are mutually supportive. This has the most direct effect in Kendal and Ulverston but its effects and implications are felt throughout the District. Evidence supports the need for more employment land to be made available as detailed within the Employers Survey and subsequently recognised in the draft Core Strategy. The development of affordable housing underpins economic development by assisting in the recruitment issues already highlighted be employers and helping to reverse the trend for working age population, particularly young people, moving away. This has to be supported by sufficient training opportunities and the development of Kendal College and the University of Cumbria is very positive provided that the type of courses offered matches the skills sought by employers. Given the evidence on incomes the majority of affordable housing needs to be social rented and the breakdown in tenure provided in Chapter 5, Table 5.17 needs to be considered a minimum. This is particularly important given the tighter lending criteria that people applying for low cost home ownership products such as shared ownership/equity face. The need for affordable housing has increased since the 2006 survey was undertaken due to the population growth and rise in house prices. However, the annual need figure of 733 would have been much greater had it not been for the 360 affordable homes that have been developed since 2006. From the need consideration will need to be given to developing targets to meet a proportion of the need taking into account Regional Spatial Strategy limits and Core Strategy development. Evidence supports local occupancy housing in the rural areas primarily and does not support local occupancy in the Key Service Centres of Kendal, Ulverston, Milnthorpe and Grange over Sands. The scale of need for affordable housing would suggest that the thresholds identified within the draft South Lakeland Core Strategy are justifiable. However, the economic climate must be taken into account and development may be unviable if the thresholds were increased much further at the present time. This should be kept under review depending on the speed of economic recovery. The degree of aging and projected growth in the older age groups has significant implications for housing services and support. Most older prefer to live independently
83 Kendal Strategic Housing Market Assessment
and stay in their own homes, however, sometimes they lack the support to be able to do so successfully. Issues around older in-migrants who are fit and healthy now but lack the support of family networks should their health deteriorate also needs consideration by Adult Social Care, Support People and the District in the development of services such as floating/visiting support. Most new developments have elements of the Lifetime Homes standard so that people can remain in their own homes but the extent to which a property can be adapted if a person becomes disabled remains an issue for new and existing homes. Most older people are forced to downsize if they wish to move a scheme that is specifically designed for older people, however, older people’s wishes borne out in national and local consultation work are for more two bedroom accommodation with a bit more space and storage. Given the higher proportion of homes owned outright in the District as a whole it is possible people will be able to afford additional space but discussions with housing providers should begin to explore options perhaps including equity release. The trends show a move towards smaller households for one and two bedroom properties, however, developing one bedroom flats does not reflect changes that households may encounter such as starting a family. Estate agent interviews point to the fact that one bedroom properties are less popular and offer less flexibility to any purchaser. Therefore, thought needs to be given to more two to three bedroom properties.
Monitoring and updating of the assessment The SHMA Guidance recommends that partnerships undertake a comprehensive assessment no more than every five years but that trends and activities in the market areas should be monitored regularly against policy aims. In addition the information contained in the SHMAs should be updated. This will be carried out in conjunction with Planning departments/authorities. To achieve this aim and provide a framework for updating SHMAs a set of indicators have been developed listed in appendix 3. A comprehensive assessment and updated housing needs survey is planned for 2010/11.
84 Kendal Strategic Housing Market Assessment
Bibliography Cumbria Economic Bulletin, Sep 2006, & Information & Intelligence, Policy & Performance Unit, Cumbria County Council).
Northwest Regional Economic Forecasting Panel, Spring 2008 South Lakeland Housing Needs and Market Assessment 2006 South Lakeland Core Strategy (draft) 2009 Lake District National Park Authority Core Strategy (draft) 2009
The Cumbria Business Survey (Cumbria Economic Intelligence Partnership: 2007) North West Regional Strategic Housing Assessment, (Philip Leather Associates) 4NW, 2008. Cumbria Economic Bulletin, 2007 Stephen Hincks, Cumbria Economic Bulletin, 2008 Cumbria Economic Bulletin, 2009 Annual Business Inquiry, 1998-2006 South Lakeland District Council Viability Impact Study 2009, NPS Gypsy & Traveller Accommodation Assessment 2008 Social/Demographic Trend Analysis of the EU Immigrant Population in Cumbria 2003-2007 (Cumbria Constabulary), Cumbria Equality and Diversity Partnership Needs of Migrant Workers in Cumbria South Lakeland District Council Older Persons’ Housing Strategy

85 Kendal Strategic Housing Market Assessment
Appendix 1 Key Aspirational Scenario Assumptions
• Growth in the agricultural and forestry sector due to significant potential for improvements in the management of woodland areas. In turn, this would lead to significant potential for biomass production helping to fuel a low carbon economy in the future.
• Linked to growth in agriculture there is potential to grow the size of the food and drink sector both in terms of jobs and profitability due to focus on good quality, local, higher added value produce. Cumbrian branding will help streamline the marketing of local produce.
• Off the back of developments in West Cumbria relating to energy and environmental technologies, the area will become a desirable location for businesses related to this sphere of work but who do not want to locate themselves in the relatively more isolated areas of West Cumbria or Barrow.
• Assuming provision of decent land and premises there is significant potential for growth along the M6 corridor.
• The area is particularly reliant on the retail and hospitality industry which exhibit significant growth potential despite being traditionally low value sectors. Nevertheless higher added value will be achieved in the future, particularly in the hospitality sector, through improvements to customer service and widespread take-up a recognised scheme of accreditation.
• K Village development in Kendal will sustain a number of construction jobs in the near term and significant levels of employment once it is completed. The vision for the development is for a 47,100 sq feet of retail and 20,000 sq feet of office space along with 90 apartments and 40 sheltered affordable flats
• Canal Head redevelopment in Kendal with aspirations to create 900 jobs and a ‘cultural quarter’ with a mix of residential, shops, bars and hotel in the town.
• Windermere waterfront development includes a number of projects including: transformation of the Glebe; redevelopment of Windermere steamboat museum; development of a new conference centre at the Low Wood hotel: the Waterfront Masterplan at Ambleside and Lakeside and Haverthwaite development – including the relocation of the motor museum and work at the Lakeside and Haverthwaite steam railway.
• South Lakeland, and particularly Kendal, has seen a significant fall in employment in the financial and business services sector over the last 10 years mainly due to company restructuring and the closure of the Provincial and Scottish Providence offices in the town. Under the baseline scenario these job losses are projected forward resulting in a baseline trend showing further large scale decline in this sector in South Lakeland. However given the discrete nature of these job losses this forecast is somewhat unrealistic and, as a result, the aspirational forecast over inflates employment growth in this sector in order to offset the losses in the baseline figures.
• Regeneration of the Berners site and promenade in Grange over Sands. 4.2.10 Key Worst Case Scenario Assumptions
• Due to constant demand for food and a shifting emphasis on buying local produce it is expected that job losses will be minimal within the agriculture,
86 Kendal Strategic Housing Market Assessment
forestry and fishing sector; nevertheless, the sector will fail to live up to its potential for growth. The worst case scenario is only marginally worse than the baseline.
• Manufacturing was already expected to decline even under the aspirational scenario, so it is not surprising that this will be one of the hardest hit sectors. Particular pressure will come from rising cost of imports, although some firms dealing mainly in exports may be more fortunate. However the vast majority of small-medium sized firms operating mainly within localised markets will come under pressure from all sides as both upper tier companies and retailers attempt to retain their profit margins. Declining consumer spending and lack of buyer confidence will lead to falls in output and pressure on managers to either reduce the number of working hours or, where this fails, reduce the size of the workforce.
• As in other forms of manufacturing, the food and drink sector will be squeezed as a result of the downturn albeit to a more limited extent due to the size of the sector. Demand for food will not decline as markedly as other products although there may be a move from luxury products to shops own brands with farm shops and higher added value produce likely to be worst hit.
• The extent of any change in the retail and hospitality sector is difficult to predict, however it is expected that job losses in retail will be widespread due to a decrease in consumer confidence/spending and a number of national stores going into administration. Within hospitality, any job losses may be absorbed by the migrant workforce returning to their country of origin due to the fall in the value of sterling. However there is a counter-argument which suggests tourism based revenue may actually increase in the Lake District as more people decide to holiday in the UK rather than abroad.
• The construction industry has been severely hit due to the stalling of new housing and commercial projects, falling land prices and difficulty in accessing finance. The knock-on effects are now taking hold with many smaller businesses in the supply chain facing difficult times. The coming years are predicted to be especially difficult for the construction industry until confidence returns to the housing market and credit conditions improve.
• Financial and business services are under-represented across Cumbria as a whole, so any potential job losses within the sector as a proportion of total job losses within Cumbria are likely to be less pronounced than for across the UK. However, a number of high profile job losses have been announced by global firms in recent months and it is very possible that rationalisation of services and associated downsizing will affect businesses operating in Cumbria.
• As a result of contraction elsewhere, it is possible that employment in the public sector may actually increase rather than decline in an attempt to stem rising unemployment. However it is still expected that any increase will be at a slower rate than that of the baseline trend. Investment in skills and education infrastructure is likely to remain strong, as is expenditure in the health sector.

87 Kendal Strategic Housing Market Assessment
Appendix 2 SHMA Report Methodology The Housing Needs Survey and consequent 2006 estimates of housing need followed the draft Housing Market Assessment Manual available at the time. This was followed by the Strategic Housing Market Assessment Guidance Version published in 2007.
Figure 1.1: Strategic Housing Market Assessment core outputs
1 Estimates of current dwellings in terms of size, type, condition, tenure
2 Analysis of past and current housing market trends, including balance between supply and demand in different housing sectors and price/affordability. Description of key drivers underpinning the housing market
3 Estimate of total future number of households, broken down by age and type where possible
4 Estimate of current number of households in housing need
5 Estimate of future households that will require affordable housing
6 Estimate of future households requiring market housing
7 Estimate of the size of affordable housing required
8 Estimate of household groups who have particular housing requirements eg families, older people, key workers, black and minority ethnic groups, disabled people, young people, etc.
NB. Estimates of household numbers (3, 4, 5 and 6) may be expressed as a number or a range.
Figure 1.2: Strategic Housing Market Assessment process checklist
1 Approach to identifying housing market area(s) is consistent with other approaches to identifying housing market areas within the region
2 Housing market conditions are assessed within the context of the housing market area
3 Involves key stakeholders, including house builders
4 Contains a full technical explanation of the methods employed, with any limitations noted
5 Assumptions, judgements and findings are fully justified and presented in an open and transparent manner
6 Uses and reports upon effective quality control mechanisms
7 Explains how the assessment findings have been monitored and updated (where appropriate) since it was originally undertaken
88 Kendal Strategic Housing Market Assessment
In order to provide a robust methodology and consistent research basis for the Cumbria Housing Strategy, a Data Collection Task Group was formed consisting of representatives from each District, members of the Northern Housing Consortium and the Cumbria Rural Housing Trust. This Group was tasked with the following:
1) Agree common methodology and data sources to enable following surveys to be undertaken:
• Local Housing Assessments to include - local Housing Needs (affordable, general and special needs clients in a
form that also provides evidence for Section 106 agreements - Housing Market and Affordability Assessment - Interventions to balance housing market
2) Review information required and carry out countywide assessments of
• Household projections
• Demographic Structure and projections
• Economic Activity and working patterns
• Travel to work patterns 3) Produce and agree terms and definitions (glossary) 4) Any other work to underpin Cumbria Sub Regional Housing Requirement
or other themed working groups as advised The assessment begun in April 2005, at which point the ODPM issued the Local Housing Assessment: A Practice Guide (Draft). Since the assessment began, a further refined, but still draft Housing Market Assessments: Draft Practice Guidance was issued in December, 2005, and as far as possible this has been incorporated this into the methodology. Following Guidance, Housing Market Areas were identified with regard to functioning housing markets defined as ‘the geographical area in which a substantial majority of the employed population both live and work and where those moving house without changing employment choose to stay.’ (Maclennan et al, 1998 Cited in LHA, ODPM 2005). A number of considerations were taken into account including:
• Patterns of relocation within local areas and the degree of self-containment
• Travel to work patterns and commuting to centres of employment
• Areas of high and low demand
• Other information such as recent structure plans and local plans
• Group discussion on the appropriate boundaries Having established Housing Market Areas an assessment of the local housing system was then undertaken, by analysing secondary and primary information within the following stages:
89 Kendal Strategic Housing Market Assessment
A. Analysis of local housing system (secondary data) B. Assessing future change in household numbers (secondary data) C. Assessing housing need, including the Housing Needs Survey (secondary
& primary data, see below) D. Bringing together a robust evidence base
Secondary data was collated to feed into the first two levels of the assessment. To assess housing need (C) the Data Collection Group worked with the Northern Housing Consortium to develop the Housing Needs Questionnaire to be utilised by Eden DC, Barrow BC, Allerdale BC and Carlisle CC. South Lakes and Barrow commissioned consultants to carry out surveys using the same methodology. However to ensure consistency all districts used similar formats with corresponding questions and referred to the March and December updated Guidance when analysing the results (see Appendix ) These stages are outlined briefly below: A. Analysis of local housing system Stage 1: Factors affecting the current housing system
• Impact of national and regional economic policy
• Demographic structure
• Size and structure of local labour force
• Local incomes
• The cost of buying and renting a property and how this has changed Output
• Trends in employment and occupational structure in the local economy over last 10 years
• Population and household numbers and household characteristics in their local housing market and how these have changed over the last 10 years
• The main trends in local incomes; and
• Recent changes in the relative costs of housing in different tenures
Stage 2: Assessing the current stock of housing
• Total number of dwellings
• Tenure
• House size/type
• Condition of stock by tenure
• Levels of shared housing and communal establishments
Output
• the nature of the current stock of housing, by size, type, location and tenure

90 Kendal Strategic Housing Market Assessment
• the location of current housing stock; and
• how the stock has adjusted over the last decade Stage 3 Indicators of housing demand, pressure and potential housing supply
• relative house prices and rents
• affordability of housing
• occupancy by tenure
• vacancy rates by tenure
• turnover or churn
• assessing available housing supply Stage 4 Bringing evidence together
• understand the balance of the overall stock of dwellings and households and how this has changed in recent years
• provide evidence of the existing housing stock by size, type, tenure and location
• provide evidence of changing house prices and housing demand by size type and location
• indicate the extent to which some areas within the local housing market are less popular and/or raise issues of low demand/over supply and why
• indicate the extent of demand pressure in terms of market and social housing stock
• estimate current affordability by tenure and household incomes; and
• identify other issues including stick condition, churn and over crowding B. Assessing future change in household numbers Stage 1: projecting the future change in household numbers: basic method or other methods Output An estimate of the projected household change in terms of age, gender, ethnicity and type A more sophisticated projection that takes account of local differences C. Assessing housing need Stage 1 Defining housing need
• what is affordable?
• defining unsuitable
• measuring affordability
• assessing household income
• assessing whether a household can afford to buy a home Add in example
• assessing whether a household can afford to rent a home
• assessing whether a household can afford a shared equity property
91 Kendal Strategic Housing Market Assessment
• assessing where should a household be able to live
• the needs assessment table (quantitative assessment of housing need for affordable housing)
Stage 2 using secondary and survey data Output
• estimates of the levels of household need; and
• estimates of the shortages or surplus of affordable housing needed in terms of different sized units
Stage 3 Considering the requirements of particular household groups
• special needs housing
• role of intermediate housing in meeting need D. Bringing together a robust evidence base analysis and summary of the evidence collected above: Stage 1 key drivers of the housing market
• future economic performance
• future employment structure
• future affordability Stage 2 Housing aspirations and choice
• assessing future demand for market housing
• assessing demand for affordable housing
• assessing demand for intermediate housing
• analysis and presentation Stage 3 Updating Local Housing assessments
• Based on Key variables and data sources
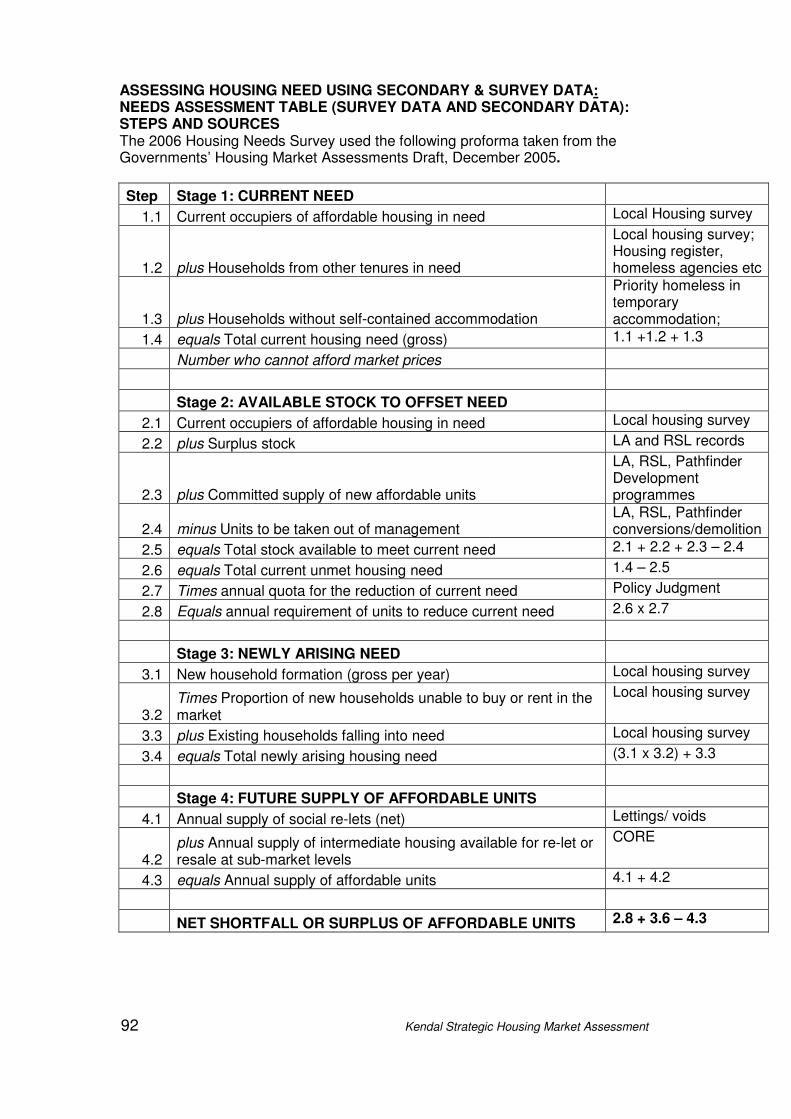
92 Kendal Strategic Housing Market Assessment
ASSESSING HOUSING NEED USING SECONDARY & SURVEY DATA: NEEDS ASSESSMENT TABLE (SURVEY DATA AND SECONDARY DATA): STEPS AND SOURCES The 2006 Housing Needs Survey used the following proforma taken from the Governments’ Housing Market Assessments Draft, December 2005.
Step Stage 1: CURRENT NEED
1.1 Current occupiers of affordable housing in need Local Housing survey
1.2 plus Households from other tenures in need
Local housing survey; Housing register, homeless agencies etc
1.3 plus Households without self-contained accommodation
Priority homeless in temporary accommodation;
1.4 equals Total current housing need (gross) 1.1 +1.2 + 1.3
Number who cannot afford market prices
Stage 2: AVAILABLE STOCK TO OFFSET NEED
2.1 Current occupiers of affordable housing in need Local housing survey
2.2 plus Surplus stock LA and RSL records
2.3 plus Committed supply of new affordable units
LA, RSL, Pathfinder Development programmes
2.4 minus Units to be taken out of management LA, RSL, Pathfinder conversions/demolition
2.5 equals Total stock available to meet current need 2.1 + 2.2 + 2.3 – 2.4
2.6 equals Total current unmet housing need 1.4 – 2.5
2.7 Times annual quota for the reduction of current need Policy Judgment
2.8 Equals annual requirement of units to reduce current need 2.6 x 2.7
Stage 3: NEWLY ARISING NEED
3.1 New household formation (gross per year) Local housing survey
3.2 Times Proportion of new households unable to buy or rent in the market
Local housing survey
3.3 plus Existing households falling into need Local housing survey
3.4 equals Total newly arising housing need (3.1 x 3.2) + 3.3
Stage 4: FUTURE SUPPLY OF AFFORDABLE UNITS
4.1 Annual supply of social re-lets (net) Lettings/ voids
4.2 plus Annual supply of intermediate housing available for re-let or resale at sub-market levels
CORE
4.3 equals Annual supply of affordable units 4.1 + 4.2
NET SHORTFALL OR SURPLUS OF AFFORDABLE UNITS 2.8 + 3.6 – 4.3
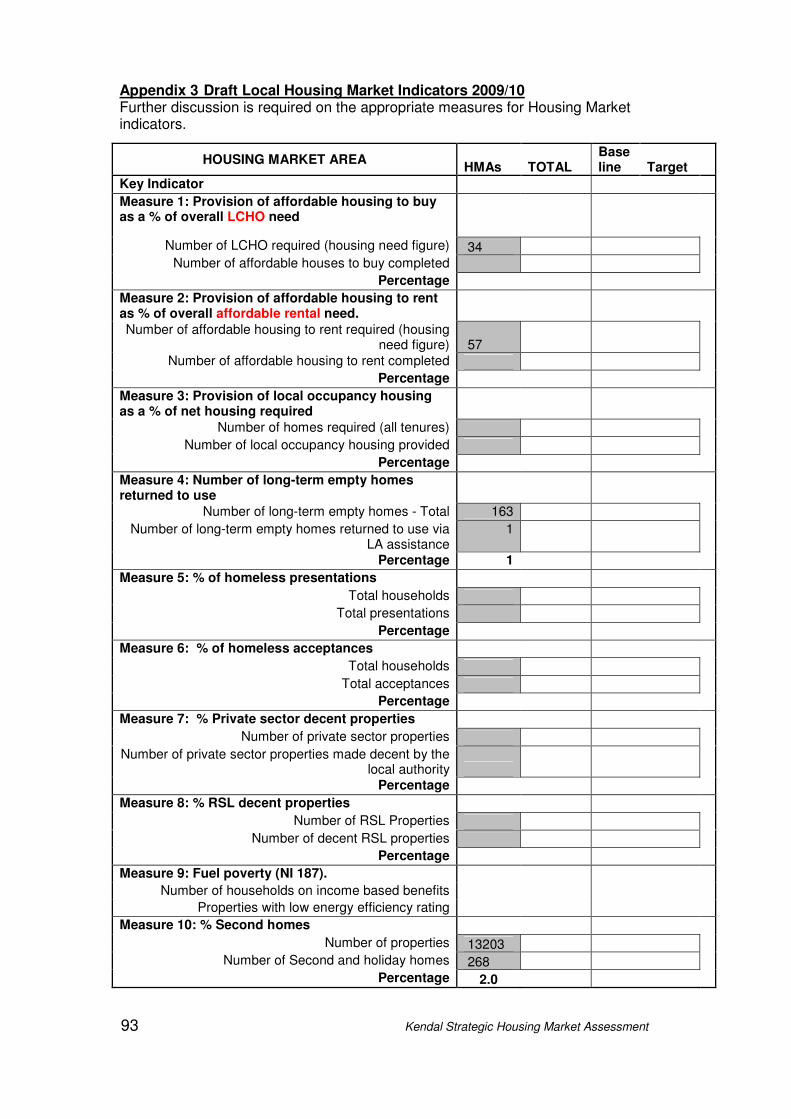
93 Kendal Strategic Housing Market Assessment
Appendix 3 Draft Local Housing Market Indicators 2009/10 Further discussion is required on the appropriate measures for Housing Market indicators.
HOUSING MARKET AREA HMAs TOTAL
Baseline Target
Key Indicator Measure 1: Provision of affordable housing to buy as a % of overall LCHO need
Number of LCHO required (housing need figure) 34
Number of affordable houses to buy completed Percentage
Measure 2: Provision of affordable housing to rent as % of overall affordable rental need.
Number of affordable housing to rent required (housing need figure) 57
Number of affordable housing to rent completed Percentage
Measure 3: Provision of local occupancy housing as a % of net housing required
Number of homes required (all tenures) Number of local occupancy housing provided
Percentage Measure 4: Number of long-term empty homes returned to use
Number of long-term empty homes - Total 163
Number of long-term empty homes returned to use via LA assistance
1
Percentage 1
Measure 5: % of homeless presentations
Total households Total presentations
Percentage Measure 6: % of homeless acceptances
Total households
Total acceptances Percentage
Measure 7: % Private sector decent properties Number of private sector properties
Number of private sector properties made decent by the local authority
Percentage Measure 8: % RSL decent properties
Number of RSL Properties
Number of decent RSL properties Percentage
Measure 9: Fuel poverty (NI 187). Number of households on income based benefits
Properties with low energy efficiency rating Measure 10: % Second homes
Number of properties 13203 Number of Second and holiday homes 268
Percentage 2.0
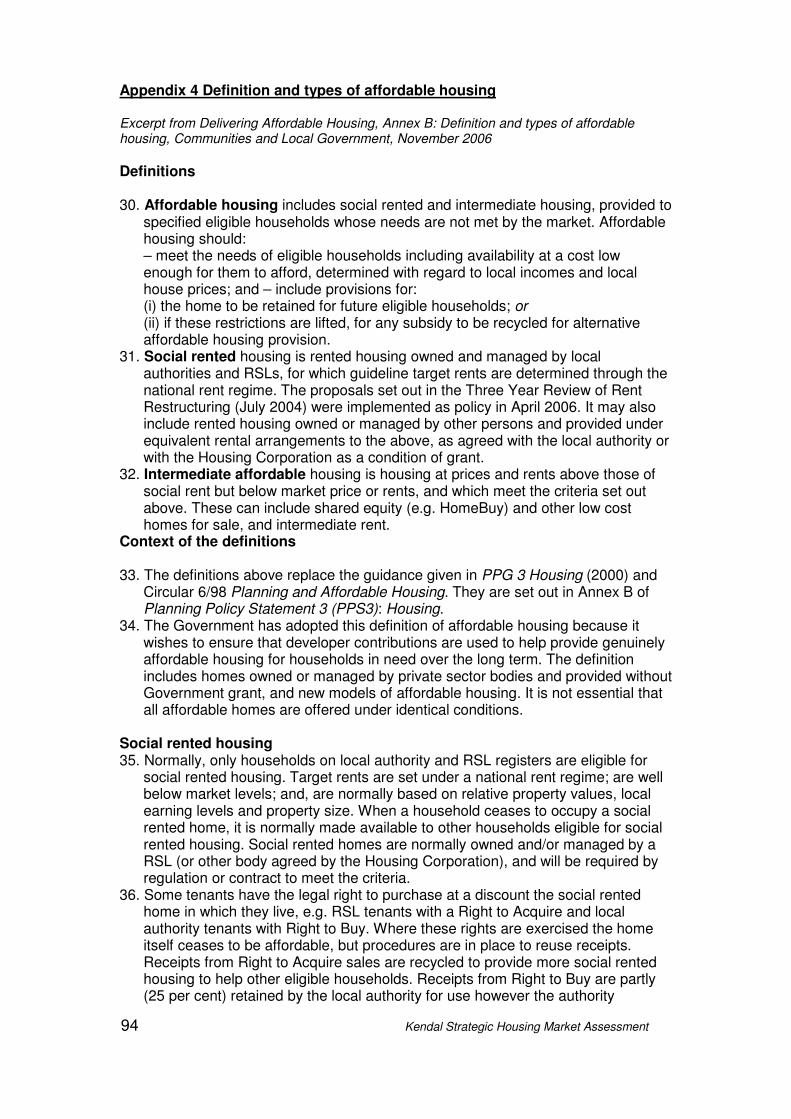
94 Kendal Strategic Housing Market Assessment
Appendix 4 Definition and types of affordable housing Excerpt from Delivering Affordable Housing, Annex B: Definition and types of affordable housing, Communities and Local Government, November 2006
Definitions 30. Affordable housing includes social rented and intermediate housing, provided to
specified eligible households whose needs are not met by the market. Affordable housing should: – meet the needs of eligible households including availability at a cost low enough for them to afford, determined with regard to local incomes and local house prices; and – include provisions for: (i) the home to be retained for future eligible households; or (ii) if these restrictions are lifted, for any subsidy to be recycled for alternative affordable housing provision.
31. Social rented housing is rented housing owned and managed by local authorities and RSLs, for which guideline target rents are determined through the national rent regime. The proposals set out in the Three Year Review of Rent Restructuring (July 2004) were implemented as policy in April 2006. It may also include rented housing owned or managed by other persons and provided under equivalent rental arrangements to the above, as agreed with the local authority or with the Housing Corporation as a condition of grant.
32. Intermediate affordable housing is housing at prices and rents above those of social rent but below market price or rents, and which meet the criteria set out above. These can include shared equity (e.g. HomeBuy) and other low cost homes for sale, and intermediate rent.
Context of the definitions 33. The definitions above replace the guidance given in PPG 3 Housing (2000) and
Circular 6/98 Planning and Affordable Housing. They are set out in Annex B of Planning Policy Statement 3 (PPS3): Housing.
34. The Government has adopted this definition of affordable housing because it wishes to ensure that developer contributions are used to help provide genuinely affordable housing for households in need over the long term. The definition includes homes owned or managed by private sector bodies and provided without Government grant, and new models of affordable housing. It is not essential that all affordable homes are offered under identical conditions.
Social rented housing 35. Normally, only households on local authority and RSL registers are eligible for
social rented housing. Target rents are set under a national rent regime; are well below market levels; and, are normally based on relative property values, local earning levels and property size. When a household ceases to occupy a social rented home, it is normally made available to other households eligible for social rented housing. Social rented homes are normally owned and/or managed by a RSL (or other body agreed by the Housing Corporation), and will be required by regulation or contract to meet the criteria.
36. Some tenants have the legal right to purchase at a discount the social rented home in which they live, e.g. RSL tenants with a Right to Acquire and local authority tenants with Right to Buy. Where these rights are exercised the home itself ceases to be affordable, but procedures are in place to reuse receipts. Receipts from Right to Acquire sales are recycled to provide more social rented housing to help other eligible households. Receipts from Right to Buy are partly (25 per cent) retained by the local authority for use however the authority
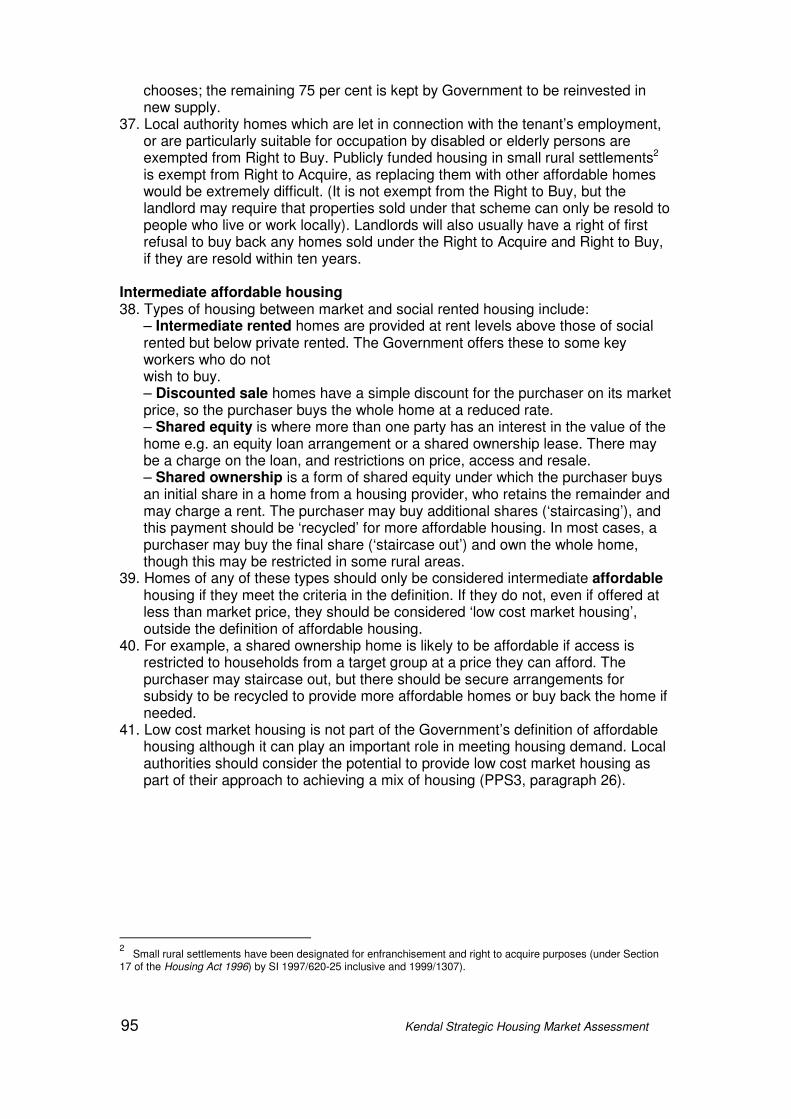
95 Kendal Strategic Housing Market Assessment
chooses; the remaining 75 per cent is kept by Government to be reinvested in new supply.
37. Local authority homes which are let in connection with the tenant’s employment, or are particularly suitable for occupation by disabled or elderly persons are exempted from Right to Buy. Publicly funded housing in small rural settlements2 is exempt from Right to Acquire, as replacing them with other affordable homes would be extremely difficult. (It is not exempt from the Right to Buy, but the landlord may require that properties sold under that scheme can only be resold to people who live or work locally). Landlords will also usually have a right of first refusal to buy back any homes sold under the Right to Acquire and Right to Buy, if they are resold within ten years.
Intermediate affordable housing 38. Types of housing between market and social rented housing include:
– Intermediate rented homes are provided at rent levels above those of social rented but below private rented. The Government offers these to some key workers who do not wish to buy. – Discounted sale homes have a simple discount for the purchaser on its market price, so the purchaser buys the whole home at a reduced rate. – Shared equity is where more than one party has an interest in the value of the home e.g. an equity loan arrangement or a shared ownership lease. There may be a charge on the loan, and restrictions on price, access and resale. – Shared ownership is a form of shared equity under which the purchaser buys an initial share in a home from a housing provider, who retains the remainder and may charge a rent. The purchaser may buy additional shares (‘staircasing’), and this payment should be ‘recycled’ for more affordable housing. In most cases, a purchaser may buy the final share (‘staircase out’) and own the whole home, though this may be restricted in some rural areas.
39. Homes of any of these types should only be considered intermediate affordable housing if they meet the criteria in the definition. If they do not, even if offered at less than market price, they should be considered ‘low cost market housing’, outside the definition of affordable housing.
40. For example, a shared ownership home is likely to be affordable if access is restricted to households from a target group at a price they can afford. The purchaser may staircase out, but there should be secure arrangements for subsidy to be recycled to provide more affordable homes or buy back the home if needed.
41. Low cost market housing is not part of the Government’s definition of affordable housing although it can play an important role in meeting housing demand. Local authorities should consider the potential to provide low cost market housing as part of their approach to achieving a mix of housing (PPS3, paragraph 26).
2 Small rural settlements have been designated for enfranchisement and right to acquire purposes (under Section 17 of the Housing Act 1996) by SI 1997/620-25 inclusive and 1999/1307).

96 Kendal Strategic Housing Market Assessment