Embed Size (px)
Citation preview

Ken Cantrell / NetApp
Mark Rogov / EMC
July 30, 2015

© 2015 Storage Networking Industry Association. All Rights Reserved.
About The Speakers
2
Mark RogovEMC
Systems Engineer
@rogovmark
Dr. J MetzCisco
R&D Engineer
@drjmetz
Ken CantrellNetApp
Manager Perf Engineering
@kencantrelljr

© 2015 Storage Networking Industry Association. All Rights Reserved.
SNIA Legal Notice
The material contained in this tutorial is copyrighted by the SNIA unless otherwise noted.
Member companies and individual members may use this material in presentations and literature under the following conditions:
Any slide or slides used must be reproduced in their entirety without modification
The SNIA must be acknowledged as the source of any material used in the body of any document containing material from these presentations.
This presentation is a project of the SNIA Education Committee.
Neither the author nor the presenter is an attorney and nothing in this presentation is intended to be, or should be construed as legal advice or an opinion of counsel. If you need legal advice or a legal opinion please contact your attorney.
The information presented herein represents the author's personal opinion and current understanding of the relevant issues involved. The author, the presenter, and the SNIA do not assume any responsibility or liability for damages arising out of any reliance on or use of this information.
NO WARRANTIES, EXPRESS OR IMPLIED. USE AT YOUR OWN RISK.
3

© 2015 Storage Networking Industry Association. All Rights Reserved.
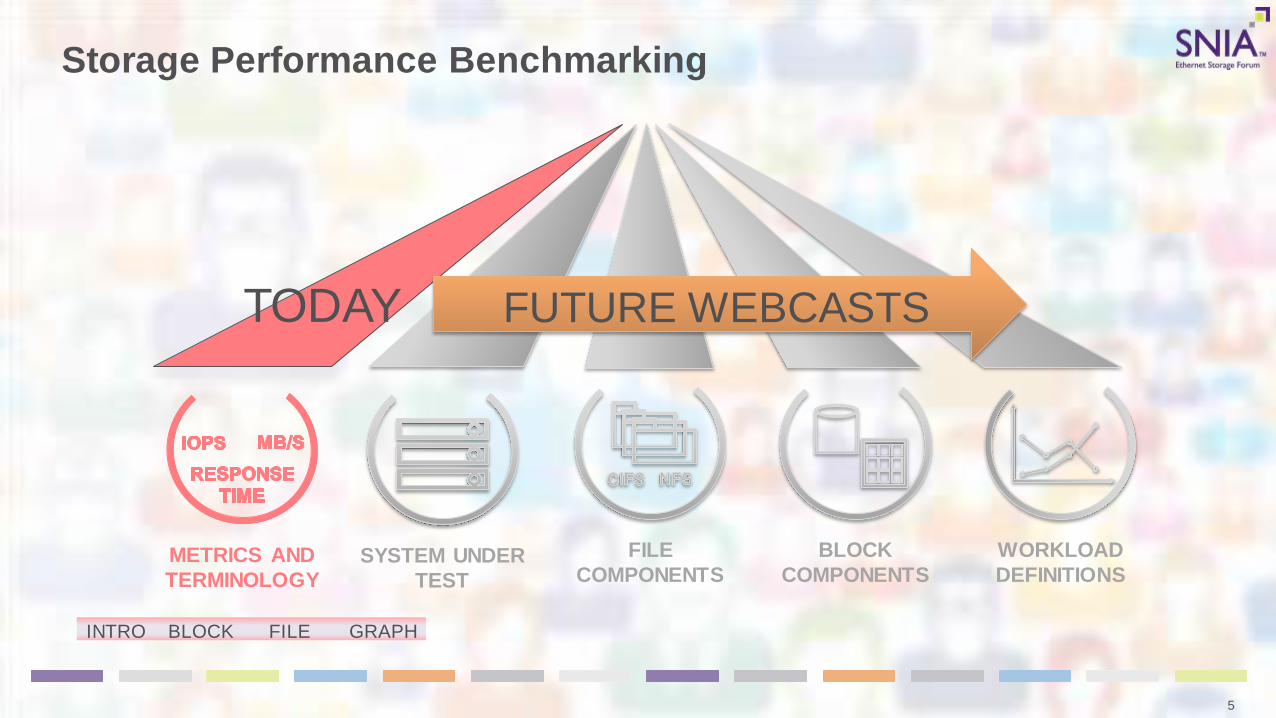
Storage Performance Benchmarking
4
SYSTEM UNDER
TEST
METRICS AND
TERMINOLOGY
FILE
COMPONENTS
BLOCK
COMPONENTS
WORKLOAD
DEFINITIONS
© 2015 Storage Networking Industry Association. All Rights Reserved.
Storage Performance Benchmarking
5
SYSTEM UNDER
TEST
METRICS AND
TERMINOLOGY
FILE
COMPONENTS
BLOCK
COMPONENTS
WORKLOAD
DEFINITIONS
TODAY FUTURE WEBCASTS
INTRO BLOCK FILE GRAPH

© 2015 Storage Networking Industry Association. All Rights Reserved.
BENCHMARKSBALANCED PROFESSIONAL
APPROACH
BUSINESSRUN PRODUCTION
APPLICATIONS
BAKE-OFFSSINGLE OBSCURE METRIC
6
Three Great Buckets Of Testing
UN*X DD
IOMETER
IOZONE
VDBENCH
DATABASE
COMPUTE FARM
VDI
LOGIN VSI
VMMARK
SPEC SFS
SPC1
INTRO BLOCK FILE GRAPH

© 2015 Storage Networking Industry Association. All Rights Reserved. 7
Block / SAN Terminology
IO IOIOIOIOIOIO BLOCK / SAN
PROTOCOLFC/iSCSI/FCoE
Targ
et
Init
iato
r
INTRO BLOCK FILE GRAPH

© 2015 Storage Networking Industry Association. All Rights Reserved. 8
Block / SAN Terminology
IO IOIOIOIOIOIO
Targ
et
BLOCK / SAN
PROTOCOLFC/iSCSI/FCoE
IO
OPERATIONAKA TYPE:
READ
WRITE
Init
iato
r
INTRO BLOCK FILE GRAPH

© 2015 Storage Networking Industry Association. All Rights Reserved.
Block / SAN Operations
9
Source: http://www.t10.org/cgi-bin/ac.pl?t=f&f=sbc4r07c.pdf
Graphic: http://www.wordle.net/create
INTRO BLOCK FILE GRAPH

© 2015 Storage Networking Industry Association. All Rights Reserved. 10
Block / SAN Terminology
IO IOIOIOIOIOIO
Targ
et
BLOCK / SAN
PROTOCOLFC/iSCSI/FCoE
IO
OPERATIONAKA TYPE:
READ
WRITE
Init
iato
r
IOPSCOUNT EVERY
IO OPERATION
PER SECOND
THROUGHPUTSAME AS IOPS
INTRO BLOCK FILE GRAPH

© 2015 Storage Networking Industry Association. All Rights Reserved.
Where To Measure IOPS?
11
HOSTS
STORAGE
CONTROLLERDISK DRIVES
INTRO BLOCK FILE GRAPH

© 2015 Storage Networking Industry Association. All Rights Reserved.
Where To Measure IOPS?
12
HOSTS
STORAGE
CONTROLLERDISK DRIVES
500
400
300
200
100
FRONT END
1500
INTRO BLOCK FILE GRAPH

© 2015 Storage Networking Industry Association. All Rights Reserved.
Where To Measure IOPS?
13
HOSTS
STORAGE
CONTROLLERDISK DRIVES
500
400
300
200
1001000
1000
200
IDLE
15002200
FRONT ENDBACK END
INTRO BLOCK FILE GRAPH

© 2015 Storage Networking Industry Association. All Rights Reserved. 14
Block / SAN Terminology
IO IOIOIOIOIOIO
Targ
et
BLOCK / SAN
PROTOCOLFC/iSCSI/FCoE
IO
OPERATIONAKA TYPE:
READ
WRITE
Init
iato
r
IOPSCOUNT EVERY
IO OPERATION
PER SECOND
MB/SPAYLOAD SUM
OF EVERY
OPERATION
PER SECOND
BANDWIDTHSAME AS MB/S
INTRO BLOCK FILE GRAPH
THROUGHPUTSAME AS IOPS

© 2015 Storage Networking Industry Association. All Rights Reserved.
10004
TERABYTES
TB
10003
GIGABYTES
GB
MB/s Vs. MiB/s
15
MEGABYTES
MB 10002
10001
KILOBYTES
KB
10244
TEBIBYTES
TiB
15
10243
GIBIBYTES
GiB
10242MEBIBYTES
MiB
10241
KIBIBYTES
KiB
10%
7%
5%
2%
DECIMAL BINARY
INTRO BLOCK FILE GRAPH

© 2015 Storage Networking Industry Association. All Rights Reserved. 16
Block / SAN Terminology
IO IOIOIOIOIOIO
Targ
et
BLOCK / SAN
PROTOCOLFC/iSCSI/FCoE
IO
OPERATIONAKA TYPE:
READ
WRITE
IO SIZESIZE OF DATA
PAYLOAD
IN AN IO
OPERATION
Init
iato
r
IOPSCOUNT EVERY
IO OPERATION
PER SECOND
MB/SPAYLOAD SUM
OF EVERY
OPERATION
PER SECOND
BANDWIDTHSAME AS MB/S
INTRO BLOCK FILE GRAPH
THROUGHPUTSAME AS IOPS

© 2015 Storage Networking Industry Association. All Rights Reserved.
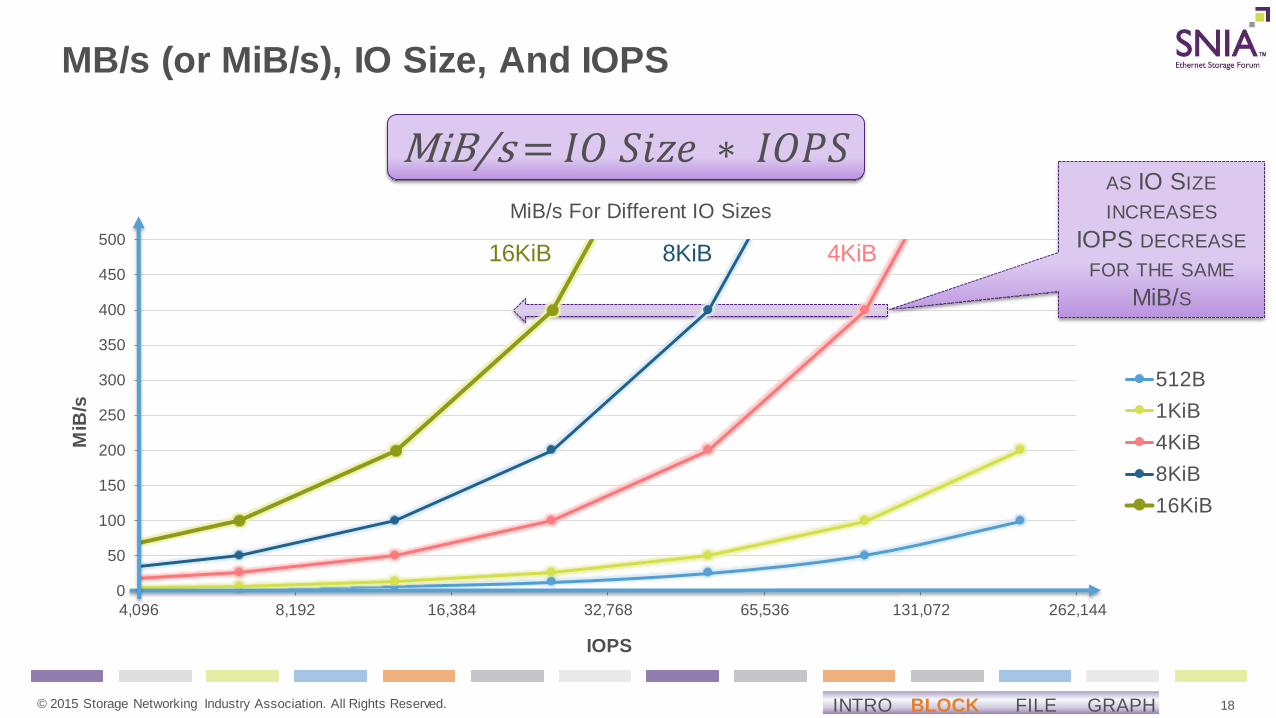
MB/s (or MiB/s), IO Size, And IOPS
17
0
50
100
150
200
250
300
350
400
450
500
4,096 8,192 16,384 32,768 65,536 131,072 262,144
MiB
/s
IOPS
MiB/s For Different IO Sizes
512B
1KiB
4KiB
8KiB
16KiB
MiB/s = 𝐼𝑂 𝑆𝑖𝑧𝑒 ∗ 𝐼𝑂𝑃𝑆KEEPING IOPS
CONSTANT,
LARGER I/O SIZES
PRODUCE
GREATER MiB/S
512B
1KiB
4KiB
INTRO BLOCK FILE GRAPH
© 2015 Storage Networking Industry Association. All Rights Reserved.
MB/s (or MiB/s), IO Size, And IOPS
18
0
50
100
150
200
250
300
350
400
450
500
4,096 8,192 16,384 32,768 65,536 131,072 262,144
MiB
/s
IOPS
MiB/s For Different IO Sizes
512B
1KiB
4KiB
8KiB
16KiB
MiB/s = 𝐼𝑂 𝑆𝑖𝑧𝑒 ∗ 𝐼𝑂𝑃𝑆AS IO SIZE
INCREASES
IOPS DECREASE
FOR THE SAME
MiB/S
16KiB 8KiB 4KiB
INTRO BLOCK FILE GRAPH

© 2015 Storage Networking Industry Association. All Rights Reserved.
IO SIZESIZE OF DATA
PAYLOAD
IN AN IO
OPERATION
19
Block / SAN Terminology
IO IOIOIOIOIOIO
Targ
et
BLOCK / SAN
PROTOCOLFC/iSCSI/FCoE
IO
OPERATIONAKA TYPE:
READ
WRITE
Init
iato
r
IOPSCOUNT EVERY
IO OPERATION
PER SECOND
MB/SPAYLOAD SUM
OF EVERY
OPERATION
PER SECOND
BANDWIDTHSAME AS MB/S
RESPONSE
TIMETIME TARGET
TAKES TO REPLY
TO AN IO
LATENCYSAME AS
RESPONSE
TIME
INTRO BLOCK FILE GRAPH
THROUGHPUTSAME AS IOPS

© 2015 Storage Networking Industry Association. All Rights Reserved.
Aggregate Property Of Response Time
20
DISK DRIVES
STORAGE
CONTROLLER HOSTS
INTRO BLOCK FILE GRAPH

© 2015 Storage Networking Industry Association. All Rights Reserved.
Aggregate Property Of Response Time
21
DISK DRIVES
STORAGE
CONTROLLER HOSTS
WRITE ≥ 1ms1ms
INTRO BLOCK FILE GRAPH

© 2015 Storage Networking Industry Association. All Rights Reserved.
Aggregate Property Of Response Time
22
DISK DRIVES
STORAGE
CONTROLLER HOSTS
READ
WRITE
≥ 1.5ms
≥ 1ms1ms
1ms
0.5ms
INTRO BLOCK FILE GRAPH

© 2015 Storage Networking Industry Association. All Rights Reserved.
Aggregate Property Of Response Time
23
DISK DRIVES
STORAGE
CONTROLLER HOSTS
READ
WRITE
≥ 1.5ms
≥ 1ms
READ
1ms
1ms
≥ 5ms
4ms
0.5ms
INTRO BLOCK FILE GRAPH

© 2015 Storage Networking Industry Association. All Rights Reserved. 24
File / NAS Terminology
OP OPOPOPOPOPOP FILE
PROTOCOLNFS/SMB/FTP
Clie
nt
Serv
er
INTRO BLOCK FILE GRAPH

© 2015 Storage Networking Industry Association. All Rights Reserved.
File / NAS Terminology
25
OP OPOPOPOPOPOP FILE
PROTOCOLNFS/SMB/FTP
Clie
nt
Serv
er
FILE
OPERATIONSEVERAL DOZEN
DEPENDING
ON
PROTOCOL
INTRO BLOCK FILE GRAPH

© 2015 Storage Networking Industry Association. All Rights Reserved.
NFSv4 Operations
26
Source: https://www.ietf.org/rfc/rfc3530.txt
Graphic: http://www.wordle.net/create
INTRO BLOCK FILE GRAPH

© 2015 Storage Networking Industry Association. All Rights Reserved.
SMB3 Operations
27
Source: https://msdn.microsoft.com/en-us/library/cc246482.aspx(use [MS-SMB2].pdf)
Graphic: http://www.wordle.net/create
INTRO BLOCK FILE GRAPH

© 2015 Storage Networking Industry Association. All Rights Reserved.
File / NAS Terminology
28
OP OPOPOPOPOPOP FILE
PROTOCOLNFS/SMB/FTP
Clie
nt
Serv
er
FILE
OPERATIONSEVERAL DOZEN
DEPENDING
ON
PROTOCOL
OPSCOUNT EVERY
PROTOCOL
OPERATION
PER SECOND
INTRO BLOCK FILE GRAPH

© 2015 Storage Networking Industry Association. All Rights Reserved.
File / NAS Terminology
29
OP OPOPOPOPOPOP FILE
PROTOCOLNFS/SMB/FTP
Clie
nt
Serv
er
FILE
OPERATIONSEVERAL DOZEN
DEPENDING
ON
PROTOCOL
OPSCOUNT EVERY
PROTOCOL
OPERATION
PER SECOND
MB/SPAYLOAD SUM
OF EVERY
OPERATION
PER SECOND
THROUGHPUTSAME AS MB/S
BANDWIDTHSAME AS MB/S
INTRO BLOCK FILE GRAPH

© 2015 Storage Networking Industry Association. All Rights Reserved.
File / NAS Terminology
30
OP OPOPOPOPOPOP FILE
PROTOCOLNFS/SMB/FTP
Clie
nt
Serv
er
FILE
OPERATIONSEVERAL DOZEN
DEPENDING
ON
PROTOCOL
OPSCOUNT EVERY
PROTOCOL
OPERATION
PER SECOND
MB/SPAYLOAD SUM
OF EVERY
OPERATION
PER SECOND
THROUGHPUTSAME AS MB/S
BANDWIDTHSAME AS MB/S
INTRO BLOCK FILE GRAPH

© 2015 Storage Networking Industry Association. All Rights Reserved.
File / NAS Terminology
31
OP OPOPOPOPOPOP FILE
PROTOCOLNFS/SMB/FTP
Clie
nt
Serv
er
FILE
OPERATIONSEVERAL DOZEN
DEPENDING
ON
PROTOCOL
OPSCOUNT EVERY
PROTOCOL
OPERATION
PER SECOND
MB/SPAYLOAD SUM
OF EVERY
OPERATION
PER SECOND
THROUGHPUTSAME AS MB/S
BANDWIDTHSAME AS MB/S
RESPONSE
TIMETIME TARGET
TAKES TO REPLY
TO AN IO
LATENCYSAME AS
RESPONSE
TIME
INTRO BLOCK FILE GRAPH

© 2015 Storage Networking Industry Association. All Rights Reserved.
Difference Between OPS and MB/s (MiB/s)
Two Otherwise Identical Runs With Different NFS Operations Mix (64 KiB IO Size)
32
70
30
High MetaDataOperations
Stat Read
30
70
High Data Operations
Stat Read0
5
10
15
20
25
30
35
40
45
0
200
400
600
800
1000
1200
1400
1600
1800
2000
OPS Read MiB/s Stat MiB/s
High MetaData
Operations
High Data
Operations
INTRO BLOCK FILE GRAPH

© 2015 Storage Networking Industry Association. All Rights Reserved.
Graph Fun Or Why “It Depends” Is Relevant?
33
0 2000 4000 6000 8000 10000 12000 14000
Operations per second, OPS
5,000 10,000
INTRO BLOCK FILE GRAPH

© 2015 Storage Networking Industry Association. All Rights Reserved.
Graph Fun Or Why “It Depends” Is Relevant?
34
10
5
0
2
4
6
8
10
12
0 2000 4000 6000 8000 10000 12000 14000
Re
sp
onse
tim
e,
ms
Operations per second, OPS
Response time per OPS
system 1 system 2
INTRO BLOCK FILE GRAPH

© 2015 Storage Networking Industry Association. All Rights Reserved.
Graph Fun Or Why “It Depends” Is Relevant?
35
0
5
10
15
20
25
1000 2000 3000 4000 5000 6000 7000 8000 9000 10000 11000 12000
Response time per OPS
System 1 System 2
Operations per sec, OPS
Re
sp
onse
tim
e,
ms
INTRO BLOCK FILE GRAPH

© 2015 Storage Networking Industry Association. All Rights Reserved.
Graph Fun Or Why “It Depends” Is Relevant?
36
0
5
10
15
20
25
1000 2000 3000 4000 5000 6000 7000 8000 9000 10000 11000 12000
Response time per OPS
System 1 System 2
Operations per sec, OPS
Re
sp
onse
tim
e,
ms
INTRO BLOCK FILE GRAPH

© 2015 Storage Networking Industry Association. All Rights Reserved.
MAXIMUM
PERFORMANCE
NEED
Graph Fun Or Why “It Depends” Is Relevant?
37
0
5
10
15
20
25
1000 2000 3000 4000 5000 6000 7000 8000 9000 10000 11000 12000
Response time per OPS
System 1 System 2
Operations per sec, OPS
Re
sp
onse
tim
e,
ms
INTRO BLOCK FILE GRAPH

© 2015 Storage Networking Industry Association. All Rights Reserved.
MINIMUM
PERFORMANCE
REQUIREMENT
Graph Fun Or Why “It Depends” Is Relevant?
38
0
5
10
15
20
25
1000 2000 3000 4000 5000 6000 7000 8000 9000 10000 11000 12000
Response time per OPS
System 1 System 2
Operations per sec, OPS
Re
sp
onse
tim
e,
ms
INTRO BLOCK FILE GRAPH

© 2015 Storage Networking Industry Association. All Rights Reserved.
ACCEPTABLE LATENCY BAND
Graph Fun Or Why “It Depends” Is Relevant?
39
0
5
10
15
20
25
1000 2000 3000 4000 5000 6000 7000 8000 9000 10000 11000 12000
Response time per OPS
System 1 System 2
Operations per sec, OPS
Re
sp
onse
tim
e,
ms
INTRO BLOCK FILE GRAPH

© 2015 Storage Networking Industry Association. All Rights Reserved.
ACCEPTABLE LATENCY BAND
Variance
40
0
5
10
15
20
25
10
00
12
50
15
00
17
50
20
00
22
50
25
00
27
50
30
00
32
50
35
00
37
50
40
00
42
50
45
00
47
50
50
00
52
50
55
00
57
50
60
00
62
50
65
00
67
50
70
00
72
50
75
00
77
50
80
00
82
50
85
00
87
50
90
00
92
50
95
00
97
50
10
000
10
250
10
500
10
750
11
000
11
250
11
500
11
750
12
000
Response time per OPS
System 1 System 2
Operations per sec, OPS
Re
sp
onse
tim
e,
ms
INTRO BLOCK FILE GRAPH
© 2015 Storage Networking Industry Association. All Rights Reserved.
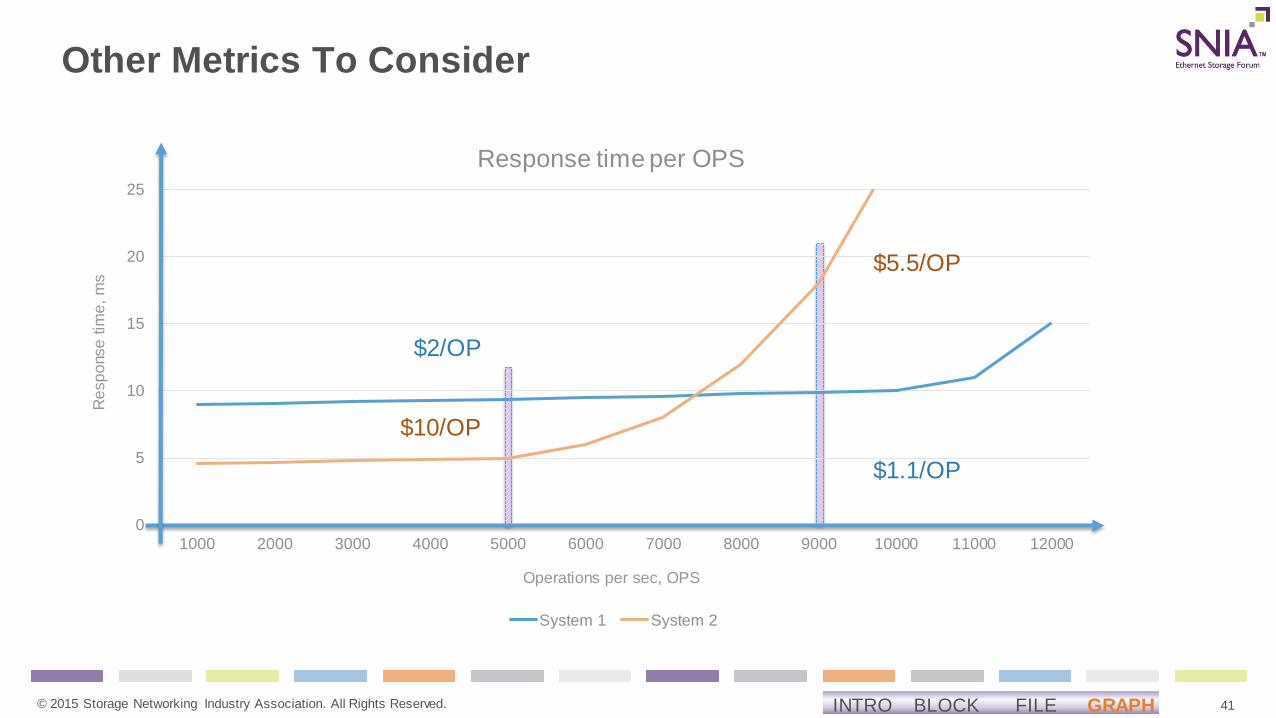
Other Metrics To Consider
41
0
5
10
15
20
25
1000 2000 3000 4000 5000 6000 7000 8000 9000 10000 11000 12000
Response time per OPS
System 1 System 2
Operations per sec, OPS
Re
sp
onse
tim
e,
ms
$2/OP
$10/OP
$1.1/OP
$5.5/OP
INTRO BLOCK FILE GRAPH

© 2015 Storage Networking Industry Association. All Rights Reserved.
Other Metrics To Consider
42
0
5
10
15
20
25
1000 2000 3000 4000 5000 6000 7000 8000 9000 10000 11000 12000
Response time per OPS
System 1 System 2
Operations per sec, OPS
Re
sp
onse
tim
e,
ms
$1.1/OP
$5.5/OP
$25K/U
$1K/U
$40/W
$140/W
} @9000 OPS @ 17 ms
} @9000 OPS @ 10 ms
INTRO BLOCK FILE GRAPH

© 2015 Storage Networking Industry Association. All Rights Reserved.
Other Metrics To Consider
43
0
5
10
15
20
25
1000 2000 3000 4000 5000 6000 7000 8000 9000 10000 11000 12000
Response time per OPS
System 1 System 2
Operations per sec, OPS
Re
sp
onse
tim
e,
ms
$1.1/OP
$5.5/OP
$25K/U
$1K/U
$40/W
$140/W
} @9000 OPS @ 17 ms
} @9000 OPS @ 10 ms
CONTEXTMAKES
METRICSMATTER
INTRO BLOCK FILE GRAPH

© 2015 Storage Networking Industry Association. All Rights Reserved.
Summary
44
System 1 System 2
GRAPH FUN
CONTEXTMAKES
METRICSMATTER
OPSCOUNT EVERY
PROTOCOL
OPERATION
PER SECOND
MB/SPAYLOAD SUM
OF EVERY
OPERATION
PER SECOND
TERMINOLOGY
IOPSCOUNT EVERY
IO OPERATION
PER SECOND
RESPONSE
TIMETIME TARGET
TAKES TO REPLY
TO AN IO
INTRO BLOCK FILE GRAPH

© 2015 Storage Networking Industry Association. All Rights Reserved.
Storage Performance Benchmarking
45
SYSTEM UNDER
TEST
METRICS AND
TERMINOLOGY
FILE
COMPONENTS
BLOCK
COMPONENTS
WORKLOAD
DEFINITIONS
TODAY FUTURE WEBCASTS

© 2015 Storage Networking Industry Association. All Rights Reserved.
After This Webcast
46
This Webcast and a PDF of the slides will be posted to the SNIA Ethernet
Storage Forum (ESF) website and available on-demand
http://www.snia.org/forums/esf/knowledge/webcasts
A full Q&A from this webcast, including answers to questions we couldn't get
to today, will be posted to the SNIA-ESF blog
http://sniaesfblog.org/
Follow us on Twitter @SNIAESF
Next Webcast - October 21st
“Storage Performance Benchmarking: Part 2”