Embed Size (px)
Citation preview
Registered Number: 99329
KELDA HOLDINGS LIMITED
ANNUAL REPORT AND FINANCIAL STATEMENTS
FOR THE YEAR ENDED 31 MARCH 2014
KELDA HOLDINGS LIMITED ANNUAL REPORT AND FINANCIAL STATEMENTS
FOR THE YEAR ENDED 31 MARCH 2014
Contents Strategic Report Our Business 1 Business Strategy 2 Business Performance 3 Financial Performance 34 Appendix - KPI Glossary of Terms 37 Corporate Governance Report for the year ended 31 March 2014 38 Directors’ Report for the year ended 31 March 2014 48
Statement of Directors’ Responsibilities for the year ended 31 March 2014 60
Directors’ Remuneration Report for the year ended 31 March 2014 61 Independent auditors’ report to the members of Kelda Holdings Limited 79 Financial Statements 81
Group Income Statement 81 Group Statement of Comprehensive Income 82 Group Balance Sheet 83
Group Statement of Changes in Equity 84 Group Cash Flow statement 85 Notes to the Group Financial Statements 86 Company Balance Sheet 146 Notes to the Company Financial Statements 147
Kelda Holdings Limited Strategic Report for the year ended 31 March 2014
1
OUR BUSINESS Kelda Holdings Limited (the Company) and its subsidiaries, joint ventures and associates (the Group) is made up of several businesses: Yorkshire Water Yorkshire Water Services Limited (Yorkshire Water) is the principal UK subsidiary of the Group, providing water and waste water services to more than 4.9 million people and 130,000 businesses. Every day, Yorkshire Water supplies around 1.3 billion litres of water to homes and businesses in Yorkshire. Through the efficient operation of its extensive waste water network and treatment facilities, it also ensures that the region’s domestic and industrial waste is returned safely to the environment. Business strategy: Yorkshire Water’s vision is ‘Taking responsibility for the water environment for good’. There are six strategic objectives that shape everything the business does:
• Trusted company; • Safe water; • Excellent catchments, rivers and coasts; • Water efficient regions; • Sustainable resources; and • Strong financial foundations.
UK Service Operations Kelda Water Services Kelda Water Services Limited (KWS) is a major participant in the UK water and waste water contract operations market, with contracts during the year 2013/14 in England, Scotland and Northern Ireland. Business strategy:
• Leveraging the value from Group assets and skills. • Maximising value from our existing business. • Continuing to grow through new opportunities in the water, waste water and related
markets. Loop Loop Customer Management Limited (Loop) specialises in cost effective customer relationship management. Loop’s main contract is to provide customer service support to Yorkshire Water. KeyLand KeyLand Developments Limited (KeyLand) adds value to the Group’s surplus property assets, usually by obtaining planning permission for the most beneficial use and selling into the market or undertaking development in partnership with others. The results of KeyLand include the Group’s share of its associates and joint ventures. Business strategy:
• Adding value to the Group’s surplus property assets and to maximise proceeds from the sale of those assets.
Kelda Holdings Limited Strategic Report (continued) for the year ended 31 March 2014
2
BUSINESS STRATEGY The Group has a vision – ‘taking responsibility for the water environment for good’. The essence of the vision is doing what’s right - for our customers, colleagues, partners and the environment. To achieve the vision the Group has developed a plan and the plan has been named Blueprint. Blueprint is something everyone can contribute towards to make a difference. Our strategic objectives: To deliver the plan the Group has developed six Strategic Business Objectives (SBOs). These SBOs shape everything the Group does. These are our six strategic objectives, that shape everything we do: Trusted company – The way the Group does business means its products, services and promises are trusted by all our stakeholders, now and in the future. Safe Water – The Group works safely to protect public health by ensuring drinking water is always safe to drink and waste water never harms customers or communities at any point in the process. Excellent catchments, rivers and coasts – The Group maintains and improves the water environment from source to sea and influences others to do the same. Water efficient regions – The Group ensures water needs are met now and in the future by using water wisely and inspiring others to do the same. Sustainable resources – The Group is efficient and effective now and in the future, with an industry leading workforce, zero waste and a responsible supply chain. Strong financial foundations – The Group delivers services to customers at a price they are willing and able to pay, whilst providing investors with returns that attract long-term investment. The above strategic business objectives apply to all business of the Group. Kelda Water Services, Loop and KeyLand have additional strategic objectives specific to their circumstances.
Kelda Holdings Limited Strategic Report (continued) for the year ended 31 March 2014
3
BUSINESS PERFORMANCE Yorkshire Water Services Limited (YW) An overview is provided below of YW performance by examining progress towards each of the six SBOs which summarise the Group strategy to achieve its vision of: ‘taking responsibility for the water environment for good’. Reported under each SBO is:
• A table showing performance against the Office of Water Services’ (Ofwat) Key Performance Indicators (KPIs) for the water industry. More information on these measures and performance in the Risk and Compliance Statement, available at: www.yorkshirewater.com/reports
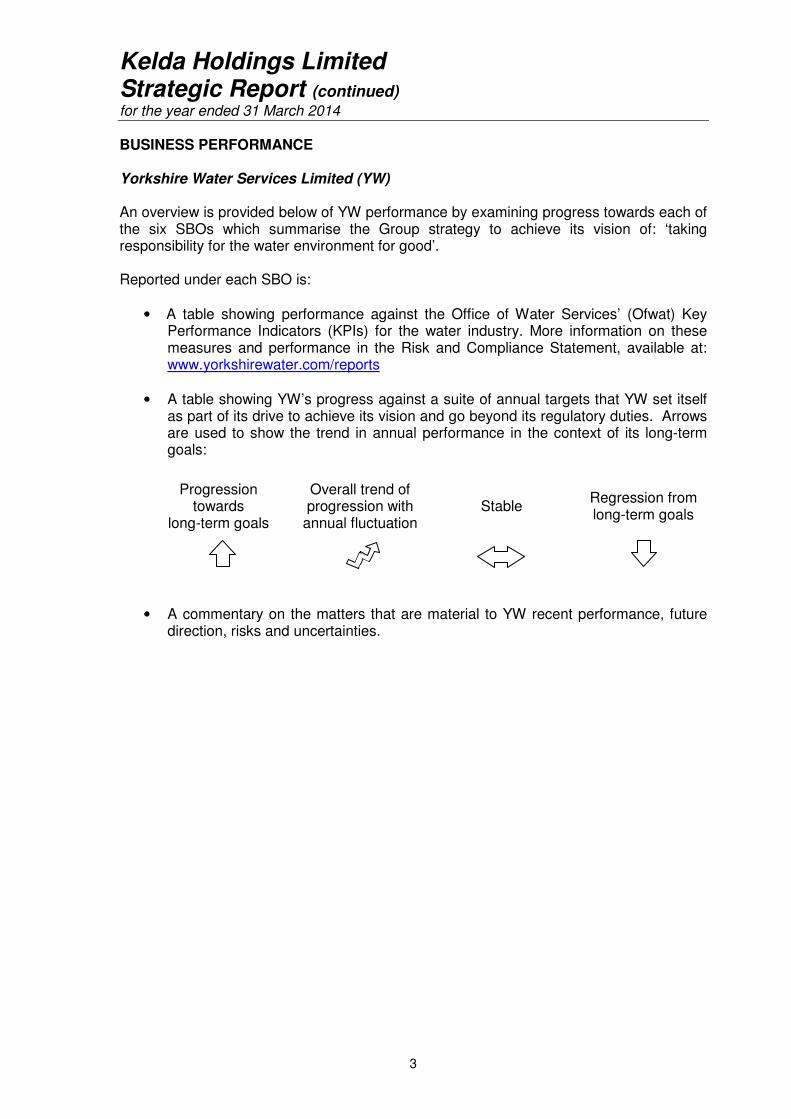
• A table showing YW’s progress against a suite of annual targets that YW set itself
as part of its drive to achieve its vision and go beyond its regulatory duties. Arrows are used to show the trend in annual performance in the context of its long-term goals:
Progression towards
long-term goals
Overall trend of progression with
annual fluctuation Stable
Regression from long-term goals
• A commentary on the matters that are material to YW recent performance, future
direction, risks and uncertainties.
Kelda Holdings Limited Strategic Report (continued) for the year ended 31 March 2014
4
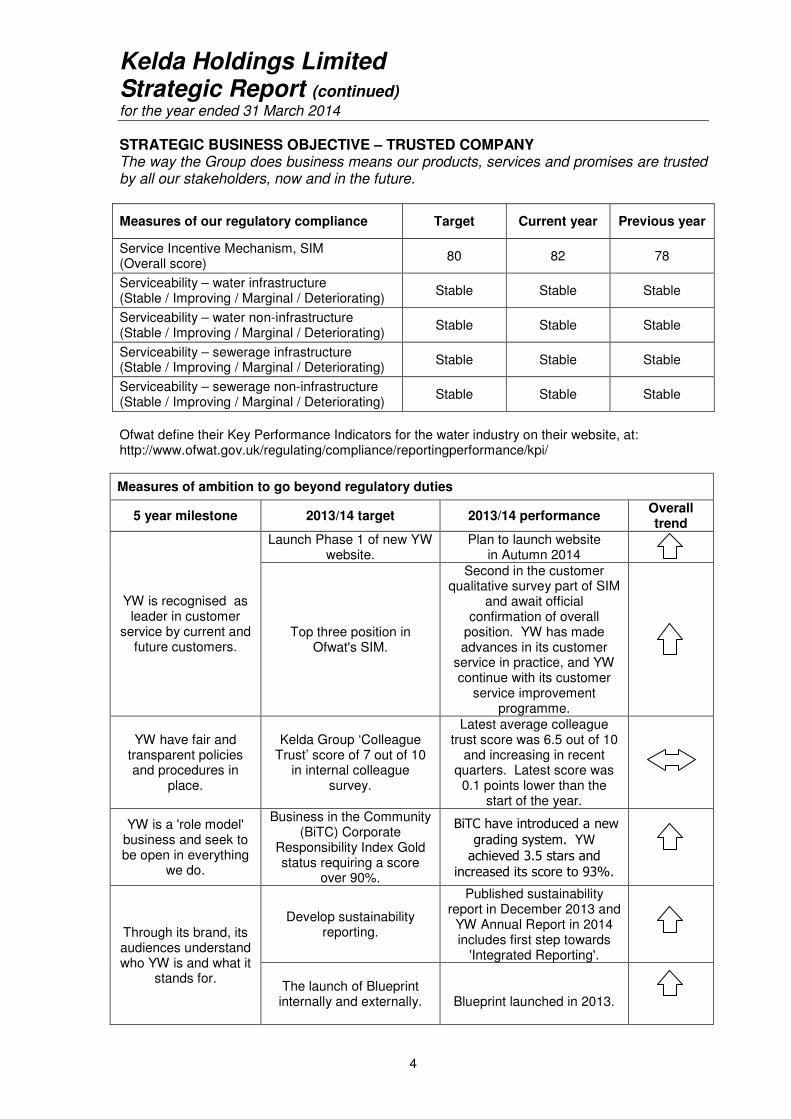
STRATEGIC BUSINESS OBJECTIVE – TRUSTED COMPANY The way the Group does business means our products, services and promises are trusted by all our stakeholders, now and in the future.
Measures of our regulatory compliance Target Current year Previous year
Service Incentive Mechanism, SIM (Overall score)
80 82 78
Serviceability – water infrastructure (Stable / Improving / Marginal / Deteriorating)
Stable Stable Stable
Serviceability – water non-infrastructure (Stable / Improving / Marginal / Deteriorating)
Stable Stable Stable
Serviceability – sewerage infrastructure (Stable / Improving / Marginal / Deteriorating)
Stable Stable Stable
Serviceability – sewerage non-infrastructure (Stable / Improving / Marginal / Deteriorating)
Stable Stable Stable
Ofwat define their Key Performance Indicators for the water industry on their website, at: http://www.ofwat.gov.uk/regulating/compliance/reportingperformance/kpi/
Measures of ambition to go beyond regulatory duties
5 year milestone 2013/14 target 2013/14 performance Overall trend
YW is recognised as leader in customer
service by current and future customers.
Launch Phase 1 of new YW website.
Plan to launch website in Autumn 2014
Top three position in Ofwat's SIM.
Second in the customer qualitative survey part of SIM
and await official confirmation of overall
position. YW has made advances in its customer
service in practice, and YW continue with its customer
service improvement programme.
YW have fair and transparent policies and procedures in
place.
Kelda Group ‘Colleague Trust’ score of 7 out of 10
in internal colleague survey.
Latest average colleague trust score was 6.5 out of 10
and increasing in recent quarters. Latest score was
0.1 points lower than the start of the year.
YW is a 'role model' business and seek to be open in everything
we do.
Business in the Community (BiTC) Corporate
Responsibility Index Gold status requiring a score
over 90%.
BiTC have introduced a new
grading system. YW
achieved 3.5 stars and increased its score to 93%.
Through its brand, its audiences understand who YW is and what it
stands for.
Develop sustainability reporting.
Published sustainability report in December 2013 and
YW Annual Report in 2014 includes first step towards
'Integrated Reporting'.
The launch of Blueprint internally and externally.
Blueprint launched in 2013.
Kelda Holdings Limited Strategic Report (continued) for the year ended 31 March 2014
5
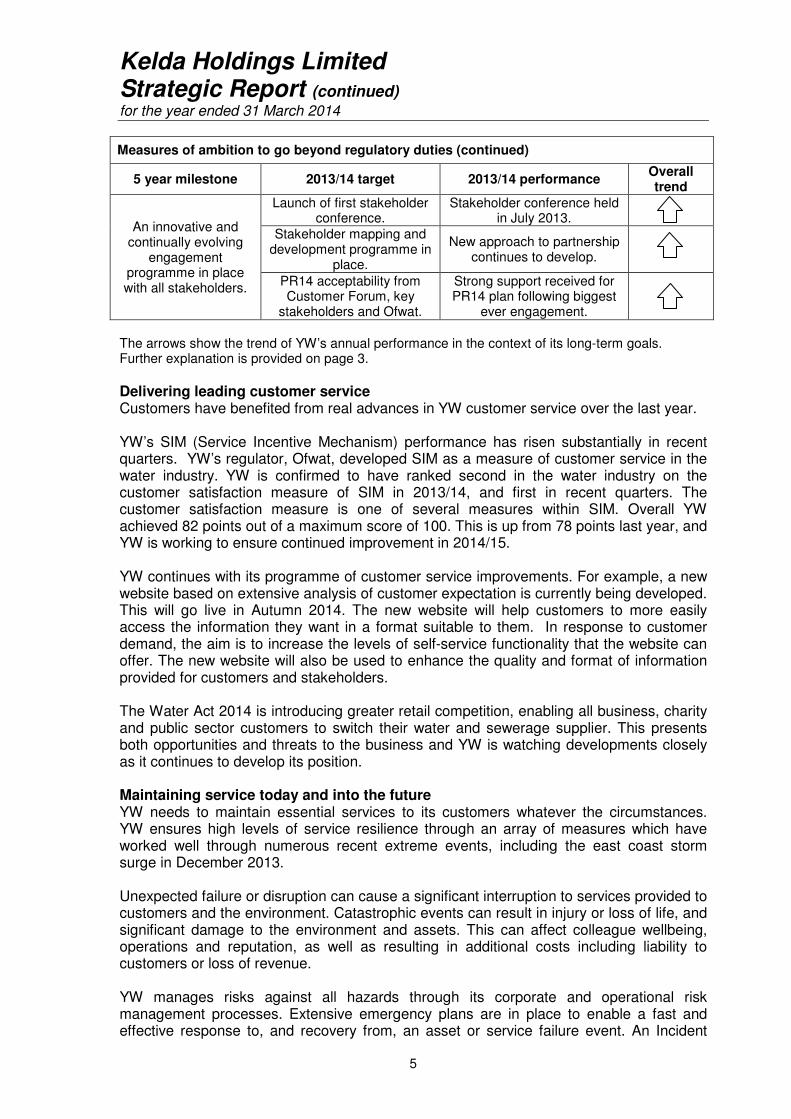
Measures of ambition to go beyond regulatory duties (continued)
5 year milestone 2013/14 target 2013/14 performance Overall trend
An innovative and continually evolving
engagement programme in place with all stakeholders.
Launch of first stakeholder conference.
Stakeholder conference held in July 2013.
Stakeholder mapping and development programme in
place.
New approach to partnership continues to develop.
PR14 acceptability from Customer Forum, key
stakeholders and Ofwat.
Strong support received for PR14 plan following biggest
ever engagement.
The arrows show the trend of YW’s annual performance in the context of its long-term goals. Further explanation is provided on page 3. Delivering leading customer service Customers have benefited from real advances in YW customer service over the last year. YW’s SIM (Service Incentive Mechanism) performance has risen substantially in recent quarters. YW’s regulator, Ofwat, developed SIM as a measure of customer service in the water industry. YW is confirmed to have ranked second in the water industry on the customer satisfaction measure of SIM in 2013/14, and first in recent quarters. The customer satisfaction measure is one of several measures within SIM. Overall YW achieved 82 points out of a maximum score of 100. This is up from 78 points last year, and YW is working to ensure continued improvement in 2014/15. YW continues with its programme of customer service improvements. For example, a new website based on extensive analysis of customer expectation is currently being developed. This will go live in Autumn 2014. The new website will help customers to more easily access the information they want in a format suitable to them. In response to customer demand, the aim is to increase the levels of self-service functionality that the website can offer. The new website will also be used to enhance the quality and format of information provided for customers and stakeholders. The Water Act 2014 is introducing greater retail competition, enabling all business, charity and public sector customers to switch their water and sewerage supplier. This presents both opportunities and threats to the business and YW is watching developments closely as it continues to develop its position. Maintaining service today and into the future YW needs to maintain essential services to its customers whatever the circumstances. YW ensures high levels of service resilience through an array of measures which have worked well through numerous recent extreme events, including the east coast storm surge in December 2013. Unexpected failure or disruption can cause a significant interruption to services provided to customers and the environment. Catastrophic events can result in injury or loss of life, and significant damage to the environment and assets. This can affect colleague wellbeing, operations and reputation, as well as resulting in additional costs including liability to customers or loss of revenue. YW manages risks against all hazards through its corporate and operational risk management processes. Extensive emergency plans are in place to enable a fast and effective response to, and recovery from, an asset or service failure event. An Incident
Kelda Holdings Limited Strategic Report (continued) for the year ended 31 March 2014
6
Management Framework provides a staged response to ensure the effective allocation of resource to any incident. To ensure that YW can provide services today and long into the future, over a million pounds a day is invested to maintain and enhance the legacy of assets and infrastructure. This includes over 700 treatment works, thousands of pumping stations and enough pipes to stretch around the world. In 2013/14 YW achieved “stable serviceability” in all four asset categories for the second year running. Serviceability is a measure used by the water industry to demonstrate the effectiveness of asset maintenance. Further details on YW’s serviceability performance can be found in YW’s Risk and Compliance Statement publication, available at: www.yorkshirewater.com.reports. Planning for long-term challenges like population growth, climate change and decreasing availability of resources is also in progress. In 2013 YW published a suite of documents about its plans for the future, called Blueprint for Yorkshire. One document examines, and is called, ‘the next 25 years’. YW’s ‘climate change strategy’ explains how it is working to ensure it can affordably maintain and enhance services in the changing climate, and cost-effectively reduce its carbon emissions. Both reports are available at www.BlueprintForYorkshire.com. YW is required to publish an annual Risk and Compliance Statement each year by its regulator, Ofwat. In this year’s Risk and Compliance Statement the YW board identified pollution incidents and discharge permits compliance as material or potentially material risks. Mitigation plans have been put in place to tackle the potential risks, details of which can be obtained in the Statement publication, available at: www.yorkshirewater.com.reports. Details of these risks and the management responses are also found in this report. Further details on company performance and management responses to both these risk areas can be found in the Excellent Catchments, Rivers and Coasts SBO section of this report. Engaging with customers and stakeholders In 2013/14 YW completed its biggest ever customer and stakeholder engagement programme. To inform the development of its business plan for the period from 2015 to 2020 and beyond, the views of more than 30,000 customers and 100 stakeholder groups were obtained. YW established an independent Customer Forum to help ensure that its customers had a fair say in its plans. The independent Forum represents the needs of customers and the environment in the Yorkshire region. The Forum challenged YW to be more transparent, to strike the right balance between customer needs and environmental leadership, and to do everything it could to keep bills low. YW will continue to work with the Forum in the future to ensure that customers have an on-going say in its plans. YW held a stakeholder conference at the Yorkshire Event Centre in Harrogate in July 2013, to share and discuss its plans.The event was attended by representatives from more than 80 different organisations, including Local Authorities, NGO’s, businesses, academic institutions and investor groups. YW aims to have an innovative and continually evolving engagement programme in place with all its stakeholders. One way this will be achieved is through a new research and
Kelda Holdings Limited Strategic Report (continued) for the year ended 31 March 2014
7
insight team who will manage regular engagement activities and help ensure decisions are based on customer insight. Full details of YW customer engagement and plans can be found at: www.BlueprintForYorkshire.com. Working in partnership Working in partnership is becoming ever more important to effectively and efficiently address priorities such as flooding and pollution. YW has many examples of where it is already working with others to deliver greater benefits for the region, but it also recognises that there is a need to do more of this. YW is currently formalising its approach to partnership and stakeholder relationship management. This will help YW to ensure that it manages stakeholder relationships in a tailored way that best suits both parties, and that it is effective in developing partnerships where they have the biggest benefits for its customers and wider society. YW has worked in partnership with various organisations for many years. For example:
• YW worked closely with the Environment Agency and Local Authorities on the regions flood management by sharing data and hydraulic models, and sharing resources in emergencies;
• YW is an active member of the Yorkshire Bathing Water Partnership that has been successful in growing the number of Blue Flag beaches in the region; and
• YW continues to restore and protect vast areas of Yorkshire’s uplands by working closely with organisations like the Yorkshire Peat Partnership and local land owners.
Supporting the community YW leads an extensive community engagement programme to go beyond its regulatory duties by providing support and help-in-kind to a wide variety of different organisations across Yorkshire. YW encourages and supports colleagues in volunteering, charitable giving and community involvement. One in three employees is active in a wide range of supported community activities. Support was provided in three key areas:
• Education – raising awareness of young people and local communities on the value of water and their role and YW’s in safeguarding this precious resource;
• Environment - playing a key role as one of Yorkshire's largest landowners in enhancing the natural and built environment; and
• Empowerment - providing opportunities for colleagues to share skills with the local community through employee-supported volunteering.
Benchmarking the approach to being a responsible business YW uses the Business in the Community (BiTC) Corporate Responsibility Index as one way to benchmark its performance against its peers each year. The BiTC Index is the UK’s leading voluntary benchmark of corporate responsibility. In 2013/14 YW’s score increased to 93%, up from 90% the previous year. YW has also been awarded a BiTC Big Tick in their Responsible Business Awards 2013/14. The increase in the score and the success in winning a Big Tick provides external assurance that YW is among the leaders in corporate social responsibility and sustainability. Managing colleague trust The strong performance achieved in 2013/14 was as a result of the hard work, commitment and energy of all colleagues. It was a demanding year of change, not least because of an organisational restructure and change to pension plans. In addition,
Kelda Holdings Limited Strategic Report (continued) for the year ended 31 March 2014
8
colleagues were affected by the external national debate in the media about YW and other utilities. Generally, colleagues say they are proud to work for YW as a provider of essential and quality water and waste services. However, through internal surveys and regular leadership feedback sessions, colleagues indicated that trust fell in the second quarter of 2013/14. Recognising that trust is something that needs regular reinforcement, YW’s business leaders have made colleague trust a business priority in 2014/15. Trust is already a strong foundation for YW and its plan is to continue to build on this, for example through more visible leadership, stronger internal communications and engagement, improved problem resolution, greater employee recognition and increased partnership working with trade unions. Our corporate structure and tax position We provide below an explanation of the Group’s corporate structure and tax position. In addition to the information we provide below, a summary overview of our principal subsidiary Yorkshire Water can be found at: http://www.yorkshirewater.com/reports Corporate structure The structure of the Kelda Group has developed and changed since privatisation of the water industry in 1989. A description of the main operating companies in the Group is given below. A project is taking place to streamline the corporate structure to remove dormant or non-trading companies where it is efficient and expedient to do so. Details of the equity ownership of the company can be found on pages 52 and 53. Details of the debt and capital structures of the company can be found on its website at: http://www.keldagroup.com Kelda Finance (No.2) Limited ("KF2") and Kelda Finance (No.3) plc ("KF3") have been established to raise debt finance (KF2 bank debt, KF3 bond debt) for the Kelda group of companies, outside of the Yorkshire Water ring fenced financing group. Kelda Finance (No.1) Limited has been established to act as a guarantor for KF2 and KF3. Throughout the Group, we abide by the following overriding principles in everything we do regarding our corporate structure and approach to taxation:
•we have and follow a tax policy which requires that we fully comply with the letter and the spirit of UK tax law;
•we structure ourselves to be able to borrow money at the lowest possible rates in order to support low bills for our customers and fair returns for our investors; and
•we do not establish overseas companies in order to avoid paying UK tax.
Yorkshire Water and Whole Business Securitisation In order to borrow at the lowest possible rates, Yorkshire Water established a financing structure known as a "whole business securitisation" (WBS) in 2009. The WBS enhances the creditworthiness of Yorkshire Water by setting strict rules that demonstrate to lenders the company is a safe and reliable business to invest in. Lenders are therefore more prepared to lend to Yorkshire Water at lower rates of interest than would otherwise be the case. Customers share the benefit of the lower rates of interest because the rates at which the industry borrows are factored into prices.
Kelda Holdings Limited Strategic Report (continued) for the year ended 31 March 2014
9
This WBS works by placing a protective ring-fence around Yorkshire Water's business which includes: the way it operates; the way it trades with other Group companies; and, the way it finances itself. The protections include limits on borrowings, dividends and the ability to lend money to other Kelda companies. The protections also require profits to more than cover the amount of interest that Yorkshire Water pays. To enable the WBS it was necessary for Yorkshire Water to establish three companies incorporated in the Cayman Islands. These are:
•Yorkshire Water Services Bradford Finance Limited (issues new corporate debt); •Yorkshire Water Services Odsal Finance Limited (issuer of legacy corporate debt);
and •Yorkshire Water Services Odsal Finance Holdings Limited (a non-trading, holding
company). Due to technical reasons applicable at the time that our owners purchased the Kelda Group and we set up the WBS, it was necessary to establish these companies in the Cayman Islands in order to raise debt listed on bond markets. The technical requirements for these companies are no longer relevant but the cost of unwinding this structure is prohibitive. All three companies are wholly and exclusively resident for tax in the UK and file their tax returns only with Her Majesty’s Revenue and Customs (HMRC). This means that any profit or loss made by these companies is subject only to UK tax. Other Group companies Other companies in the Group fall into three categories. 1.Those operating and resident for tax in the UK The following Group companies operate in the UK and are wholly and exclusively resident for tax in the UK:
•Kelda Water Services Limited (KWS) – operates water and waste water contracts across the UK;
•Loop Customer Management Limited (Loop) – delivers customer service support to Yorkshire Water that includes billing, debt recovery and incident management; and
•KeyLand Developments Limited (KeyLand) – manages the Group's surplus property assets, either on its own or in partnership with outside organisations.
2.Those incorporated overseas and resident for tax in the UK In addition to those companies registered in the Cayman Islands, noted above, the Group contains two other companies that are incorporated in jurisdictions outside the UK but which are wholly and exclusively resident for tax in the UK:
•Kelda Holdings Limited - the ultimate parent company of Yorkshire Water. The company is incorporated in Jersey to allow greater choice as to the manner in which distributions can be made to shareholders; and
•Yorkshire Water Holdings BV - a subsidiary incorporated in the Netherlands. This company is a legacy from previous activity and does not trade.
3.Those incorporated and resident for tax overseas The Group contains three companies that are incorporated and are resident for tax in jurisdictions outside the UK:
•Kelda Group Inc. and KGI Bridgeport Company - two subsidiaries that administered a sewerage contract in Connecticut until the contract ended in December 2013. The companies are resident for tax in the USA and are in the
Kelda Holdings Limited Strategic Report (continued) for the year ended 31 March 2014
10
process of winding down their operations. The companies did not trade with the rest of Kelda Group; and
•Ridings Insurance Company Limited - insurance company operating and resident for tax purposes in the Isle of Man. The Group operates this insurance company to allow flexibility in how it insures its public liability where the insurance market proves uneconomical or unable to supply the required cover. In 2013/14 this company’s turnover was less than £250,000.
Kelda Holdings Limited Strategic Report (continued) for the year ended 31 March 2014
11
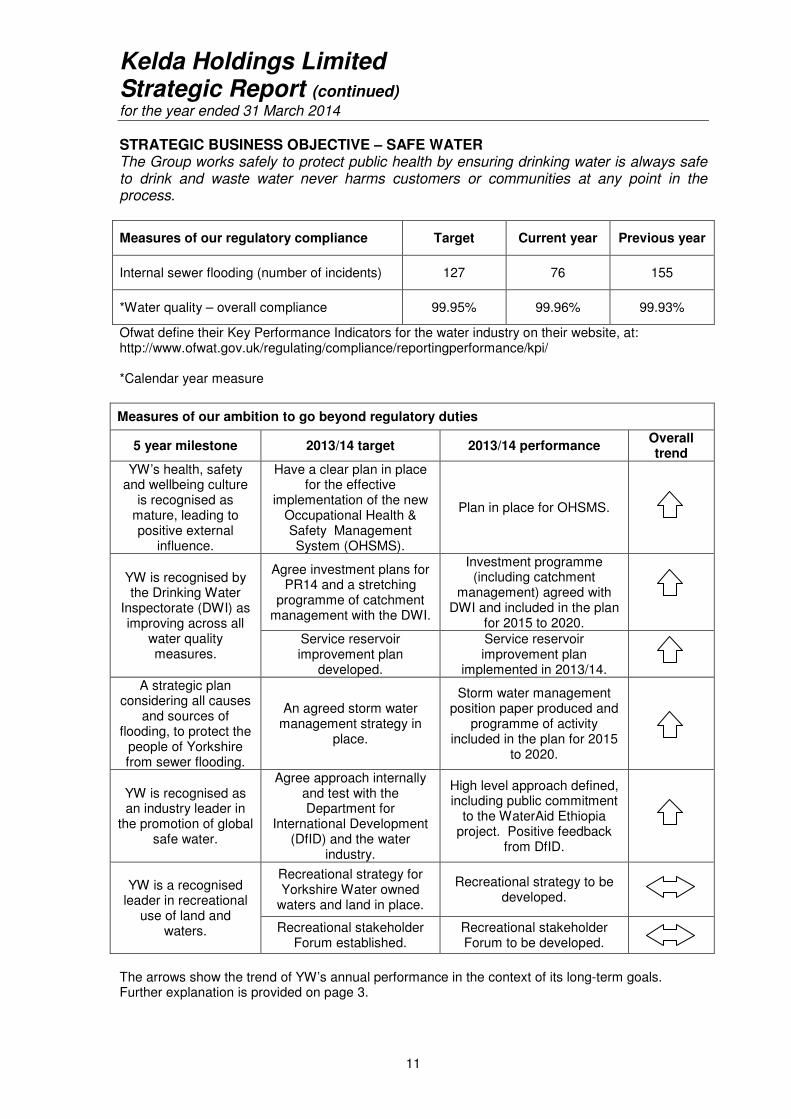
STRATEGIC BUSINESS OBJECTIVE – SAFE WATER
The Group works safely to protect public health by ensuring drinking water is always safe to drink and waste water never harms customers or communities at any point in the process.
Measures of our regulatory compliance Target Current year Previous year
Internal sewer flooding (number of incidents) 127 76 155
*Water quality – overall compliance 99.95% 99.96% 99.93%
Ofwat define their Key Performance Indicators for the water industry on their website, at: http://www.ofwat.gov.uk/regulating/compliance/reportingperformance/kpi/ *Calendar year measure
Measures of our ambition to go beyond regulatory duties
5 year milestone 2013/14 target 2013/14 performance Overall trend
YW’s health, safety and wellbeing culture
is recognised as mature, leading to positive external
influence.
Have a clear plan in place for the effective
implementation of the new Occupational Health & Safety Management System (OHSMS).
Plan in place for OHSMS.
YW is recognised by the Drinking Water
Inspectorate (DWI) as improving across all
water quality measures.
Agree investment plans for PR14 and a stretching
programme of catchment management with the DWI.
Investment programme (including catchment
management) agreed with DWI and included in the plan
for 2015 to 2020.
Service reservoir improvement plan
developed.
Service reservoir improvement plan
implemented in 2013/14.
A strategic plan considering all causes
and sources of flooding, to protect the
people of Yorkshire from sewer flooding.
An agreed storm water management strategy in
place.
Storm water management position paper produced and
programme of activity included in the plan for 2015
to 2020.
YW is recognised as an industry leader in
the promotion of global safe water.
Agree approach internally and test with the Department for
International Development (DfID) and the water
industry.
High level approach defined, including public commitment
to the WaterAid Ethiopia project. Positive feedback
from DfID.
YW is a recognised leader in recreational
use of land and waters.
Recreational strategy for Yorkshire Water owned
waters and land in place.
Recreational strategy to be developed.
Recreational stakeholder Forum established.
Recreational stakeholder Forum to be developed.
The arrows show the trend of YW’s annual performance in the context of its long-term goals. Further explanation is provided on page 3.
Kelda Holdings Limited Strategic Report (continued) for the year ended 31 March 2014
12
Putting people’s health, safety and wellbeing first To achieve the vision and SBOs, it is essential that YW works to prevent harm and protect health across all stages of its business operations, environments and communities. The drive for continual improvement is supported by an Occupational Health & Safety Management System (OHSMS). This enables the company to enhance its health and safety performance and to maintain a clear focus on meeting the needs of our people, stakeholders, customers and members of the public. This is at the heart of the company approach. Further information on the Group’s health and safety approach is detailed in the Directors’ report on pages 56 and 57. Maintaining excellent drinking water quality Protecting public health is a primary duty. Drinking water quality within Yorkshire remains excellent, amongst the best in the world. In 2013/14, YW’s compliance increased to 99.96% of thousands of samples meeting tight regulatory standards. YW completed a large service reservoir inspection and improvement programme in 2013/14 to contribute to this performance improvement and manage a risk of microbiological failures. Further details on YW’s water quality performance can be found in the Risk and Compliance Statement publication, available at: www.yorkshirewater.com.reports. Over the past two decades, raw water quality has deteriorated in many catchment areas. The more polluted raw water is, the more the need to treat it to make it fit for drinking. A twin-track approach is used to ensure that customers receive high quality drinking water despite the deteriorating raw water quality. YW is investing to enhance treatment capabilities where the probability of failure presents an unacceptable risk to customers. The long-standing programme of capital investment will continue with a further £49m of investment in the period from 2015 to 2020, including action at six large treatment works. Investment in catchment management, as a primary long-term response to address the issue at source, is also planned. The approach to catchment management is outlined in the section on the Excellent Catchments, Rivers and Coasts SBO. Reducing flood risk In 2013/14 YW removed 66 properties from being at risk of sewer flooding and reduced the overall number of properties at risk of sewer flooding on the regulated risk register to 204 across the region. YW continues to invest in the region’s drainage network and reduce the number of properties at risk from sewer flooding. Further details on YW’s sewer flooding performance can be found in the Risk and Compliance Statement publication, available at: www.yorkshirewater.com.reports. YW played an active role in the response to the east coast storm surge in December 2013, described as the most serious UK storm surge for over 60 years. YW had representatives at the two Strategic Command Centres which operated in East and North Yorkshire to manage the response. YW assets were utilised in Hull to remove 35,000 tonnes of water from the city. Services were maintained, despite damage to YW assets. YW also offered assistance to the Environment Agency (EA) during the extensive flooding to the south and west of the UK during the early part of 2014. YW is working in ever closer partnership with other flood management authorities, for example:
Kelda Holdings Limited Strategic Report (continued) for the year ended 31 March 2014
13
• YW worked with Calderdale MBC and the EA on reducing flood risk in the Calder Valley;
• YW is sharing information with the Lead Local Flood Authorities identifying relatively low cost joint funding flood schemes, notably in Sheffield and East Riding of Yorkshire; and
• YW is playing an active part in the Yorkshire Regional Flood and Coastal Committee (RFCC) and all four sub-regional strategic flood management partnerships, by sharing its future flood and investment plans and informing the RFCC of the investment framework and plans.
YW is also investing to protect its own assets from flood risk to enhance the resilience of its services. For example, YW has invested at Hull and Market Weighton to provide a 1 in 1,000 year level of protection at these key sites, and YW is investing at Moor Monkton in 2014/15. Extreme weather and urban growth are causing increasing pressure on the sewer network and the risk of flooding. YW is planning for the future and produced both its climate change strategy and storm water management position paper in 2013. YW will continue to invest to mitigate the risk and manage the consequences of sewer flooding. One part of the plans is a new £8m fund for flood partnership projects. The company is also focusing on customer behaviour by developing education and awareness programmes to sewer blockages caused by customer activities, in particular disposal of fats, oil and greases (FOGs), nappies, wipes and other materials which are inappropriately disposed of via the sewer network. For example, YW has been trialling an approach of customer engagement combined with above ground collection of FOGs in an area of Bradford where the company has observed repeated sewer blockages. Supporting global safe water As Kelda Group, we recognise a moral obligation to support those who do not have access to clean safe drinking water and safe sanitation. Around the world, 3.4 million people die each year from water related diseases and 780 million people lack access to safe clean drinking water. We have a long history of fund raising for WaterAid, and our SBO ambition is to go much further. Our aim is to be globally recognised as a leader in the delivery of safe water. We have recently launched a strategic partnership with WaterAid Ethiopia. This will deliver knowledge sharing on water and sanitation, provide infrastructure support, fundraising and much more. We recognise that we are at the early stages of a long-term ambition and we continue to develop our approach. Providing access to land YW is one of the largest land and open-water owners in Yorkshire. YW owns approximately 29,000 hectares of land which includes upland moors, woodland of mixed age and species, reservoirs, and the land that is rented to farmers. For many years YW has provided open access to much of its large estate, particularly the woodland and upland moors. This has provided a wide range of recreational opportunities that include 100 km of permissive footpath, 33 km of permissive bridleway/cycle routes, two nature reserves, two fisheries and a range of ancillary facilities such as car parks, picnic sites, toilets and information points in addition to 1,100 km of public rights of way and Countryside and Rights of Way Act (CRoW) access land.
Kelda Holdings Limited Strategic Report (continued) for the year ended 31 March 2014
14
YW works to ensure large numbers of people can safely enjoy its land and YW is dedicated to increasing its recreational offering through direct management and lease arrangements. The Tour de France came to Yorkshire in 2014, and YW played its part to make sure the event was a global success, and that YW’s land and waters supported the growing recreational demand brought by the event. Find out more on the website at: http://www.yorkshirewater.com/walks-and-leisure.aspx
Kelda Holdings Limited Strategic Report (continued) for the year ended 31 March 2014
15
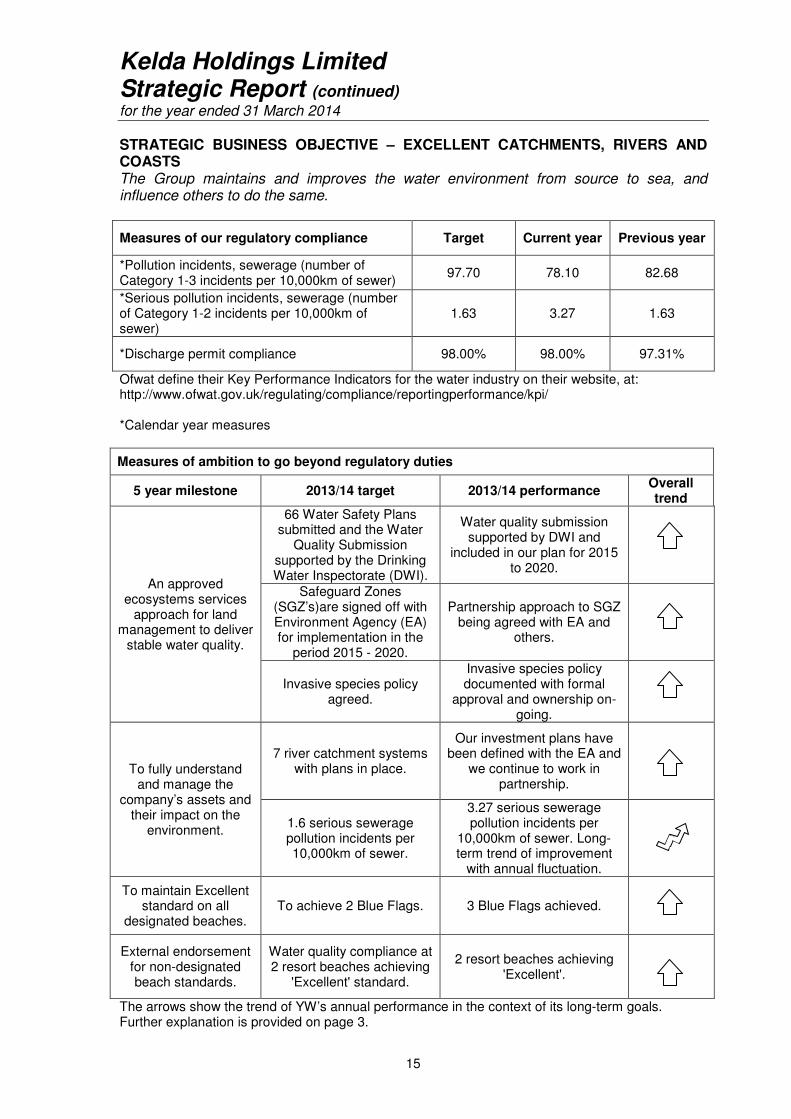
STRATEGIC BUSINESS OBJECTIVE – EXCELLENT CATCHMENTS, RIVERS AND COASTS The Group maintains and improves the water environment from source to sea, and influence others to do the same.
Measures of our regulatory compliance Target Current year Previous year
*Pollution incidents, sewerage (number of Category 1-3 incidents per 10,000km of sewer)
97.70 78.10 82.68
*Serious pollution incidents, sewerage (number of Category 1-2 incidents per 10,000km of sewer)
1.63 3.27 1.63
*Discharge permit compliance 98.00% 98.00% 97.31%
Ofwat define their Key Performance Indicators for the water industry on their website, at: http://www.ofwat.gov.uk/regulating/compliance/reportingperformance/kpi/ *Calendar year measures
Measures of ambition to go beyond regulatory duties
5 year milestone 2013/14 target 2013/14 performance Overall trend
An approved ecosystems services
approach for land management to deliver
stable water quality.
66 Water Safety Plans submitted and the Water
Quality Submission supported by the Drinking Water Inspectorate (DWI).
Water quality submission supported by DWI and
included in our plan for 2015 to 2020.
Safeguard Zones (SGZ’s)are signed off with Environment Agency (EA) for implementation in the
period 2015 - 2020.
Partnership approach to SGZ being agreed with EA and
others.
Invasive species policy agreed.
Invasive species policy documented with formal
approval and ownership on-going.
To fully understand and manage the
company’s assets and their impact on the
environment.
7 river catchment systems with plans in place.
Our investment plans have been defined with the EA and
we continue to work in partnership.
1.6 serious sewerage pollution incidents per 10,000km of sewer.
3.27 serious sewerage pollution incidents per
10,000km of sewer. Long-term trend of improvement
with annual fluctuation.
To maintain Excellent standard on all
designated beaches. To achieve 2 Blue Flags. 3 Blue Flags achieved.
External endorsement for non-designated beach standards.
Water quality compliance at 2 resort beaches achieving
'Excellent' standard.
2 resort beaches achieving 'Excellent'.
The arrows show the trend of YW’s annual performance in the context of its long-term goals. Further explanation is provided on page 3.
Kelda Holdings Limited Strategic Report (continued) for the year ended 31 March 2014
16
Reducing pollution and enhancing river water quality YW is responsible for collecting, treating and returning about 1 billion litres of waste water safely back to the environment every day. Over the last 20 years, by investing to enhance waste water treatment capabilities, YW has delivered a step change in river water quality. YW improved its performance on waste water treatment in 2013/14, with discharge permit compliance reaching 98%. YW also continued its on-going capital investment programme, responding to new legislative drivers and population growth. Plans are in place to further improve discharge permit compliance, details of which can be obtained in the Risk and Compliance Statement publication available at: www.yorkshirewater.com.reports. The total number of pollution incidents from the sewer network has continued to reduce over recent years, from 95.10 incidents per 10,000km of sewer in 2011, to 82.68 in 2012, to 78.1 last year (2013). The number of the most serious pollution incidents (Category 1 and 2) has fluctuated in recent years but shows an overall trend of improvement. Performance has fallen from 4.25 incidents per 10,000km of sewer in 2011, to YW’s best ever performance in 2012 with 1.63 incidents per 10,000 km of sewer, increasing to 3.27 in 2013. Overall, YW’s pollution performance has improved over the course of this Asset Management Period (2010 to 2015). This improvement can be attributed to the Pollution Reduction Plan, which will continue to run throughout 2014/15. YW’s plan includes a range of people, process, technology and capital investment activities. In 2014 YW will be trialling a new proactive intervention technique using weather trigger levels. It is known that dry spells cause blockages that can lead to pollution incidents so YW will jet at hot spot locations after a set number of consecutive dry days to break up and remove sewer litter before it becomes a problem. YW has been working with the EA to model the impact of discharges across the region to understand the ecological implications. Together, a programme of environmental investment and investigation needs, totalling over £300m for the period from 2015 to 2020 has been defined. YW has prioritised a series of sites to remove or bypass barriers to fish passage and in 2013 opened its first fish pass site, at Rodley in Leeds. Investing in the region’s bathing waters Investment of £110m to enhance Yorkshire’s coastal water quality is nearing completion. YW is improving the treatment capabilities of its coastal waste water treatment works, and increasing the storage capacity of its sewer network at key locations. This will help secure a step change in the region’s bathing water quality and will ensure the region’s compliance with the revised Bathing Water Directive which introduces tighter legal standards from 2015. YW is an active member of the multi-agency Yorkshire Bathing Water Partnership. This group of organisations is working together to align the region’s activities on bathing water quality and beach management. This has resulted in all of the region’s 20 bathing beaches meeting the minimum Mandatory Standard in 2013. There were no failing beaches. 16 beaches met the higher Guideline Standard and were recommended in the latest Good Beach Guide by the Marine Conservation Society, which is an improvement of six beaches since last year.
Kelda Holdings Limited Strategic Report (continued) for the year ended 31 March 2014
17
The region has achieved three coveted Blue Flags this season, one more than last year. Hornsea has joined Scarborough North and Whitby and will fly the Blue Flag this bathing season. In the future, the work of the Yorkshire Bathing Water Partnership is expected to secure more beach awards for the region. Protecting raw water quality The quality of the raw water that YW abstracts has been deteriorating in many catchments over the past two decades. This is a consequence of pollution, unsustainable land management practices and climate change. YW invests in enhanced Water Treatment Works (WTW) capabilities to ensure customers always receive the highest quality drinking water. More about this is described in the Safe Water SBO section. In parallel to investment at the WTWs, issues need to be addressed at source. YW has a catchment management programme which is its primary long-term response. This covers a range of water quality parameters including colour, pesticides, nitrates and saline intrusion on reservoir, river and borehole sources. Peat moorlands are particularly important in the region because they are the source catchments for a large proportion of the drinking water. In 2013, together with the EA, Natural England and the National Farmers Union YW is starting to establish a partnership approach to the development and implementation of Safeguard Zones and supporting Safeguard Zone Action Plans. These zones and plans are being established to better protect the catchment areas that influence the quality of water abstracted for drinking water purposes. YW also worked in partnership with the EA to develop plans for each of the seven Water Framework Management catchments in its region. In December 2013 YW published its operational and investment plans for the period from 2015 to 2020. The plans were developed using a multi-agency approach and respond to recent investigations and modelling into the reasons for raw water quality failures. In early 2014, YW’s Catchment Manager joined Defra’s Best Practice Burning Group to help them develop sustainable land management guidance and policy that will better protect and enhance UK uplands. YW is working with a range of relevant organisations including the Moorland Association, Natural England and the National Farmers Union. YW’s future moorland management programme will deliver investigation and implementation activities in the catchments where colour pollution is likely to overwhelm WTW capacity in the longer term. Nitrate and other pollutants that present risks to a number of YW’s groundwater sources will be investigated Managing invasive species Invasive species present increasing challenges to the land and water YW manages, and to its assets and operations. YW has drafted a policy on its approach to invasive species and are currently formalising this internally. The draft policy has been discussed with an independent Environmental Advisory Panel and received their support for the approach. Actions have been included in the plan for 2015 to 2020 to manage invasive species. For example, working in partnership with others on projects to address riparian invasive
Kelda Holdings Limited Strategic Report (continued) for the year ended 31 March 2014
18
species as part of wider river catchment management plans. This will involve landowners working together collaboratively on whole stretches of river to maximise the success of controlling problem species.
Kelda Holdings Limited Strategic Report (continued) for the year ended 31 March 2014
19
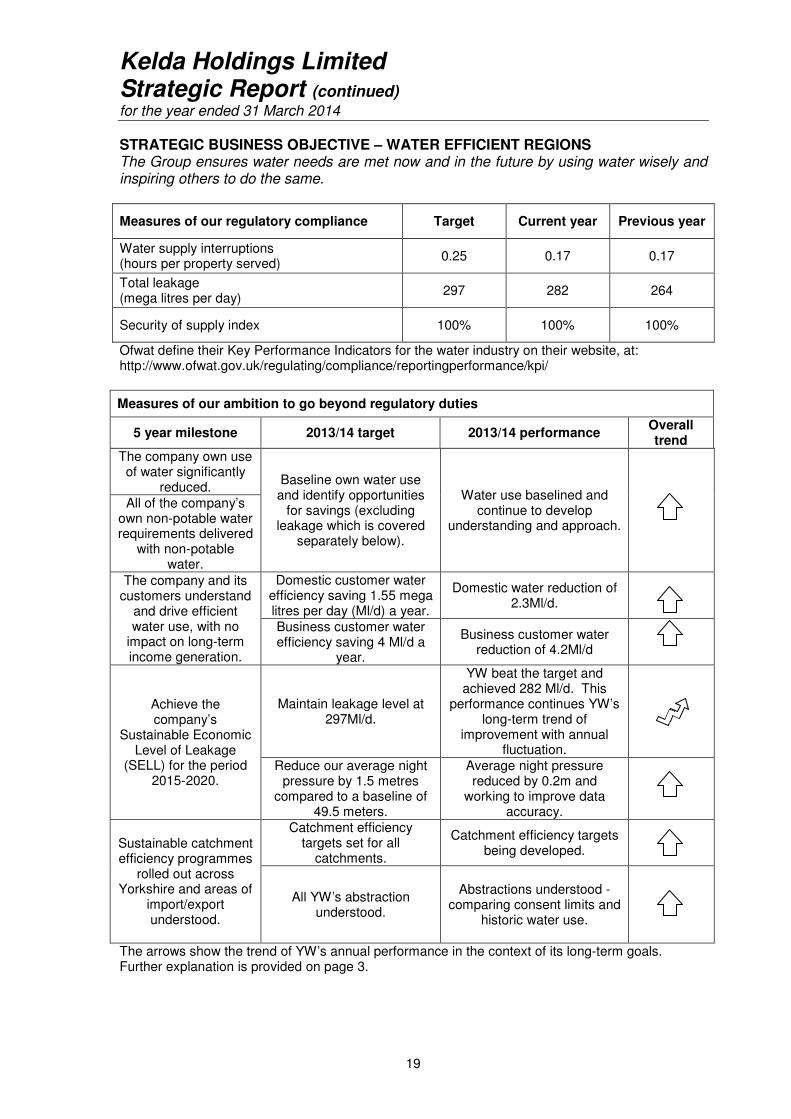
STRATEGIC BUSINESS OBJECTIVE – WATER EFFICIENT REGIONS
The Group ensures water needs are met now and in the future by using water wisely and inspiring others to do the same.
Measures of our regulatory compliance Target Current year Previous year
Water supply interruptions (hours per property served)
0.25 0.17 0.17
Total leakage (mega litres per day)
297 282 264
Security of supply index 100% 100% 100%
Ofwat define their Key Performance Indicators for the water industry on their website, at: http://www.ofwat.gov.uk/regulating/compliance/reportingperformance/kpi/
Measures of our ambition to go beyond regulatory duties
5 year milestone 2013/14 target 2013/14 performance Overall trend
The company own use of water significantly
reduced. Baseline own water use and identify opportunities
for savings (excluding leakage which is covered
separately below).
Water use baselined and continue to develop
understanding and approach.
All of the company’s own non-potable water requirements delivered
with non-potable water.
The company and its customers understand
and drive efficient water use, with no
impact on long-term income generation.
Domestic customer water efficiency saving 1.55 mega litres per day (Ml/d) a year.
Domestic water reduction of 2.3Ml/d.
Business customer water efficiency saving 4 Ml/d a
year.
Business customer water reduction of 4.2Ml/d
Achieve the company’s
Sustainable Economic Level of Leakage
(SELL) for the period 2015-2020.
Maintain leakage level at 297Ml/d.
YW beat the target and achieved 282 Ml/d. This
performance continues YW’s long-term trend of
improvement with annual fluctuation.
Reduce our average night pressure by 1.5 metres
compared to a baseline of 49.5 meters.
Average night pressure reduced by 0.2m and
working to improve data accuracy.
Sustainable catchment efficiency programmes
rolled out across Yorkshire and areas of
import/export understood.
Catchment efficiency targets set for all
catchments.
Catchment efficiency targets being developed.
All YW’s abstraction understood.
Abstractions understood - comparing consent limits and
historic water use.
The arrows show the trend of YW’s annual performance in the context of its long-term goals. Further explanation is provided on page 3.
Kelda Holdings Limited Strategic Report (continued) for the year ended 31 March 2014
20
Securing water supplies Customers place a high value on the reliability of their water supply. YW operates, maintains and enhances over 50 WTWs and a distribution network of over 31,000km of water mains in order to treat and supply around 1.3 billion litres of drinking water each day. YW can be proud that, following extensive investments, Yorkshire has had no service restrictions such as hosepipe bans since the 1995/1996 drought. YW’s performance in 2013/14 remained strong, with improved performance on the length of time involved in supply interruptions, and maintained maximum possible performance on the industry measure for security of supply. YW has also shown strong performance against leakage and other water efficiency targets, which are discussed in the next sections.
The risk of water shortages or supply interruptions is a constant priority because of the consequences to customers, and to operations and finances. In 2013/14 a new Drought Plan, and the revised draft of a new Water Resources Management Plan (WRMP), were published. These plans confirm that climate change presents a growing threat to YW’s ability to maintain the balance between supply and demand. Water resources management is its most mature area of current resilience and future planning. YW has maximised the benefit of the good range and balance of water supply options in its region by developing infrastructure that allows water to be moved around the region to where it is needed. This is called the Yorkshire grid and it covers 99% of customers following completion of an extension to Scarborough in 2013. YW manages its grid to offer one of the most resilient water supply systems in the country. The revised draft WRMP describes how YW will maintain the balance between water supply and demand over the next 25 years. This has been finalised in 2014 following further engagement with Defra. The latest version can be found at: www.yorkshirewater.com/our-environment/water-resources/managing-water-resources.aspx The YW Drought Plan contains a framework of options that allow a drought to be best managed dependent on conditions. In the event of a drought, advance planning enables YW to act quickly because its options have been assessed for their cost and environmental impact, and agreed with the EA. The YW Drought Plan can be found at: www.yorkshirewater.com/our-environment/water-resources/drought-plan.aspx In 2013, YW published its plans for the period from 2015 to 2020. These plans describe the operational and investment programme to manage water services. Activities will include increasing network storage and working on projects to manage network pressure. To respond to bursts and other network problems more effectively, YW will be enhancing its visibility of the network by installing a further 4,500 data loggers that automatically send data to YW’s regional command centre every 30 minutes. Water efficiency is central to YW plans and is described below. Reducing the company’s own water use Leakage is by far the dominant source of water waste. YW measures, reports and reduces leakage, of which about two thirds results from its distribution network and a third is from leaks in customers’ supply pipes. YW have almost halved leakage since 1995 and recorded its lowest ever levels in 2012/13, achieving 264.72 Ml/d. Leakage performance in 2012/13 was not economically
Kelda Holdings Limited Strategic Report (continued) for the year ended 31 March 2014
21
sustainable so in 2013/14 YW continued to out-perform its regulatory target (297.1 Ml/d) by a substantial margin, with leakage of 282 Ml/d. YW will be investing in further leakage reduction in the period from 2015 to 2020 as this is found to be the most cost and environmentally effective way to mitigate the growing deficit in the balance between water supply and demand. YW plans to reduce its leakage target by a further 10 Ml/d, from 297.1 to 287.1 Ml/d by 2020. YW will strive to out-perform this target and to continue finding ways to sustainably reduce leakage by focusing its operational resources and further innovation. The many ways YW supports customers with their leaks and overall water efficiency is described in the section below. Working with customers to save water YW works hard to actively assist its domestic and business customers in valuing water and becoming water efficient. Its goal is to deliver tangible water efficiencies and sustainable behavioural change. In 2013/14 YW provided more free water saving devices than ever before, nearly 128,000 devices, along with a range of advice and support services. It supported domestic customers to save 2.3 million litres of water per day (Ml/d), against a target of 2.1 Ml/d and business customers also saved 4.2 Ml/d against a target of 4 Ml/d. YW has achieved its water efficiency targets since it introduced them in 2010 and is committed to continuing to do so into the future. More information can be found on the water efficiency section of the website at: http://www.yorkshirewater.com/save-water-and-money.aspx. Reforming abstraction licences The Water Act 2014 introduces new provisions to facilitate the creation of a national water supply network by making it easier for water companies to buy and sell water from each other. YW has traded water with its neighbouring water companies for many years and considers such options as a standard part of its planning. YW has a notable import agreement with Severn Trent Water to use water from the Derwent Valley to support demand in the Sheffield area. YW also exports a small amount of treated water to Anglian Water to support their needs. YW continues to engage in the evolving national approach to abstraction licence reform.
Kelda Holdings Limited Strategic Report (continued) for the year ended 31 March 2014
22
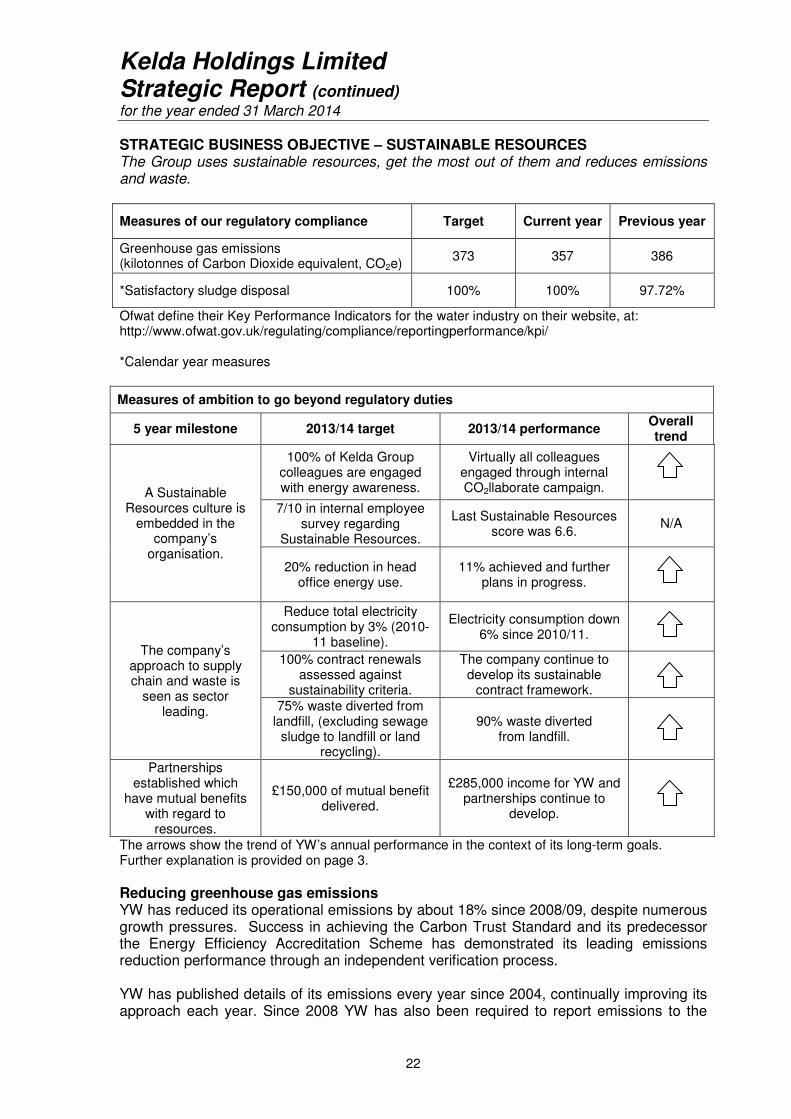
STRATEGIC BUSINESS OBJECTIVE – SUSTAINABLE RESOURCES
The Group uses sustainable resources, get the most out of them and reduces emissions and waste.
Measures of our regulatory compliance Target Current year Previous year
Greenhouse gas emissions (kilotonnes of Carbon Dioxide equivalent, CO2e)
373 357 386
*Satisfactory sludge disposal 100% 100% 97.72%
Ofwat define their Key Performance Indicators for the water industry on their website, at: http://www.ofwat.gov.uk/regulating/compliance/reportingperformance/kpi/ *Calendar year measures
Measures of ambition to go beyond regulatory duties
5 year milestone 2013/14 target 2013/14 performance Overall trend
A Sustainable Resources culture is
embedded in the company’s
organisation.
100% of Kelda Group colleagues are engaged with energy awareness.
Virtually all colleagues engaged through internal CO2llaborate campaign.
7/10 in internal employee survey regarding
Sustainable Resources.
Last Sustainable Resources score was 6.6.
N/A
20% reduction in head office energy use.
11% achieved and further plans in progress.
The company’s approach to supply chain and waste is
seen as sector leading.
Reduce total electricity consumption by 3% (2010-
11 baseline).
Electricity consumption down 6% since 2010/11.
100% contract renewals assessed against
sustainability criteria.
The company continue to develop its sustainable
contract framework.
75% waste diverted from landfill, (excluding sewage
sludge to landfill or land recycling).
90% waste diverted from landfill.
Partnerships established which
have mutual benefits with regard to
resources.
£150,000 of mutual benefit delivered.
£285,000 income for YW and partnerships continue to
develop.
The arrows show the trend of YW’s annual performance in the context of its long-term goals. Further explanation is provided on page 3. Reducing greenhouse gas emissions YW has reduced its operational emissions by about 18% since 2008/09, despite numerous growth pressures. Success in achieving the Carbon Trust Standard and its predecessor the Energy Efficiency Accreditation Scheme has demonstrated its leading emissions reduction performance through an independent verification process. YW has published details of its emissions every year since 2004, continually improving its approach each year. Since 2008 YW has also been required to report emissions to the
Kelda Holdings Limited Strategic Report (continued) for the year ended 31 March 2014
23
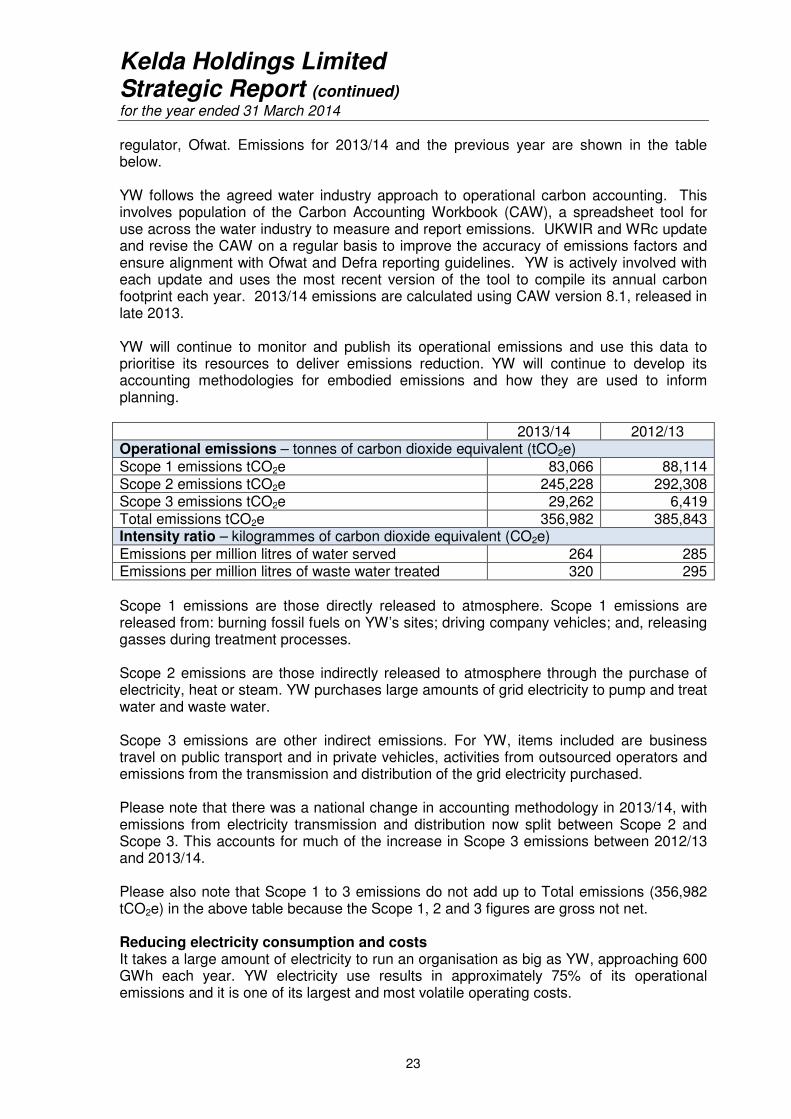
regulator, Ofwat. Emissions for 2013/14 and the previous year are shown in the table below. YW follows the agreed water industry approach to operational carbon accounting. This involves population of the Carbon Accounting Workbook (CAW), a spreadsheet tool for use across the water industry to measure and report emissions. UKWIR and WRc update and revise the CAW on a regular basis to improve the accuracy of emissions factors and ensure alignment with Ofwat and Defra reporting guidelines. YW is actively involved with each update and uses the most recent version of the tool to compile its annual carbon footprint each year. 2013/14 emissions are calculated using CAW version 8.1, released in late 2013. YW will continue to monitor and publish its operational emissions and use this data to prioritise its resources to deliver emissions reduction. YW will continue to develop its accounting methodologies for embodied emissions and how they are used to inform planning. 2013/14 2012/13 Operational emissions – tonnes of carbon dioxide equivalent (tCO2e) Scope 1 emissions tCO2e 83,066 88,114 Scope 2 emissions tCO2e 245,228 292,308 Scope 3 emissions tCO2e 29,262 6,419 Total emissions tCO2e 356,982 385,843 Intensity ratio – kilogrammes of carbon dioxide equivalent (CO2e) Emissions per million litres of water served 264 285 Emissions per million litres of waste water treated 320 295 Scope 1 emissions are those directly released to atmosphere. Scope 1 emissions are released from: burning fossil fuels on YW’s sites; driving company vehicles; and, releasing gasses during treatment processes. Scope 2 emissions are those indirectly released to atmosphere through the purchase of electricity, heat or steam. YW purchases large amounts of grid electricity to pump and treat water and waste water. Scope 3 emissions are other indirect emissions. For YW, items included are business travel on public transport and in private vehicles, activities from outsourced operators and emissions from the transmission and distribution of the grid electricity purchased. Please note that there was a national change in accounting methodology in 2013/14, with emissions from electricity transmission and distribution now split between Scope 2 and Scope 3. This accounts for much of the increase in Scope 3 emissions between 2012/13 and 2013/14. Please also note that Scope 1 to 3 emissions do not add up to Total emissions (356,982 tCO2e) in the above table because the Scope 1, 2 and 3 figures are gross not net. Reducing electricity consumption and costs It takes a large amount of electricity to run an organisation as big as YW, approaching 600 GWh each year. YW electricity use results in approximately 75% of its operational emissions and it is one of its largest and most volatile operating costs.
Kelda Holdings Limited Strategic Report (continued) for the year ended 31 March 2014
24
YW responds to these business risks and opportunities by minimising the electricity it need and maximising its ability to generate its own electricity. This approach helps YW to reduce its emissions and keep costs low too. YW has made great strides in recent years, successfully reducing its total electricity consumption by 6% since 2010/11. This follows many years of growth in electricity demand since privatisation, driven primarily by investment to meet new legislation for environmental water quality. This has been achieved this through a variety of approaches, including cost-effective capital investment, operational efficiencies and targeted training. The energy used at the head office site in Bradford accounts for less than 1% of the company’s total carbon footprint. However, in accommodating over half of YW staff, and with regular visitors and guests, every effort is made to set an example in demand reduction and renewable energy culture. Whilst the ambitious target for a 20% reduction in just one year was not achieved, consumption was reduced by an impressive 11%. Efforts continue. YW has invested to create a substantial portfolio of renewable energy generation assets, mostly using sewage sludge to create low cost, low carbon energy. In 2013/14 two major investments were completed which dramatically increased the ability to generate renewable energy from sewage sludge. Bradford’s waste water treatment works is now approaching self-sufficiency for its substantial energy needs following over £30m of investment. Sheffield's waste water treatment works also has a new large self-generation capability following of investment of £23m. YW forecasts a sharp increase in its consumption and cost of electricity if it does not continue to act. This is caused by a range of factors, including national and global uncertainty in energy sources, the costs of replacing and decarbonising the UK’s aging energy infrastructure and ensuring compliance with new environmental water quality legislation. To mitigate this risk YW continues to plan to reduce its electricity demand and grow its ability to generate low carbon energy. Creating a culture that helps to maximise efficiency and resilience The company is committed to ensuring that all colleagues have the right training and tools to allow them to make informed decisions and to understand their role in sustainable resource use which is lean and resilient. In 2013/14 a new and bespoke web-based environmental awareness course was developed. It provides training on all of YW’s environmental impacts, focusing on energy consumption and energy efficiency. So far over 1,500 (40%) of Kelda Group colleagues have completed the training. A more detailed training programme has also been developed for those in the business who run and optimise YW’s most energy intensive processes. This aims to provide the relevant colleagues with the skills and confidence necessary for them to drive real change and improvement in the business. The training is in the form of a series of modules that ultimately provide the colleagues with their ‘energy passport’ to work. These are just two examples from YW’s cultural change programme ‘CO2llaborate to use less’. Virtually every single colleague has received some form of carbon and energy engagement through the communications and training programme.
Kelda Holdings Limited Strategic Report (continued) for the year ended 31 March 2014
25
Turning waste into resource As a company, YW recognises the need to reduce waste in all its forms, everything from unused construction materials and by-products of treatment processes, to lost time and avoidable travel. Much of what is thought of as waste can actually generate new value through reuse by the company or someone else – creating what is known as a circular economy. Minimising waste and turning it into new resource is essential to the business to help the company remain efficient, reduce its environmental impact, keep bills low for customers and provide returns for investors. Sewage sludge is a large and renewable resource. Through a variety of innovative approaches YW is now able to generate renewable, low cost, low carbon energy from sewage sludge. After treating the sludge products for application to land as a sustainable substitute for petrochemical fertilisers and peat composts are created. After treating the sludge YW also creates products for application to land as a sustainable substitute for petrochemical fertilisers and peat composts. During 2013 YW completed an action plan and improved performance to 100% compliance with sludge disposal regulations. YW forecasts to maintain compliance at 100% in 2014. Further details of the action taken to improve performance can be found in YW’s Risk and Compliance Statement publication, available at: www.yorkshirewater.com.reports. Increasing the rates of recycling from offices, construction sites and operational sites has also been successful and in 2013/14 a target of almost 90% of diverting waste from landfill was achieved. In 2013/14 YW also developed a plan to implement numerous opportunities to work in partnership to deliver mutual benefit. For example, in October 2013 YW established fat, oil and grease (FOG) collection facilities for domestic customers in a known sewer blockage hotspot in Bradford. By helping customers to use their sewers more appropriately, this reduces the need for avoidable sewer maintenance work and potential problems from sewer flooding and pollution while a third party can collect the energy rich material and create power as well as a financial return. This is a pilot trial at present with a view to developing a full scale operation. Achieving SBO ambitions throughout the supply chain Working with the best suppliers is vital to ensure that the company can continue to improve its performance and provide a better service to customers. YW also recognises and manages a risk from interruptions to its supply chain. The ambition is for YW’s global supply chain to share the company’s commitment to the continuous improvement of the water environment and wider sustainable development. In 2013 YW published its new sustainable supply chain policy. This applies across all of its supply chain activities and seeks to articulate a consistent approach with straight forward expectations. YW will work with its supply chain to ensure security of essential supplies and to continually reduce demand for depleting natural resources while enabling a cycle of social, economic and environmental improvements. YW expect that its supply chain partners will deliver a similar message within their own supply chains. YW’s sustainable supply chain policy can be found at: http://www.yorkshirewater.com/about-us/supplying-us.aspx
Kelda Holdings Limited Strategic Report (continued) for the year ended 31 March 2014
26
Dependent on the nature of the contract, YW’s current evaluation process will consider areas such as energy, resource efficiency, waste management, human rights, labour practices and legal compliance. Environmental policy and governance YW environmental policy recognises that a sustainable water and waste water business is dependent on environmentally sustainable operations. The company is, therefore, committed to integrating environmental best practice and continuous improvement through the efficient, effective and proper conduct of the business. YW uses the Business in The Community (BiTC) Environment Index to help benchmark its environmental performance. YW increased its score to over 95% in 2013/14, reaching BiTC Platinum status. Environmental performance is reported through the website which is regularly updated. This can be viewed at www.yorkshirewater.com/our-environment.aspx
Kelda Holdings Limited Strategic Report (continued) for the year ended 31 March 2014
27
STRATEGIC BUSINESS OBJECTIVE – STRONG FINANCIAL FOUNDATIONS
The Group delivers services to customers at a price they are willing and able to pay, while providing investors with returns that attract long-term investment. The financial performance of the Group is reviewed on pages 34 to 35. Determining future prices and operational and investment plans The UK water industry is closely regulated to protect society’s interests. At the heart of the regulatory framework is a five yearly Price Review process that requires water companies to produce business plans detailing how they will achieve their legal requirements and customers’ expectations. The plans are submitted to the industry’s economic regulator, Ofwat, to determine limits on customer prices. Through these controls and requirements, the Price Review plays a fundamental role in shaping YW’s financial foundations. In December 2013 YW published its plans for the period from 2015 to 2020. This followed over two years of detailed consultation, investigation and assessment to inform what Yorkshire needs from its water and waste water services. YW developed a plan which aligns with customer priorities and reflects its aim to invest for a sustainable future while keeping bills affordable. Between 2015 and 2020 YW plans to spend £3.8 billion to deliver the resilient services customers and stakeholders said that they need, and 95% of this expenditure relates to customer’s highest priorities. YW bills are already some of the lowest in the industry at £368 per annum for an average household customer in 2013. YW is planning to keep bills low. In 2014/15 YW was allowed to increase prices by 1.6% above RPI. YW decided to cap this increase at RPI. This means in 2014/15 YW will be reducing average household bills by £6 in real terms compared to what was allowed by Ofwat. YW proposes to continue this saving throughout the life of the plan meaning a total average household saving of £36 over six years. In 2013/14 YW completed its biggest ever customer and stakeholder engagement campaign to inform the development of its business plan for the period from 2015 to 2020. Overall 77% of those asked supported YW’s proposals. More is explained about this in the Trusted Company SBO section. Ofwat will conclude the price preview process before the end of 2014. YW believes it has provided robust plans that meet customer and legislative requirements, however there is a risk in that Ofwat is able to alter the plans which would have significant consequences for future operations, investments and financial performance. You can find out full details of the customer engagement and the plans at: www.BlueprintForYorkshire.com. Ensuring affordability and managing customer debt YW customer bills are already some of the lowest in the country and the company is committed to doing everything it can to keep bills low. With that in mind, YW decided not to proceed with the planned 2014/15 price increase agreed with Ofwat in 2009 of RPI plus 1.6%, capping the increase at RPI. As described above, this decision meant that from April 2014 the average household bill in Yorkshire stayed in line with the rate of inflation, with the average bill being £373, £6 lower
Kelda Holdings Limited Strategic Report (continued) for the year ended 31 March 2014
28
than planned. In the new business plan, the proposal is to maintain this saving for customers through to 2020. By becoming even more efficient and by reducing returns to investors YW can ensure bills stay in line with inflation while maintaining and enhancing the services provided to customers and the environment. Non-recovery of customer debt is a risk. It may cause profitability to suffer in the short-term and increase cost to paying customers in the medium to long-term. Allowance is made by Ofwat in the price limits at each Periodic Review for a proportion of debt deemed to be irrecoverable. To mitigate this risk, YW operates a range of schemes designed to help customers who genuinely cannot pay their bills while having strong processes in place for overall debt collection. During 2013/14 YW was offering more debt support to more people than ever before through a range of assistance packages. New innovative agreements with credit reference agencies are helping us to better target those in most need. The Resolve scheme is just one of the many support arrangements offered customers. This scheme provides customers with an opportunity to clear their debt by maintaining a payment arrangement which will result in the company making a corresponding write-off of the remaining arrears. To qualify customers must have arrears of at least £500 and have a low income. In 2014/15 YW will introduce a new affordability scheme where it will proactively seek to identify vulnerable customers and help them before they get into debt. Preparing for increasing competition in the water industry The Water Act 2014 received Royal Assent in May 2014. The Act includes a range of important measures for the water sector. It will introduce greater freedom for businesses, charities and public sector customers in England to choose their water supplier. This will connect with an existing retail market in Scotland. This presents both opportunities and threats to YW’s business and YW is watching developments closely as the company continues to develop its position. Increasing retail competition will make the Competition Act increasingly relevant to YW’s business and the wider water industry. YW will need to introduce separation between its business retail activities and the rest of the business and it will be implementing the necessary preparations and controls to ensure compliance and fair trading practices. The Water Act will also introduce measures to facilitate water trading. We continue to engage in the evolving national approach to abstraction licence reform and the trading and movement of water nationally. Delivering the company’s capital investment programme YW invests significant capital expenditure to add to and replace plant and equipment. The price limits set by Ofwat every five years take into account the level of capital expenditure expected to be incurred during the relevant period and the associated funding costs and operating costs. In 2013/14 YW has continued to govern closely the effective delivery of the capital programme. A Board Capital Investment Committee (BCIC) with delegated power from the board, monitors the capital programme delivery and provides strategic direction.
Kelda Holdings Limited Strategic Report (continued) for the year ended 31 March 2014
29
If YW were unable to deliver its capital investment programme at expected expenditure levels, were unable to secure the expected level of efficiency savings, or the programme fell behind schedule, profitability may suffer because of a need for increased capital expenditure. Ofwat may also factor such failure into future Price Reviews by seeking to recover amounts equivalent to the “allowed costs” of any parts of the programme that are not delivered. The ability to meet regulatory output targets and environmental performance standards could also be adversely affected by such failure, which may result in penalties imposed by Ofwat of an amount up to 10% of turnover or other sanctions. Governing borrowing requirements Treasury operations are controlled centrally by a treasury department which operates on behalf of all companies in the Group and is controlled by the ultimate parent company. Activities are carried out in accordance with approved board policies, guidelines and procedures. Treasury strategy is designed to manage exposure to fluctuations in interest rates, preclude speculation and to source and structure the Group’s borrowing requirements. The Group uses a combination of fixed capital, retained profits, long term loans, finance leases and bank facilities to finance its operations. Any funding required is raised by the Group treasury department in the name of the appropriate company, operating within the debt covenants. Subject to the restrictions required by the Whole Business Securitisation that applies to YW, funds raised may be lent to or from the company at commercial rates of interest. Cash surplus to operating requirements is invested in short term instruments with institutions having a long term rating of at least A-/A-/A3 and a short term rating of at least A1/F1/P1 issued by Standard and Poor’s, Fitch and Moody’s respectively. Managing financial risk The executive team (Kelda Management Team, ‘KMT’) receives regular reports from all areas of the business to enable prompt identification of financial and other risks so that appropriate actions can be taken. The operation of the treasury function is governed by policies and procedures, which set out guidelines for the management of interest rate risk and foreign exchange risk and the use of financial instruments. Treasury policy and procedures are incorporated within YW’s financial control procedures. The Group’s operations expose it to a variety of financial risks that include the effects of changes in debt market prices, price risk, liquidity risk, interest rate risk and exchange rate risk. Derivative financial instruments, including cross currency swaps, interest rate swaps and forward currency contracts are employed to manage the interest rate and currency risk arising from the primary financial instruments used to finance the company’s activities. The Group actively maintains a broad portfolio of debt, diversified by source and maturity and designed to ensure the Group has sufficient available funds for operations. The Group is exposed to commodity price risk, especially energy price risk, as a result of its operations. The Group aims to manage this risk by fixing contract prices where possible operating within an energy purchasing policy that is designed to manage price volatility risk. The insurance team work to ensure that the Group manages and mitigates its exposure to costs from public liabilities and damage to its assets.
Kelda Holdings Limited Strategic Report (continued) for the year ended 31 March 2014
30
Managing changes in the rate of inflation Turnover is linked to the underlying rate of inflation (measured by RPI) and as such is subject to fluctuations in line with changes in the rate of inflation. In addition, changes in the rate of inflation are likely to impact on YW’s operating costs and capital expenditure, and on customers’ ability to pay any increased charges. To mitigate this risk YW maintains levels of index linked debt and swaps, therefore, as RPI reduces and income reduces, the interest charge will also reduce. Managing changes in the Construction Output Prices Index Under the 2009 Final Determination from Ofwat, the allowed annual capital expenditure was indexed using the Construction Output Prices Index (“COPI”). There is a risk that the actual costs of capital investment in the current investment period (2010 – 2015) will be higher than the ex-post COPI-adjusted allowed capital expenditure, resulting in a revenue penalty applied by Ofwat in the Periodic Review process for the next investment period (2015 – 2020). This may arise where contract conditions do not allow for index tracking (e.g. fixed cost contracts or contracts which are linked to RPI). To mitigate this risk, where possible, construction contracts have been linked to COPI. Additionally YW’s target level of gearing is adjusted to reflect any movements in COPI compared to RPI to eliminate any impact on RCV (as defined on page 37) in the subsequent price control period.
Kelda Holdings Limited Strategic Report (continued) for the year ended 31 March 2014
31
UK Service Operations UK Service Operations comprises Kelda Water Services, Loop and Safe-Move, a non regulated trading arm of Yorkshire Water which provides property search information to solicitors. Operating profit for the UK Service Operations group and its associated undertakings for the year to 31 March 2014 was £18.2m (2013: £13.6m), reflecting the continuing strong operating performances of existing businesses. Kelda Water Services Ltd (KWS) KWS is a leading UK water and waste water contract operations company. KWS continues to seek growth in its core market, providing water and waste water operations and maintenance under long term contracts. In the year, KWS had external turnover of £88.6m and operating profit of £17m (2013: £83.1m and £11.9m respectively). KWS continues to operate across the UK through its three principal projects:
• KWS Alpha in Northern Ireland (KWS Alpha Limited and Dalriada Water Limited); • KWS Defence in England and Wales (KWS Defence Limited and KWS Estates
Limited); and • KWS Grampian in Scotland (KWS Grampian Limited and Aberdeen Environmental
Services Limited).
KWS Alpha had a successful year, achieving its financial business plan in spite of volumes dispatched being significantly lower than anticipated due to a major improvement in leakage performance by its client Northern Ireland Water, and the economic downturn. Furthermore, the clean water residue stockpile was considerably reduced to 1600 tonnes, thus freeing-up additional on-site storage capacity. During the year a strategic resourcing review was completed, resulting in a revised operating model for the business to be adopted in 2014/15. KWS Defence had an excellent year, outperforming its planned operating profit target by £1.1m through agreement of a rebased tariff with its client the Ministry of Defence, and delivering operating cost efficiencies. As the next step in developing strategic asset management, the company began the process of implementing a new work and asset management system. KWS Grampian had a good year operationally and only narrowly missed achieving its operating profit target by £0.7m in spite of suffering exceptionally low rainfall over a six month period, since categorised as a one in a hundred year event by the Met Office. The renewable energy generated by the company’s two CHP engines stationed at the main site in Aberdeen was better than the business planned at 60% utilisation. For the second year running the company outperformed its target for generation of third party activity, delivering additional turnover in excess of £1m. Other activity in the year included the setting-up of KWS Retail, a new business to promote retail competition within the UK water industry on behalf of the Kelda Group. Furthermore, KWS continues to develop two new projects (anaerobic digestion for Edinburgh and Mid-Lothian council, and wind power for Yorkshire Water’s operational site at Knostrop in Leeds). During the year KWS was selected as one of two bidders for the Invitation to Submit Final Tender stage to provide a new anaerobic digestion treatment and power facility for Cardiff Council's Organic Treatment Procurement. It also had planning applications approved to build a similar anaerobic digestion facility on a Yorkshire Water
Kelda Holdings Limited Strategic Report (continued) for the year ended 31 March 2014
32
operational site at Knostrop, and a wind turbine and photo-voltaic scheme at Kelda Group’s head office at Buttershaw in Bradford. KWS has a focused strategy based on supporting Kelda’s vision in Yorkshire and elsewhere in the UK. Unlike YW, it does not operate in a directly regulated environment. Consequently its exposure to factors in the external environment is primarily limited to factors affecting the wider UK economy, although some procurement is affected by European and worldwide commodity pricing. The most important factors to KWS are the retail price index (RPI), the financial marketplace and its impact on debt availability. The major environmental influence is climate change and its increasing influence on legislation which can be a risk but also creates new opportunities. Increased pressure on Government finances also creates new opportunities for outsourced activities from the public sector. Loop Customer Services Management Ltd (Loop) 2013/14 was a good year for Loop, delivering outperformance in three key areas. Firstly, improvements to customer services were achieved by leading YW’s customer service improvement plan. Secondly, YW main charges income exceeded expectations and Loop fulfilled a total billing and debt collection service. Thirdly, Health and Safety performance improved markedly. Customer Service as measured by Ofwat’s Company SIM points improved by five full points which is the single highest annual increase since the SIM mechanism was introduced. The enhancements to service which delivered this improvement included a £2m investment in the introduction of new customer service social media channels, increased proactive customer service, process improvements and more effective case management of customer issues. Billing and income outperformed the plan due to increased water consumption by domestic customers over the hot summer and by commercial customers over the year which is indicative of improvements in the wider economy. Strong income generation activities including identifying under-billed properties and the new pro-active void management process continued being key to supporting the income performance. Collections continued to be challenging due to the economic climate and was impacted on further by new government welfare reforms. Loop has continued to implement its industry leading debt collection and hardship strategies and work closely with credit referencing agencies to mitigate the impact of these external factors. During the year Loop launched ‘Safe Seven’ which was a way to engage effectively with employees on Health and Safety and to engender a positive safety culture. This has been successful with a reduction in the number of incidents since its launch. Loop continues to hold the Investors in People accreditation and Customer Service Excellence standard. YW and Loop were recognised at the WOW awards as best utility for customer services in 2013. Other award highlights included Sidra Ayaz a customer care manager at Loop winning the 'Young Professional of the Year' award at the European Call Centre and Customer Service Awards 2013. Loop's principal business is the provision of customer management services to YW, which includes billing and debt recovery. The changing economic climate can, therefore, have a major impact on Loop's activities.
Kelda Holdings Limited Strategic Report (continued) for the year ended 31 March 2014
33
Loop also provides a contact centre service to YW. Therefore, failures of service by YW or severe weather conditions can also have an impact on Loop's operational call volumes. This may impact on YW's performance in Ofwat's service incentive mechanism (SIM) which benchmarks and rewards companies' customer service Safe-Move Safe-Move is a non-regulated trading arm of YW which provides property search information to solicitors, including information covering drainage and water services. House sales volumes in Yorkshire remained subdued and on a par with the previous year but with success in retailing search products over and above the core drainage and water search product, the business over achieved on its financial targets. KeyLand Developments Ltd (KeyLand) The property market improved somewhat during 2013/14 with KeyLand’s best residential sites selling for more than previously expected. However, many of KeyLand’s sites are in lower value locations, where there has been some improvement in market interest, but no discernible improvement in values. The KeyLand business continues to focus on maximising the value of property assets released by YW. The Aire Valley in Leeds remains the focus of KeyLand’s commercial development activities. The main site has planning permission for a major distribution park and forms part of the Leeds City Region Enterprise Zone. KeyLand is also involved in a number of joint ventures that control strategic residential development sites around Leeds and which have improving prospects of being allocated for residential development. KeyLand’s primary operating strategy is to maximise value from properties and land released by YW by sale or development, either on its own or in combination with suitable partners. The main risks to KeyLand are:
• the quantity and type of sites becoming available for transfer; • the fluctuating market conditions, which affect the value of properties or land; and • changes, unpredictability and delays in the planning system.
KeyLand will concentrate on securing an adequate supply of sites from YW, but will also consider promoting sites on behalf of other major landowners. Other Companies Kelda held a contract to provide sewerage services to the City of Bridgeport in Connecticut, US that terminated on 31 December 2013. The contract was loss making and an onerous contract provision of £14.4m is held to cover expected exit costs. Preparations for exit are progressing, with the most significant outstanding item being closure of the pension scheme. The provision will be utilised as the final termination costs are settled and while the expected future costs are uncertain, management do not expect any material difference to the amounts provided.
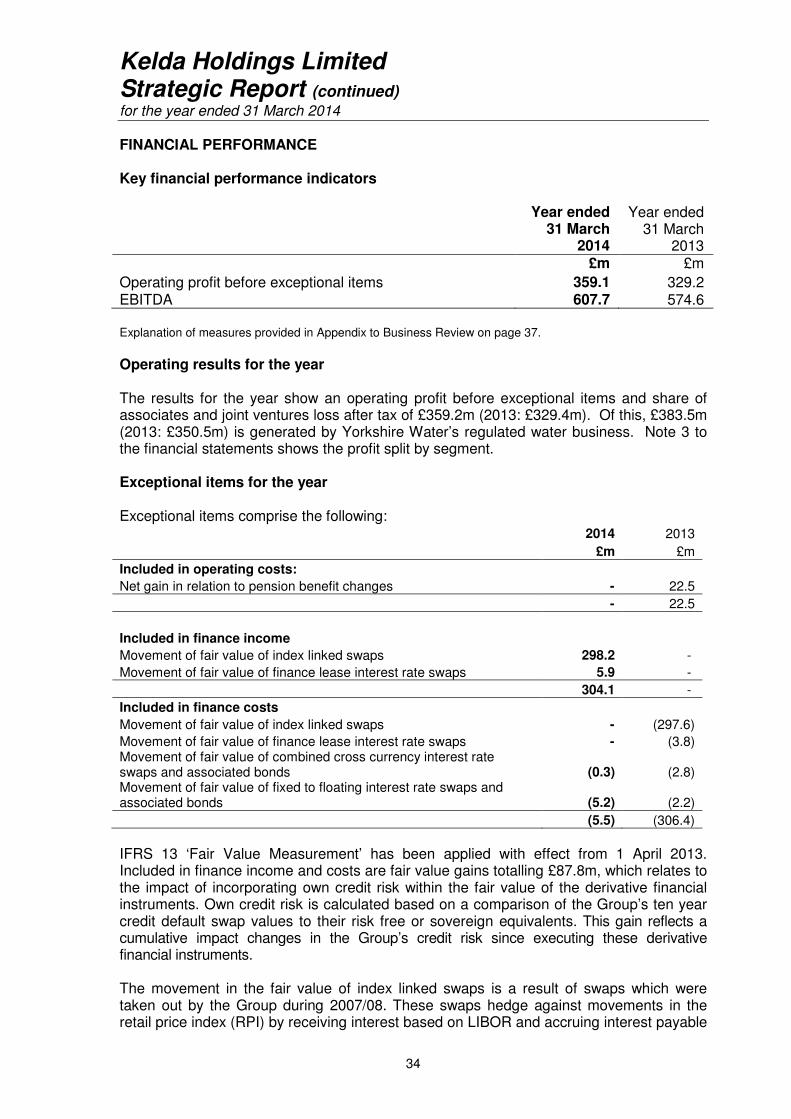
Kelda Holdings Limited Strategic Report (continued) for the year ended 31 March 2014
34
FINANCIAL PERFORMANCE Key financial performance indicators Year ended
31 March 2014
Year ended 31 March
2013 £m £m
Operating profit before exceptional items 359.1 329.2 EBITDA 607.7 574.6
Explanation of measures provided in Appendix to Business Review on page 37.
Operating results for the year The results for the year show an operating profit before exceptional items and share of associates and joint ventures loss after tax of £359.2m (2013: £329.4m). Of this, £383.5m (2013: £350.5m) is generated by Yorkshire Water’s regulated water business. Note 3 to the financial statements shows the profit split by segment. Exceptional items for the year Exceptional items comprise the following: 2014 2013
£m £m
Included in operating costs:
Net gain in relation to pension benefit changes - 22.5
- 22.5
Included in finance income
Movement of fair value of index linked swaps 298.2 -
Movement of fair value of finance lease interest rate swaps 5.9 -
304.1 -
Included in finance costs
Movement of fair value of index linked swaps - (297.6)
Movement of fair value of finance lease interest rate swaps - (3.8) Movement of fair value of combined cross currency interest rate swaps and associated bonds (0.3) (2.8) Movement of fair value of fixed to floating interest rate swaps and associated bonds (5.2) (2.2)
(5.5) (306.4)
IFRS 13 ‘Fair Value Measurement’ has been applied with effect from 1 April 2013. Included in finance income and costs are fair value gains totalling £87.8m, which relates to the impact of incorporating own credit risk within the fair value of the derivative financial instruments. Own credit risk is calculated based on a comparison of the Group’s ten year credit default swap values to their risk free or sovereign equivalents. This gain reflects a cumulative impact changes in the Group’s credit risk since executing these derivative financial instruments. The movement in the fair value of index linked swaps is a result of swaps which were taken out by the Group during 2007/08. These swaps hedge against movements in the retail price index (RPI) by receiving interest based on LIBOR and accruing interest payable
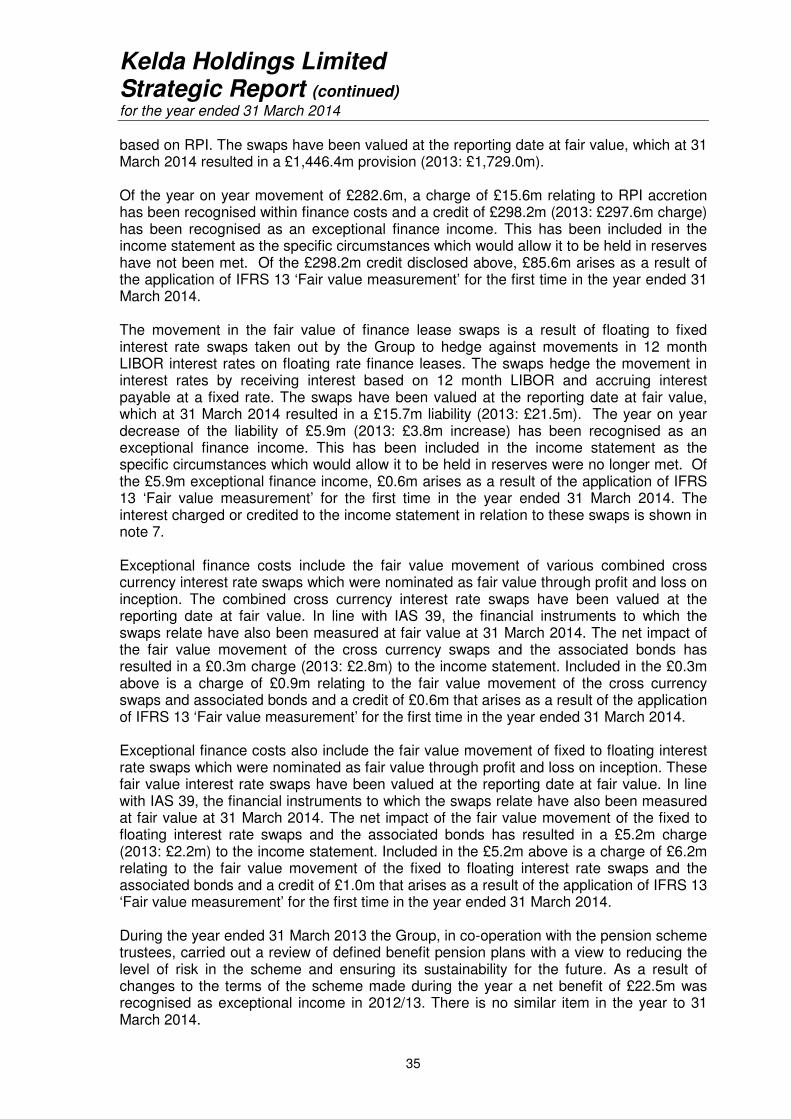
Kelda Holdings Limited Strategic Report (continued) for the year ended 31 March 2014
35
based on RPI. The swaps have been valued at the reporting date at fair value, which at 31 March 2014 resulted in a £1,446.4m provision (2013: £1,729.0m). Of the year on year movement of £282.6m, a charge of £15.6m relating to RPI accretion has been recognised within finance costs and a credit of £298.2m (2013: £297.6m charge) has been recognised as an exceptional finance income. This has been included in the income statement as the specific circumstances which would allow it to be held in reserves have not been met. Of the £298.2m credit disclosed above, £85.6m arises as a result of the application of IFRS 13 ‘Fair value measurement’ for the first time in the year ended 31 March 2014. The movement in the fair value of finance lease swaps is a result of floating to fixed interest rate swaps taken out by the Group to hedge against movements in 12 month LIBOR interest rates on floating rate finance leases. The swaps hedge the movement in interest rates by receiving interest based on 12 month LIBOR and accruing interest payable at a fixed rate. The swaps have been valued at the reporting date at fair value, which at 31 March 2014 resulted in a £15.7m liability (2013: £21.5m). The year on year decrease of the liability of £5.9m (2013: £3.8m increase) has been recognised as an exceptional finance income. This has been included in the income statement as the specific circumstances which would allow it to be held in reserves were no longer met. Of the £5.9m exceptional finance income, £0.6m arises as a result of the application of IFRS 13 ‘Fair value measurement’ for the first time in the year ended 31 March 2014. The interest charged or credited to the income statement in relation to these swaps is shown in note 7. Exceptional finance costs include the fair value movement of various combined cross currency interest rate swaps which were nominated as fair value through profit and loss on inception. The combined cross currency interest rate swaps have been valued at the reporting date at fair value. In line with IAS 39, the financial instruments to which the swaps relate have also been measured at fair value at 31 March 2014. The net impact of the fair value movement of the cross currency swaps and the associated bonds has resulted in a £0.3m charge (2013: £2.8m) to the income statement. Included in the £0.3m above is a charge of £0.9m relating to the fair value movement of the cross currency swaps and associated bonds and a credit of £0.6m that arises as a result of the application of IFRS 13 ‘Fair value measurement’ for the first time in the year ended 31 March 2014. Exceptional finance costs also include the fair value movement of fixed to floating interest rate swaps which were nominated as fair value through profit and loss on inception. These fair value interest rate swaps have been valued at the reporting date at fair value. In line with IAS 39, the financial instruments to which the swaps relate have also been measured at fair value at 31 March 2014. The net impact of the fair value movement of the fixed to floating interest rate swaps and the associated bonds has resulted in a £5.2m charge (2013: £2.2m) to the income statement. Included in the £5.2m above is a charge of £6.2m relating to the fair value movement of the fixed to floating interest rate swaps and the associated bonds and a credit of £1.0m that arises as a result of the application of IFRS 13 ‘Fair value measurement’ for the first time in the year ended 31 March 2014. During the year ended 31 March 2013 the Group, in co-operation with the pension scheme trustees, carried out a review of defined benefit pension plans with a view to reducing the level of risk in the scheme and ensuring its sustainability for the future. As a result of changes to the terms of the scheme made during the year a net benefit of £22.5m was recognised as exceptional income in 2012/13. There is no similar item in the year to 31 March 2014.
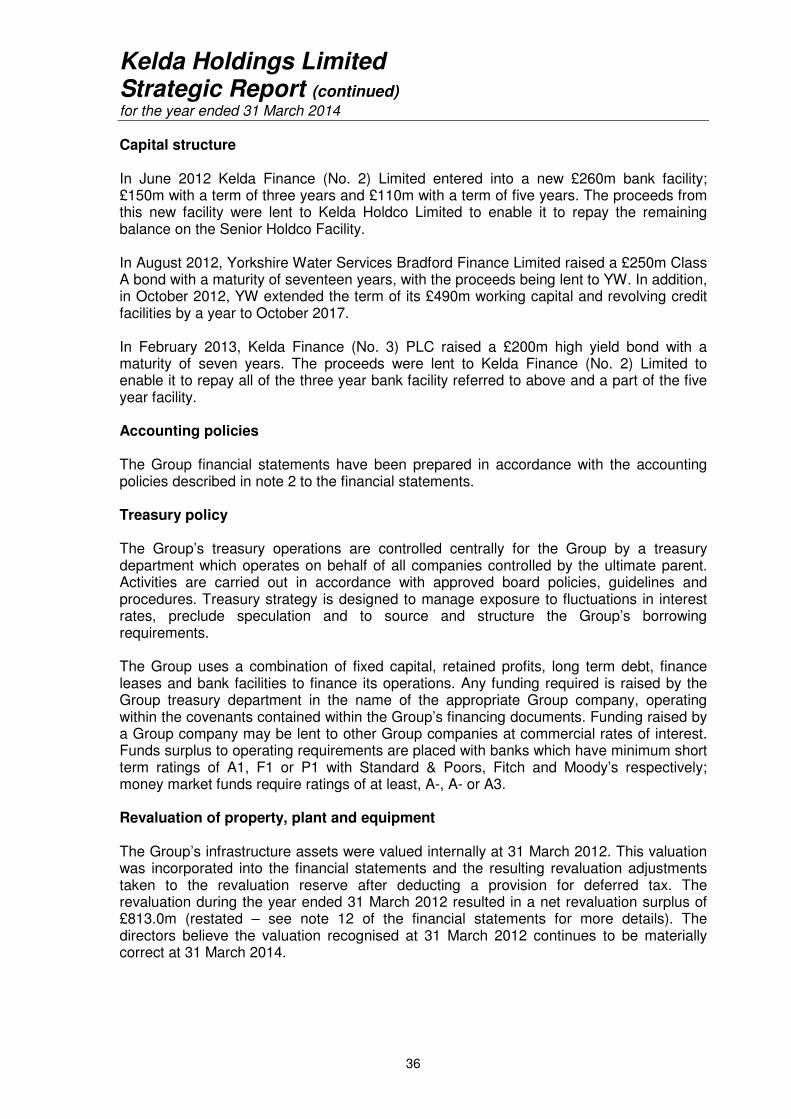
Kelda Holdings Limited Strategic Report (continued) for the year ended 31 March 2014
36
Capital structure In June 2012 Kelda Finance (No. 2) Limited entered into a new £260m bank facility; £150m with a term of three years and £110m with a term of five years. The proceeds from this new facility were lent to Kelda Holdco Limited to enable it to repay the remaining balance on the Senior Holdco Facility. In August 2012, Yorkshire Water Services Bradford Finance Limited raised a £250m Class A bond with a maturity of seventeen years, with the proceeds being lent to YW. In addition, in October 2012, YW extended the term of its £490m working capital and revolving credit facilities by a year to October 2017. In February 2013, Kelda Finance (No. 3) PLC raised a £200m high yield bond with a maturity of seven years. The proceeds were lent to Kelda Finance (No. 2) Limited to enable it to repay all of the three year bank facility referred to above and a part of the five year facility. Accounting policies The Group financial statements have been prepared in accordance with the accounting policies described in note 2 to the financial statements. Treasury policy The Group’s treasury operations are controlled centrally for the Group by a treasury department which operates on behalf of all companies controlled by the ultimate parent. Activities are carried out in accordance with approved board policies, guidelines and procedures. Treasury strategy is designed to manage exposure to fluctuations in interest rates, preclude speculation and to source and structure the Group’s borrowing requirements. The Group uses a combination of fixed capital, retained profits, long term debt, finance leases and bank facilities to finance its operations. Any funding required is raised by the Group treasury department in the name of the appropriate Group company, operating within the covenants contained within the Group’s financing documents. Funding raised by a Group company may be lent to other Group companies at commercial rates of interest. Funds surplus to operating requirements are placed with banks which have minimum short term ratings of A1, F1 or P1 with Standard & Poors, Fitch and Moody’s respectively; money market funds require ratings of at least, A-, A- or A3. Revaluation of property, plant and equipment The Group’s infrastructure assets were valued internally at 31 March 2012. This valuation was incorporated into the financial statements and the resulting revaluation adjustments taken to the revaluation reserve after deducting a provision for deferred tax. The revaluation during the year ended 31 March 2012 resulted in a net revaluation surplus of £813.0m (restated – see note 12 of the financial statements for more details). The directors believe the valuation recognised at 31 March 2012 continues to be materially correct at 31 March 2014.
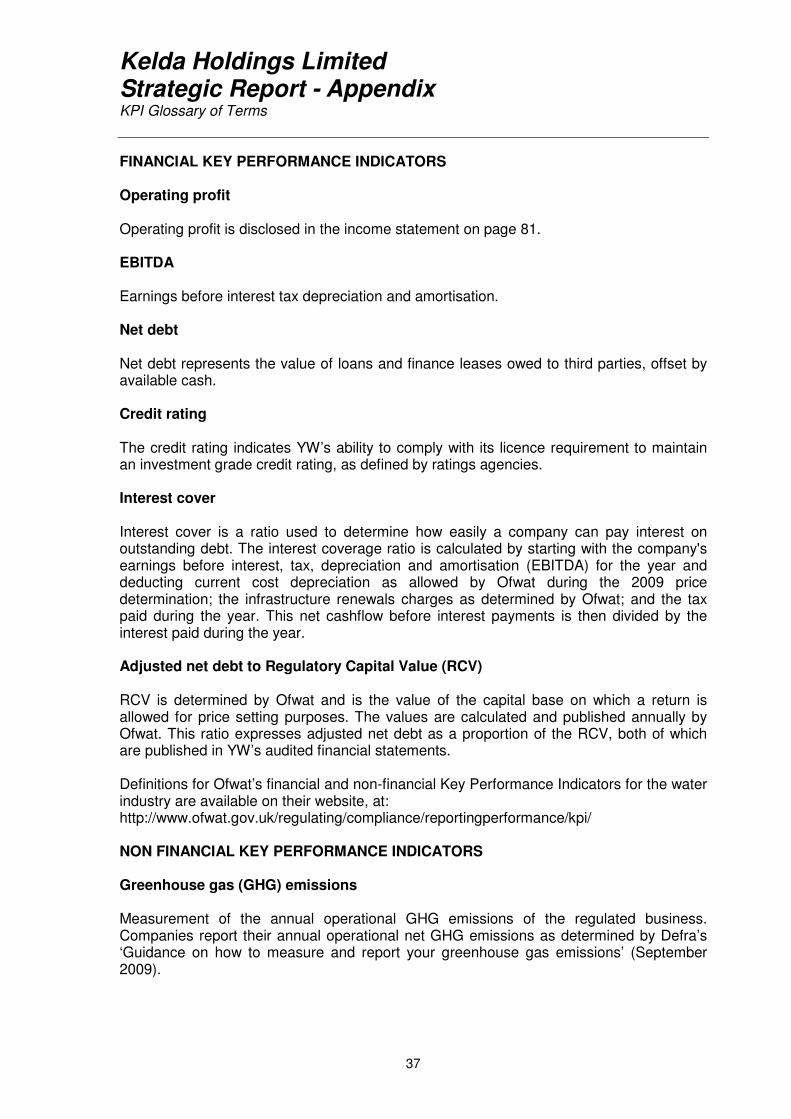
Kelda Holdings Limited Strategic Report - Appendix KPI Glossary of Terms
37
FINANCIAL KEY PERFORMANCE INDICATORS Operating profit Operating profit is disclosed in the income statement on page 81. EBITDA Earnings before interest tax depreciation and amortisation. Net debt Net debt represents the value of loans and finance leases owed to third parties, offset by available cash. Credit rating The credit rating indicates YW’s ability to comply with its licence requirement to maintain an investment grade credit rating, as defined by ratings agencies. Interest cover Interest cover is a ratio used to determine how easily a company can pay interest on outstanding debt. The interest coverage ratio is calculated by starting with the company's earnings before interest, tax, depreciation and amortisation (EBITDA) for the year and deducting current cost depreciation as allowed by Ofwat during the 2009 price determination; the infrastructure renewals charges as determined by Ofwat; and the tax paid during the year. This net cashflow before interest payments is then divided by the interest paid during the year. Adjusted net debt to Regulatory Capital Value (RCV) RCV is determined by Ofwat and is the value of the capital base on which a return is allowed for price setting purposes. The values are calculated and published annually by Ofwat. This ratio expresses adjusted net debt as a proportion of the RCV, both of which are published in YW’s audited financial statements. Definitions for Ofwat’s financial and non-financial Key Performance Indicators for the water industry are available on their website, at: http://www.ofwat.gov.uk/regulating/compliance/reportingperformance/kpi/ NON FINANCIAL KEY PERFORMANCE INDICATORS Greenhouse gas (GHG) emissions Measurement of the annual operational GHG emissions of the regulated business. Companies report their annual operational net GHG emissions as determined by Defra’s ‘Guidance on how to measure and report your greenhouse gas emissions’ (September 2009).
Kelda Holdings Limited Corporate Governance Report for the year ended 31 March 2014 (continued)
38
Corporate governance Throughout the year the Board remained accountable to the Group’s shareholders for maintaining standards of corporate governance as set out below. This corporate governance report describes how the Board and its committees discharge their duties. Following a consultation exercise, in April 2014 Ofwat published a document entitled “Board leadership, transparency and governance – holding company principles” (“the Ofwat Holding Company Principles”) which set out the principles that Ofwat considers should guide the governance arrangements of the holding company of a regulated company operating in the water sector in England and Wales to apply. These principles complemented those that Ofwat had published in January 2014 for regulated companies operating in the water sector in England and Wales (“the Ofwat Regulated Company Principles”). In accordance with the Ofwat Regulated Company Principles the board of YW has adopted its own “Board Leadership, Transparency and Governance Code” (“the YW Code”) which it has published on its website. The YW Code sets out how YW currently applies the Ofwat Principles and the time frame in which they will be fully adopted. An explanation of how YW applies the Ofwat Regulated Company Principles is provided in the YW Annual Report and Financial Statements for the year ended 31 March 2014. In its Annual Report and Financial Statements for the year ended 31 March 2015 the Board shall report on how it has addressed the Ofwat Holding Company Principles and their interrelationship with the Ofwat Regulated Company Principles. The Board of directors
The Board held six scheduled meetings during the year. Additional meetings were held where it was considered appropriate or where business needs required. The Board met for an additional six meetings to consider YW’s business plan submission to Ofwat for the five yearly Price Review process. In addition, meetings of committees of the Board were held when required. The Board has a schedule of matters reserved for its decision. The Board determines the Group’s strategic objectives and key policies, and approves the business plans for the Group, interim and final financial statements, recommendations of dividends, significant investment and major new business proposals, as well as significant organisational matters and corporate governance arrangements. The Board is also responsible for establishing and reviewing the Group’s system of internal control and risk management, and reviewing at least annually its effectiveness. The roles of the chairman and chief executive are formally set out and agreed by the Board. There are clear levels of delegated authority in Group companies, which enable management to take decisions in the normal course of business. The Board has a schedule of matters reserved for its decision and the requirement for Board approval on these matters is communicated widely throughout the senior management of the Group. A review of the reserved matters will be carried out when the YW reconfigures its board structure as described in its Annual Report and Financial Statements for the year ended 31 March 2014.
Kelda Holdings Limited Corporate Governance Report for the year ended 31 March 2014 (continued)
39
During the year the Board received detailed monthly reports prepared by management on the Group’s operations. In addition to those monthly reports the following matters of significance were considered by the Board;
• discussions with Ofwat on the regulation of the water sector and the publication of “Holdco Principles”;
• the PR14 periodic price review process which resulted in the submission of the Blueprint for Yorkshire;
• the board evaluation process referred to below; • water industry market reform and the impact of retail competition; • Group health and safety strategy and performance; • establishment of a separate YW board audit committee as indicated in the
Company’s Annual Report and Financial Statements for the year ended 31 March 2013 (“the 2013 Annual Report”);
• the impact of charges on YW customers for 2014/15 and the decision by YW to forgo the allowed real price increase above inflation for that year;
• review and approval of the Group’s tax and hedging strategies; • non-regulated investment opportunities; • preparation for the next 5 year period 2015 -2020 (AMP6); and • Review and approval of YW’s PR14 business plan submission to Ofwat.
The roles of the chairman and the chief executive are formally set out and agreed by the Board. There are clear levels of delegated authority, which enable management to take decisions in the normal course of business. All new directors, where applicable, receive an induction and training on joining the Board, including information about the Group and their responsibilities, meetings with key managers, and visits to the Group’s operations. Briefings are provided to directors on relevant issues, including legislative, regulatory and financial reporting matters. Training is available to directors on, and subsequent to, their appointment to meet their particular requirements. There is an agreed procedure for directors to take independent professional advice at the Company’s expense in furtherance of their duties in relation to board or committee matters. Directors have access to the Group company secretary who is responsible for ensuring that board procedures are followed. The directors receive full and timely access to all relevant information, including a monthly board pack of operational and financial reports. Direct access to key executives is encouraged. The Group has directors’ and officers’ liability insurance in place. In conjunction with the Chairman the chief executive reviews and agrees with the executive directors their training and development needs. The Chairman keeps under review and agrees the training and development needs of the non-executive directors which is organised by the Group company secretary. Robert Davies and Anthony Rabin are considered by the Board to be independent of management and free from any business or other relationship which could materially interfere with the exercise of their independent judgements. The roles of chairman and chief executive are separate and held by Kevin Whiteman and Richard Flint respectively. Appraisal of the Chairman’s performance is carried out by the Company’s shareholders.
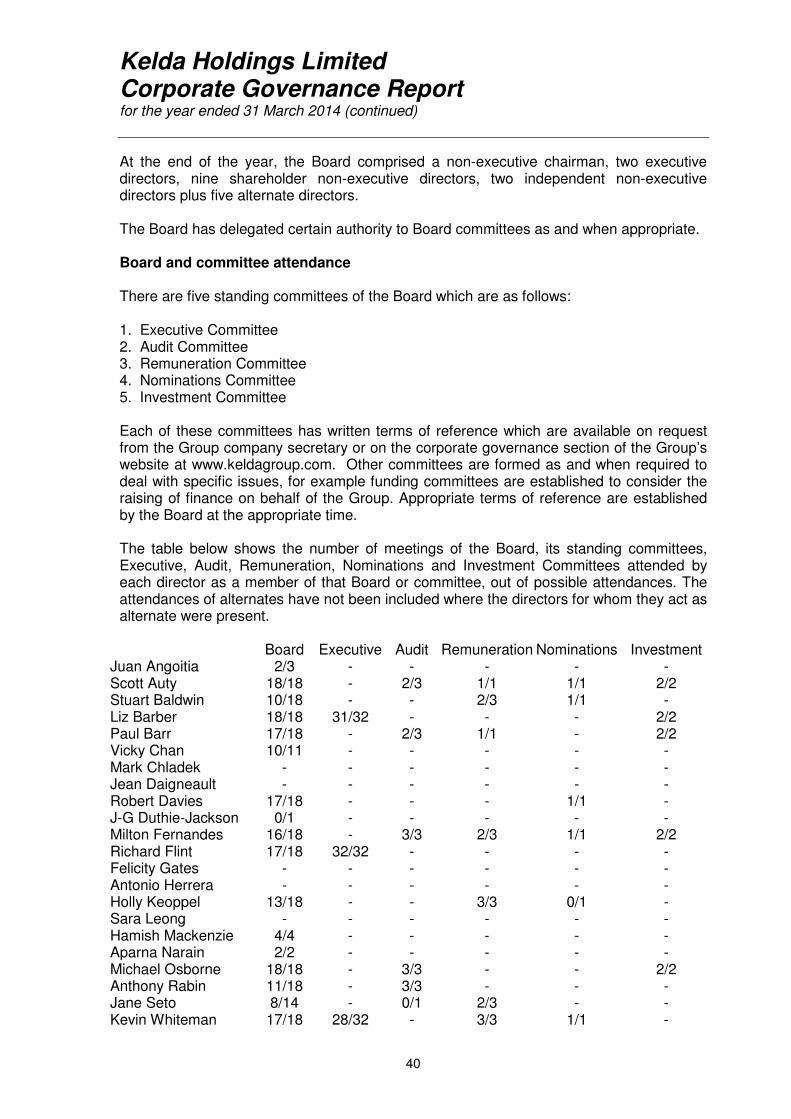
Kelda Holdings Limited Corporate Governance Report for the year ended 31 March 2014 (continued)
40
At the end of the year, the Board comprised a non-executive chairman, two executive directors, nine shareholder non-executive directors, two independent non-executive directors plus five alternate directors. The Board has delegated certain authority to Board committees as and when appropriate. Board and committee attendance There are five standing committees of the Board which are as follows: 1. Executive Committee 2. Audit Committee 3. Remuneration Committee 4. Nominations Committee 5. Investment Committee Each of these committees has written terms of reference which are available on request from the Group company secretary or on the corporate governance section of the Group’s website at www.keldagroup.com. Other committees are formed as and when required to deal with specific issues, for example funding committees are established to consider the raising of finance on behalf of the Group. Appropriate terms of reference are established by the Board at the appropriate time. The table below shows the number of meetings of the Board, its standing committees, Executive, Audit, Remuneration, Nominations and Investment Committees attended by each director as a member of that Board or committee, out of possible attendances. The attendances of alternates have not been included where the directors for whom they act as alternate were present.
Board Executive Audit Remuneration Nominations Investment Juan Angoitia 2/3 - - - - - Scott Auty 18/18 - 2/3 1/1 1/1 2/2 Stuart Baldwin 10/18 - - 2/3 1/1 - Liz Barber 18/18 31/32 - - - 2/2 Paul Barr 17/18 - 2/3 1/1 - 2/2 Vicky Chan 10/11 - - - - - Mark Chladek - - - - - - Jean Daigneault - - - - - - Robert Davies 17/18 - - - 1/1 - J-G Duthie-Jackson 0/1 - - - - - Milton Fernandes 16/18 - 3/3 2/3 1/1 2/2 Richard Flint 17/18 32/32 - - - - Felicity Gates - - - - - - Antonio Herrera - - - - - - Holly Keoppel 13/18 - - 3/3 0/1 - Sara Leong - - - - - - Hamish Mackenzie 4/4 - - - - - Aparna Narain 2/2 - - - - - Michael Osborne 18/18 - 3/3 - - 2/2 Anthony Rabin 11/18 - 3/3 - - - Jane Seto 8/14 - 0/1 2/3 - - Kevin Whiteman 17/18 28/32 - 3/3 1/1 -
Kelda Holdings Limited Corporate Governance Report for the year ended 31 March 2014 (continued)
41
Executive committee Chaired by the chief executive and comprising the executive directors and the chairman, it has delegated authority to deal with specific matters remitted to it by the Board.
Audit Committee The Audit Committee at the end of the year was made up of six non-executive directors of Kelda Holdings Limited, namely Anthony Rabin, Paul Barr, Michael Osborne, Milton Fernandes, Jane Seto and Scott Auty. The chairman of the Committee during the year was Anthony Rabin. During the year Scott Auty was appointed to the Committee on 27 March 2013 and Roger Hyde, an independent non-executive director of YW, was also a member of the Committee until October 2013. In accordance with its stated intention in the company’s Annual Report and Financial Statements for the year ended 31 March 2013 (“the 2013 Annual Report”) YW established its own separate audit committee on 23 October 2013 which met for the first time on 27 November 2013. The Group Audit Committee met once during the reporting year with Roger Hyde as a member who reported to YW’s board meeting immediately after that meeting. Liz Barber, director of finance and regulation, the external auditors, the Group head of strategy, risk & assurance, the Group internal audit manager and the Group company secretary attend all meetings. The committee also meets with the external auditors without the presence of executive management when considered necessary or appropriate to do so and in any event annually. The committee’s key tasks during the year included: • receiving reports from the company’s auditors on the company’s financial
statements; • reviewing and monitoring of the integrity of the annual regulatory return to Ofwat; • reviewing the PR14 assurance process; • reviewing the Group’s system of internal control, including financial, operational,
compliance and risk management; • overseeing the Group’s relationship with the external auditors, agreeing the nature
and scope of the audit and reviewing the independence and objectivity of the external auditors;
• reviewing internal audit reports on the Group’s operations; • a review of the criteria for reviewing the effectiveness of the external auditor; and • monitoring and reviewing the effectiveness of the internal audit function as applied
to the Group. In undertaking these tasks the committee received and reviewed work carried out by the internal and external auditors and their findings. Both the internal and external auditors work to an annual plan developed in consultation with the committee. In addition, the committee reviewed specific business areas and processes from time to time. The regular business of the committee included consideration of reports on financial statements, audit planning, the activities of internal audit and its key findings, and the consideration of the operation of internal control processes.
Kelda Holdings Limited Corporate Governance Report for the year ended 31 March 2014 (continued)
42
The Group has a policy for disclosure of malpractice which applies to the company, and the committee reviewed the arrangements by which staff may, in confidence, raise concerns about possible improprieties in matters of financial reporting or other matters. The independence and objectivity of the external auditors is considered on a regular basis, with particular regard to the level of non-audit fees. The Group has adopted an auditor independence policy which was reviewed during the reporting year by the committee and amended. The amended policy establishes procedures and guidance under which the Group’s relationship with its external auditor is governed so that the committee is able to satisfy itself that there are no factors which may, or may be seen to, impinge upon the independence and objectivity of the audit process. The key features of the policy are: • clear accountability of the external auditor to the Audit Committee and the chairman
of the Board; • the committee considers annually its recommendation to re-appoint the external
auditor; • the external auditor is required to disclose all relationships which may affect the
firm’s independence and the objectivity of the audit partner and staff; • the external auditor is required to disclose the safeguards and steps taken in order
to ensure its independence and objectivity; • the external auditor is required to confirm in writing to the committee that in its
judgement, it is independent within the meaning of the relevant regulations and professional requirements;
• the external auditor is required to disclose any gifts or hospitality which have been provided or exchanged between the Group and the auditor, unless in the case of gifts, the value is clearly insignificant and in the case of hospitality it is reasonable in terms of its frequency, nature and cost;
• rotation of external audit partners and appropriate restrictions on appointment of employees of the external auditor; and
• specific restrictions and procedures in relation to the allocation of non-audit work to the external auditor. These include categories of work which cannot be allocated to the auditor, and categories of work which may be allocated to the auditor, subject to certain provisions as to materiality, nature of the work, or the approval of the committee. At each of its meetings the committee receives a report of the fees paid to the auditor in all capacities and the amounts of any future services which have been contracted, or where a written proposal has been submitted. In addition, the external auditor is required to report any contingent fee arrangements for non-audit services.
The split between audit and non-audit fees and a description of the non-audit fees for the year to 31 March 2014 appears in note 4 to the statutory financial statements. The amount and nature of non-audit fees are considered by the committee not to affect the independence or objectivity of the external auditor.
The Group considers the award of non-audit work on a case by case basis. During the year to 31 March 2014 the external auditor carried out certain items of non-audit work on behalf of the Group and the fees in question are not considered to be material. In the event that the Group proposes to award any non-audit work which the external auditor is
Kelda Holdings Limited Corporate Governance Report for the year ended 31 March 2014 (continued)
43
qualified to carry out, and which would be material in terms of the level of fees, then a competitive tender process for that work would usually be conducted. The external auditor was appointed in 2007. The committee will continue to review the auditor appointment and the need to tender the audit, ensuring the company’s compliance with the UK Corporate Governance Code and any reforms of the audit market by UK and European authorities.
During the year the Audit Committee considered the following significant financial issue/judgements in relation to the company’s financial statements and disclosures, with input from management and the external auditor: Going concern In considering whether the company continues to be a going concern, the company’s business activities, factors likely to affect its future development, financial position and risk management were reviewed. It was noted that the company has a combination of cash and committed undrawn bank facilities totalling £728.6m, which is deemed sufficient to fund the operating and capital investment activities of the company for 12 months from the date of signing the financial statements, and an indefinite licence to operate as a water and sewerage operator terminable with a 25 year notice period. Key covenants of the Yorkshire Water securitised group have been assessed and there is over £100m of headroom to the gearing covenants with no significant monthly variation in level of net debt. On the basis of these considerations it was concluded that the company has adequate resources to continue in operational existence for the foreseeable future. Assumptions relating to the retirement benefit deficit The present value of the pension obligation depends on a number of factors that are determined on an actuarial basis using a number of assumptions. The assumptions used in determining the net cost for pensions include the discount rate. Any changes in these assumptions will impact the carrying amount of the pension obligation. All key assumptions relating to the retirement benefit deficit are reviewed with the Group’s pension advisors, Mercers, and compared to industry trends. Based on the latest publically available information, the Group is not a significant outlier in comparison to other companies in the industry on any of these assumptions. PwC have indicated that the pension scheme discount rate of 4.55% is at the top end of their expected range but that they are satisfied these assumptions are reasonable. Fixed asset impairment In carrying out impairment review of fixed assets a number of significant assumptions have to be made when preparing cash flow projections. These include the future growth rates, levels of outperformance assumed and discount rates. Management’s report on key assumptions with respect to fixed asset impairment was reviewed and the conclusion was reached that the assumptions were appropriate. Goodwill impairment
Kelda Holdings Limited Corporate Governance Report for the year ended 31 March 2014 (continued)
44
IAS 36 requires that intangible assets, such as goodwill, with indefinite useful lives be reviewed for impairment annually. As is common practice in the water industry, Finance use the net present value of 25 year cash flows plus discounted RCV as terminal value to arrive at the investment value. Management’s report on key assumptions with respect to goodwill impairment was reviewed and the conclusion was reached that the assumptions were appropriate. Provision for doubtful debts The provisioning of doubtful debts is based on subjective judgement of the recoverability of debtor balances. The committee considered that the policy for providing against doubtful debts has not been changed from the previous year and that the balance at 31 March 2014 of £26.2m was consistent with the balance at 31 March 2013 of £25.7m. Management’s report of the assumptions involved in calculating the provision for doubtful debts was reviewed and the committee concluded that the policy continued to be appropriate.
Kelda Holdings Limited Corporate Governance Report for the year ended 31 March 2014 (continued)
45
Internal control and risk management An on-going process, in accordance with the guidance of the Turnbull Committee on internal control, has been established for identifying, evaluating and managing the significant risks faced by the Group and this has been in place for the year under review and up to the date of approval of the annual report and financial statements. Strategic, financial, commercial, operational, social, environmental and ethical risks fall within the scope of this process. The process is designed to manage rather than eliminate the risk of failure to achieve business objectives and can only provide reasonable, not absolute, assurance against material misstatement or loss. The Group has comprehensive and well defined control policies with clear structures, delegated authority levels and accountabilities. The Group’s risk management process aims to be comprehensive, systematic and continuous, and based on constant monitoring of business risk. The key features of the process include the following:
• The main risks facing the Group are identified and recorded in a strategic risk register together with the control mechanisms applicable to each risk. These are collated from risk registers maintained by individual business units. There is clear allocation of management responsibility for risk identification, recording, analysis and control;
• Risk assessment is completed with the use of strategic risk impact and probability scales and results plotted to enable prioritised action;
• Risks are monitored for any increases or decreases in risk position taking into account internal and external factors and appropriate treatment plans in place. All movements in strategic risk position are reported to the executive management team known as Kelda Management Team (KMT) monthly;
• KMT meet quarterly to review the Group’s strategic risk position in detail and carry out a PESTLE analysis (political, economic, social, technological, legal and environmental). This acts as a prompt for KMT to discuss, assess and develop action plans relating to external trends, issues or opportunities;
• Anthony Rabin as the chairman of the committee reports to the Board; • Business units are required to report annually on principal business risks and the
operation of control mechanisms; and • The internal audit department provides objective assurance and advice on risk
management and control, and monitors the risk management process. An update on the risk and assurance position is provided at each committee meeting.
The committee may at its discretion also review specific risks and the systems, controls and resources in place to manage these risks. During the reporting year, the committee reviewed the effectiveness of the risk management process, the effectiveness of internal audit and the effectiveness of the external audit process on behalf of the Group. The committee has also separately considered the control environment and control activities which the Board can rely on for disclosures in the annual report and financial statements. In addition to the process outlined above, the Group is also subject to: independent external audits which were reported to the executive team and the committee; an extensive budget and target-setting process; a quarterly reporting and forecasting process
Kelda Holdings Limited Corporate Governance Report for the year ended 31 March 2014 (continued)
46
reviewing performance against agreed objectives; appropriate delegated authority levels; established financial policies and procedures; and other risk management policies and procedures such as health and safety and environmental policies. The Board confirms that it has reviewed the system of internal control. It has received the reports of the committee and has conducted a formal review covering all controls including financial, operational, compliance and risk management. Remuneration Committee Details of the membership and role of the Remuneration Committee are included in the remuneration report on pages 61 to 78. Nominations Committee The Nominations Committee met once during the year to consider the process for the appointment of candidate to succeed the Chairman once he left office and the process to appoint a replacement independent non-executive director on the board of YW following the retirement of Roger Hyde. Investment Committee The Investment Committee met twice during the year to consider non-regulated investment opportunities in Kelda Water Services. Corporate Responsibility Committee The Group has a Corporate Responsibility Committee. Martin Havenhand and Kathryn Pinnock, who are independent non-executive directors of YW, sit on the Corporate Responsibility Committee. Kevin Whiteman, the chairman, also sits on this committee which is chaired by Richard Flint. The YW director of corporate communications and the Group company secretary attended all meetings. Other directors and Group employees attend by invitation. During the reporting year this committee met on three occasions, one in the form of a workshop, and is scheduled to normally meet on a quarterly basis. The Corporate Responsibility Committee’s key tasks include: • delivery of the Group's corporate social responsibility reports; • the creation of a culture of environmental and corporate responsibility awareness
within the Group; • liaising with and directing activity of other relevant Group committees; • advising on opportunities for partnerships to further the Group’s corporate
responsibility objective; • benchmarking performance of the Group against leading comparators; and • monitoring the work of and receiving reports from the Environmental Advisory
Panel. Board evaluation As noted in the 2013 Annual Report, following an externally facilitated board evaluation carried out by Egon Zehnder International (EZI), the chairman carried out a further formal board effectiveness evaluation during the reporting year through a self-evaluation
Kelda Holdings Limited Corporate Governance Report for the year ended 31 March 2014 (continued)
47
questionnaire and interviews with the directors. The content of the evaluation included issues that had been reviewed as a result of the EZI evaluation and addressed individual contributions to the board, the role of the board, board and committee structures and composition, board dynamics and relationships, board processes and board strategy. The chairman reported his findings to the board at its meeting on 23 July 2013.
Conflicts of interest Procedures have been put in place for the disclosure of any potential conflicts by the directors to the Board and if appropriate for the authorisation of such conflicts. The procedures permit any authorisation to be subject to any conditions that the directors who are not conflicted consider to be appropriate. All of the directors are required to notify the Group company secretary if they believe a conflict situation might arise. The directors do not consider that during the financial year that any actual conflicts of interest have arisen between the roles of the directors as directors of the Company and any other roles which they may hold.
Kelda Holdings Limited Directors’ Report for the year ended 31 March 2014
48
The directors present their annual report and the audited consolidated financial statements for the Group for the year ended 31 March 2014. The Directors’ Report should be read in conjunction with the Strategic Report. Financial results for the year The profit for the year after tax was £339.1m (2013: £209.5m loss). The Company did not pay any dividends during the year to its shareholders (2013: £nil). £85.2m of preference shares were redeemed by Kelda Holdings Limited during the year (2013: £158.1m), in accordance with the preference share agreements entered into when the company was purchased by the current owners in 2008. Business review A review of the development and performance of the business of the Group, including strategy, the financial performance during the year, key performance indicators, health and safety policy, forward-looking statements and a description of the principal risks and uncertainties facing the Company are set out in the Strategic Report on pages 1 to 36. The purpose of this annual report is to provide information to the Group’s stakeholders and contains certain forward-looking statements with respect to the operations, performance and financial condition of the Group. By their nature, these statements involve uncertainty since future events and circumstances can cause results to differ from those anticipated. Nothing in this report should be construed as a profit forecast. Principal activities The principal activities of the Group are the supply of clean water and the treatment and disposal of waste water. Yorkshire Water, the Group’s regulated utility business in the UK, is responsible for both water and waste water services. Other businesses are the UK non-regulated water and waste water services business, KWS, and KeyLand, a company which primarily develops surplus property assets of Yorkshire Water. The principal activity of Kelda Holdings Limited is that of a holding company within the Kelda Holdings Group.
Kelda Holdings Limited Directors’ Report (continued) for the year ended 31 March 2014
49
Directors The directors, who served during the year and up to the date of signing of these financial statements, including any changes, are shown below: Richard Flint Chief Executive Liz Barber Director of Finance & Regulation Non-executive Directors
Juan Angoitia Appointed 30 May 2013, resigned 30 August 2013) Scott Auty Stuart Baldwin Paul Barr Vicky Chan Appointed 31 May 2013 as alternate for Juan Angoitia,
appointed in own right 26 September 2013
Mark Chladek Alternate for Milton Fernandes Jean Daigneault Alternate for Michael Osborne Robert Davies Independent non-executive J-G Duthie-Jackson Resigned 21 May 2013 Milton Fernandes Felicity Gates Resigned 30 May 2013 as alternate for Holly Keoppel Antonio Herrera Appointed 27 September 2013 as alternate for Vicky Chan Holly Keoppel Sara Leong Appointed 27 March 2014 as alternate for Scott Auty Hamish Mackenzie Alternate for Jane Seto Aparna Narain Appointed 27 March 2014 Michael Osborne Anthony Rabin Independent non-executive Jane Seto Kevin Whiteman Chairman Biographies
Scott Auty. Appointed to the board as a non-executive director on 30 December 2010. Scott is a director of Deutsche Asset and Wealth Management, a division of Deutsche Bank. He is responsible for the origination of infrastructure investment opportunities and managing the valuation, due diligence and execution process for new acquisitions, as well as the ongoing management of the acquired assets. Prior to Deutsche Asset and Wealth Management, he was at NM Rothschild advising on a range of corporate finance and M&A transactions in the infrastructure sector. Stuart Baldwin. Appointed to the board as a non-executive director from 3 March 2008. Stuart is the Global Head of Infrastructure for GIC, Singapore’s sovereign wealth fund. Stuart has overall responsibility for developing GIC’s global infrastructure business. Prior to joining GIC in 2002, Stuart was director, Strategic Investments of SingTel, based in Singapore. From 1992-1999, he was at London-based strategy consultancy, The COBA Group. Stuart is currently also a non-executive director of Heathrow, the UK airports group, and TIGF, a French gas transmission and storage business.
Kelda Holdings Limited Directors’ Report (continued) for the year ended 31 March 2014
50
Paul Barr. Appointed to the board as a non-executive director from 27 January 2012. Paul is a Vice President in the Infrastructure Group of GIC, Singapore’s sovereign wealth fund. From 1997 to 2012, Paul previously worked at Challenger Limited, Macquarie Bank, Ernst & Young, Arthur D Little and Wood Mackenzie. He was also previously a non-executive director of Welcome Break, the UK motorway services business. Paul is a member of the Institute of Chartered Accountants of Scotland, a CFA Institute Charterholder and was previously a member of the Chartered Institute for Securities and Investment. Elizabeth (Liz) Barber. Appointed to the board on 9 December 2010. Appointed as Group finance and regulation director to the board of Kelda Holdings Limited in November 2010. Liz joined the Group from Ernst & Young where she held a number of senior roles, including leading the firm’s national water team and the assurance practice across the North of England. She had been with Ernst & Young since 1987 and in that time worked with a number of water companies and the regulators in England, Wales and Scotland. Vicky Chan. Appointed to the board as a non-executive director on 26 September 2013. She is Chief Operating Officer of Citi Infrastructure Investors, a business unit of Citigroup Alternative Investments LLC, a wholly owned subsidiary of Citigroup Inc. Vicky is also a director of DP World Australia Limited and Itínere Infraestructuras, S.A.. Mark Chladek. Appointed to the board as alternate for Milton Fernandes in December 2012. Mark is a Director within Infracapital, the infrastructure equity arm of M&G Investments. Mark has over 13 years’ experience in the infrastructure sector as both an investor and advisor. Prior to Infracapital, Mark was within the Ernst & Young Infrastructure Finance team where he advised clients on transactions across many infrastructure sectors. Mark also holds board positions on a number of infrastructure portfolio companies in the utilities, telecommunications and broadcasting sectors. Mark is a member of the Institute of Chartered Accountants in England & Wales. Jean Daigneault. Appointed initially as an alternate director in September 2010, reappointed as alternate for Michael Osborne in February 2013. Jean is a Managing Director at PSP Investments (Montreal, Quebec) in its Infrastructure Investments group. Jean joined the Infrastructure Investments group at PSP Investments in September 2008. He is responsible for identifying and executing transactions across various infrastructure sector and geographies as well as monitoring portfolio investments. PSP Investments is a Limited Partner in the Citi Infrastructure Investor Fund and have made a significant co-investment in the Kelda Group. Robert (Bob) Davies. Appointed to the Board as an independent non-executive director with effect from 1 October 2012. Bob is also Chairman of Home Group, one of the UK’s leading housing associations. He was Chief Executive at Arriva Plc (1998-2006) and East Midlands Electricity Plc (1997-98). Since then he has been non-executive Chairman of Biffa Plc, Countrywide Plc and Euroports Holdings S.á r.l. He has also been a non-executive director of Barratt Developments Plc, British Energy Plc and Northern Rock (Asset Management) Plc and chaired the Board of Governors of Sunderland University.
Milton Fernandes. Appointed to the board as a non-executive director from 7 December 2012. Milton is a member of the Executive Committee of Infracapital, the infrastructure equity arm of M&G Investments. Milton has over 15 years’ experience in infrastructure investment. Prior to Infracapital, Milton was finance director of a specialist infrastructure PFI/PPP investor, where he was responsible for all aspects of finance and fund administration. He also holds board positions on a number of infrastructure portfolio
Kelda Holdings Limited Directors’ Report (continued) for the year ended 31 March 2014
51
companies in the health sector. Milton is a fellow of the Institute of Chartered Accountants in England & Wales. Richard Flint. Appointed to the Board on 25 March 2010. Chief executive of the Group with effect from 1 April 2010. He was director of the YW water business unit from 2003. Previously, he held a number of senior operational positions in YW. Antonio Herrera. Appointed to the board as alternate to Vicky Chan in September 2013. He is an Investment Principal within Citi Infrastructure Investors, a business unit of Citigroup Alternative Investments LLC, a wholly owned subsidiary of Citigroup Inc. Antonio is a director of Itínere Infraestructuras, S.A. and Vantage Airports Group Ltd.
Holly Koeppel. Appointed to the board as a non-executive director on 25 March 2010. She is Head of Citi Infrastructure Investors, a business unit of Citigroup Alternative Investments LLC, a wholly owned subsidiary of Citigroup Inc. Holly is chair of DP World Australia Limited and a director of Reynolds American Inc., Integrys Energy Group, Inc., Itínere Infraestructuras, S.A. and Vantage Airports Group Ltd. Holly has previously held roles in American Electric Power Company Inc, including Chief Financial Officer for three years and Executive Vice President for AEP Utilities East for three years. Prior to that she also held roles at Consolidated Natural Gas. Sara Leong. Appointed to the board on 27 March 2014 as alternate for Scott Auty. Sara is a Vice President of Deutsche Asset and Wealth Management, a division of Deutsche Bank. She joined Deutsche Bank in February 2012. Prior to that, Sara was at Macquarie Group Limited, focusing on the utilities and renewable sectors and held board positions at Thames Water and Wales & West Utilities; and project and structured finance at Australia and New Zealand Banking Group Limited. Sara is also a director of Northern Gas Networks.
Aparna Narain. Appointed to the board as a non-executive director on 27 March 2014. Aparna is a Vice President of Deutsche Asset and Wealth Management, a division of Deutsche Bank. She is responsible for identifying and analysing infrastructure investment opportunities, the implementation of transactions, and the ongoing management of acquired businesses. Prior to Deutsche Asset and Wealth Management, she worked for Citigroup, advising clients in the power and utilities sectors on a range of fixed income financings. Michael Osborne. Appointed to the board as a non-executive director on 31 January 2013. He is an Investment Principal within Citi Infrastructure Investors, a business unit of Citigroup Alternative Investments LLC, a wholly owned subsidiary of Citigroup Inc. Anthony Rabin. Appointed to the Board as an independent non-executive director with effect from 1 September 2012. Anthony has previously held roles at Balfour Beatty plc, including as executive director for 10 years, Chief Financial Officer for six years and Deputy Chief Executive for four years. He has a held a number of previous executive roles within Coopers & Lybrand (Partner, Structured Finance Group), Morgan Grenfell & Co (Senior Assistant Director) and Arthur Andersen & Co (Tax Compliance and Consultancy). He is currently also a non-executive director of Colt Group S.A., a listed telecommunications, IT managed services and data centre company.
Jane Seto. Appointed to the board as a non-executive director on 10 December 2010. Jane is a managing director of Deutsche Asset and Wealth Management, a division of Deutsche Bank, and is Portfolio Manager for the RREEF Pan-European Infrastructure

Kelda Holdings Limited Directors’ Report (continued) for the year ended 31 March 2014
52
Fund. She is responsible for the management of the Fund's portfolio businesses, as well as the ongoing expansion and development of Deutsche Bank's infrastructure’s business in Europe. Jane serves as a board director to numerous joint venture and portfolio investment companies. Prior to Deutsche Asset and Wealth Management, she spent 12 years in various roles at Bechtel Enterprises Inc., the infrastructure finance and development arm of Bechtel Group Inc. Kevin Whiteman. Appointed to the board on 19 September 2008. Kevin is chairman of Kelda Holdings Limited (formerly chief executive) and Kelda Eurobond Co Limited, and formerly chief executive and accounting officer of the National Rivers Authority and regional director of the EA. He joined Yorkshire Water in 1997 as business director for waste water, and became managing director in April 2000. He previously held senior positions with British Coal. He was appointed to the board of NG Bailey Ltd as a non-executive director on 1 April 2013 and assumed the role of non-executive chairman of that company on 25 July 2013. He is also a non-executive director on the board of Severfield Rowen plc. Hamish Mackenzie. Appointed to the board as an alternate non-executive director for Jane Seto on 1 June 2012. Hamish is a managing director of Deutsche Asset and Wealth Management, a division of Deutsche Bank, and is head of the European infrastructure equity and debt businesses. Prior to Deutsche Asset and Wealth Management, Hamish worked in Deutsche Bank’s corporate and investment banking division where he was a specialist in the transport and infrastructure sector, advising corporate and government clients on mergers, acquisitions and capital raisings. The company had directors’ and officers’ liability insurance in place throughout the financial year and up to the date of approval of the financial statements. By virtue of the articles of association, the company had also provided indemnity for its directors and the secretary, which is a qualifying third party indemnity provision for the purposes of the Companies Act 2006. Shareholders Wharfedale Acquisitions I LLP, which has a 10% shareholding in the Group is an entity jointly owned by Infracapital Partners LP (an infrastructure fund managed by M&G Investments) and Prudential Assurance Company Limited. All these entities are ultimately controlled by Prudential plc, a UK listed insurer. Citi Infrastructure Investors manages a 30.3% shareholding in the Group that is held through three English limited partnerships: Citi Infrastructure Partners, LP; CIP UK Water, LP; and CIP UK Water II, LP. The limited partners include sovereign funds, pension funds and insurers. GIC has a 26.3% shareholding in the Group and is a leading global investment firm with well over US$100 billion in assets under management. Established in 1981, GIC manages Singapore’s foreign reserves and is uniquely positioned for long-term and flexible investments across a wide range of asset classes. GIC has investments in over 40 countries. Headquartered in Singapore, GIC employs over 1,200 people across ten offices in key financial cities worldwide.
State Infrastructure Holdings 1 Pty Ltd is managed by Deutsche Australia Limited on behalf of SAS Trustee Corporation and has a 10% shareholding in the Group. SAS
Kelda Holdings Limited Directors’ Report (continued) for the year ended 31 March 2014
53
Trustee Corporation is a pension fund for government employees of the state of New South Wales, Australia. Infrastructure Saxon Sarl is owned by the RREEF Pan-European Infrastructure Fund, which is managed by Deutsche Alternative Asset Management (UK) Limited ("DeAAM"). DeAAM is part of Deutsche Asset and Wealth Management, a division of Deutsche Bank, which has €934 billion of assets under management (as of 31 March 2014) and which has a 23.4% shareholding in the Group. Research and development The Group undertakes a programme of research in pursuit of improvements in service and operating efficiency. During the year, £8.7m (2013: £4.1m) was committed to research and development including £8.4m (2013: £3.4m) on non-current assets. Valuation of assets The Group has adopted an accounting policy of valuation in respect of certain categories of fixed assets (infrastructure assets, residential properties, non-specialised properties and rural estates) which are held in the balance sheet at valuation (less accumulated depreciation), based on their existing use value. Certain categories of the Group’s land and buildings were valued by independent qualified valuers in March 2014. As a result of the valuation carried out at 31 March 2014 the carrying value of land and buildings was increased by £17.2m and the resulting revaluation surplus taken to the revaluation reserve together with an associated deferred tax impact of £3.4m. As a result of the same revaluation certain properties were impaired and an impairment loss of £0.9m was recognised in the profit and loss. Further details are provided in note 12 to the financial statements. The policy of holding these assets at valuation rather than historic cost has no impact on bank covenants or on distributable reserves. The policy is intended to better reflect the value of those asset classes in the financial statements. These assets will be revalued on a periodic basis, to coincide with valuations required for future Ofwat Periodic Reviews. Diversity and human rights The Group is working to ensure a gender balanced workplace and is actively engaged in the Pearls Programme to positively influence the national gender imbalance. Below is a gender breakdown for the Group. Figures show the total number of employees on 31 March 2014.
Number of employees
Male Female
Directors 11 5
Senior managers 28 5
Total employees 2,207 1,065 The Group policy on human rights recognises international human rights as set out in the International Bill of Human Rights, and the principles described in the UN Global Compact. The policy was approved as a Kelda Group policy in 2013 and can be found at:
Kelda Holdings Limited Directors’ Report (continued) for the year ended 31 March 2014
54
http://www.keldagroup.com/media/2497/e5-human-rights-policy.pdf. The successful implementation of the Human Rights Policy is heavily influenced by the cooperation and support of the supply chains. Accordingly, the Group actively manages and monitors the supply chains to ensure working practices are consistent with the policy. Employees and employment policies The Group continues to strive to create a positive working environment for all colleagues and in developing open and trusted relationships. The Group values colleague involvement and engagement at all levels, recognising that everyone in the business has a contribution to make and is a potential source of innovation and change. The Group Values set the framework for how the Group expects colleagues and partners to behave with each other, with customers and with external stakeholders. Great communications lie at the heart of engaging with colleagues. The Group recognise the need for, and benefits of, providing employees with information on matters of concern to them as employees, and doing so in a planned manner, using a range of channels. The Group intranet ensures that all employees have access to key information in a consistent manner. In addition there is a continued emphasis on a ‘face to face first’ approach and two-way channels, including regular ‘Team Talks’ and ‘Talk Back’ sessions with line managers and the directors. Business plan cascades take place at the beginning of each year, with common information available to all colleagues and more detailed business unit information available by function, for discussion in teams. Further updates are provided throughout the year so that colleagues are kept informed about factors of an economic and financial nature which impact on the company performance. At a very local level, team “hub” meetings provide the opportunity for around 900 operational employees to talk about team performance and problem resolution on a regular basis, in person with each other. Quarterly employee surveys are undertaken throughout the company, using an online survey – “Post Your Views”. All line managers are encouraged to develop and implement action plans with their teams, taking accountability for developing colleague morale, engagement and trusted relationships. To further promote successful employee relations, the Group demonstrates its commitment to effective and two way communication through its information and consultation framework. Collection bargaining arrangements are in place with the Group’s recognised trade unions – UNISON, GMB and Unite. In addition, Communication and Consultation forums take place across the Group, comprising elected union and non-union employees meeting regularly with directors and senior managers. At these meetings the Group shares performance information, discusses health and safety issues as well as providing an opportunity for two-way face to face dialogue in which employees views can be sought and then taken into account in making decisions which affect them. The Group is committed to providing a diverse and inclusive working environment that reflects its customer base. This is integral to the delivery of the Strategic Business Objectives and Vision: taking responsibility for the water environment for good. The Group’s diversity and inclusion policy promotes equality of opportunity for all employees and stakeholders, ensuring that discrimination of all forms is avoided, including but not limited to discrimination on the grounds of: gender; pregnancy; age; race; colour; nationality; ethnic and national origin; sexuality/sexual orientation; religion and belief; disability; marital status; membership of a trade union; and part-time or fixed term employee status. In all areas of employment, including recruitment, training, career
Kelda Holdings Limited Directors’ Report (continued) for the year ended 31 March 2014
55
development and promotion, the company do not treat less favourably any applicant for employment or current employee by conditions or requirements which cannot be justified. Throughout 2013/14 a director-sponsored Diversity and Inclusion Working Group actively drove diversity and inclusion matters, with a remit to ensure that the diversity and inclusion policy is reviewed regularly and properly integrated in the business. By ensuring that diversity and inclusion principles underpin all of our work and the services provided, we are supported in maintaining sector leading performance. The Group aims to attract, select, develop and retain the best talent to meet the needs of the business at all times. There is a strong commitment to understanding future skills requirements and ensuring that plans are in place to meet our evolving needs. Particular emphasis is to be given to developing the pipeline of technical talent and to responding to key developments within the industry that will create the need for the acquisition and development of new skills not previously recruited. The Group’s approach to talent management is fully inclusive and creates a framework to discuss aspirations, skills and development needs at all levels. This activity will be developed further in the coming months and years with the aim of retaining critical skills within the organisation, by enabling greater progression of talent internally. The Group places great emphasis on enhancing business performance by maximising individual, team and organisational capability through the development of safety, technical, behavioural and leadership skills. Leadership skills are recognised and developed using our ‘Responsible Leader’ framework which focuses on ‘Knowing the World of Water’; ‘Operational Excellence’; and ‘Personal Leadership’. A wide range of development tools are provided, including in-house and accredited programmes to help all employees develop the necessary skills, knowledge, values and experience to realise their performance potential. An example of a current tool being used is the MySkills framework, which has already assessed the competencies required in over 30 key roles to ensure that the company builds appropriate development programmes and better understand capability gaps. The largest recent learning and development investment is in the delivery of H&S training to ensure colleagues are safe and capable in performing in their role. The Group has a diverse range of H&S programmes including managing dangerous substances, fire safety and electrical and mechanical H&S. Strong partnerships across the business have been built to design some technical training solutions, including a unique industry first for the CO2llaborate Energy Optimisation Programme, to improve the skills of about 600 colleagues. This will play an important contribution in reducing energy consumption and associated financial and environmental costs. The Group recognises the challenges of delivering quality training quickly and cost effectively across the region, and also being able to demonstrate improvement in competence rather than just attending training. To meet this challenge the company has invested in an eLearning platform that will increase the access of L&D across the company. As well as developing a talent management culture to help drive business success, the Group has several resourcing solutions which are well regarded. The Group’s award winning graduate recruitment programme has a strong reputation and has been recognised at both regional and national levels. In 2011 and 2012 YW was named as the graduate employer of choice in the private sector in Yorkshire. In addition, the Guardian newspaper named the company in its Top 10 Graduate Employers for Energy and Utilities
Kelda Holdings Limited Directors’ Report (continued) for the year ended 31 March 2014
56
for the past three consecutive years following its biggest ever survey of UK graduates. The Group’s apprentice training scheme is also well established. Launched in 2010, the scheme currently has 58 apprentices in various areas of the business. Current plans will increase that number further in 2015. Key to achieving operational excellence and delivering out-performance is ensuring that every individual understands their role and how they can make a difference while feeling valued for their contribution. The Group is committed to rewarding the right performance and provide salary and benefits packages which are designed to be competitive. Performance related pay gives colleagues at all levels the opportunity to share in the success of the business, through quarterly or annual bonus payments linked to the achievement of individual and business plan targets.
Health and safety It is essential that the Group works to prevent harm and protect health across all stages of its business operations, environments and communities. The drive for continual improvement is supported by an Occupational Health & Safety Management System (OHSMS). This enables the Group to enhance its health and safety performance and to maintain a clear focus on meeting the needs of its people, stakeholders, customers and members of the public. This is at the heart of the company approach. The Group:
• Complies with duties under the Health and Safety at Work etc. Act 1974 and all other relevant legislation, and where reasonably practicable seeks to exceed legislative requirements;
• Thoroughly identifies hazards and risks and implement appropriate and effective controls to eliminate or reduce them. Nothing is so important that time cannot be taken to do it safely;
• Ensures the competence of all employees by providing suitable training, monitoring, supervision and leadership to ensure that our OH&S policies and procedures are complied with and standards are maintained;
• Ensures the competence of all suppliers, partners and contractors who work on behalf of the company by assessing and monitoring their OH&S management systems and performance;
• Ensures that wherever and whenever internal or external colleagues are at work that the risks to their health and safety are managed down to a level as low as is reasonably practicable. This will also apply to members of the public visiting areas of rural estates that are open to public access;
• Manages all business, activities, operations and assets in a manner which seeks to eliminate injuries, incidents and ill health and minimise any consequences that might arise in the event of any incident;
• Continually reviews, challenges and sets OH&S objectives and performance through the business planning cycle; and
• Aims to meet all of the above promises at an affordable cost. The OHSMS is designed to be compliant with the standards and expectations of OHSAS18001 and also the HSE’s HSG65. It consists of an integrated framework linking the following key system elements:
Kelda Holdings Limited Directors’ Report (continued) for the year ended 31 March 2014
57
• Clear understanding of and compliance with applicable health and safety legislation;
• Concise corporate policy statement outlining our commitment to continually improve;
• Clear management standards to provide governance and assurance that risk controls are identified, established and effective;
• Detailed management procedures to address specific legislative and business risks;
• Continual risk identification, assessment and escalation processes from task / activity risk through to corporate strategic risk;
• Provision of adequate and competent resources and supervision; • Safe implementation of work activities through planning, effective risk controls and
compliance with safe working and business procedures such as EMS, QMS etc.; and
• Performance evaluation of the system in action through KPI measurement, inspection and audit and continual improvement through management review and corrective action.
In essence, the management system is a Plan – Do – Check – Act continuous improvement cycle and is underpinned by the following principles:
• Strong and active leadership from the top down – visible, active commitment; effective ‘downward’ communications systems and management structures and integration of good health and safety management with business decisions.
• Employee engagement and involvement – promoting safe and health conditions, effective ’upward’ communication and providing high quality training.
• Assessment and review – identifying and managing health and safety risks; accessing and following competent advice and monitoring, reporting and reviewing performance.
The OHSMS is designed to make it easy for leaders to integrate health and safety requirements and expectations into their day to day routine business activities and in return be successful in delivering excellent business performance through operational excellence, employee engagement and above all safe and healthy people and places to work. It is a live and dynamic system and is continually reviewed and improved as the company understands and learns from its business risks, performance, incidents, injuries, inspections and audits. Political donations The Group does not support any political party and does not make what are commonly regarded as donations to any political party or other political organisations. However the definition of “donations” in the Political Parties Elections and Referendums Act 2000 covers a number of activities which form part of the necessary relationship between the company and stakeholders. This includes promoting the Group’s activities at the main political parties’ annual conferences. As part of its stakeholder engagement programme the Group incurred expenditure of £16,000 in such activities.
Kelda Holdings Limited Directors’ Report (continued) for the year ended 31 March 2014
58
Independent auditors The independence and objectivity of the external auditors is considered on a regular basis, with particular regard to the level of non-audit fees. The Group has adopted an auditor independence policy which establishes procedures and guidance under which the Group’s relationship with its external auditors is governed so that the audit committee is able to satisfy itself that there are no factors which may, or may be seen to, impinge upon the independence and objectivity of the audit process. The auditors, PricewaterhouseCoopers LLP, have indicated their willingness to continue in office. Financial instruments Details are provided in the financial statements section under note 22. Likely future developments Future events are dealt with as part of the Strategic Report on pages 1 to 36. Annual general meeting Kelda Holdings Limited has dispensed with the requirement to hold an annual general meeting. Environment The environmental policy of the Group recognises that a sustainable water and waste water business is dependent on environmentally sustainable operations. It is therefore committed to integrating environmental best practice and continuous improvement in environmental performance through the efficient, effective and proper conduct of its business. Environmental performance of YW is reported through the YW website which is regularly updated. This can be viewed at www.yorkshirewater.com/our-environment.aspx. Community The Group contributes actively to the communities which it serves. It encourages and supports colleagues in volunteering, charitable giving and community involvement. One in three employees is active in a wide range of supported community activities. These include a Speakers’ Panel and support to local education ranging from governor appointments, and Right to Read in junior schools through to coaching at senior schools and mentoring university students from diverse ethnic backgrounds.
Kelda Holdings Limited Directors’ Report (continued) for the year ended 31 March 2014
59
Directors’ statement as to disclosure of information to auditors Each director in office at the date of this report confirms that, to the best of their knowledge:
• The financial statements give a true and fair view of the assets, liabilities, financial position and profit of the company: and
• The Strategic Report includes a fair review of the development and performance of the business and the position of the company, together with a description of the principal risks and uncertainties that it faces.
Each director in office at the date of this report confirms that:
• so far as the director is aware, there is no relevant audit information of which the company’s auditors are unaware; and
• each director has taken all the steps as he or she ought to have taken as a director in order to make him or herself aware of any relevant audit information, and to establish that the company’s auditors are aware of that information.
Kelda Holdings Limited Directors’ Report (continued) for the year ended 31 March 2014
60
Statement of Directors’ responsibilities The directors are responsible for preparing the Annual Report and the Financial Statements in accordance with applicable law and regulations. The directors consider that this annual report and financial statements, taken as a whole, is fair, balanced and understandable and provides the information necessary for shareholders and other stakeholders to assess the company’s performance, business model and strategy. Company law requires the directors to prepare financial statements for each financial year. Under that law the directors have prepared the Group financial statements in accordance with International Financial Reporting Standards (IFRSs) as adopted by the European Union, and the parent company financial statements in accordance with United Kingdom Generally Accepted Accounting Practice (United Kingdom Accounting Standards and applicable law). Under company law the directors must not approve the financial statements unless they are satisfied that they give a true and fair view of the state of affairs of the Group and the company and of the profit or loss of the Group for that period. In preparing these financial statements, the directors are required to:
• select suitable accounting policies and then apply them consistently; • make judgements and accounting estimates that are reasonable and prudent; and • state whether IFRSs as adopted by the European Union and applicable UK
Accounting Standards have been followed, subject to any material departures disclosed and explained in the Group and parent company financial statements respectively.
The directors are responsible for keeping adequate accounting records that are sufficient to show and explain the Group’s transactions and disclose with reasonable accuracy at any time the financial position of the Group and enable them to ensure that the financial statements comply with the Companies (Jersey) Law 1991. They are also responsible for safeguarding the assets of the company and the Group and hence for taking reasonable steps for the prevention and detection of fraud and other irregularities. The directors’ report was approved by a duly authorised committee of the board of directors on 18 November 2014 and signed on its behalf by:
Richard Flint , Director 18 November 2014 Company secretary: Crestbridge Ltd Registered address: 47 Esplanade St Helier Jersey JE1 0BD Channel Islands
Kelda Holdings Limited Directors’ Remuneration Report for the year ended 31 March 2014
61
Statement by the Chair of the Remuneration Committee On behalf of the Kelda Group Remuneration Committee (the committee), I am pleased to present the directors’ remuneration report for the year ended 31 March 2014. During the year in question, as it has done for previous years, YW has operated its remuneration policy at a Group level. However, the YW board proposes to establish a separate YW remuneration committee during the financial year 2014/15 to consider matters as set out in its terms of reference insofar as they apply specifically to the affairs of that company. This new committee will be chaired by a YW non-executive director. The terms of reference of the committee are available on request from the Group company secretary and can be accessed on the corporate governance section of the Group’s website, at: www.keldagroup.com/corporate governance. During the year the committee met three times and passed one written resolution and amongst other things carried out the following activities;
• reviewed the remuneration packages of KMT; • assessed the achievement of targets for the 2013/14 annual incentive plan; • assessed the measurement of performance conditions for the long term incentive
plan (LTIP) awards vesting in 2013 and set the targets for awards made in 2013; • considered reward packages for the Group • considered succession plans for KMT and other senior managers in the Group; • considered the fees for non-executive directors of YW; • considered market trends and quoted company senior executive remuneration; and • considered the impact of the revised remuneration reporting regulations on the
Group. The basic salary of the Group chief executive increased by 2.7% from £370,000 to £380,000 and the salary of the Group finance and regulation director rose by 2.5% from £264,007 to £270,607. Annual bonuses are based on the achievements of targets measured across the Group’s SBOs as described in the body of this report. Bonuses of 80% of the maximum were awarded to both the Group chief executive and the Group finance and regulation director reflecting the strong performance achieved by the Group.
Holly Koeppel Chair of the Remuneration Committee
Kelda Holdings Limited Directors’ Remuneration Report for the year ended 31 March 2014
62
Introduction The Remuneration Committee at the end of the year was made up of seven non-executive directors namely Holly Koeppel (committee chair), Scott Auty, Stuart Baldwin, Milton Fernandes, Martin Havenhand, Jane Seto and Kevin Whiteman. As reported in the 2013 Annual Report Martin Havenhand who is an independent non-executive director of was appointed to the committee with effect from 1 April 2013 and during the year Scott Auty was appointed on 27 March 2014. The committee chair reports on the activities of the Committee to the Board meeting immediately following each Committee meeting. Richard Flint, chief executive, and Pamela Rogerson, Yorkshire Water director of HR and human resources, and the Group company secretary attend all meetings. Liz Barber, director of finance and regulation attends by invitation. Pamela Rogerson acts as adviser to the Committee and external advisers attend on an ad hoc basis to advise the Committee as necessary. Scott Auty attended as alternate for Jane Seto and Paul Barr as alternate for Stuart Baldwin on one occasion each during the reporting year. Martin Havenhand attended two of the three meetings. For guidance in recommending remuneration packages, the committee uses published surveys carried out by remuneration consultants, as well as internal research, together with other ad hoc projects to support the objective of ensuring competitive and sustainable remuneration. New Bridge Street Consultants advise the Group and the committee on a variety of remuneration related issues. The Group does not use New Bridge Street Consultants in any capacity other than as an independent adviser on remuneration matters. Judith Levy from New Bridge Street attended the committee meeting on 30 January 2014. The purpose of the meeting was to update and provide advice to the committee on the new Reporting Regulations. Judith Levy also provided some updated information of remuneration in the Water Industry. As a result of this meeting, the committee determined the timescales for complying with the Reporting Regulations. No changes were proposed or determined in terms of the executive remuneration policy. In 2013/14, New Bridge Street attended that one committee meeting and was paid a fee of £6,426. The committee makes recommendations to the Board in respect of the Group on the framework of executive remuneration, and its cost. It determines the remuneration and conditions of employment of the chairman, executive directors and the next most senior category of executives, including the terms of any compensation in the event of early termination of an executive director’s contract. It also operates the Group’s long term incentive plan. In determining the remuneration of executive directors and other senior executives, the committee also takes into account the level of remuneration and pay awards made generally to employees of the Group. The design of performance–related remuneration for executive directors and other senior management of the Group takes into account the provisions of Schedule A of the UK Corporate Governance Code. The Group’s remuneration policy is set out in detail below and takes account of the views of the committee. The Group’s policy is to establish remuneration packages which enable the
Kelda Holdings Limited Directors’ Remuneration Report for the year ended 31 March 2014
63
Group to attract, retain and motivate people with the skills and experience necessary to lead and manage a business of the Group’s size and complexity. Remuneration packages should be aligned with the interests of the Group’s stakeholders, in particular its shareholders and customers. In recommending remuneration packages, the committee follows the principle of recognition of the individual’s contribution to the business. The Group intends that remuneration packages continue to be developed to enable executive directors to receive remuneration which is positioned in the upper quartile of the market for upper quartile performance, compared to relevant market and industry comparators and taking into account individual performance, responsibilities and experience. Accordingly, a significant proportion of directors’ remuneration is performance related through annual and long term incentive plan awards. Further details of the proportions are included in the sections below and in the directors’ emoluments table on page 77. The design of the total remuneration package is intended to achieve a weighting of each component to ensure that above average remuneration is available through performance related elements rather than base salary. The Group treats remuneration strategy and its people resource as key components in delivering its vision to the shareholders of the Company and to the customers of the Group’s businesses. At the same time, the Group recognises fully the sensitivities of such matters and the need for due care and attention to be taken when considering such issues. Statement of Remuneration Policy Remuneration Policy in 2014/15 Overall remuneration policy for executives remains unchanged for 2014/15. The structure of the annual incentive scheme is unchanged. However, clear targets have been determined for the business plan year 2014/15 and these will be material in determined actual performance and therefore any bonus payable. The relevant measures and targets for the long term incentive scheme 2014/15 have not yet been determined as they are dependent to an extent on the outcome of the YW PR14 price review process. There are no planned changes to the LTIP policy for 2014/15 other than responding to changes in the Ofwat Service Incentive Mechanism (SIM). The LTIP scheme considers three performance conditions, SIM, Serviceability and Cash Available for Distributions. The Cash Available for Distributions target will be confirmed following the PR14 Final Determination. As at the date of this report, it is understood that Ofwat intends to change the way customer service is measured and that a pilot will take place in 2014/15. The committee is considering amendments to the SIM performance condition on the LTIP. The performance conditions are set out below on pages 65 to 67. The committee determines all aspects of remuneration for executive and non-executive directors. In addition, the committee retains discretion over the application of performance related pay policy. The policy for determining the remuneration package for a new executive director is detailed below:
• basic pay will be determined to a maximum of the median market salary for the role when benchmarked across the Water Industry and/or Utilities;
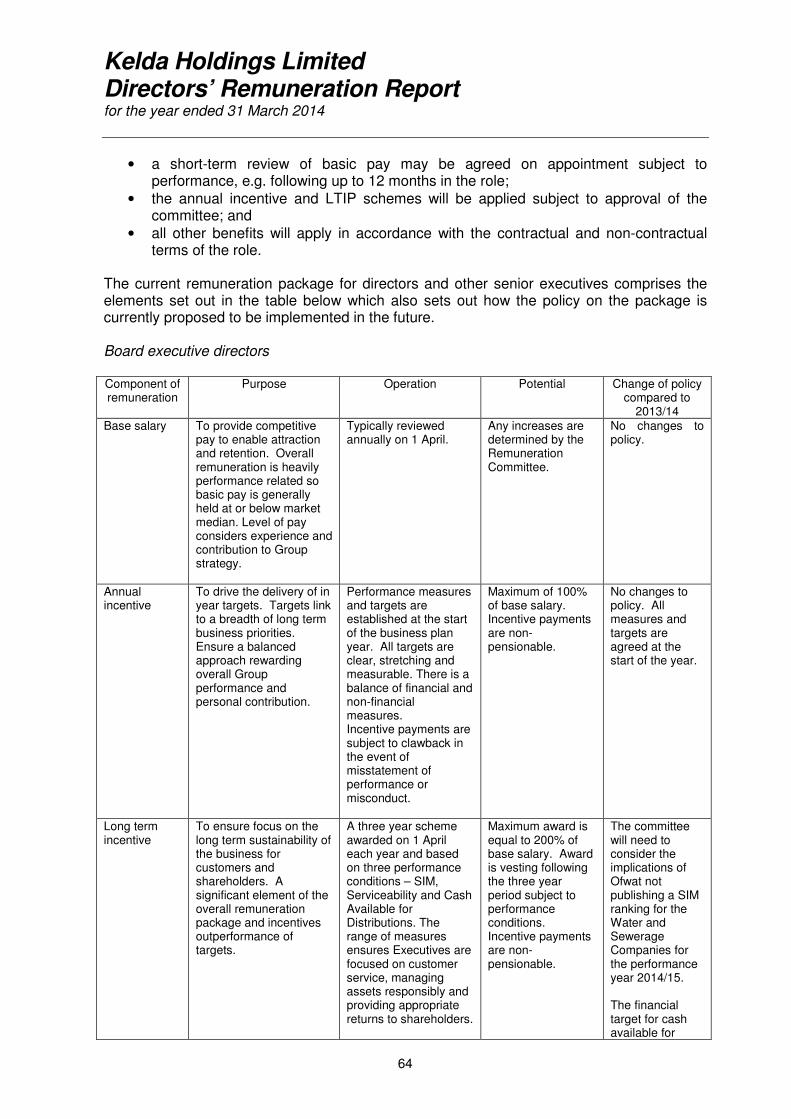
Kelda Holdings Limited Directors’ Remuneration Report for the year ended 31 March 2014
64
• a short-term review of basic pay may be agreed on appointment subject to performance, e.g. following up to 12 months in the role;
• the annual incentive and LTIP schemes will be applied subject to approval of the committee; and
• all other benefits will apply in accordance with the contractual and non-contractual terms of the role.
The current remuneration package for directors and other senior executives comprises the elements set out in the table below which also sets out how the policy on the package is currently proposed to be implemented in the future. Board executive directors Component of remuneration
Purpose Operation Potential Change of policy compared to
2013/14 Base salary To provide competitive
pay to enable attraction and retention. Overall remuneration is heavily performance related so basic pay is generally held at or below market median. Level of pay considers experience and contribution to Group strategy.
Typically reviewed annually on 1 April.
Any increases are determined by the Remuneration Committee.
No changes to policy.
Annual incentive
To drive the delivery of in year targets. Targets link to a breadth of long term business priorities. Ensure a balanced approach rewarding overall Group performance and personal contribution.
Performance measures and targets are established at the start of the business plan year. All targets are clear, stretching and measurable. There is a balance of financial and non-financial measures. Incentive payments are subject to clawback in the event of misstatement of performance or misconduct.
Maximum of 100% of base salary. Incentive payments are non-pensionable.
No changes to policy. All measures and targets are agreed at the start of the year.
Long term incentive
To ensure focus on the long term sustainability of the business for customers and shareholders. A significant element of the overall remuneration package and incentives outperformance of targets.
A three year scheme awarded on 1 April each year and based on three performance conditions – SIM, Serviceability and Cash Available for Distributions. The range of measures ensures Executives are focused on customer service, managing assets responsibly and providing appropriate returns to shareholders.
Maximum award is equal to 200% of base salary. Award is vesting following the three year period subject to performance conditions. Incentive payments are non-pensionable.
The committee will need to consider the implications of Ofwat not publishing a SIM ranking for the Water and Sewerage Companies for the performance year 2014/15. The financial target for cash available for
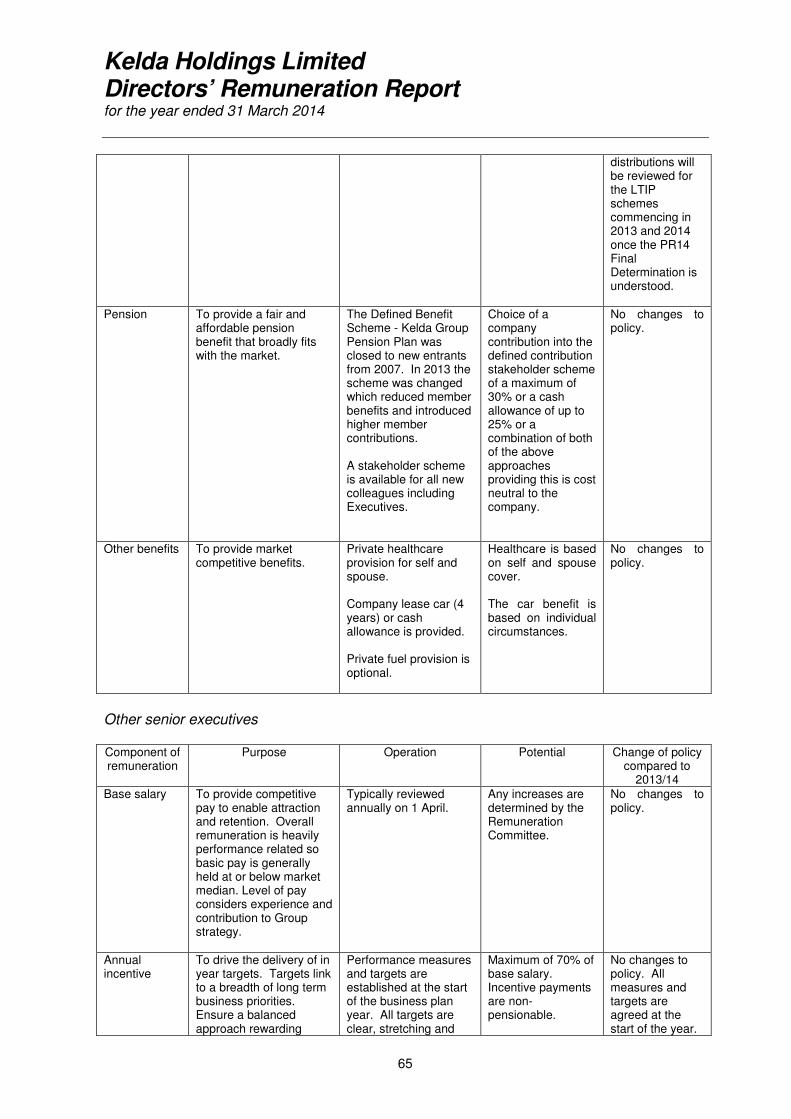
Kelda Holdings Limited Directors’ Remuneration Report for the year ended 31 March 2014
65
distributions will be reviewed for the LTIP schemes commencing in 2013 and 2014 once the PR14 Final Determination is understood.
Pension To provide a fair and affordable pension benefit that broadly fits with the market.
The Defined Benefit Scheme - Kelda Group Pension Plan was closed to new entrants from 2007. In 2013 the scheme was changed which reduced member benefits and introduced higher member contributions. A stakeholder scheme is available for all new colleagues including Executives.
Choice of a company contribution into the defined contribution stakeholder scheme of a maximum of 30% or a cash allowance of up to 25% or a combination of both of the above approaches providing this is cost neutral to the company.
No changes to policy.
Other benefits To provide market competitive benefits.
Private healthcare provision for self and spouse. Company lease car (4 years) or cash allowance is provided. Private fuel provision is optional.
Healthcare is based on self and spouse cover. The car benefit is based on individual circumstances.
No changes to policy.
Other senior executives Component of remuneration
Purpose Operation Potential Change of policy compared to
2013/14 Base salary To provide competitive
pay to enable attraction and retention. Overall remuneration is heavily performance related so basic pay is generally held at or below market median. Level of pay considers experience and contribution to Group strategy.
Typically reviewed annually on 1 April.
Any increases are determined by the Remuneration Committee.
No changes to policy.
Annual incentive
To drive the delivery of in year targets. Targets link to a breadth of long term business priorities. Ensure a balanced approach rewarding
Performance measures and targets are established at the start of the business plan year. All targets are clear, stretching and
Maximum of 70% of base salary. Incentive payments are non-pensionable.
No changes to policy. All measures and targets are agreed at the start of the year.
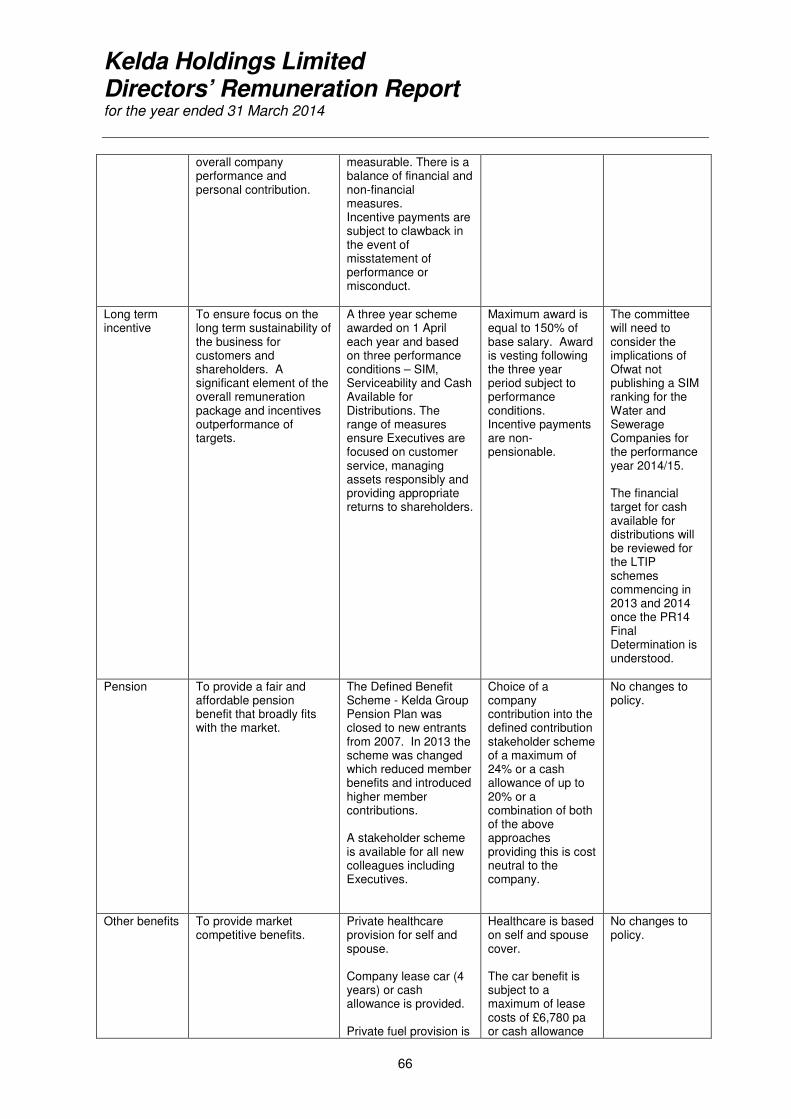
Kelda Holdings Limited Directors’ Remuneration Report for the year ended 31 March 2014
66
overall company performance and personal contribution.
measurable. There is a balance of financial and non-financial measures. Incentive payments are subject to clawback in the event of misstatement of performance or misconduct.
Long term incentive
To ensure focus on the long term sustainability of the business for customers and shareholders. A significant element of the overall remuneration package and incentives outperformance of targets.
A three year scheme awarded on 1 April each year and based on three performance conditions – SIM, Serviceability and Cash Available for Distributions. The range of measures ensure Executives are focused on customer service, managing assets responsibly and providing appropriate returns to shareholders.
Maximum award is equal to 150% of base salary. Award is vesting following the three year period subject to performance conditions. Incentive payments are non-pensionable.
The committee will need to consider the implications of Ofwat not publishing a SIM ranking for the Water and Sewerage Companies for the performance year 2014/15. The financial target for cash available for distributions will be reviewed for the LTIP schemes commencing in 2013 and 2014 once the PR14 Final Determination is understood.
Pension To provide a fair and affordable pension benefit that broadly fits with the market.
The Defined Benefit Scheme - Kelda Group Pension Plan was closed to new entrants from 2007. In 2013 the scheme was changed which reduced member benefits and introduced higher member contributions. A stakeholder scheme is available for all new colleagues including Executives.
Choice of a company contribution into the defined contribution stakeholder scheme of a maximum of 24% or a cash allowance of up to 20% or a combination of both of the above approaches providing this is cost neutral to the company.
No changes to policy.
Other benefits To provide market competitive benefits.
Private healthcare provision for self and spouse. Company lease car (4 years) or cash allowance is provided. Private fuel provision is
Healthcare is based on self and spouse cover. The car benefit is subject to a maximum of lease costs of £6,780 pa or cash allowance
No changes to policy.
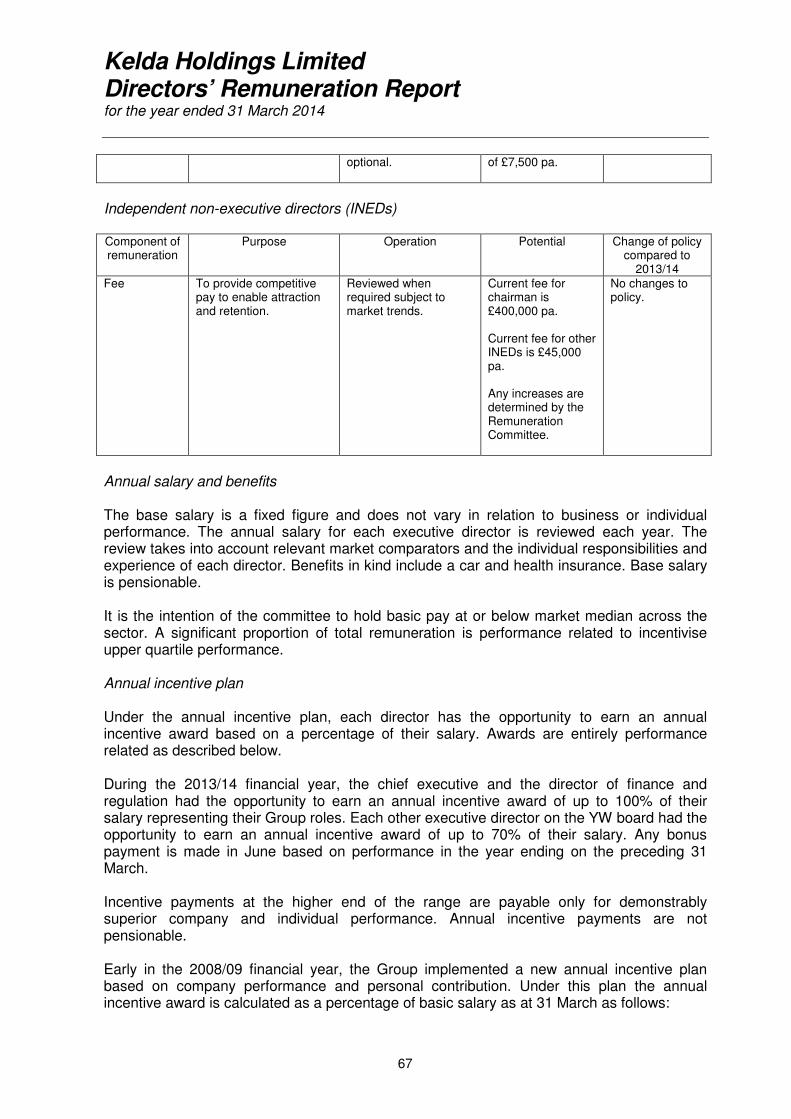
Kelda Holdings Limited Directors’ Remuneration Report for the year ended 31 March 2014
67
optional.
of £7,500 pa.
Independent non-executive directors (INEDs) Component of remuneration
Purpose Operation Potential Change of policy compared to
2013/14 Fee To provide competitive
pay to enable attraction and retention.
Reviewed when required subject to market trends.
Current fee for chairman is £400,000 pa. Current fee for other INEDs is £45,000 pa. Any increases are determined by the Remuneration Committee.
No changes to policy.
Annual salary and benefits The base salary is a fixed figure and does not vary in relation to business or individual performance. The annual salary for each executive director is reviewed each year. The review takes into account relevant market comparators and the individual responsibilities and experience of each director. Benefits in kind include a car and health insurance. Base salary is pensionable. It is the intention of the committee to hold basic pay at or below market median across the sector. A significant proportion of total remuneration is performance related to incentivise upper quartile performance. Annual incentive plan Under the annual incentive plan, each director has the opportunity to earn an annual incentive award based on a percentage of their salary. Awards are entirely performance related as described below. During the 2013/14 financial year, the chief executive and the director of finance and regulation had the opportunity to earn an annual incentive award of up to 100% of their salary representing their Group roles. Each other executive director on the YW board had the opportunity to earn an annual incentive award of up to 70% of their salary. Any bonus payment is made in June based on performance in the year ending on the preceding 31 March. Incentive payments at the higher end of the range are payable only for demonstrably superior company and individual performance. Annual incentive payments are not pensionable. Early in the 2008/09 financial year, the Group implemented a new annual incentive plan based on company performance and personal contribution. Under this plan the annual incentive award is calculated as a percentage of basic salary as at 31 March as follows:
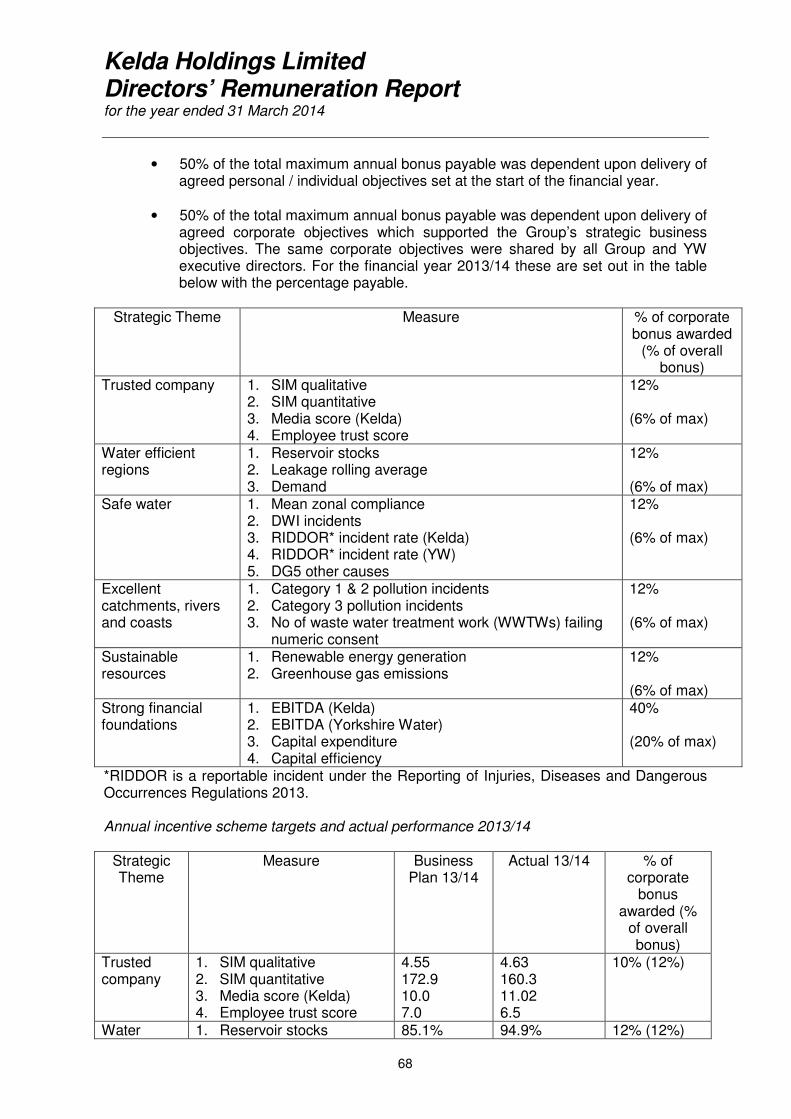
Kelda Holdings Limited Directors’ Remuneration Report for the year ended 31 March 2014
68
• 50% of the total maximum annual bonus payable was dependent upon delivery of agreed personal / individual objectives set at the start of the financial year.
• 50% of the total maximum annual bonus payable was dependent upon delivery of agreed corporate objectives which supported the Group’s strategic business objectives. The same corporate objectives were shared by all Group and YW executive directors. For the financial year 2013/14 these are set out in the table below with the percentage payable.
Strategic Theme Measure % of corporate
bonus awarded (% of overall
bonus) Trusted company 1. SIM qualitative
2. SIM quantitative 3. Media score (Kelda) 4. Employee trust score
12% (6% of max)
Water efficient regions
1. Reservoir stocks 2. Leakage rolling average 3. Demand
12% (6% of max)
Safe water 1. Mean zonal compliance 2. DWI incidents 3. RIDDOR* incident rate (Kelda) 4. RIDDOR* incident rate (YW) 5. DG5 other causes
12% (6% of max)
Excellent catchments, rivers and coasts
1. Category 1 & 2 pollution incidents 2. Category 3 pollution incidents 3. No of waste water treatment work (WWTWs) failing
numeric consent
12% (6% of max)
Sustainable resources
1. Renewable energy generation 2. Greenhouse gas emissions
12% (6% of max)
Strong financial foundations
1. EBITDA (Kelda) 2. EBITDA (Yorkshire Water) 3. Capital expenditure 4. Capital efficiency
40% (20% of max)
*RIDDOR is a reportable incident under the Reporting of Injuries, Diseases and Dangerous Occurrences Regulations 2013. Annual incentive scheme targets and actual performance 2013/14
Strategic Theme
Measure Business Plan 13/14
Actual 13/14 % of corporate
bonus awarded (%
of overall bonus)
Trusted company
1. SIM qualitative 2. SIM quantitative 3. Media score (Kelda) 4. Employee trust score
4.55 172.9 10.0 7.0
4.63 160.3 11.02 6.5
10% (12%)
Water 1. Reservoir stocks 85.1% 94.9% 12% (12%)
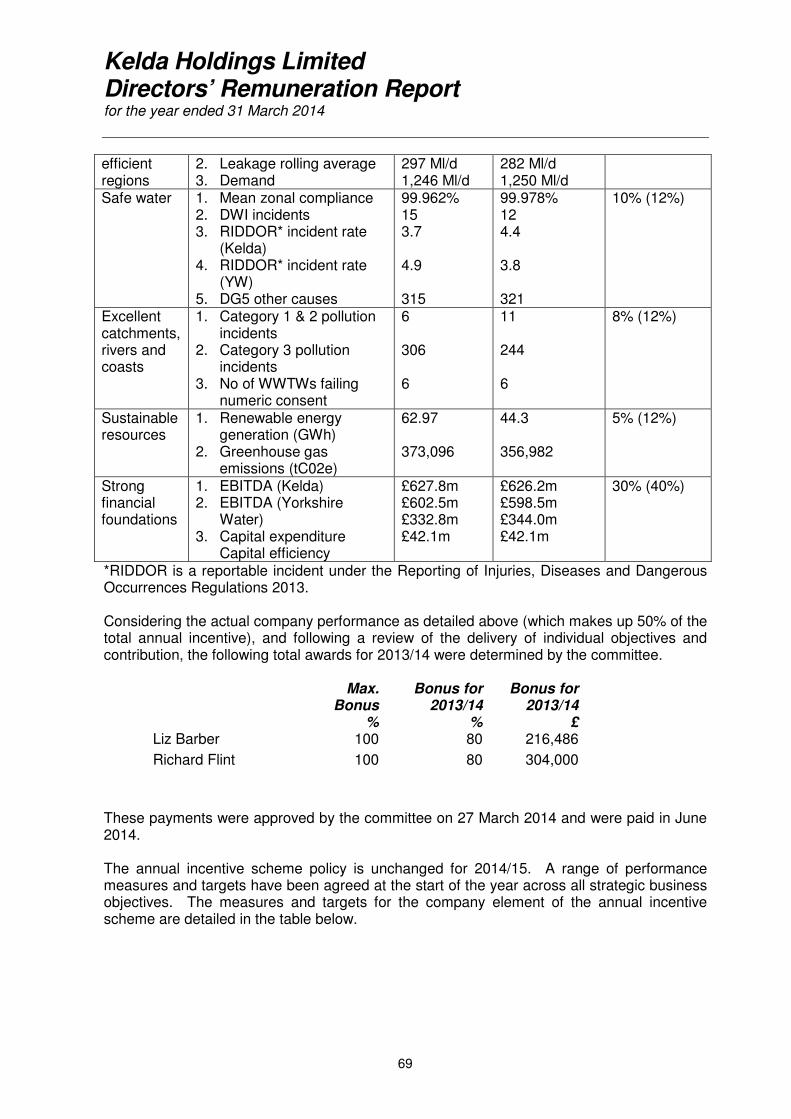
Kelda Holdings Limited Directors’ Remuneration Report for the year ended 31 March 2014
69
efficient regions
2. Leakage rolling average 3. Demand
297 Ml/d 1,246 Ml/d
282 Ml/d 1,250 Ml/d
Safe water 1. Mean zonal compliance 2. DWI incidents 3. RIDDOR* incident rate
(Kelda) 4. RIDDOR* incident rate
(YW) 5. DG5 other causes
99.962% 15 3.7 4.9 315
99.978% 12 4.4 3.8 321
10% (12%)
Excellent catchments, rivers and coasts
1. Category 1 & 2 pollution incidents
2. Category 3 pollution incidents
3. No of WWTWs failing numeric consent
6 306 6
11 244 6
8% (12%)
Sustainable resources
1. Renewable energy generation (GWh)
2. Greenhouse gas emissions (tC02e)
62.97 373,096
44.3 356,982
5% (12%)
Strong financial foundations
1. EBITDA (Kelda) 2. EBITDA (Yorkshire
Water) 3. Capital expenditure
Capital efficiency
£627.8m £602.5m £332.8m £42.1m
£626.2m £598.5m £344.0m £42.1m
30% (40%)
*RIDDOR is a reportable incident under the Reporting of Injuries, Diseases and Dangerous Occurrences Regulations 2013. Considering the actual company performance as detailed above (which makes up 50% of the total annual incentive), and following a review of the delivery of individual objectives and contribution, the following total awards for 2013/14 were determined by the committee.
Max. Bonus
%
Bonus for 2013/14
%
Bonus for 2013/14
£
Liz Barber 100 80 216,486
Richard Flint 100 80 304,000
These payments were approved by the committee on 27 March 2014 and were paid in June 2014. The annual incentive scheme policy is unchanged for 2014/15. A range of performance measures and targets have been agreed at the start of the year across all strategic business objectives. The measures and targets for the company element of the annual incentive scheme are detailed in the table below.
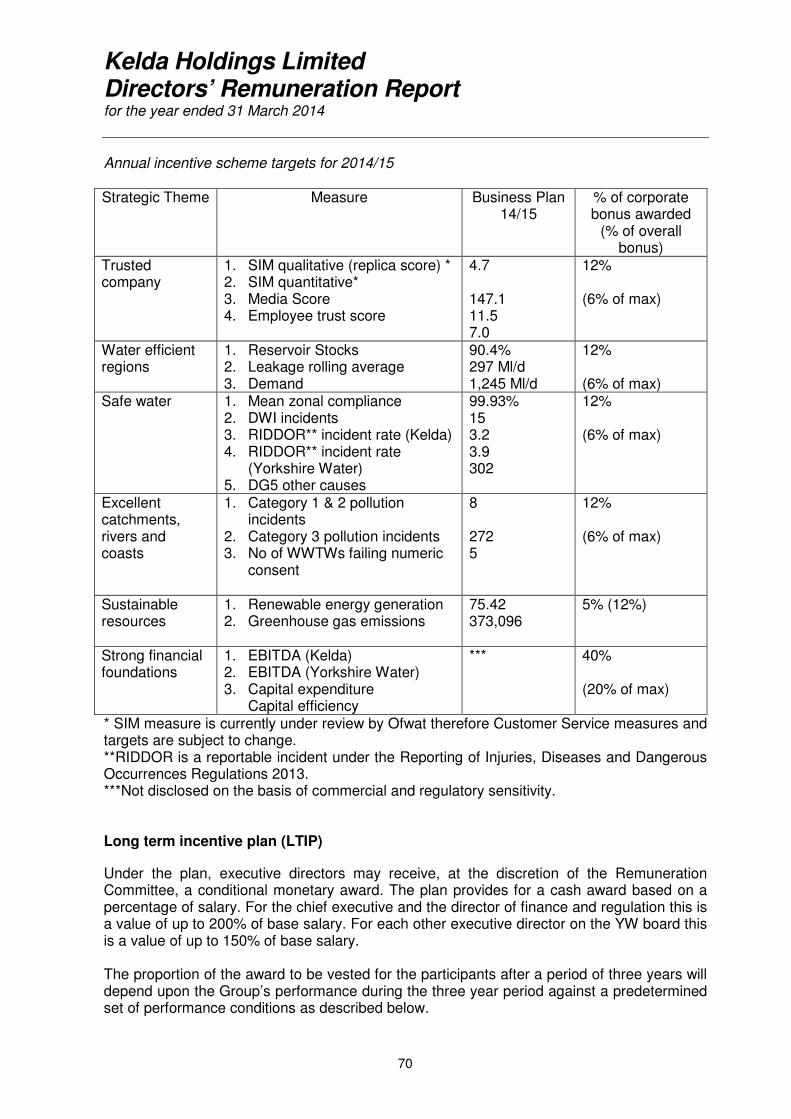
Kelda Holdings Limited Directors’ Remuneration Report for the year ended 31 March 2014
70
Annual incentive scheme targets for 2014/15 Strategic Theme Measure Business Plan
14/15 % of corporate bonus awarded
(% of overall bonus)
Trusted company
1. SIM qualitative (replica score) * 2. SIM quantitative* 3. Media Score 4. Employee trust score
4.7 147.1 11.5 7.0
12% (6% of max)
Water efficient regions
1. Reservoir Stocks 2. Leakage rolling average 3. Demand
90.4% 297 Ml/d 1,245 Ml/d
12% (6% of max)
Safe water 1. Mean zonal compliance 2. DWI incidents 3. RIDDOR** incident rate (Kelda) 4. RIDDOR** incident rate
(Yorkshire Water) 5. DG5 other causes
99.93% 15 3.2 3.9 302
12% (6% of max)
Excellent catchments, rivers and coasts
1. Category 1 & 2 pollution incidents
2. Category 3 pollution incidents 3. No of WWTWs failing numeric
consent
8 272 5
12% (6% of max)
Sustainable resources
1. Renewable energy generation 2. Greenhouse gas emissions
75.42 373,096
5% (12%)
Strong financial foundations
1. EBITDA (Kelda) 2. EBITDA (Yorkshire Water) 3. Capital expenditure
Capital efficiency
*** 40% (20% of max)
* SIM measure is currently under review by Ofwat therefore Customer Service measures and targets are subject to change. **RIDDOR is a reportable incident under the Reporting of Injuries, Diseases and Dangerous Occurrences Regulations 2013. ***Not disclosed on the basis of commercial and regulatory sensitivity. Long term incentive plan (LTIP)
Under the plan, executive directors may receive, at the discretion of the Remuneration Committee, a conditional monetary award. The plan provides for a cash award based on a percentage of salary. For the chief executive and the director of finance and regulation this is a value of up to 200% of base salary. For each other executive director on the YW board this is a value of up to 150% of base salary. The proportion of the award to be vested for the participants after a period of three years will depend upon the Group’s performance during the three year period against a predetermined set of performance conditions as described below.
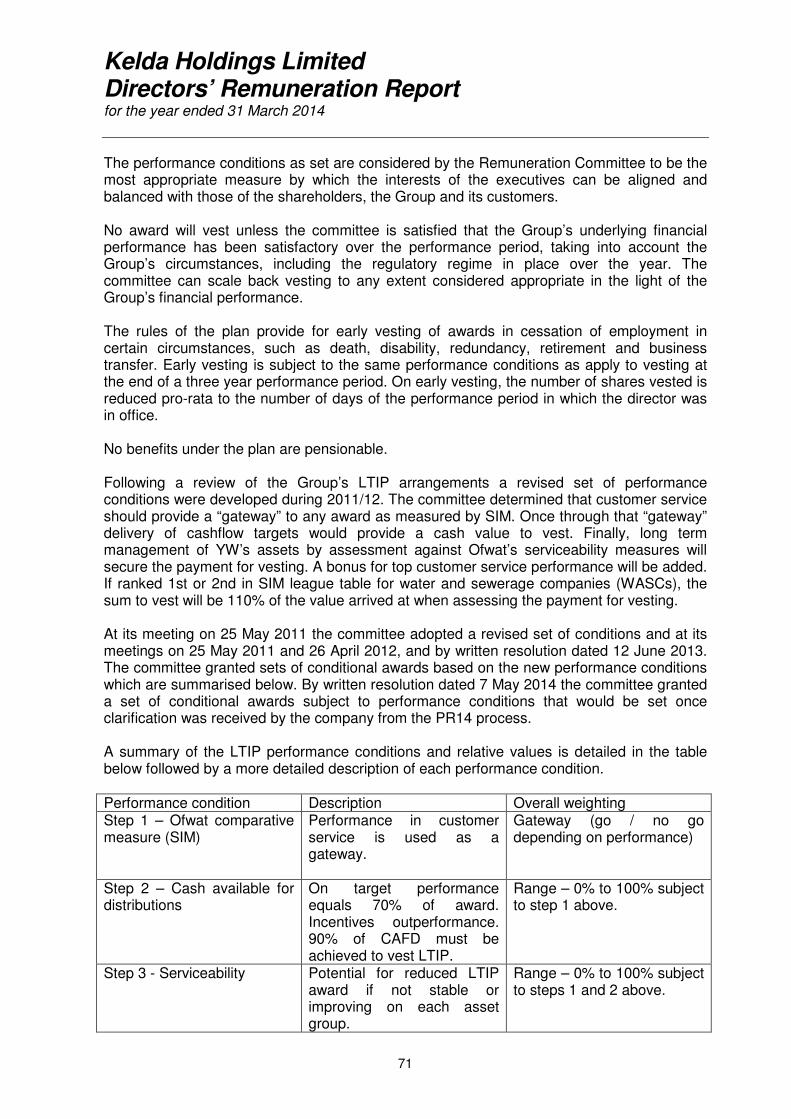
Kelda Holdings Limited Directors’ Remuneration Report for the year ended 31 March 2014
71
The performance conditions as set are considered by the Remuneration Committee to be the most appropriate measure by which the interests of the executives can be aligned and balanced with those of the shareholders, the Group and its customers. No award will vest unless the committee is satisfied that the Group’s underlying financial performance has been satisfactory over the performance period, taking into account the Group’s circumstances, including the regulatory regime in place over the year. The committee can scale back vesting to any extent considered appropriate in the light of the Group’s financial performance. The rules of the plan provide for early vesting of awards in cessation of employment in certain circumstances, such as death, disability, redundancy, retirement and business transfer. Early vesting is subject to the same performance conditions as apply to vesting at the end of a three year performance period. On early vesting, the number of shares vested is reduced pro-rata to the number of days of the performance period in which the director was in office. No benefits under the plan are pensionable. Following a review of the Group’s LTIP arrangements a revised set of performance conditions were developed during 2011/12. The committee determined that customer service should provide a “gateway” to any award as measured by SIM. Once through that “gateway” delivery of cashflow targets would provide a cash value to vest. Finally, long term management of YW’s assets by assessment against Ofwat’s serviceability measures will secure the payment for vesting. A bonus for top customer service performance will be added. If ranked 1st or 2nd in SIM league table for water and sewerage companies (WASCs), the sum to vest will be 110% of the value arrived at when assessing the payment for vesting. At its meeting on 25 May 2011 the committee adopted a revised set of conditions and at its meetings on 25 May 2011 and 26 April 2012, and by written resolution dated 12 June 2013. The committee granted sets of conditional awards based on the new performance conditions which are summarised below. By written resolution dated 7 May 2014 the committee granted a set of conditional awards subject to performance conditions that would be set once clarification was received by the company from the PR14 process. A summary of the LTIP performance conditions and relative values is detailed in the table below followed by a more detailed description of each performance condition. Performance condition Description Overall weighting Step 1 – Ofwat comparative measure (SIM)
Performance in customer service is used as a gateway.
Gateway (go / no go depending on performance)
Step 2 – Cash available for distributions
On target performance equals 70% of award. Incentives outperformance. 90% of CAFD must be achieved to vest LTIP.
Range – 0% to 100% subject to step 1 above.
Step 3 - Serviceability Potential for reduced LTIP award if not stable or improving on each asset group.
Range – 0% to 100% subject to steps 1 and 2 above.
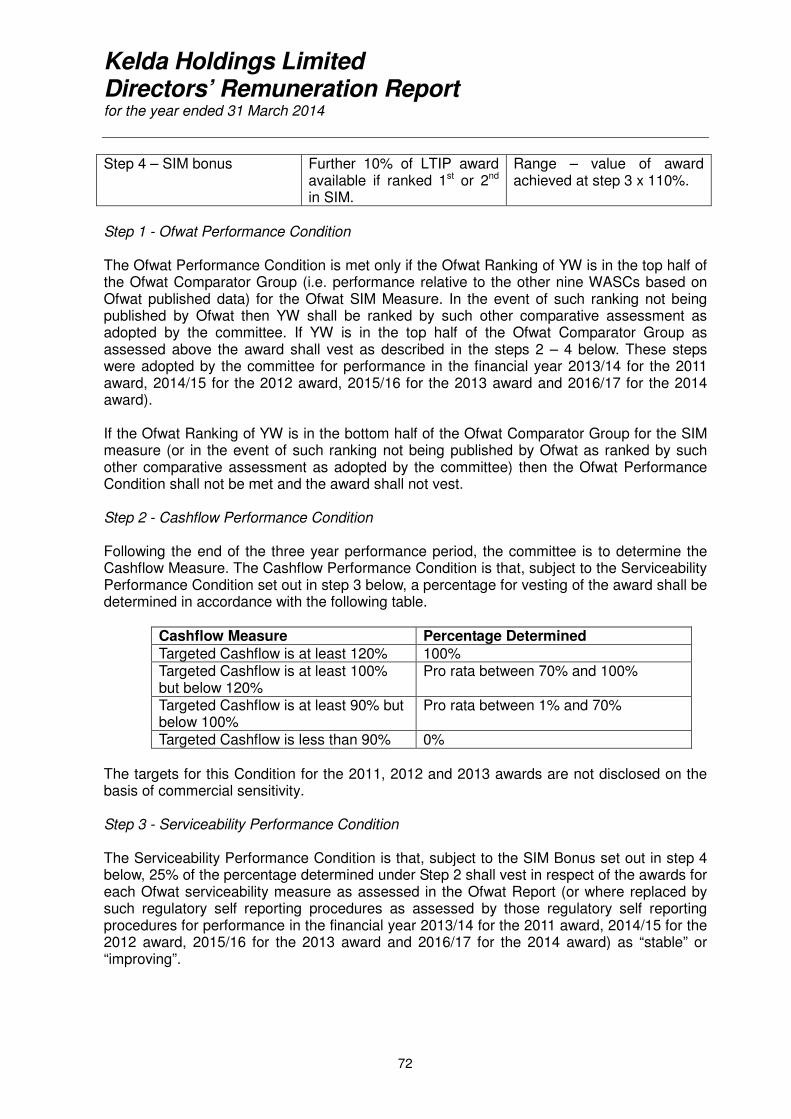
Kelda Holdings Limited Directors’ Remuneration Report for the year ended 31 March 2014
72
Step 4 – SIM bonus Further 10% of LTIP award available if ranked 1st or 2nd in SIM.
Range – value of award achieved at step 3 x 110%.
Step 1 - Ofwat Performance Condition The Ofwat Performance Condition is met only if the Ofwat Ranking of YW is in the top half of the Ofwat Comparator Group (i.e. performance relative to the other nine WASCs based on Ofwat published data) for the Ofwat SIM Measure. In the event of such ranking not being published by Ofwat then YW shall be ranked by such other comparative assessment as adopted by the committee. If YW is in the top half of the Ofwat Comparator Group as assessed above the award shall vest as described in the steps 2 – 4 below. These steps were adopted by the committee for performance in the financial year 2013/14 for the 2011 award, 2014/15 for the 2012 award, 2015/16 for the 2013 award and 2016/17 for the 2014 award). If the Ofwat Ranking of YW is in the bottom half of the Ofwat Comparator Group for the SIM measure (or in the event of such ranking not being published by Ofwat as ranked by such other comparative assessment as adopted by the committee) then the Ofwat Performance Condition shall not be met and the award shall not vest. Step 2 - Cashflow Performance Condition Following the end of the three year performance period, the committee is to determine the Cashflow Measure. The Cashflow Performance Condition is that, subject to the Serviceability Performance Condition set out in step 3 below, a percentage for vesting of the award shall be determined in accordance with the following table.
Cashflow Measure Percentage Determined
Targeted Cashflow is at least 120% 100% Targeted Cashflow is at least 100% but below 120%
Pro rata between 70% and 100%
Targeted Cashflow is at least 90% but below 100%
Pro rata between 1% and 70%
Targeted Cashflow is less than 90% 0% The targets for this Condition for the 2011, 2012 and 2013 awards are not disclosed on the basis of commercial sensitivity. Step 3 - Serviceability Performance Condition The Serviceability Performance Condition is that, subject to the SIM Bonus set out in step 4 below, 25% of the percentage determined under Step 2 shall vest in respect of the awards for each Ofwat serviceability measure as assessed in the Ofwat Report (or where replaced by such regulatory self reporting procedures as assessed by those regulatory self reporting procedures for performance in the financial year 2013/14 for the 2011 award, 2014/15 for the 2012 award, 2015/16 for the 2013 award and 2016/17 for the 2014 award) as “stable” or “improving”.
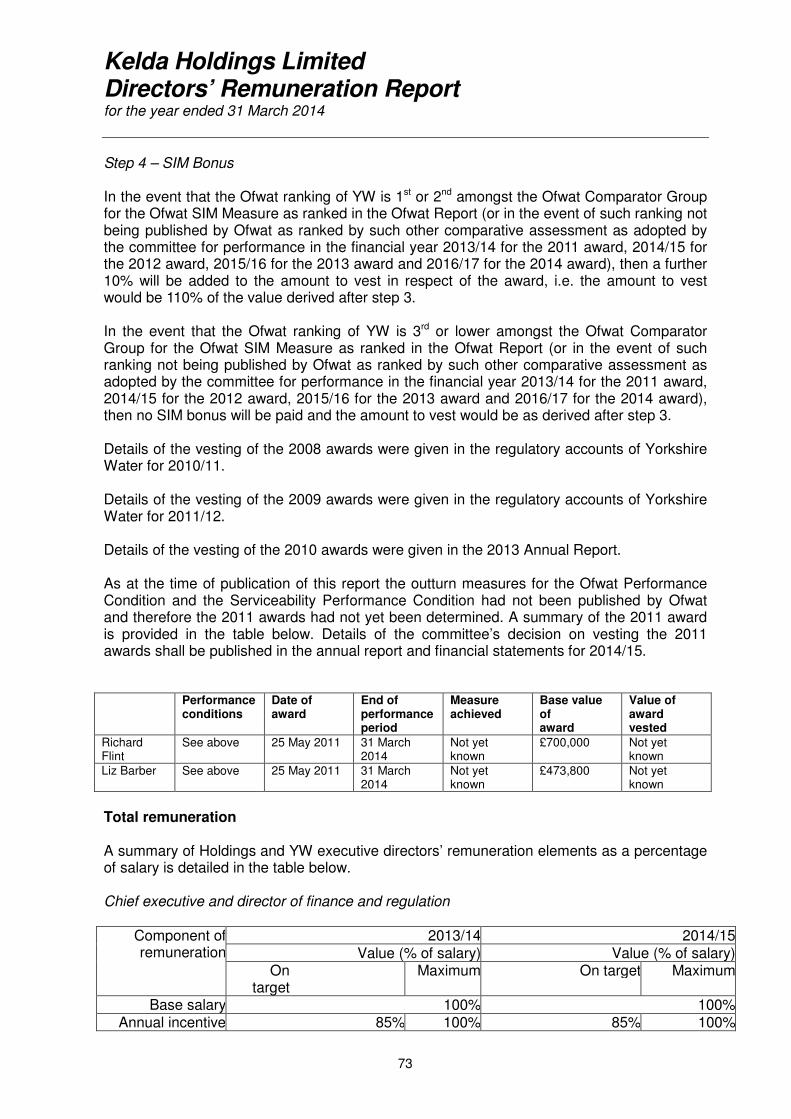
Kelda Holdings Limited Directors’ Remuneration Report for the year ended 31 March 2014
73
Step 4 – SIM Bonus In the event that the Ofwat ranking of YW is 1st or 2nd amongst the Ofwat Comparator Group for the Ofwat SIM Measure as ranked in the Ofwat Report (or in the event of such ranking not being published by Ofwat as ranked by such other comparative assessment as adopted by the committee for performance in the financial year 2013/14 for the 2011 award, 2014/15 for the 2012 award, 2015/16 for the 2013 award and 2016/17 for the 2014 award), then a further 10% will be added to the amount to vest in respect of the award, i.e. the amount to vest would be 110% of the value derived after step 3. In the event that the Ofwat ranking of YW is 3rd or lower amongst the Ofwat Comparator Group for the Ofwat SIM Measure as ranked in the Ofwat Report (or in the event of such ranking not being published by Ofwat as ranked by such other comparative assessment as adopted by the committee for performance in the financial year 2013/14 for the 2011 award, 2014/15 for the 2012 award, 2015/16 for the 2013 award and 2016/17 for the 2014 award), then no SIM bonus will be paid and the amount to vest would be as derived after step 3. Details of the vesting of the 2008 awards were given in the regulatory accounts of Yorkshire Water for 2010/11. Details of the vesting of the 2009 awards were given in the regulatory accounts of Yorkshire Water for 2011/12. Details of the vesting of the 2010 awards were given in the 2013 Annual Report. As at the time of publication of this report the outturn measures for the Ofwat Performance Condition and the Serviceability Performance Condition had not been published by Ofwat and therefore the 2011 awards had not yet been determined. A summary of the 2011 award is provided in the table below. Details of the committee’s decision on vesting the 2011 awards shall be published in the annual report and financial statements for 2014/15. Performance
conditions Date of award
End of performance period
Measure achieved
Base value of award
Value of award vested
Richard Flint
See above 25 May 2011 31 March 2014
Not yet known
£700,000 Not yet known
Liz Barber See above 25 May 2011 31 March 2014
Not yet known
£473,800 Not yet known
Total remuneration A summary of Holdings and YW executive directors’ remuneration elements as a percentage of salary is detailed in the table below. Chief executive and director of finance and regulation
Component of remuneration
2013/14 2014/15Value (% of salary) Value (% of salary)
On target
Maximum On target Maximum
Base salary 100% 100%Annual incentive 85% 100% 85% 100%
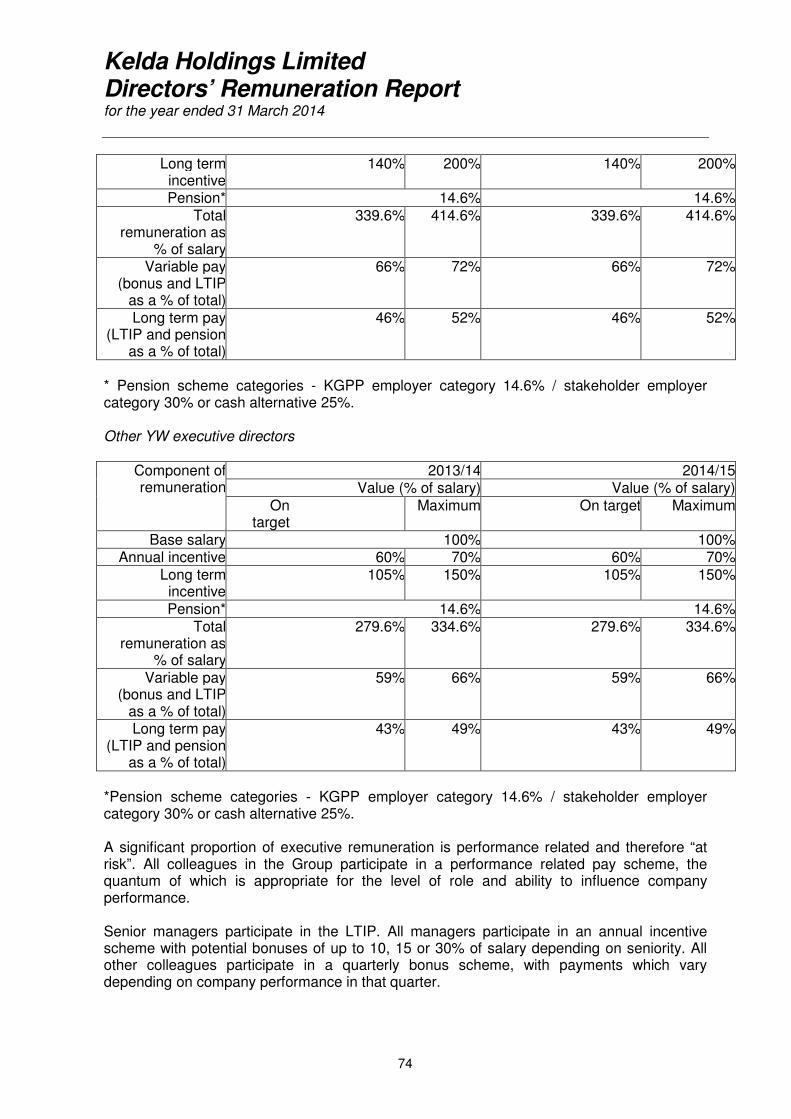
Kelda Holdings Limited Directors’ Remuneration Report for the year ended 31 March 2014
74
Long term incentive
140% 200% 140% 200%
Pension* 14.6% 14.6%Total
remuneration as % of salary
339.6% 414.6% 339.6% 414.6%
Variable pay (bonus and LTIP
as a % of total)
66% 72% 66% 72%
Long term pay (LTIP and pension
as a % of total)
46% 52% 46% 52%
* Pension scheme categories - KGPP employer category 14.6% / stakeholder employer category 30% or cash alternative 25%. Other YW executive directors
Component of remuneration
2013/14 2014/15Value (% of salary) Value (% of salary)
On target
Maximum On target Maximum
Base salary 100% 100%Annual incentive 60% 70% 60% 70%
Long term incentive
105% 150% 105% 150%
Pension* 14.6% 14.6%Total
remuneration as % of salary
279.6% 334.6% 279.6% 334.6%
Variable pay (bonus and LTIP
as a % of total)
59% 66% 59% 66%
Long term pay (LTIP and pension
as a % of total)
43% 49% 43% 49%
*Pension scheme categories - KGPP employer category 14.6% / stakeholder employer category 30% or cash alternative 25%. A significant proportion of executive remuneration is performance related and therefore “at risk”. All colleagues in the Group participate in a performance related pay scheme, the quantum of which is appropriate for the level of role and ability to influence company performance. Senior managers participate in the LTIP. All managers participate in an annual incentive scheme with potential bonuses of up to 10, 15 or 30% of salary depending on seniority. All other colleagues participate in a quarterly bonus scheme, with payments which vary depending on company performance in that quarter.
Kelda Holdings Limited Directors’ Remuneration Report for the year ended 31 March 2014
75
Pension Scheme eligibility is consistent for all colleagues. The defined benefit scheme (KGPP) is now closed to new members. All new colleagues have the option (subject to auto-enrolment provisions) to join the Group’s stakeholder scheme which is a defined contribution scheme.
Kelda Holdings Limited Directors’ Remuneration Report (continued) for the year ended 31 March 2014
76
Non-executive directors The chairman of the Board is paid an annual fee of £400,000 in respect of his role as chairman of the Company and other Group responsibilities. Robert Davies and Anthony Rabin as independent non-executive directors of the Company are paid a fee of £45,000 per annum. Anthony Rabin receives an additional fee of £6,000 per annum as chairman of the Audit Committee. The other non-executive directors of the Company as shareholder representatives are not paid a fee, however, the employing shareholders are entitled to raise a fee of £20,000 per annum for each director so acting. The non-executive directors do not participate in the annual incentive scheme, the LTIP or Group pension plan. Service contracts The Group’s policy on the duration of contracts with executive directors is that they should not normally be of fixed duration, should be subject to twelve months’ notice by the Company and six months’ notice by the director. The notice periods have been selected to be consistent with current corporate governance best practice. Termination payments are made in accordance with the terms of the contract. Service contracts do not generally contain payment in lieu of notice clauses, and terminate automatically on retirement. The Group’s policy in respect of non-executive directors is to make appointments generally of two years’ duration, the terms of which do not contain any express provision for notice periods or termination payments in the event of early termination of their appointment. Appointments may be renewed by mutual agreement for up to further two year periods subject to a total period of nine years’ service with the Group. The executive directors entered into service agreements with the Group on the dates set out in the table below. The contracts are not of fixed duration and each provide for notice periods of twelve months by the Company and six months by the director. The agreements do not contain any specific provision for compensation payable on early termination, and any termination payment would be calculated to take account of the contractual notice period and any annual incentive payment which would have been paid, subject to the achievement of performance objectives, and taking into account the period actually worked. Richard Flint 11 November 2009 Liz Barber 30 April 2010 Kevin Whiteman’s current appointment as chairman of the board took effect on 1 July 2013 and is for term of two years subject to extension. He has however announced that he intends to stand down as chairman on or before 1 April 2015. The terms of appointment do not contain any provisions for notice periods or for compensation in the event of early termination. The appointments of the independent non-executive directors took effect from the dates set out in the table below for a period of two years in each case.
Kelda Holdings Limited Directors’ Remuneration Report (continued) for the year ended 31 March 2014
77
Robert Davies 1 October 2012 Anthony Rabin 1 September 2012 The terms of appointment do not contain any provisions for notice periods or for compensation in the event of early termination. Table of Directors’ emoluments Set out below is the amount earned by the directors in the year ended 31 March 2014.
Salary/ fees for the year
ended 31 March 2014 £000
Taxable benefits
for the year
ended 31 March 2014 £000
(see Note 1)
Annual bonus for
the year ended 31
March 2014 £000
Total emoluments for the year
ended 31 March 2014
Total emoluments for the year
ended 31 March 2013 (see Note 2)
Pension Related
benefits for the year
ended 31 March 2014 (See Note 2
and separate
table below)
Total emoluments and pension
related benefits for
the year ended 31
March 2014 £000
(See Note 3)
Executive directors
Richard Flint
380
11
304
695
695
166
861
Liz Barber
271
10
216
497
476
81
578
Non-executive directors (Note 4) Kevin Whiteman
362
1
-
363
267
-
363
Robert Davies
45
-
-
45
26
-
45 Anthony Rabin
71
-
-
71
26
-
51
Total
1,129
22
520
1,671
1,490
247
1,918
Note 1 The benefits included in this column relate to the provision of a car or cash equivalent, car fuel or cash equivalent, and healthcare. Note 2 The pensions figure for Richard Flint as a KGPP member for 2013/14 is calculated as the change in value of the pension, net of inflation, over the year less his contributions. The pensions figure for Liz Barber as a Kelda Stakeholder+ member for 2013/14 is calculated as the contributions made on her behalf by the Group. Note 3 The table does not include a column for total remuneration for the year ended 31 March 2013 as (a) the emoluments in respect of pensions were reported in the 2013 Annual Report on a fuller basis which included increase in accrued pension and transfer values, and (b) the payments in respect of the LTIP which vested and were paid in the year ended 31 March 2014 were reported in the 2013 Annual Report. As reported above the outturn measures for the Ofwat Performance Condition and the Serviceability Performance Condition had not been published by Ofwat and therefore the 2011 awards had not yet been determined. Accordingly any comparison of total remuneration for the year ended 31 March
Kelda Holdings Limited Directors’ Remuneration Report (continued) for the year ended 31 March 2014
78
2013 with total remuneration for the year ended 31 March 2014 would not be a valid comparison. The like for like data for the years ended 31 March 2014 and 31 March 2015 shall be published in the annual report and financial statements for the year ended 31 March 2015 on a like for like basis. Note 4 The fees for Kevin Whiteman were varied during the year therefore the sums in the table reflect a part year effect of the current fee levels referred to above. Anthony Rabin was also an independent non-executive director of Yorkshire Water Services Limited during 2013/14 and his emoluments shown here are in respect of his fees paid as an independent non-executive on the boards of both Kelda Holdings Limited and Yorkshire Water Services Limited and also as chair of the Audit Committees for both companies.
Pensions information in respect of the Kelda Group Pension Plan
Richard Flint Membership of the Kelda Group Pension Plan and unregistered arrangement, giving (from April 2013) pension of 1/40
th of
pensionable pay for each year plus additional lump sum based on 3/40
th of Pensionable Pay for each year. Normal retirement age is
65 but may take benefits built up for service prior to 1 April 2013 unreduced from age 60 and benefits accrued from 1 April 2013 unreduced from age 63.
Currently total pension is £98,716 p.a. plus additional lump sum of £28,500.
Value of all pension related benefits accrued in year to
31 March 2014
31 March 2013
31 March 2012
31 March 2011
31 March 2010
Director undertaking role of chief executive*
£165,700 £197,909 £186,253 £322,837 £112,818
*The value of all pension-related benefits for Richard Flint for the later four years, and the value of all pension related benefits for Kevin Whiteman for the year ending 31 March 2010, are shown above. The figures shown are net of contributions paid by the chief executive, which were 6% p.a. of pensionable pay before the benefit changes which came into effect 1 April 2013 and 8.5% p.a. thereafter. These contributions were made by salary sacrifice. Liz Barber was a member of the Kelda Stakeholder+ arrangement (Defined Contribution)
scheme.
Independent auditors’ report to the members of Kelda Holdings Limited (continued)
79
Report on the Group financial statements
We have audited the group and parent company financial statements of Kelda Holdings Limited for the year ended 31 March 2014 which comprise the group income statement, the group statement of comprehensive income, the group and company balance sheets, the group statement of changes in equity, the group cash flow statement and the related notes. The financial reporting framework that has been applied in their preparation is applicable law and International Financial Reporting Standards as adopted by the European Union (group financial statements) and United Kingdom Accounting Standards (parent company financial statements). Respective responsibilities of directors and auditors As explained more fully in the Directors’ Responsibilities Statement set out on page 60 the directors are responsible for the preparation of the financial statements and for being satisfied that they give a true and fair view. Our responsibility is to audit and express an opinion on the financial statements in accordance with applicable law and International Standards on Auditing (UK and Ireland). Those standards require us to comply with the Auditing Practices Board’s Ethical Standards for Auditors. This report, including the opinion, has been prepared for and only for the Company’s members as a body in accordance with Article 113A of the Companies (Jersey) Law 1991 and for no other purpose. We do not, in giving this opinion, accept or assume responsibility for any other purpose or to any other person to whom this report is shown or into whose hands it may come save where expressly agreed by our prior consent in writing. Scope of the audit of the financial statements An audit involves obtaining evidence about the amounts and disclosures in the financial statements sufficient to give reasonable assurance that the financial statements are free from material misstatement, whether caused by fraud or error. This includes an assessment of: whether the accounting policies are appropriate to the group’s and parent company’s circumstances and have been consistently applied and adequately disclosed; the reasonableness of significant accounting estimates made by the directors; and the overall presentation of the financial statements. In addition, we read all the financial and non-financial information in the annual report and financial statements to identify material inconsistencies with the audited financial statements and to identify any information that is apparently materially incorrect based on, or materially inconsistent with, the knowledge acquired by us in the course of performing the audit. If we become aware of any apparent material misstatements or inconsistencies we consider the implications for our report. Opinion on financial statements In our opinion the financial statements:
• give a true and fair view of the state of the group’s and parent company’s affairs as at 31 March 2014 and of the group’s profit and cash flows and of the parent company’s profit for the year then ended;
• have been properly prepared in accordance with International Financial Reporting Standards as adopted by the European Union (group financial statements) and United Kingdom Accounting Standards (parent company financial statements);
• have been properly prepared in accordance with the requirements of the Companies (Jersey) Law 1991.
Independent auditors’ report to the members of Kelda Holdings Limited (continued)
80
Opinion on other matters In our opinion the information given in the Directors’ Report for the financial year for which financial statements are prepared is consistent with the financial statements. Matters on which we are required to report by exception We have nothing to report in respect of the following matters where the Companies (Jersey) Law 1991 requires us to report to you if, in our opinion:
• proper accounting records have not been kept; or
• the financial statements are not in agreement with the accounting records; or
• we have not received all the information and explanations we require for our audit.
Richard Bunter For and on behalf of PricewaterhouseCoopers LLP Chartered Accountants Leeds 18 November 2014
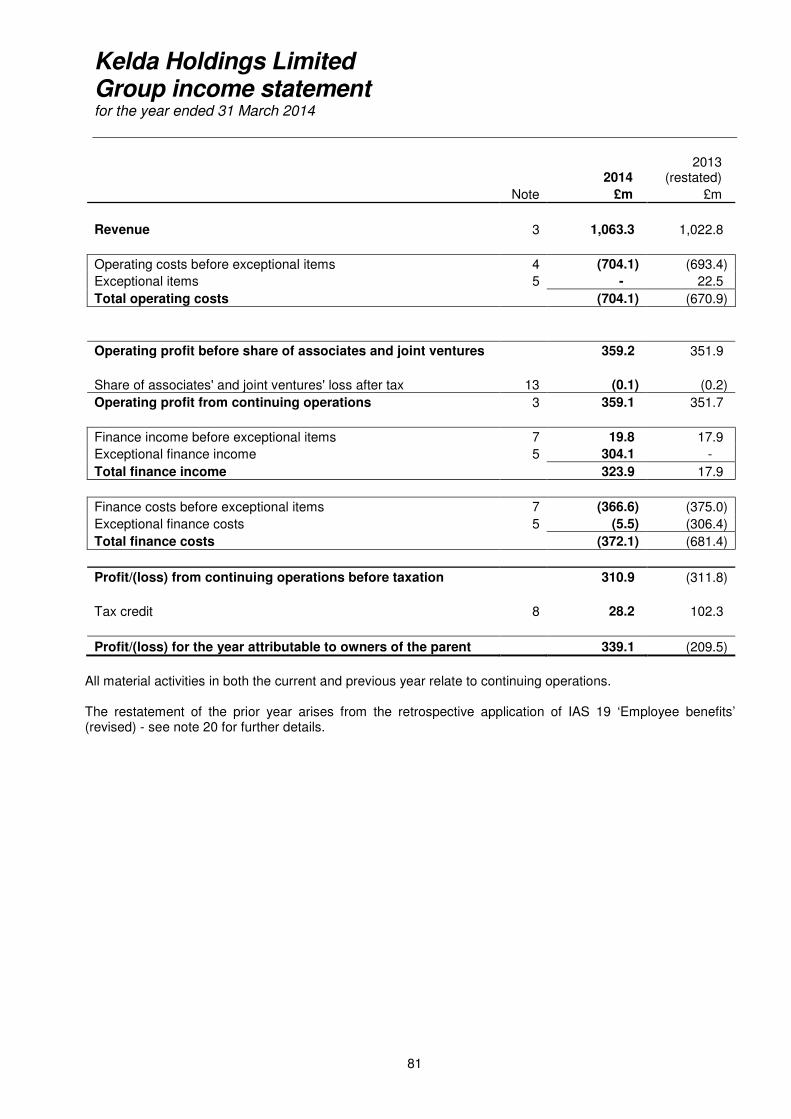
Kelda Holdings Limited Group income statement for the year ended 31 March 2014
81
2014 2013
(restated)
Note £m £m
Revenue 3 1,063.3 1,022.8
Operating costs before exceptional items 4 (704.1) (693.4)
Exceptional items 5 - 22.5
Total operating costs (704.1) (670.9)
Operating profit before share of associates and joint ventures 359.2 351.9
Share of associates' and joint ventures' loss after tax 13 (0.1) (0.2)
Operating profit from continuing operations 3 359.1 351.7
Finance income before exceptional items 7 19.8 17.9
Exceptional finance income 5 304.1 -
Total finance income 323.9 17.9
Finance costs before exceptional items 7 (366.6) (375.0)
Exceptional finance costs 5 (5.5) (306.4)
Total finance costs (372.1) (681.4)
Profit/(loss) from continuing operations before taxation 310.9 (311.8)
Tax credit 8 28.2 102.3
Profit/(loss) for the year attributable to owners of the parent 339.1 (209.5)
All material activities in both the current and previous year relate to continuing operations.
The restatement of the prior year arises from the retrospective application of IAS 19 ‘Employee benefits’ (revised) - see note 20 for further details.
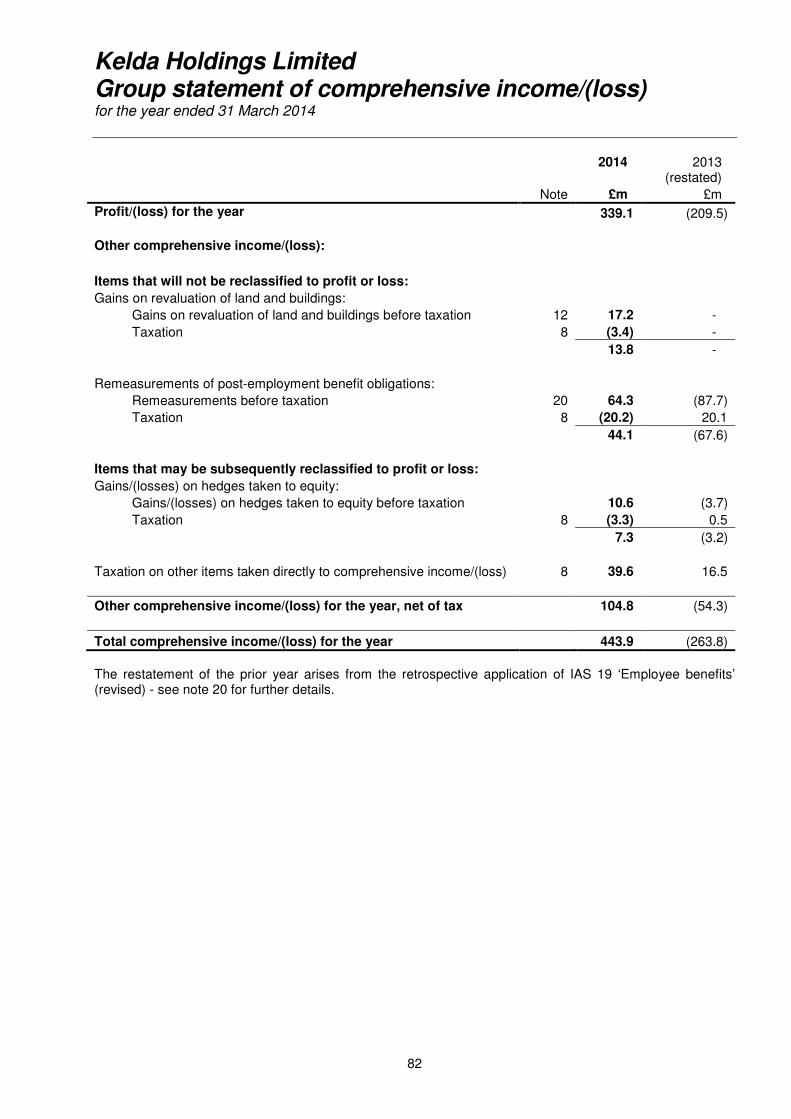
Kelda Holdings Limited Group statement of comprehensive income/(loss) for the year ended 31 March 2014
82
2014
2013
(restated)
Note £m £m
Profit/(loss) for the year 339.1 (209.5) Other comprehensive income/(loss):
Items that will not be reclassified to profit or loss:
Gains on revaluation of land and buildings:
Gains on revaluation of land and buildings before taxation 12 17.2 -
Taxation 8 (3.4) -
13.8 -
Remeasurements of post-employment benefit obligations:
Remeasurements before taxation 20 64.3 (87.7)
Taxation 8 (20.2) 20.1
44.1 (67.6)
Items that may be subsequently reclassified to profit or loss:
Gains/(losses) on hedges taken to equity:
Gains/(losses) on hedges taken to equity before taxation 10.6 (3.7)
Taxation 8 (3.3) 0.5
7.3 (3.2)
Taxation on other items taken directly to comprehensive income/(loss) 8 39.6 16.5
Other comprehensive income/(loss) for the year, net of tax 104.8 (54.3)
Total comprehensive income/(loss) for the year 443.9 (263.8)
The restatement of the prior year arises from the retrospective application of IAS 19 ‘Employee benefits’ (revised) - see note 20 for further details.
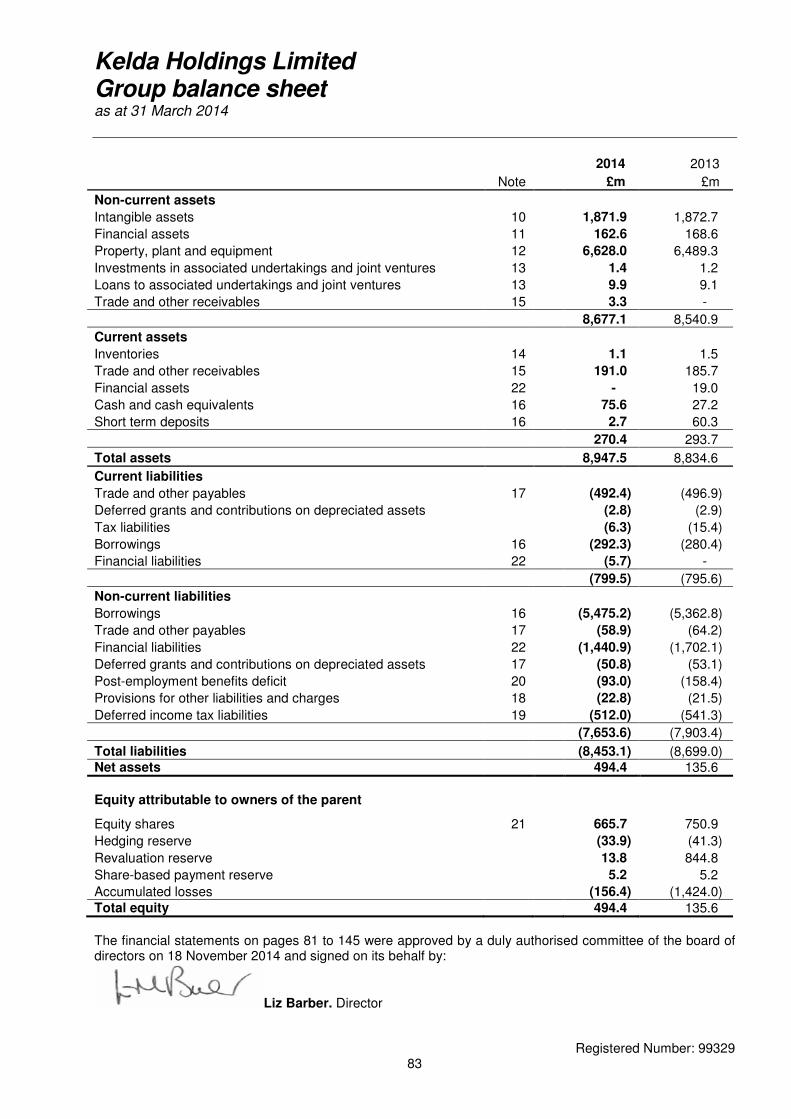
Kelda Holdings Limited Group balance sheet as at 31 March 2014
Registered Number: 99329
83
2014 2013
Note £m £m
Non-current assets
Intangible assets 10 1,871.9 1,872.7
Financial assets 11 162.6 168.6
Property, plant and equipment 12 6,628.0 6,489.3
Investments in associated undertakings and joint ventures 13 1.4 1.2
Loans to associated undertakings and joint ventures 13 9.9 9.1
Trade and other receivables 15 3.3 -
8,677.1 8,540.9
Current assets
Inventories 14 1.1 1.5
Trade and other receivables 15 191.0 185.7
Financial assets 22 - 19.0
Cash and cash equivalents 16 75.6 27.2
Short term deposits 16 2.7 60.3
270.4 293.7
Total assets 8,947.5 8,834.6
Current liabilities
Trade and other payables 17 (492.4) (496.9)
Deferred grants and contributions on depreciated assets (2.8) (2.9)
Tax liabilities (6.3) (15.4)
Borrowings 16 (292.3) (280.4)
Financial liabilities 22 (5.7) -
(799.5) (795.6)
Non-current liabilities
Borrowings 16 (5,475.2) (5,362.8)
Trade and other payables 17 (58.9) (64.2)
Financial liabilities 22 (1,440.9) (1,702.1)
Deferred grants and contributions on depreciated assets 17 (50.8) (53.1)
Post-employment benefits deficit 20 (93.0) (158.4)
Provisions for other liabilities and charges 18 (22.8) (21.5)
Deferred income tax liabilities 19 (512.0) (541.3)
(7,653.6) (7,903.4)
Total liabilities (8,453.1) (8,699.0) Net assets 494.4 135.6
Equity attributable to owners of the parent
Equity shares 21 665.7 750.9
Hedging reserve (33.9) (41.3)
Revaluation reserve 13.8 844.8
Share-based payment reserve 5.2 5.2
Accumulated losses (156.4) (1,424.0) Total equity 494.4 135.6
The financial statements on pages 81 to 145 were approved by a duly authorised committee of the board of directors on 18 November 2014 and signed on its behalf by:
Liz Barber. Director
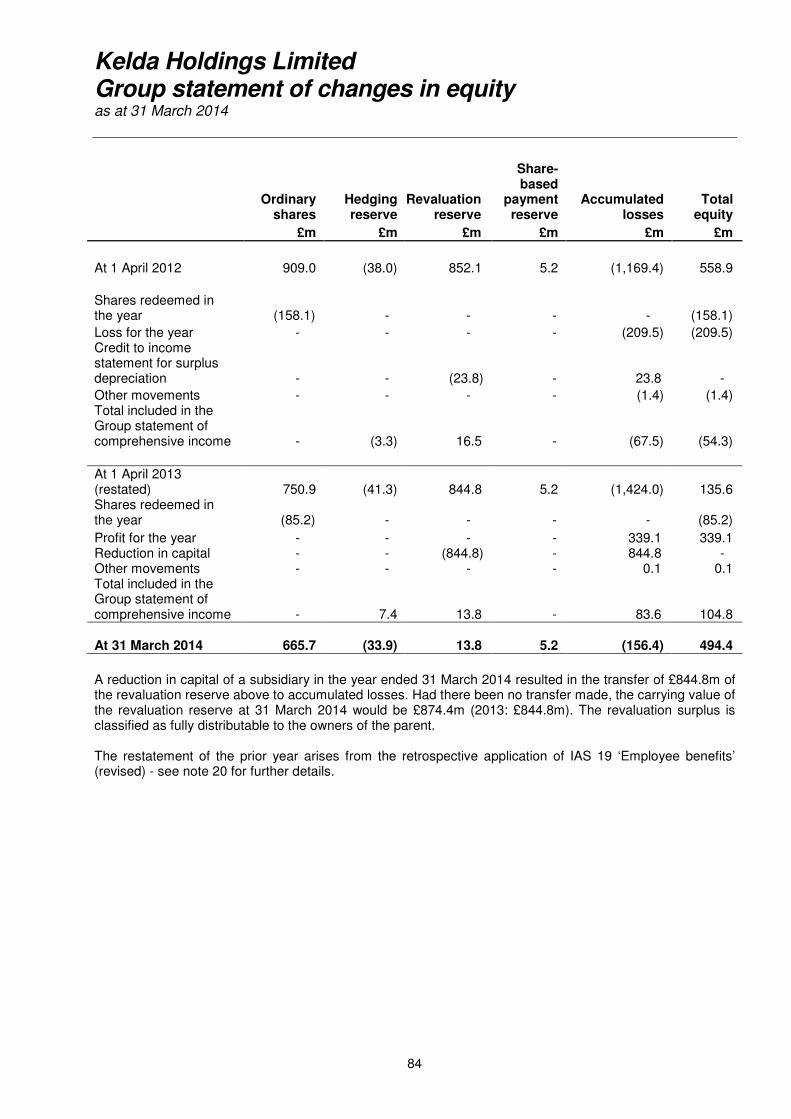
Kelda Holdings Limited Group statement of changes in equity as at 31 March 2014
84
Ordinary
shares Hedging reserve
Revaluation reserve
Share-based
payment reserve
Accumulated losses
Total equity
£m £m £m £m £m £m
At 1 April 2012 909.0 (38.0) 852.1 5.2 (1,169.4) 558.9
Shares redeemed in the year (158.1) - - - - (158.1)
Loss for the year - - - - (209.5) (209.5) Credit to income statement for surplus depreciation - - (23.8) - 23.8 -
Other movements - - - - (1.4) (1.4) Total included in the Group statement of comprehensive income - (3.3) 16.5 - (67.5) (54.3)
At 1 April 2013 (restated) 750.9 (41.3) 844.8 5.2 (1,424.0) 135.6 Shares redeemed in the year (85.2) - - - - (85.2)
Profit for the year - - - - 339.1 339.1 Reduction in capital - - (844.8) - 844.8 - Other movements - - - - 0.1 0.1 Total included in the Group statement of comprehensive income - 7.4 13.8 - 83.6 104.8 At 31 March 2014 665.7 (33.9) 13.8 5.2 (156.4) 494.4
A reduction in capital of a subsidiary in the year ended 31 March 2014 resulted in the transfer of £844.8m of the revaluation reserve above to accumulated losses. Had there been no transfer made, the carrying value of the revaluation reserve at 31 March 2014 would be £874.4m (2013: £844.8m). The revaluation surplus is classified as fully distributable to the owners of the parent. The restatement of the prior year arises from the retrospective application of IAS 19 ‘Employee benefits’ (revised) - see note 20 for further details.
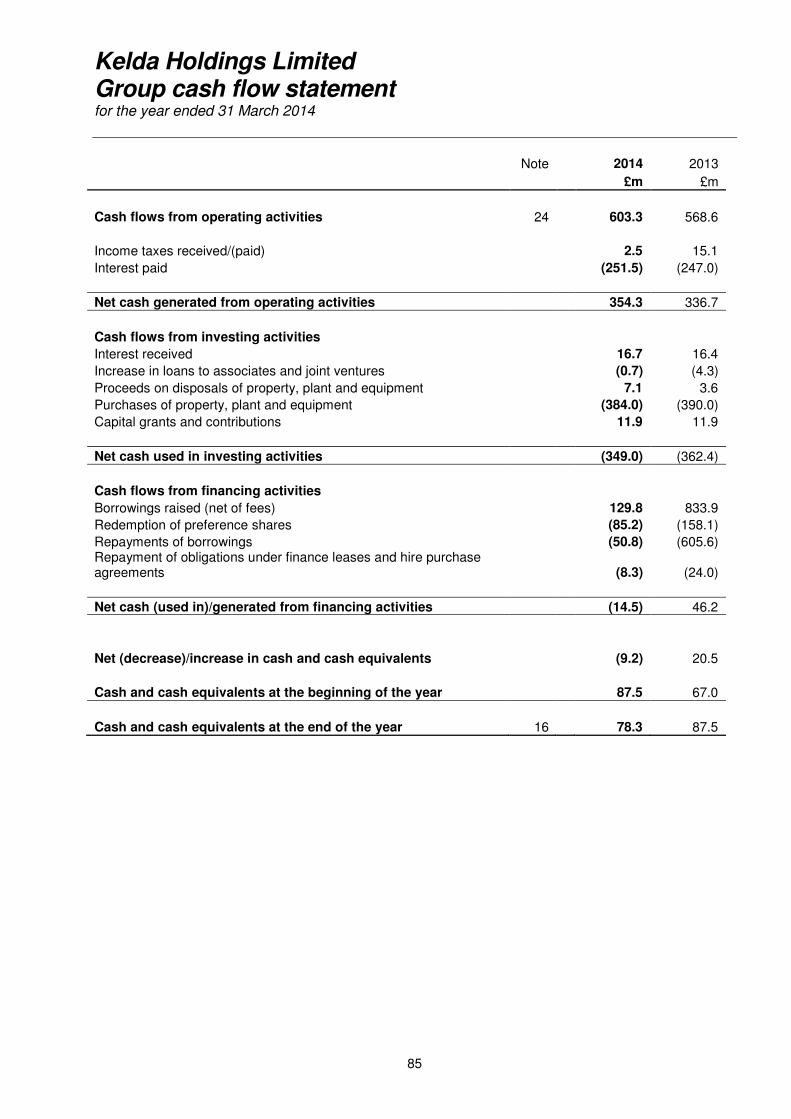
Kelda Holdings Limited Group cash flow statement for the year ended 31 March 2014
85
Note 2014 2013
£m £m
Cash flows from operating activities 24 603.3 568.6
Income taxes received/(paid) 2.5 15.1
Interest paid (251.5) (247.0)
Net cash generated from operating activities 354.3 336.7
Cash flows from investing activities
Interest received 16.7 16.4
Increase in loans to associates and joint ventures (0.7) (4.3)
Proceeds on disposals of property, plant and equipment 7.1 3.6
Purchases of property, plant and equipment (384.0) (390.0)
Capital grants and contributions 11.9 11.9
Net cash used in investing activities (349.0) (362.4)
Cash flows from financing activities
Borrowings raised (net of fees) 129.8 833.9
Redemption of preference shares (85.2) (158.1)
Repayments of borrowings (50.8) (605.6) Repayment of obligations under finance leases and hire purchase agreements
(8.3) (24.0)
Net cash (used in)/generated from financing activities (14.5) 46.2
Net (decrease)/increase in cash and cash equivalents (9.2) 20.5
Cash and cash equivalents at the beginning of the year 87.5 67.0
Cash and cash equivalents at the end of the year 16 78.3 87.5
Kelda Holdings Limited Notes to the Group financial statements for the year ended 31 March 2014
86
1. Authorisation of financial statements The Group's financial statements for the year ended 31 March 2014 were authorised for issue by the Board of directors on 18 November 2014 and the balance sheet was signed on the Board's behalf by Liz Barber, Director of Finance and Regulation. Kelda Holdings Limited is a limited company incorporated and domiciled in Jersey. 2. Accounting policies The principal accounting policies applied in the preparation of these consolidated financial statements is set out below. These policies have been consistently applied to all the years presented, unless otherwise stated. Basis of accounting The consolidated financial statements of Kelda Holdings Limited have been prepared on the going concern basis in accordance with International Financial Reporting Standards (IFRS) as adopted by the European Union, IFRIC interpretations and those parts of the Companies Act 2006 applicable to companies reporting under IFRS as they apply to the financial statements of the Group for the year ended 31 March 2014. The consolidated financial statements have been prepared under the historical cost convention except for certain categories of property, plant and equipment which are held at valuation, all derivative financial instruments and financial assets which have been measured at fair value, disposal groups held for sale which have been measured at the lower of fair value less cost to sell and their carrying amounts prior to the decision to treat them as held for sale and pension scheme liabilities that are measured using actuarial valuations. The preparation of financial statements in conformity with IFRSs requires the use of certain accounting estimates. It also requires management to exercise its judgement in the process of applying the Group’s accounting policies. The areas involving a higher degree of judgment or complexity, or areas where assumptions and estimates are significant to the financial statements, are disclosed on pages 95 to 97. Basis of consolidation The Group financial statements consolidate the financial statements of Kelda Holdings Limited and its subsidiaries (see note 27). The results of undertakings acquired or sold are consolidated for the periods from the date of acquisition or up to the date of disposal. Acquisitions of subsidiaries are accounted for under the purchase method of accounting. Associates and joint ventures are accounted for under the equity method of accounting. Intra-group balances, and any unrealised gains and losses or income and expenses arising from intra-group transactions, are eliminated in preparing the consolidated financial statements.
Foreign currencies On an individual company basis, individual transactions denominated in foreign currencies are translated into functional currency at the actual exchange rates ruling at the dates of the transactions. Monetary assets and liabilities denominated in foreign currencies are translated into functional currency at the rates ruling at the balance sheet date. Profits and losses on both individual foreign currency transactions during the year and monetary assets and liabilities are dealt with in the income statement.
Kelda Holdings Limited Notes to the Group financial statements (continued) for the year ended 31 March 2014
87
2. Accounting policies (continued) On consolidation, the income statements of the overseas subsidiaries are translated at the average exchange rates for the year and the balance sheets at the exchange rates at the balance sheet date. The exchange differences arising as a result of translating income statements at average rates and restating opening net assets at closing rates are taken to the translation reserve. Exchange differences on foreign currency borrowings that provide a hedge against a net investment in a foreign operation are taken directly to equity until the disposal of the net investment, at which time they are recognised in the consolidated income statement. Goodwill arising on the acquisition of an overseas subsidiary, associate or joint venture is calculated using exchange rates applicable at the date of acquisition and is subsequently re-translated at each balance sheet date. Revenue Revenue comprises charges to customers for water, waste water and environmental services, excluding value added tax. Revenue excludes inter-company sales. Revenue is not recognised until the service has been provided to the customer. Revenue relates to charges due in the year, excluding any amounts paid in advance. Revenue for measured water charges includes amounts billed plus an estimation of the amounts unbilled at the year end. The accrual is estimated using a defined methodology based upon daily average water consumption, which is calculated based upon historical billing information. Net operating costs Net operating costs include the following: Dividends receivable Dividends receivable are recognised when the owners’ right to receive the revenue is established. Rental income Rental income arising on investment properties is accounted for on a straight line basis over the lease term on on-going leases. Other operating income Profit relating to the sale of commercial and residential properties to third parties is included within other operating income, which is part of operating costs. Finance income Interest receivable is recognised as the interest accrues using the effective interest method. This is the rate that exactly discounts estimated future cash receipts and payments through the expected life of the financial instrument to the net carrying amount of the financial assets. Dividends payable Interim and final dividends payable are recognised on payment of the dividend.
Kelda Holdings Limited Notes to the Group financial statements (continued) for the year ended 31 March 2014
88
2. Accounting policies (continued) Research and development expenditure Research expenditure is written off in the income statement in the year in which it is incurred. Development expenditure is charged to the income statement, except where the expenditure meets the criteria for recognition as an internally generated intangible asset as outlined in IAS 38 “Intangible assets”. Where the recognition criteria are met, intangible assets are capitalised and amortised over their useful economic lives from the date of commissioning.
Taxation Current tax Current tax for the current and prior years is, to the extent unpaid, recognised as a liability. If the amount already paid in respect of the current and prior years exceeds the amount payable, the excess is recognised as an asset. The benefits relating to a tax loss that can be carried back to recover current tax of a previous year are held as an asset. Deferred tax Deferred income tax is provided, using the liability method, on all temporary differences at the balance sheet date between the tax bases of assets and liabilities and their carrying amounts for financial reporting purposes with the following exceptions: • where the deferred income tax liability arises from the initial recognition of goodwill or the
initial recognition of an asset or liability in a transaction that is not a business combination and, at the time of the transaction, affects neither the accounting profit nor taxable profit or loss; and
• in respect of taxable temporary differences associated with investments in subsidiaries,
associates and interests in joint ventures, where the timing of the reversal of the temporary difference can be controlled and it is probable that the temporary difference will not reverse in the foreseeable future.
Deferred income tax assets are recognised for all deductible temporary differences, carry-forward of unused tax assets and unused tax losses, to the extent that it is probable that taxable profit will be available against which the deductible temporary differences, carry-forward of unused tax assets and unused tax losses can be utilised, except: • where the deferred income tax asset relating to the deductible temporary difference arises
from the initial recognition of an asset or liability in a transaction that is not a business combination and, at the time of the transaction, affects neither the accounting profit nor taxable profit or loss; and
• in respect of deductible temporary differences associated with investments in subsidiaries,
associates and interests in joint ventures, deferred tax assets are only recognised to the extent that it is probable that the temporary differences will reverse in the foreseeable future and taxable profit will be available against which the temporary difference can be utilised.
The carrying amount of deferred income tax assets is reviewed at each balance sheet date, and reduced to the extent that it is no longer probable that sufficient taxable profit will be available to allow all or part of the deferred income tax asset to be utilised.
Kelda Holdings Limited Notes to the Group financial statements (continued) for the year ended 31 March 2014
89
2. Accounting policies (continued) Deferred income tax assets and liabilities are measured at the tax rates that apply to the period when the asset is realised or the liability is settled, based on tax rates (and tax laws) that have been enacted or substantively enacted at the balance sheet date. Current and deferred tax is charged or credited in the income statement, except when it relates to items charged or credited directly in equity in which case the current or deferred tax is reflected in equity. Goodwill and intangible assets Goodwill represents the excess of the fair value of the consideration paid for a business over the fair value of the identifiable assets and liabilities acquired after costs incurred directly in relation to the transaction. Goodwill is capitalised and subject to an impairment review, both annually and when there are indications that the carrying value may not be recoverable. Other intangible assets comprise capitalised bid costs. Capitalised bid costs are recognised in relation to contracts won within the Group. Bid costs are capitalised from the date a Group company is named as preferred bidder, and then amortised over the shorter of the life of the contract or the period to the first renewal date. If preferred bidder status is withdrawn, capitalised costs will be written off immediately. Capitalised bid costs are deemed to have a useful life of between 22 and 25 years. The amortisation expense is included in “Operating expenses before exceptional items” in the income statement (see note 4). The Group recognises an intangible asset in relation to a public to private service concession arrangement to the extent that is has a contractual right to charge users based on usage of the public service. The intangible asset is amortised on a straight line basis over the life of the concession agreement. Property, plant and equipment Residential properties, non-specialised properties and rural estates held within land and buildings are held at valuation. During a prior year the accounting policy of infrastructure assets was changed from a historical cost basis and they are now held at valuation (see note 12). Other property, plant and equipment are included at cost less accumulated depreciation and any provision for impairment. Freehold land is not depreciated. Depreciation is charged on property, plant and equipment on a straight line basis over their estimated useful economic lives, or the estimated useful economic lives of their individual major components, from the date of commissioning. Useful economic lives are principally as follows: Buildings 25 - 60 years Plant and equipment Fixed plant 5 - 40 years Vehicles, mobile plant and computers 3 - 10 years Infrastructure assets Water mains and sewers 40 -125 years Earth banked dams and reservoirs 200 years
Kelda Holdings Limited Notes to the Group financial statements (continued) for the year ended 31 March 2014
90
2. Accounting policies (continued) Assets in the course of construction are not depreciated until commissioned. In the UK regulated water services business, infrastructure assets comprise a network of systems being mains and sewers, impounding and pumped raw water storage, reservoirs, dams and sea outfalls. The opening balance for infrastructure assets on transition to IFRS was calculated with reference to the estimated fair value of the infrastructure network as a whole at 1 April 2004. Subsequent expenditure is classified as operating expenditure or capital and accounted for appropriately. Infrastructure assets, residential properties, non-specialised properties and rural estates are held at valuation with external valuations being undertaken on a periodic basis. An interim valuation is booked in the intervening years if there has been a material change. Residual values and depreciation rates are reviewed on revaluation. On sale of a revalued asset, the revaluation reserve is recycled to the income statement. In respect of borrowing costs relating to qualifying assets for which the capitalisation date is on or after 1 January 2009, the Group capitalises borrowing costs directly attributable to the acquisition, construction or production of a qualifying asset as part of the cost of that asset. Prior to this date the Group recognised all borrowing costs as an expense immediately. This change in accounting policy was due to the adoption of IAS 23 ‘Borrowing costs’. Impairment of property, plant and equipment and goodwill The carrying values of property, plant and equipment are reviewed for impairment if events or changes in circumstances indicate that the carrying value may not be recoverable. Useful lives and residual values are reviewed annually. Where adjustments are required, these are made prospectively. Impairment on goodwill is determined by assessing the recoverable amount of the cash-generating unit to which the goodwill relates. Where the recoverable amount is less than the carrying amount, an impairment loss is recognised. When an entity is disposed of, any goodwill associated with it is included in the carrying amount of the operation when determining the gain or loss on disposal. Accounting for leases Finance leases Assets which are financed by leasing agreements that transfer substantially all the risks and rewards of ownership to the lessee (finance leases) are capitalised, at the lower of the fair value of the leased property and the present value of future lease payments, in property, plant and equipment and the corresponding capital cost is shown as an obligation to the lessor in borrowings. Depreciation is generally charged to the income statement over the shorter of the estimated useful life and the term of the lease. If the operational life of an asset is longer than the lease term, and the agreement allows an extension to that term, the asset may be depreciated over its operational life. The capital element of lease payments reduces the obligation to the lessor and the interest element is charged to the income statement over the term of the lease in proportion to the capital amount outstanding. Any arrangement fees or other direct costs incurred on a finance lease are capitalised and amortised over the length of the lease.
Kelda Holdings Limited Notes to the Group financial statements (continued) for the year ended 31 March 2014
91
2. Accounting policies (continued) Operating leases Leases where the lessor retains substantially all the risks and rewards of ownership are classified as operating leases. Lease payments are charged to the income statement on a straight line basis over the term of the lease. Government grants and contributions Government grants and contributions in respect of property, plant and equipment are deferred and credited to the income statement by instalments over the expected economic lives of the related assets. Government grants are recognised at their fair value where there is reasonable assurance that the grant will be received and all attaching conditions will be complied with. Government grants and contributions received in respect of an item of expense during the year are recognised in the income statement on a systematic basis in line with the cost that it is intended to compensate. Government grants which can be allocated against an individual asset are included as part of the carrying value of the asset. Government grants which cannot be allocated to individual assets are held as deferred income and released to the income statement over the life of the grant. Investments in joint ventures and associates The Group has a number of contractual arrangements with third parties which represent joint ventures, these take the form of agreements to share control over other companies. The Group recognises its interest in the entity’s assets and liabilities using the equity method of accounting. The Group’s interest in its associates, being those entities over which it has significant influence and which are neither subsidiaries nor joint ventures, are accounted for using the equity method of accounting. Under the equity method, the investment in the joint venture or associate is carried in the balance sheet at cost plus post-acquisition changes in the Group’s share of its net assets, less distributions received and less any impairment in value of individual investments. The Group income statement reflects the share of the joint ventures’ and associates’ results after tax. Financial statements of joint ventures and associates are prepared for the same reporting period as the Group. Where necessary, adjustments are made to bring the accounting policies used into line with those of the Group. The Group ceases to use the equity method on the date from which it no longer has shared control over or significant influence in the joint venture or associate. Any unrealised gains or losses between the Group and its joint ventures and associates are eliminated on consolidation. Inventories Inventories are stated at the lower of cost and net realisable value less any provision necessary to recognise damage and obsolescence. Cost includes labour, materials and an appropriate proportion of overheads. Provisions Provision is made for self insured claims incurred but not reported, contracts which are considered onerous, accumulated losses related to associated undertakings and other known liabilities which exist at the year end as a result of a past event.
Kelda Holdings Limited Notes to the Group financial statements (continued) for the year ended 31 March 2014
92
2. Accounting policies (continued) Service concessions IFRIC 12 ‘Service Concession Arrangements’ addresses accounting by private sector operators involved in the provision of public sector infrastructure assets and services. Relevant assets within its scope are classified as financial assets (where the operator has an unconditional right to receive a specified amount of cash or other financial asset over the life of the arrangement); or intangible assets (where the operator’s future cash flows are not specified); or a combination of both (where the operator’s return is provided partially by a financial asset and partially by an intangible asset). The service concession contracts of the Group have fixed revenue streams and the related assets were therefore classified as financial assets, in addition to income streams conditional upon performance, where the right under contract has been classified as an intangible asset. Financial instruments Financial assets Financial assets are recognised in relation to public to private concession arrangements to the extent that the Group has a contractual right to receive cash of a specified and determinable amount independent of when and how much the service is used and the only risk of non-recovery is credit deterioration of the counterparty. They are measured at fair value through profit and loss. Cash and cash equivalents Cash equivalents include short term deposits with original maturity within 3 months. For the purposes of the consolidated cash flow statement, cash and cash equivalents consist of cash and cash equivalents net of outstanding bank overdrafts held with the same counterparty where there is an unconditional right and intention to offset. Trade and other receivables Trade receivables are initially recognised at fair value, and subsequently remeasured at amortised cost, net of any allowance for impairment. Invoices for unmeasured water charges are due on predetermined dates, irrespective of date of receipt. Other trade receivables generally have 7-30 day payment terms. An estimate for doubtful debts is made when collection of the full amount is no longer probable. Bad debts are written off when identified. Trade and other payables Trade payables are initially recognised at fair value, and subsequently remeasured at amortised costs. Interest bearing loans and borrowings All loans and borrowings are initially recognised at fair value less directly attributable transaction costs. After initial recognition, interest-bearing loans and borrowings are subsequently measured at either; (i) amortised cost using the effective interest method. Gains and losses arising on repurchase,
settlement or otherwise cancellation of liabilities are recognised respectively in investment income and finance costs; or
(ii) fair value at the measurement date. The movement in the fair value of the loan or borrowing is recognised in the income statement. The fair values of the borrowings are determined by reference to quoted prices in active markets for identical assets or liabilities that the company can access at the measurement date.
Kelda Holdings Limited Notes to the Group financial statements (continued) for the year ended 31 March 2014
93
2. Accounting policies (continued) Derivative financial instruments Derivatives are initially recognised at fair value on the date a derivative contract is entered into and are subsequently re-measured at their fair value at the balance sheet date. The method of recognising the resulting gain or loss depends on whether the derivative is designated as a hedging instrument and, if so, the nature of the item being hedged. The Group designates certain derivatives as either (1) hedges of the fair value of recognised assets or liabilities or (2) cash flow hedges. The Group documents at the inception of the transaction the relationship between hedging instruments and hedged items, as well as its risk management objective and strategy for undertaking various hedge transactions. The Group also documents its assessment, both at hedge inception and on an on-going basis, of whether the derivatives that are used in hedging transactions are highly effective in offsetting changes in fair values of hedged items. Fair value hedge Changes in the fair value of derivatives that are designated and qualify as fair value hedges are recorded in the income statement, together with any changes in the fair value of the hedged asset or liability that are attributable to the hedged risk.
Cash flow hedge The portion of the gain or loss on the hedging instrument relating to the effective portion of the hedge is recognised in equity. Any ineffective portion is immediately recognised in the income statement. The gains or losses that are recognised in equity are transferred to the consolidated income statement in the same period in which the hedged cash flows affect the consolidated income statement. In the event the hedged item is no longer expected to occur or the hedge relationship ceases to be effective, accumulated gains or losses held in the cash flow hedge reserve are immediately recognised in the income statement. Derivatives that do not qualify for hedge accounting Certain derivative instruments do not qualify for hedge accounting. Changes in the fair value of any such derivative are immediately recognised in the income statement. Employee benefits Pension plans (i) Defined contribution scheme The Group operates two defined contribution schemes for those members of staff who are not members of its defined benefit scheme. Two pension plans exist under which the Group pays a fixed contribution into a separate entity which operates the schemes. The other provides the employees with a lump sum on retirement, with which they then invest in an annuity. Other than this contribution, the Group has no further legal or constructive obligation to make further contributions to the scheme. Obligations for contributions to the scheme are recognised as an expense in the income statement in the year in which they arise. (ii) Defined benefit scheme The Group operates a defined benefit scheme. A defined benefit scheme is a pension plan under which the amount of pension benefit that an employee receives on retirement is defined by reference to factors including age, years of service and compensation.
Kelda Holdings Limited Notes to the Group financial statements (continued) for the year ended 31 March 2014
94
2. Accounting policies (continued) The scheme is funded by payments, determined by periodic actuarial calculations agreed between the Group and the trustees to trustee administered funds. A liability or asset is recognised in the balance sheet in respect of the Group’s net obligations to the scheme. The liability or asset represents the net of the present value of the defined benefit obligations at the balance sheet date, less the fair value of the scheme assets and past service costs. The defined benefit obligation represents the estimated amount of future benefits that employees have earned in return for their services in current and prior years, discounted at a rate representing the yield on a high quality corporate bond at the balance sheet date, denominated in the same currency as the obligations and having the same terms to maturity as the related pension liability, applied to the estimated future cash outflows arising from these obligations. The calculation is performed by a qualified actuary using the projected unit credit method. Actuarial gains or losses (along with any deferred tax on them) are recognised in the statement of comprehensive income. Equity settled share based payments Previously, Kelda Group Limited (formerly plc) operated a savings related share option scheme under which options were granted to employees. The fair value of options granted in exchange for employee services rendered was recognised as an expense in the income statement with a corresponding credit to equity. The total amount expensed over the vesting period was determined by the fair value of the option at the date of the grant. The fair value of the option calculated was determined by use of mathematical modelling including the Black Scholes option pricing model. The Group re-assesses its estimate of the number of options that are expected to become exercisable at each balance sheet date. Any adjustments to the original estimates are recognised in the income statement. No expense is recognised for awards that did not ultimately vest, except for awards where vesting was conditional upon a market condition, which are treated as vesting irrespective of whether or not the market condition was satisfied, provided that all other performance conditions are satisfied. The scheme was closed following the acquisition of Kelda Group Limited (formerly plc) by Saltaire Water Limited. Certain schemes have been allowed to continue until the planned maturity with members choosing whether to continue contributing. For any member who has taken that option, charges to the income statement will continue until the maturity of the scheme. For any other member who has opted to close their scheme, charges to the income statement ceased in the month that they chose to leave the scheme. Share capital Ordinary shares are classified as equity. Exceptional items Exceptional items are items which derive from events or transactions that fall within the ordinary activities of the reporting entity and which individually or, if of a similar type, in aggregate need to be disclosed by virtue of their size or incidence if the financial statements are to give a true and fair view.
Kelda Holdings Limited Notes to the Group financial statements (continued) for the year ended 31 March 2014
95
2. Accounting policies (continued) Segmental reporting The Group’s primary reporting format is by business segment and its secondary format is by geographical segment. A segment is a component of the Group which can be distinguished separately as providing a product or service within a particular environment which is subject to risks and rewards that are different from those of other segments. The Group has identified 3 business segments: • UK Regulated Water Services – Yorkshire Water • UK Service Operations – Kelda Water Services and Loop • Property Development – KeyLand The directors’ report details the activities of each segment. Transfer pricing between business segments is set on an arm’s length basis similar to transactions with third parties. The Group’s geographical segments are determined by the location of the Group’s assets and operations. Fair value estimation The fair value of any financial instruments traded in active markets is based on quoted market prices at the balance sheet date. The quoted market price used for financial assets held by the Group is the current bid price; the appropriate quoted market price for financial liabilities is the current ask price. Quoted market prices or dealer quotes for similar instruments are used for long-term debt. Other techniques, such as estimated discounted cashflows, are used to determine fair value for the remaining financial instruments. The fair value of interest rate and currency swaps is calculated as the present value of the estimated future cashflows. The fair value calculations have been adjusted to incorporate own and counter-party credit risk. The nominal value less estimated credit adjustments of trade receivables and payables are assumed to approximate to their fair values. The fair value of financial liabilities for disclosure purposes is estimated by discounting the future contractual cash flows at the current market interest rate that is available to the Group for similar financial instruments. Principal areas of judgement The directors consider the principal areas of judgement in the financial statements to be: • Assumptions relating to the retirement benefit deficit
The present value of the pension obligation depends on a number of factors that are determined on an actuarial basis using a number of assumptions. The assumptions used in determining the net cost/ (income) for pensions include the discount rate of 4.55% (2013: 4.40%). Any changes in these assumptions will impact the carrying amount of the pension obligation. The Group determines the appropriate discount rate at the end of each year. This is the interest rate that should be used to determine the present value of estimated future cash outflows expected to be required to settle the pension obligations. In determining the appropriate discount rate, the Group considers the market yields at the reporting date on high quality corporate bonds.
Kelda Holdings Limited Notes to the Group financial statements (continued) for the year ended 31 March 2014
96
2. Accounting policies (continued) Other key assumptions for pension obligations are based in part on current market conditions. Additional information is disclosed in note 20. • Goodwill impairment testing The Group tests annually whether goodwill has suffered any impairment, in accordance with the accounting policy stated above. These calculations include estimates of future cash flows of each cash generating unit and the use of estimated discount rates. Management base their estimate of discount rate on a consideration of the long term risk free interest rate for the UK, an industry specific risk factor (beta factor), a market risk premium at the date of valuation and a company specific risk factor. In reviewing goodwill for impairment the Group applied a discount rate of 6.25% (2013: 6.00%) and a long term inflation rate of 2.75% (2013: 2.75%) to the expected future cash flows of the Group. Inflation is deemed to be a key driver of revenue and costs for the Group. On this basis the recoverable amount of goodwill exceeds its carrying amount by £761.8m (2013: £2,016.7m). Were the discount rate used to increase by 0.6% (2013: 1.5%) from management’s estimates, the headroom available in the goodwill impairment review would be eliminated. Were the long term inflation rate to decrease by 0.6% (2013: 1.5%) from management’s estimates, the headroom available in the goodwill impairment review would be eliminated. Further details relating to goodwill are disclosed in note 10 of the financial statements. • Property, plant and equipment The Group’s accounting policy for property, plant and equipment (PPE) is detailed on page 89 of the financial statements. Estimated useful economic lives of PPE are based on management’s judgement and experience. When management identifies that actual useful lives differ materially from the estimates used to calculate depreciation, that charge is adjusted prospectively. Due to the significance of capital investment to the Group, variations between actual and estimated useful lives could impact operating results both positively and negatively. Historically, only minor changes to estimated useful lives have been required. The Group is required to evaluate the carrying value of PPE for impairment whenever circumstances indicate, in management’s judgement, that the carrying value of such assets may not be recoverable. An impairment review requires management to make subjective judgements concerning the cash flows, growth rates and discount rates of the cash generating units under review.
• Onerous contracts provision The Group has made a provision in relation to expected losses from the contract to provide sewerage services to the City of Bridgeport in Connecticut, US that terminated in 2013. The provision will be utilised as the final termination costs are settled and while the expected future costs are uncertain, management do not expect any material difference to the amounts provided. • Provision for doubtful debts At each balance sheet date, the Group evaluates the collectability of trade receivables and records provisions for impairment of receivables based on experience including, for example, comparisons of the relative age of accounts and consideration of actual write-off history. The actual level of debt collected may differ for the estimated levels of recovery, which could impact operating results
Kelda Holdings Limited Notes to the Group financial statements (continued) for the year ended 31 March 2014
97
2. Accounting policies (continued) positively or negatively. As at 31 March 2014 current trade receivables were £125.4m (2013: £114.4m), before provision for impairments. • Taxation The corporation tax provision of £6.3m (2013: £15.4m) reflects management’s estimation of the amount of tax payable for fiscal years with open tax computations where liabilities remain to be agreed by Her Majesty’s Revenue and Customs. New standards and interpretations The following standards have been adopted by the Group for the first time for the financial year beginning 1 April 2013 and have a material impact on the Group:
• IFRS 13 ‘Fair value measurements’, aims to improve consistency and reduce complexity by providing a precise definition of fair value and a single source of fair value measurement and disclosure requirements for use across IFRSs. Application of this standard by the Group has resulted in a £87.8m credit to finance income/(costs) as disclosed in note 5.
The following standards have been adopted by the Group for the first time for the financial year beginning 1 April 2013 and do not have a material impact on the Group:
• IAS 19 ‘Employee benefits’ (revised). The changes on the Group’s accounting policies has been as follows: to immediately recognise all past service costs; and to replace interest cost and expected return on plan assets with a net interest amount that is calculated by applying the discount rate to the net defined benefit liability. See note 20 for the impact on the financial statements.
• Amendment to IAS 1 ‘Financial statement presentation’ regarding other comprehensive income.
The following standards, interpretations and amendments to existing standards are effective for annual periods starting on or after 1 January 2014 and have not been early adopted by the Group:
• Amendment to IAS 32 ‘Financial instruments presentation - offsetting financial assets and liabilities’
• Amendments to IFRS 10, IFRS 12 and IAS 27 for investment entities • Amendments to IAS 36 ‘Impairment of assets’ • Amendment to IAS 39 ‘Financial instruments: Recognition and measurement’ • Amendments to IFRS 10, 11 and 12 on transition guidance • IFRS 10 ‘Consolidated financial statements’ • IFRS 11 ‘Joint arrangements’ • IFRS 12 ‘Disclosures of interests in other entities’ • IAS 27 (revised) ‘Separate financial statements’ • IAS 28 (revised) ‘Associates and joint ventures’
Kelda Holdings Limited Notes to the Group financial statements (continued) for the year ended 31 March 2014
98
2. Accounting policies (continued) The following standards, interpretations and amendments to existing standards are not yet effective and have not been early adopted by the Group:
• Amendment to IAS 19 ‘Employee benefits’ • Amendments to IFRS 9 ‘Financial instruments – regarding general hedge accounting’ • IFRS 9 ‘Financial instruments – classification and measurement’ • Amendment to IFRS 7 ‘Financial instruments disclosures – offsetting financial assets and
liabilities’ • IFRS 14 ‘Regulatory deferral accounts’ • IFRIC 21 ‘Levies’
The Group is still considering the implications of applying these standards and interpretations to the Group’s financial statements.
Kelda Holdings Limited Notes to the Group financial statements (continued) for the year ended 31 March 2014
99
3. Segmental information The primary segment reporting format is determined to be business segments as the Group's risks and rates of return are affected predominantly by differences in the products and services provided. Secondary segment information is reported geographically. The operating businesses are organised and managed separately according to the nature of the products and services provided. The segments shown are the segments for which management information is presented to the Board which is deemed to be in the Group’s chief operating decision maker. The Board considers the business from a business segment perspective. Transfer prices between business segments are set on an arm’s length basis in a manner similar to transactions with third parties. Segment revenue, segment expense and segment results include transfers between business segments. Those transfers are eliminated on consolidation. It is not possible to split the retirement benefit deficit between the UK subsidiary companies. It is therefore recognised within the unallocated segment.
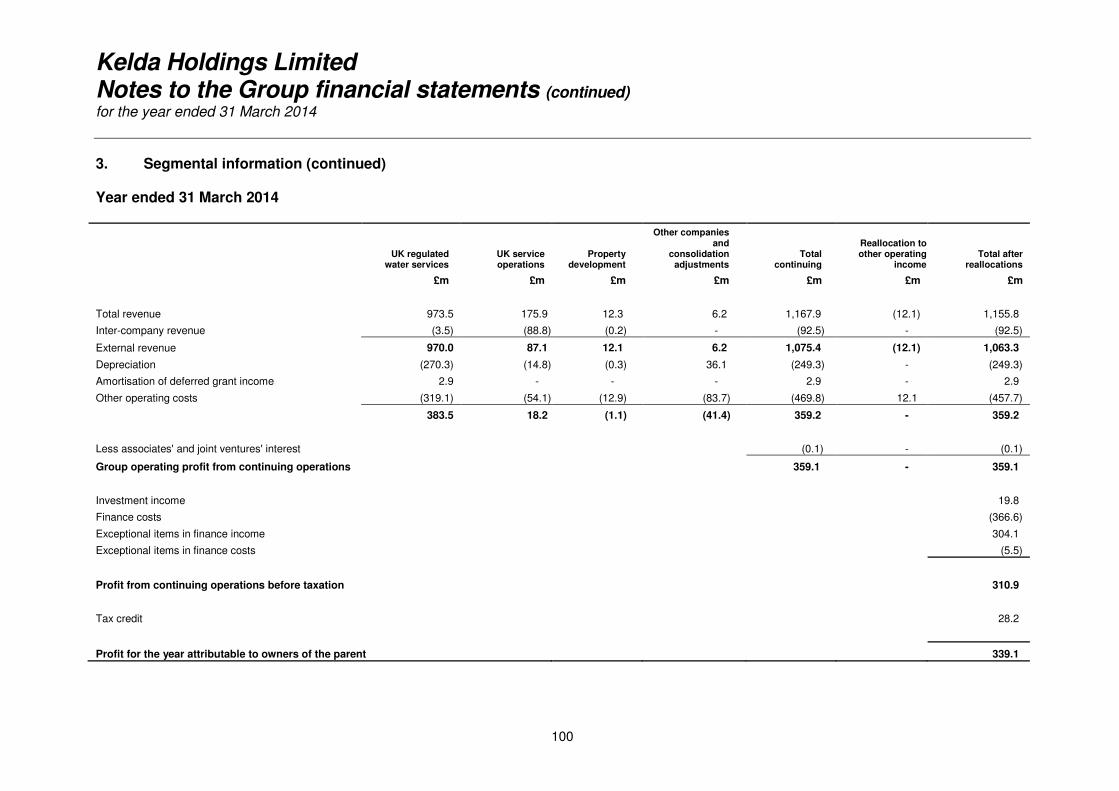
Kelda Holdings Limited Notes to the Group financial statements (continued) for the year ended 31 March 2014
100
3. Segmental information (continued)
Year ended 31 March 2014
UK regulated
water services UK service operations
Property development
Other companies and
consolidation adjustments
Total continuing
Reallocation to other operating
income Total after
reallocations
£m £m £m £m £m £m £m
Total revenue 973.5 175.9 12.3 6.2 1,167.9 (12.1) 1,155.8
Inter-company revenue (3.5) (88.8) (0.2) - (92.5) - (92.5)
External revenue 970.0 87.1 12.1 6.2 1,075.4 (12.1) 1,063.3
Depreciation (270.3) (14.8) (0.3) 36.1 (249.3) - (249.3)
Amortisation of deferred grant income 2.9 - - - 2.9 - 2.9
Other operating costs (319.1) (54.1) (12.9) (83.7) (469.8) 12.1 (457.7)
383.5 18.2 (1.1) (41.4) 359.2 - 359.2
Less associates' and joint ventures' interest (0.1) - (0.1)
Group operating profit from continuing operations 359.1 - 359.1
Investment income 19.8
Finance costs (366.6)
Exceptional items in finance income 304.1
Exceptional items in finance costs (5.5)
Profit from continuing operations before taxation 310.9
Tax credit 28.2
Profit for the year attributable to owners of the parent 339.1
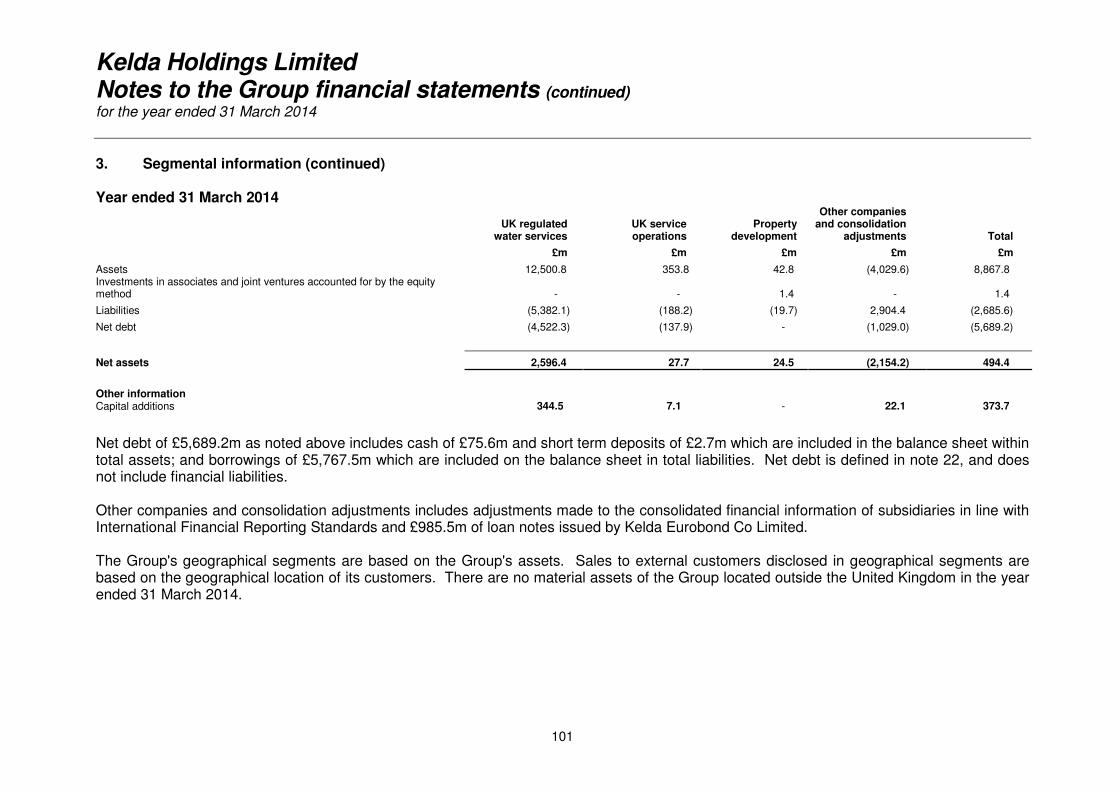
Kelda Holdings Limited Notes to the Group financial statements (continued) for the year ended 31 March 2014
101
3. Segmental information (continued) Year ended 31 March 2014
UK regulated
water services UK service operations
Property development
Other companies and consolidation
adjustments Total £m £m £m £m £m
Assets 12,500.8 353.8 42.8 (4,029.6) 8,867.8 Investments in associates and joint ventures accounted for by the equity method - - 1.4 - 1.4
Liabilities (5,382.1) (188.2) (19.7) 2,904.4 (2,685.6)
Net debt (4,522.3) (137.9) - (1,029.0) (5,689.2)
Net assets 2,596.4 27.7 24.5 (2,154.2) 494.4
Other information Capital additions 344.5 7.1 - 22.1 373.7
Net debt of £5,689.2m as noted above includes cash of £75.6m and short term deposits of £2.7m which are included in the balance sheet within total assets; and borrowings of £5,767.5m which are included on the balance sheet in total liabilities. Net debt is defined in note 22, and does not include financial liabilities. Other companies and consolidation adjustments includes adjustments made to the consolidated financial information of subsidiaries in line with International Financial Reporting Standards and £985.5m of loan notes issued by Kelda Eurobond Co Limited. The Group's geographical segments are based on the Group's assets. Sales to external customers disclosed in geographical segments are based on the geographical location of its customers. There are no material assets of the Group located outside the United Kingdom in the year ended 31 March 2014.
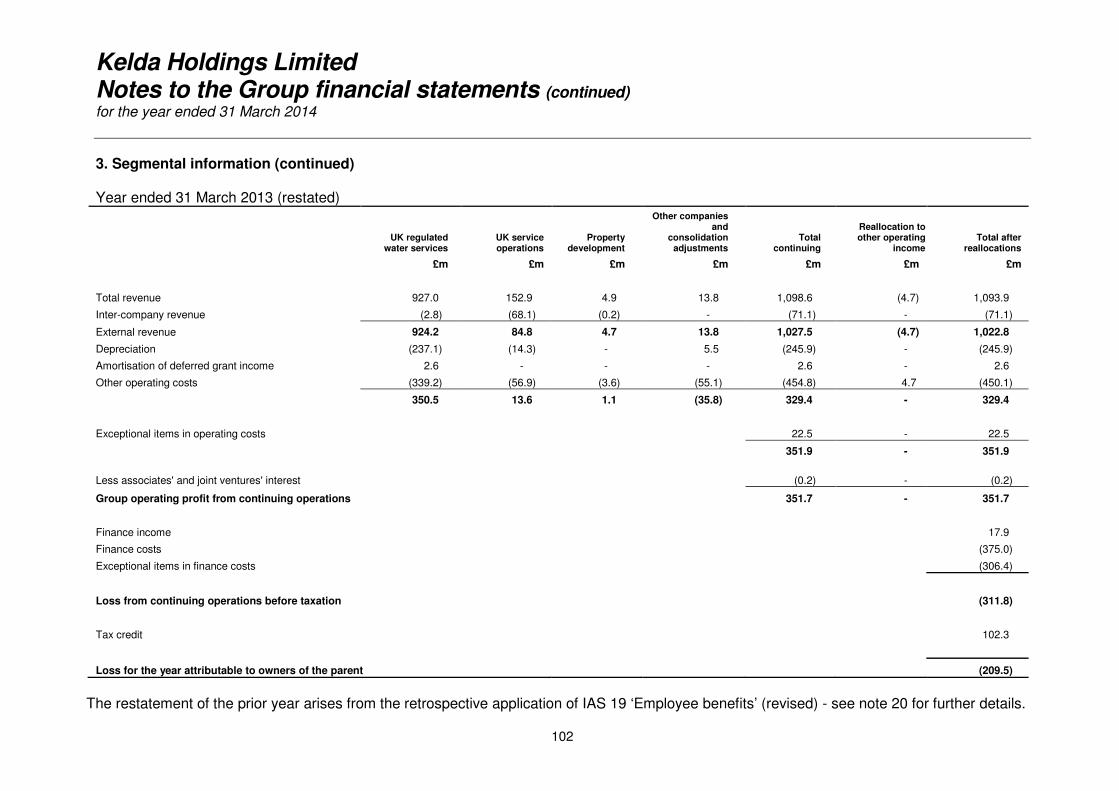
Kelda Holdings Limited Notes to the Group financial statements (continued) for the year ended 31 March 2014
102
3. Segmental information (continued) Year ended 31 March 2013 (restated)
UK regulated
water services UK service operations
Property development
Other companies and
consolidation adjustments
Total continuing
Reallocation to other operating
income Total after
reallocations
£m £m £m £m £m £m £m
Total revenue 927.0 152.9 4.9 13.8 1,098.6 (4.7) 1,093.9
Inter-company revenue (2.8) (68.1) (0.2) - (71.1) - (71.1)
External revenue 924.2 84.8 4.7 13.8 1,027.5 (4.7) 1,022.8
Depreciation (237.1) (14.3) - 5.5 (245.9) - (245.9)
Amortisation of deferred grant income 2.6 - - - 2.6 - 2.6
Other operating costs (339.2) (56.9) (3.6) (55.1) (454.8) 4.7 (450.1)
350.5 13.6 1.1 (35.8) 329.4 - 329.4
Exceptional items in operating costs 22.5 - 22.5
351.9 - 351.9
Less associates' and joint ventures' interest (0.2) - (0.2)
Group operating profit from continuing operations 351.7 - 351.7
Finance income 17.9
Finance costs (375.0)
Exceptional items in finance costs (306.4)
Loss from continuing operations before taxation (311.8)
Tax credit 102.3
Loss for the year attributable to owners of the parent (209.5)
The restatement of the prior year arises from the retrospective application of IAS 19 ‘Employee benefits’ (revised) - see note 20 for further details.
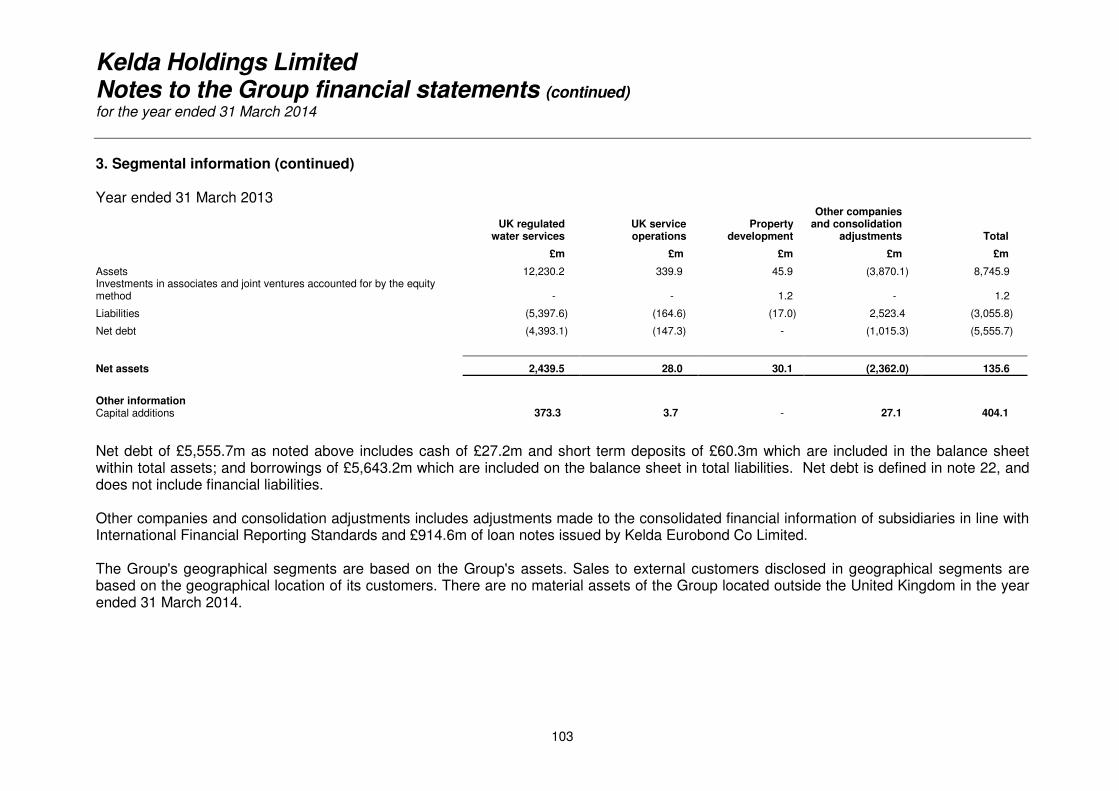
Kelda Holdings Limited Notes to the Group financial statements (continued) for the year ended 31 March 2014
103
3. Segmental information (continued) Year ended 31 March 2013
UK regulated
water services UK service operations
Property development
Other companies and consolidation
adjustments Total
£m £m £m £m £m
Assets 12,230.2 339.9 45.9 (3,870.1) 8,745.9 Investments in associates and joint ventures accounted for by the equity method - - 1.2 - 1.2
Liabilities (5,397.6) (164.6) (17.0) 2,523.4 (3,055.8)
Net debt (4,393.1) (147.3) - (1,015.3) (5,555.7)
Net assets 2,439.5 28.0 30.1 (2,362.0) 135.6
Other information Capital additions 373.3 3.7 - 27.1 404.1
Net debt of £5,555.7m as noted above includes cash of £27.2m and short term deposits of £60.3m which are included in the balance sheet within total assets; and borrowings of £5,643.2m which are included on the balance sheet in total liabilities. Net debt is defined in note 22, and does not include financial liabilities. Other companies and consolidation adjustments includes adjustments made to the consolidated financial information of subsidiaries in line with International Financial Reporting Standards and £914.6m of loan notes issued by Kelda Eurobond Co Limited. The Group's geographical segments are based on the Group's assets. Sales to external customers disclosed in geographical segments are based on the geographical location of its customers. There are no material assets of the Group located outside the United Kingdom in the year ended 31 March 2014.
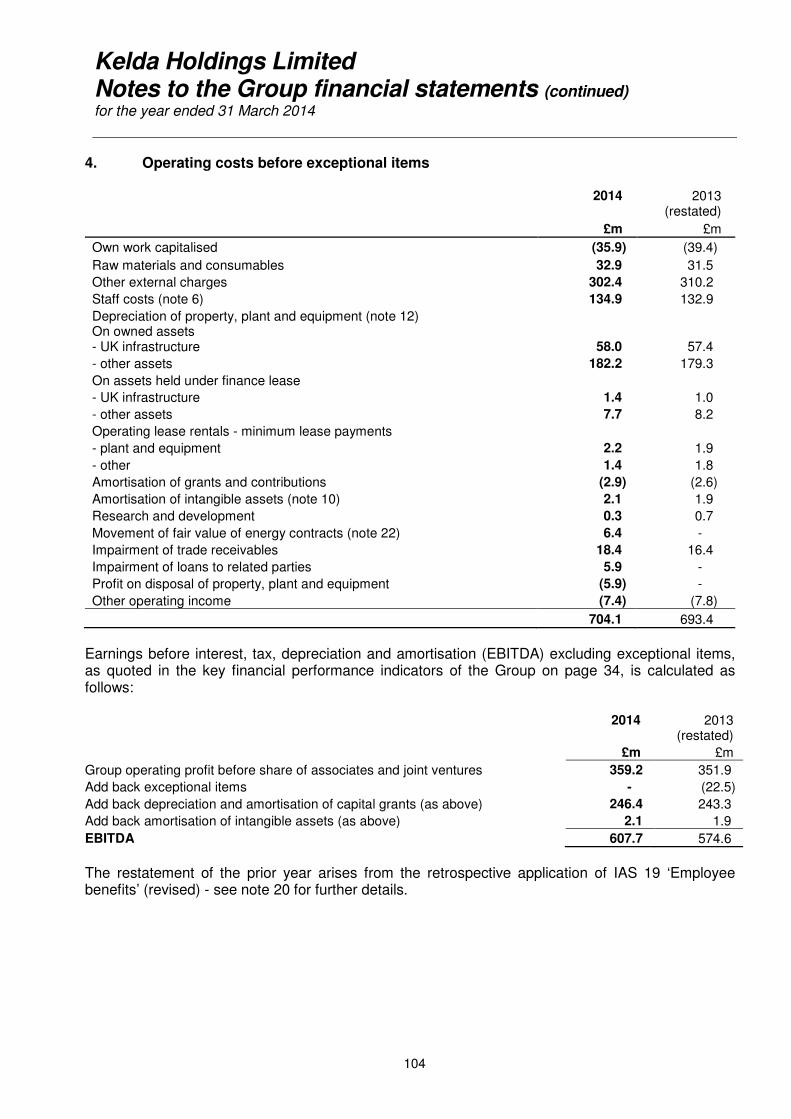
Kelda Holdings Limited Notes to the Group financial statements (continued) for the year ended 31 March 2014
104
4. Operating costs before exceptional items
2014
2013
(restated)
£m £m
Own work capitalised (35.9) (39.4)
Raw materials and consumables 32.9 31.5
Other external charges 302.4 310.2
Staff costs (note 6) 134.9 132.9
Depreciation of property, plant and equipment (note 12) On owned assets - UK infrastructure 58.0 57.4
- other assets 182.2 179.3
On assets held under finance lease
- UK infrastructure 1.4 1.0
- other assets 7.7 8.2
Operating lease rentals - minimum lease payments
- plant and equipment 2.2 1.9
- other 1.4 1.8
Amortisation of grants and contributions (2.9) (2.6)
Amortisation of intangible assets (note 10) 2.1 1.9
Research and development 0.3 0.7
Movement of fair value of energy contracts (note 22) 6.4 -
Impairment of trade receivables 18.4 16.4
Impairment of loans to related parties 5.9 -
Profit on disposal of property, plant and equipment (5.9) -
Other operating income (7.4) (7.8)
704.1 693.4
Earnings before interest, tax, depreciation and amortisation (EBITDA) excluding exceptional items, as quoted in the key financial performance indicators of the Group on page 34, is calculated as follows:
2014 2013
(restated)
£m £m
Group operating profit before share of associates and joint ventures 359.2 351.9
Add back exceptional items - (22.5)
Add back depreciation and amortisation of capital grants (as above) 246.4 243.3
Add back amortisation of intangible assets (as above) 2.1 1.9
EBITDA 607.7 574.6
The restatement of the prior year arises from the retrospective application of IAS 19 ‘Employee benefits’ (revised) - see note 20 for further details.
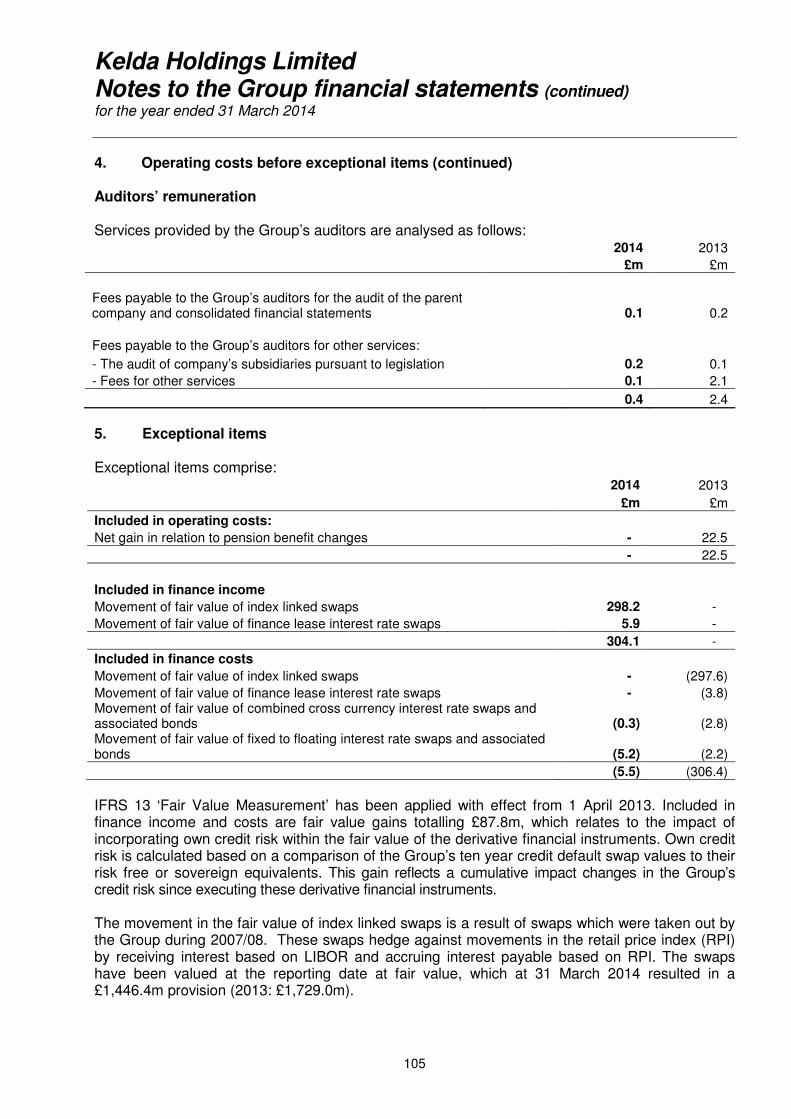
Kelda Holdings Limited Notes to the Group financial statements (continued) for the year ended 31 March 2014
105
4. Operating costs before exceptional items (continued) Auditors’ remuneration Services provided by the Group’s auditors are analysed as follows: 2014 2013
£m £m
Fees payable to the Group’s auditors for the audit of the parent company and consolidated financial statements 0.1 0.2
Fees payable to the Group’s auditors for other services:
- The audit of company’s subsidiaries pursuant to legislation 0.2 0.1
- Fees for other services 0.1 2.1
0.4 2.4
5. Exceptional items Exceptional items comprise: 2014 2013
£m £m
Included in operating costs:
Net gain in relation to pension benefit changes - 22.5
- 22.5
Included in finance income
Movement of fair value of index linked swaps 298.2 -
Movement of fair value of finance lease interest rate swaps 5.9 -
304.1 -
Included in finance costs
Movement of fair value of index linked swaps - (297.6)
Movement of fair value of finance lease interest rate swaps - (3.8) Movement of fair value of combined cross currency interest rate swaps and associated bonds (0.3) (2.8) Movement of fair value of fixed to floating interest rate swaps and associated bonds (5.2) (2.2)
(5.5) (306.4)
IFRS 13 ‘Fair Value Measurement’ has been applied with effect from 1 April 2013. Included in finance income and costs are fair value gains totalling £87.8m, which relates to the impact of incorporating own credit risk within the fair value of the derivative financial instruments. Own credit risk is calculated based on a comparison of the Group’s ten year credit default swap values to their risk free or sovereign equivalents. This gain reflects a cumulative impact changes in the Group’s credit risk since executing these derivative financial instruments. The movement in the fair value of index linked swaps is a result of swaps which were taken out by the Group during 2007/08. These swaps hedge against movements in the retail price index (RPI) by receiving interest based on LIBOR and accruing interest payable based on RPI. The swaps have been valued at the reporting date at fair value, which at 31 March 2014 resulted in a £1,446.4m provision (2013: £1,729.0m).
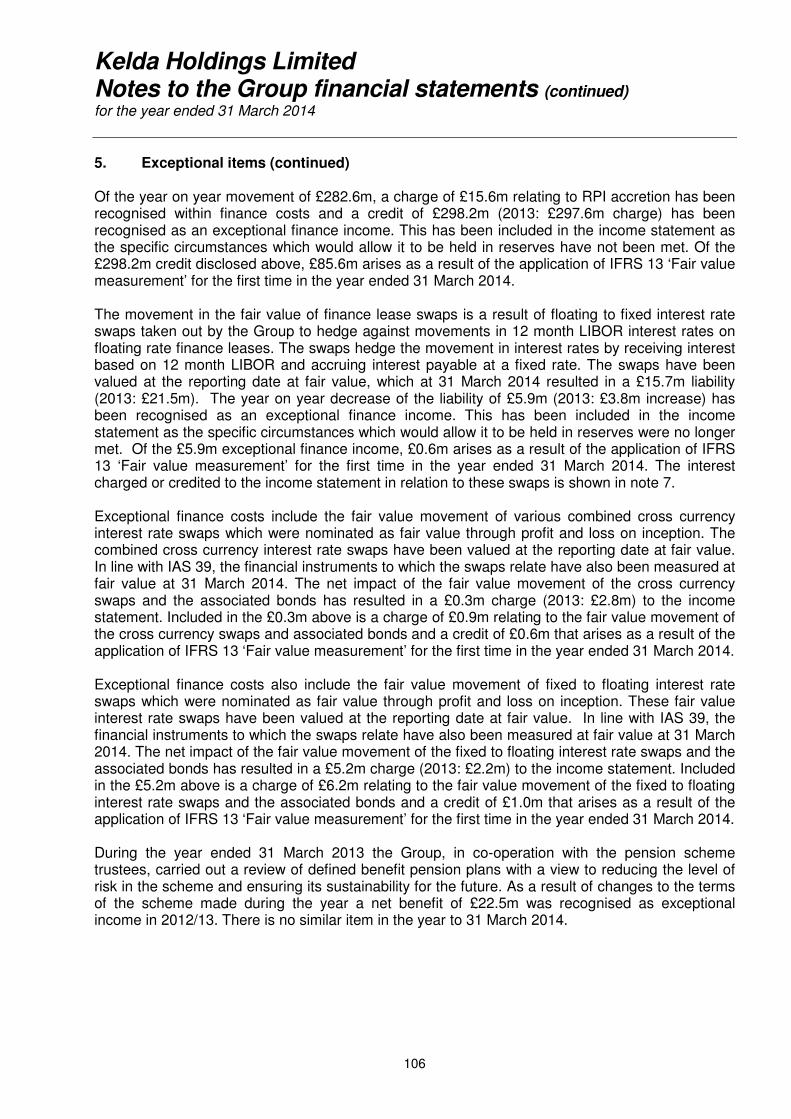
Kelda Holdings Limited Notes to the Group financial statements (continued) for the year ended 31 March 2014
106
5. Exceptional items (continued) Of the year on year movement of £282.6m, a charge of £15.6m relating to RPI accretion has been recognised within finance costs and a credit of £298.2m (2013: £297.6m charge) has been recognised as an exceptional finance income. This has been included in the income statement as the specific circumstances which would allow it to be held in reserves have not been met. Of the £298.2m credit disclosed above, £85.6m arises as a result of the application of IFRS 13 ‘Fair value measurement’ for the first time in the year ended 31 March 2014. The movement in the fair value of finance lease swaps is a result of floating to fixed interest rate swaps taken out by the Group to hedge against movements in 12 month LIBOR interest rates on floating rate finance leases. The swaps hedge the movement in interest rates by receiving interest based on 12 month LIBOR and accruing interest payable at a fixed rate. The swaps have been valued at the reporting date at fair value, which at 31 March 2014 resulted in a £15.7m liability (2013: £21.5m). The year on year decrease of the liability of £5.9m (2013: £3.8m increase) has been recognised as an exceptional finance income. This has been included in the income statement as the specific circumstances which would allow it to be held in reserves were no longer met. Of the £5.9m exceptional finance income, £0.6m arises as a result of the application of IFRS 13 ‘Fair value measurement’ for the first time in the year ended 31 March 2014. The interest charged or credited to the income statement in relation to these swaps is shown in note 7. Exceptional finance costs include the fair value movement of various combined cross currency interest rate swaps which were nominated as fair value through profit and loss on inception. The combined cross currency interest rate swaps have been valued at the reporting date at fair value. In line with IAS 39, the financial instruments to which the swaps relate have also been measured at fair value at 31 March 2014. The net impact of the fair value movement of the cross currency swaps and the associated bonds has resulted in a £0.3m charge (2013: £2.8m) to the income statement. Included in the £0.3m above is a charge of £0.9m relating to the fair value movement of the cross currency swaps and associated bonds and a credit of £0.6m that arises as a result of the application of IFRS 13 ‘Fair value measurement’ for the first time in the year ended 31 March 2014. Exceptional finance costs also include the fair value movement of fixed to floating interest rate swaps which were nominated as fair value through profit and loss on inception. These fair value interest rate swaps have been valued at the reporting date at fair value. In line with IAS 39, the financial instruments to which the swaps relate have also been measured at fair value at 31 March 2014. The net impact of the fair value movement of the fixed to floating interest rate swaps and the associated bonds has resulted in a £5.2m charge (2013: £2.2m) to the income statement. Included in the £5.2m above is a charge of £6.2m relating to the fair value movement of the fixed to floating interest rate swaps and the associated bonds and a credit of £1.0m that arises as a result of the application of IFRS 13 ‘Fair value measurement’ for the first time in the year ended 31 March 2014. During the year ended 31 March 2013 the Group, in co-operation with the pension scheme trustees, carried out a review of defined benefit pension plans with a view to reducing the level of risk in the scheme and ensuring its sustainability for the future. As a result of changes to the terms of the scheme made during the year a net benefit of £22.5m was recognised as exceptional income in 2012/13. There is no similar item in the year to 31 March 2014.
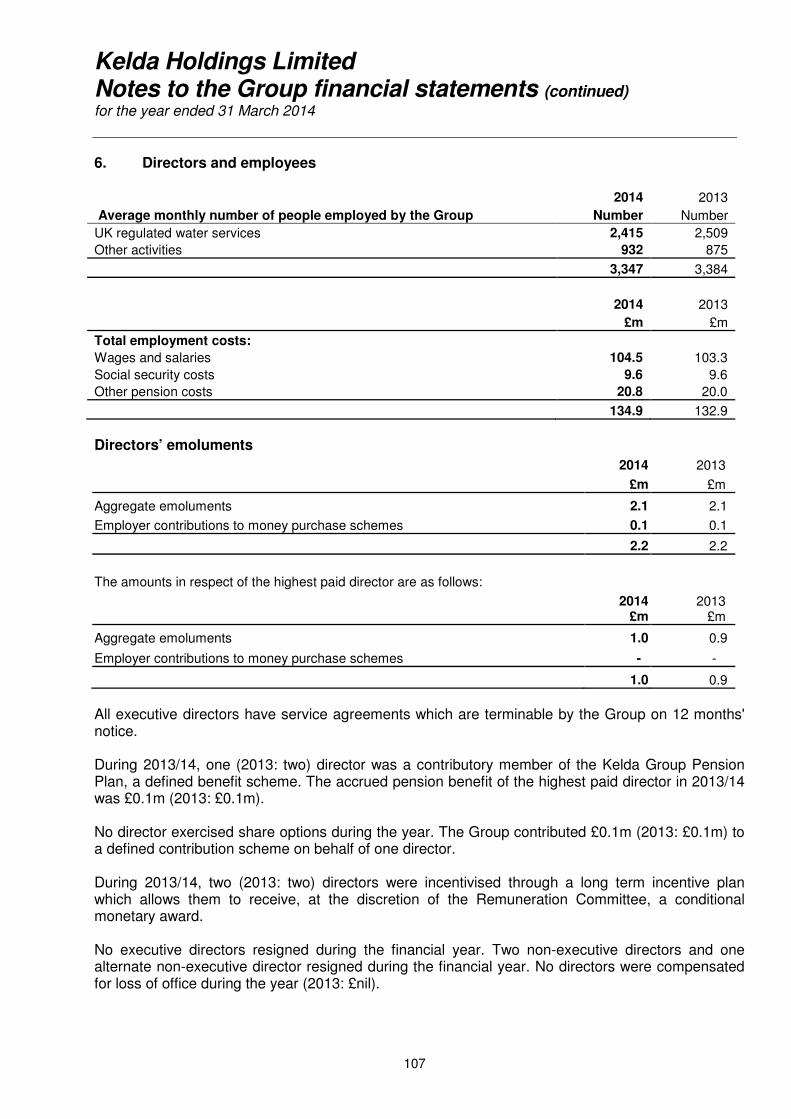
Kelda Holdings Limited Notes to the Group financial statements (continued) for the year ended 31 March 2014
107
6. Directors and employees 2014 2013
Average monthly number of people employed by the Group Number Number
UK regulated water services 2,415 2,509
Other activities 932 875
3,347 3,384
2014 2013
£m £m
Total employment costs:
Wages and salaries 104.5 103.3
Social security costs 9.6 9.6
Other pension costs 20.8 20.0
134.9 132.9
Directors’ emoluments
2014 2013
£m £m
Aggregate emoluments 2.1 2.1
Employer contributions to money purchase schemes 0.1 0.1
2.2 2.2
The amounts in respect of the highest paid director are as follows:
2014 £m
2013 £m
Aggregate emoluments 1.0 0.9
Employer contributions to money purchase schemes - -
1.0 0.9
All executive directors have service agreements which are terminable by the Group on 12 months' notice. During 2013/14, one (2013: two) director was a contributory member of the Kelda Group Pension Plan, a defined benefit scheme. The accrued pension benefit of the highest paid director in 2013/14 was £0.1m (2013: £0.1m). No director exercised share options during the year. The Group contributed £0.1m (2013: £0.1m) to a defined contribution scheme on behalf of one director. During 2013/14, two (2013: two) directors were incentivised through a long term incentive plan which allows them to receive, at the discretion of the Remuneration Committee, a conditional monetary award. No executive directors resigned during the financial year. Two non-executive directors and one alternate non-executive director resigned during the financial year. No directors were compensated for loss of office during the year (2013: £nil).
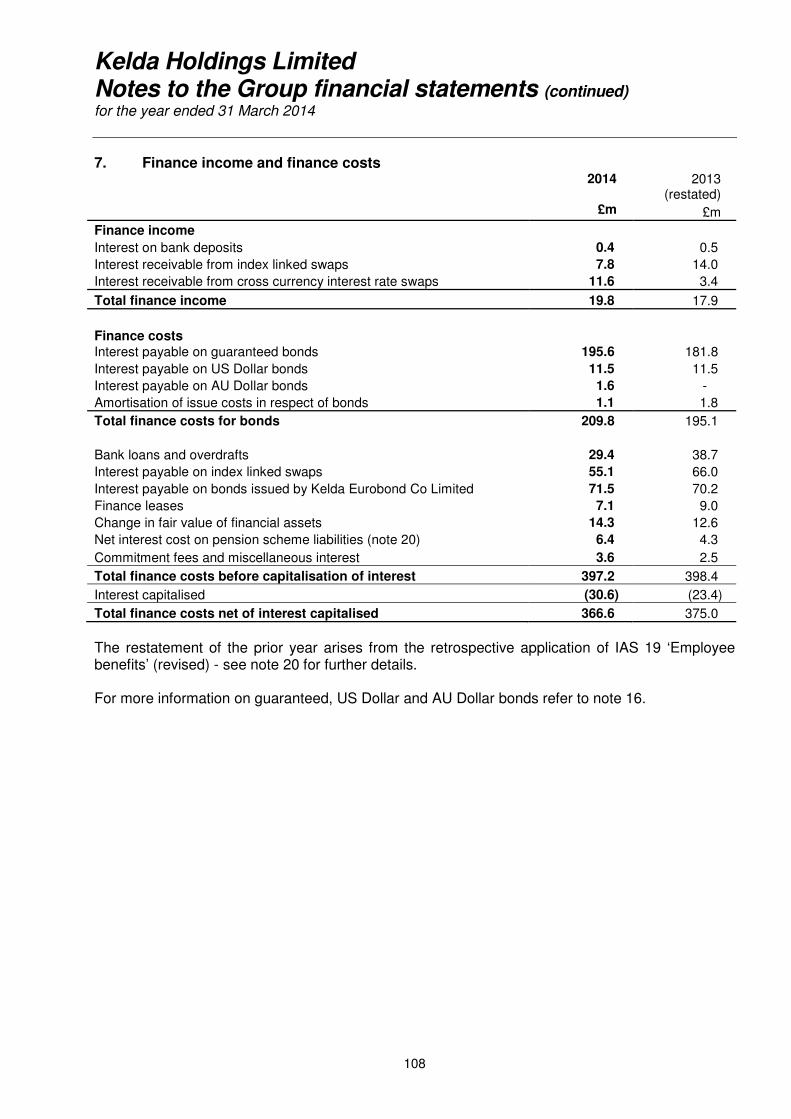
Kelda Holdings Limited Notes to the Group financial statements (continued) for the year ended 31 March 2014
108
7. Finance income and finance costs
2014
2013
(restated)
£m £m
Finance income
Interest on bank deposits 0.4 0.5
Interest receivable from index linked swaps 7.8 14.0
Interest receivable from cross currency interest rate swaps 11.6 3.4
Total finance income 19.8 17.9
Finance costs
Interest payable on guaranteed bonds 195.6 181.8
Interest payable on US Dollar bonds 11.5 11.5
Interest payable on AU Dollar bonds 1.6 -
Amortisation of issue costs in respect of bonds 1.1 1.8
Total finance costs for bonds 209.8 195.1
Bank loans and overdrafts 29.4 38.7
Interest payable on index linked swaps 55.1 66.0
Interest payable on bonds issued by Kelda Eurobond Co Limited 71.5 70.2
Finance leases 7.1 9.0
Change in fair value of financial assets 14.3 12.6
Net interest cost on pension scheme liabilities (note 20) 6.4 4.3
Commitment fees and miscellaneous interest 3.6 2.5
Total finance costs before capitalisation of interest 397.2 398.4
Interest capitalised (30.6) (23.4)
Total finance costs net of interest capitalised 366.6 375.0
The restatement of the prior year arises from the retrospective application of IAS 19 ‘Employee benefits’ (revised) - see note 20 for further details. For more information on guaranteed, US Dollar and AU Dollar bonds refer to note 16.
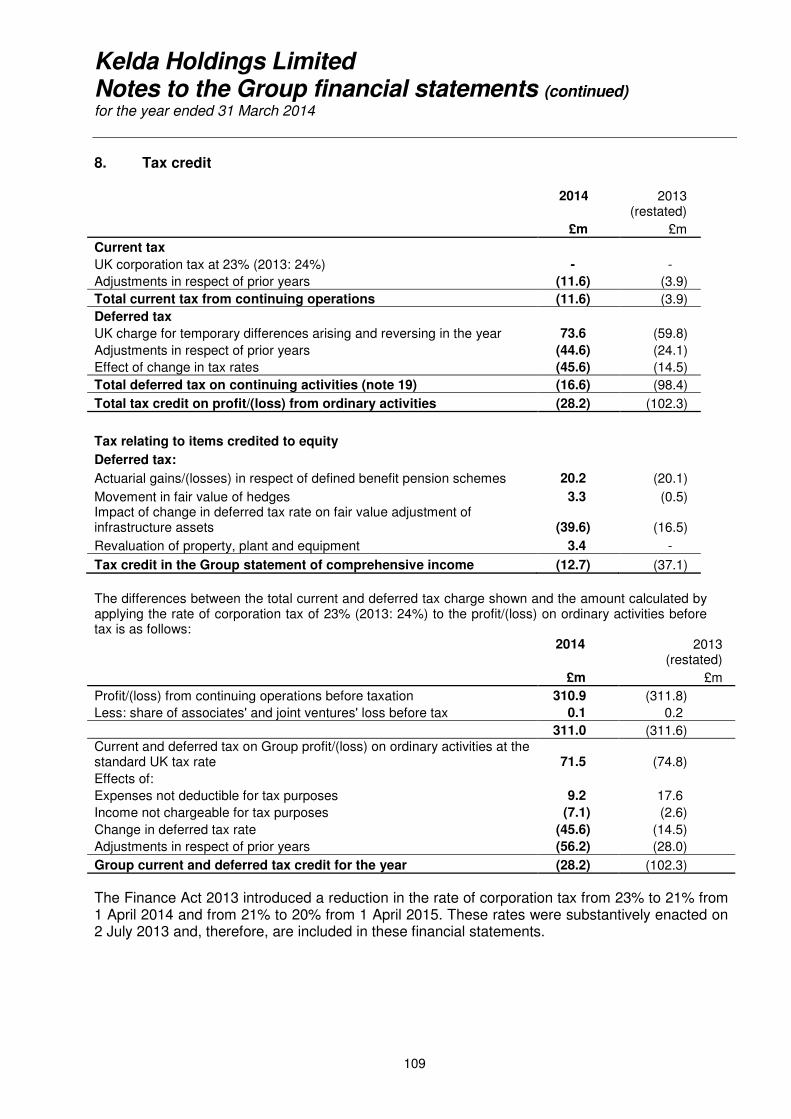
Kelda Holdings Limited Notes to the Group financial statements (continued) for the year ended 31 March 2014
109
8. Tax credit
2014
2013
(restated)
£m £m
Current tax
UK corporation tax at 23% (2013: 24%) - -
Adjustments in respect of prior years (11.6) (3.9)
Total current tax from continuing operations (11.6) (3.9)
Deferred tax
UK charge for temporary differences arising and reversing in the year 73.6 (59.8)
Adjustments in respect of prior years (44.6) (24.1)
Effect of change in tax rates (45.6) (14.5)
Total deferred tax on continuing activities (note 19) (16.6) (98.4)
Total tax credit on profit/(loss) from ordinary activities (28.2) (102.3)
Tax relating to items credited to equity
Deferred tax:
Actuarial gains/(losses) in respect of defined benefit pension schemes 20.2 (20.1)
Movement in fair value of hedges 3.3 (0.5) Impact of change in deferred tax rate on fair value adjustment of infrastructure assets (39.6) (16.5)
Revaluation of property, plant and equipment 3.4 -
Tax credit in the Group statement of comprehensive income (12.7) (37.1)
The differences between the total current and deferred tax charge shown and the amount calculated by applying the rate of corporation tax of 23% (2013: 24%) to the profit/(loss) on ordinary activities before tax is as follows:
2014
2013 (restated)
£m £m
Profit/(loss) from continuing operations before taxation 310.9 (311.8)
Less: share of associates' and joint ventures' loss before tax 0.1 0.2
311.0 (311.6) Current and deferred tax on Group profit/(loss) on ordinary activities at the standard UK tax rate 71.5 (74.8)
Effects of:
Expenses not deductible for tax purposes 9.2 17.6
Income not chargeable for tax purposes (7.1) (2.6)
Change in deferred tax rate (45.6) (14.5)
Adjustments in respect of prior years (56.2) (28.0)
Group current and deferred tax credit for the year (28.2) (102.3)
The Finance Act 2013 introduced a reduction in the rate of corporation tax from 23% to 21% from 1 April 2014 and from 21% to 20% from 1 April 2015. These rates were substantively enacted on 2 July 2013 and, therefore, are included in these financial statements.
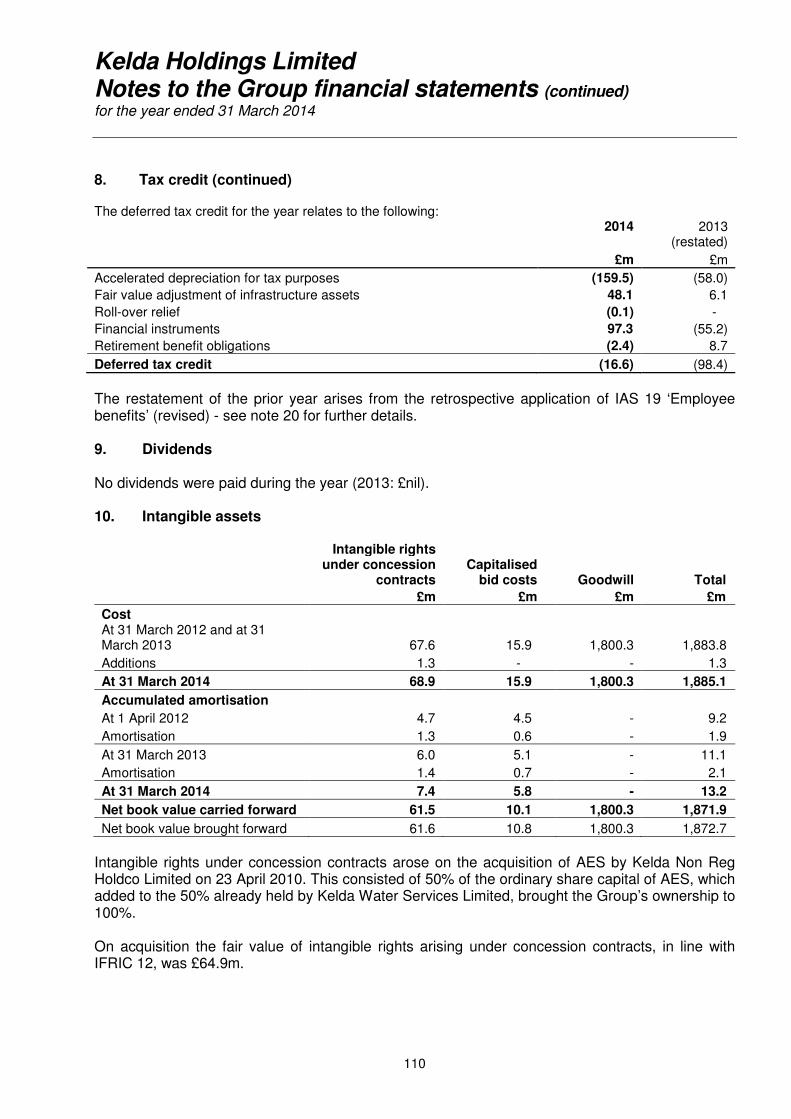
Kelda Holdings Limited Notes to the Group financial statements (continued) for the year ended 31 March 2014
110
8. Tax credit (continued) The deferred tax credit for the year relates to the following:
2014
2013
(restated)
£m £m
Accelerated depreciation for tax purposes (159.5) (58.0)
Fair value adjustment of infrastructure assets 48.1 6.1
Roll-over relief (0.1) -
Financial instruments 97.3 (55.2)
Retirement benefit obligations (2.4) 8.7
Deferred tax credit (16.6) (98.4)
The restatement of the prior year arises from the retrospective application of IAS 19 ‘Employee benefits’ (revised) - see note 20 for further details. 9. Dividends No dividends were paid during the year (2013: £nil). 10. Intangible assets
Intangible rights under concession
contracts Capitalised
bid costs Goodwill Total
£m £m £m £m
Cost At 31 March 2012 and at 31 March 2013
67.6 15.9 1,800.3 1,883.8
Additions 1.3 - - 1.3
At 31 March 2014 68.9 15.9 1,800.3 1,885.1
Accumulated amortisation
At 1 April 2012 4.7 4.5 - 9.2
Amortisation 1.3 0.6 - 1.9
At 31 March 2013 6.0 5.1 - 11.1
Amortisation 1.4 0.7 - 2.1
At 31 March 2014 7.4 5.8 - 13.2
Net book value carried forward 61.5 10.1 1,800.3 1,871.9
Net book value brought forward 61.6 10.8 1,800.3 1,872.7
Intangible rights under concession contracts arose on the acquisition of AES by Kelda Non Reg Holdco Limited on 23 April 2010. This consisted of 50% of the ordinary share capital of AES, which added to the 50% already held by Kelda Water Services Limited, brought the Group’s ownership to 100%. On acquisition the fair value of intangible rights arising under concession contracts, in line with IFRIC 12, was £64.9m.

Kelda Holdings Limited Notes to the Group financial statements (continued) for the year ended 31 March 2014
111
10. Intangible assets (continued) Impairment tests for goodwill Existing goodwill of £1,800.3m is all allocated to the UK regulated water services business segment. The recoverable amount of the UK regulated water services segment is determined based on a value in use calculation, using post tax cash flow projections based on financial budgets, Yorkshire Water’s final determination and long term business modelling covering a 25 year period. The period of cash flows of 25 years is deemed appropriate as it aligns with the long term planning of the regulated business as determined by Ofwat. The discount and inflation rates applied have been determined following advice from external consultants based on risk factors specific to the industry and circumstances of the Group. The key assumptions used for the value-in-use calculation are as follows: 2014 2013
Long term inflation (post 2013) 2.75% 2.75% Discount rate (post-tax) 6.25% 6.00%
The directors have prepared an impairment test which showed that there was no impairment of goodwill for the year ended 31 March 2014 or year ended 31 March 2013. Sensitivities to change in the above assumptions are disclosed on page 96. 11. Financial assets
2014 2013
£m £m
At 1 April 168.6 177.3
Additions 7.0 3.9
Movement in fair value (13.0) (12.6)
At 31 March 162.6 168.6
Financial assets relate to guaranteed contractual cash flows due under service concession contracts. On 30 May 2006 the Group entered into a Public Private Partnership (PPP) concession agreement with the Northern Ireland Water Service, an executive agency of the Department for Regional Development, to design, build and finance four clean water treatment works around Lough Neagh and to operate and maintain these works over a 25 year period. The authority has subsequently been incorporated as a Government Company and is now referred to as Northern Ireland Water. Under the terms of the contract the Group earns a Unitary Charge from Northern Ireland Water in return for providing the required quantity of water to Northern Ireland Water at each of the specified sites to the specified water quality standards. In addition the Group has a contractual right to charge for use of the assets. The assets designed, built and maintained under the PPP agreement with Northern Ireland Water are contractually required to be novated to Northern Ireland Water at nil cost at the end of the agreement.
Kelda Holdings Limited Notes to the Group financial statements (continued) for the year ended 31 March 2014
112
11. Financial assets (continued) On 22 October 2009, the Group acquired a further 50% shareholding in a joint venture which is party to a Public Private Concession Contract (PPCC) with the Ministry of Defence for water and waste water services covering the areas of Wales and the South West of England for a 25 year period which commenced on 1 December 2003. The contract sets out the obligations of the Group in respect of mandatory works to develop existing infrastructure to specified standards. The existing infrastructure was transferred to the Group at nil cost from contract commencement. Under the terms of the contract the Group earns a Unitary Charge from the Ministry of Defence in return for providing the required quantity of water and water treatment to the Ministry of Defence at each of the specified sites to the specified water quality standards. In addition the Group has a contractual right to charge for use of the assets. The assets novated, improved and maintained under the PPCC with the Ministry of Defence are contractually required to be novated to the Ministry of Defence at nil cost at the end of the agreement. On 23 April 2010, the Group acquired a further 50% shareholding in AES which is party to a PPCC with Scottish Water for water and waste water services covering the area of Aberdeen for a 30 year period which commenced on 1 May 2000. The contract sets out the obligations of the Group in respect of mandatory works to develop existing infrastructure to specified standards. The existing infrastructure was transferred to the Group at nil cost from contract commencement. Under the terms of the contract the Group earns a Unitary Charge from Scottish Water in return for providing the required quantity of water and water treatment to Scottish Water at each of the specified sites to the specified water quality standards. In addition the Group has a contractual right to charge for use of the assets. The assets novated, improved and maintained under the PPCC with Scottish Water are contractually required to be novated to Scottish Water at nil cost at the end of the agreement. The construction and development phase of the contracts disclosed above are deemed to be materially complete and no revenue, profits or losses were recognised during the year on exchanging construction services for a financial asset. In addition, management deem that assets falling within the scope of the contracts are maintained to the standards required by the contract. As such no provision for further construction or maintenance obligations has been recognised in these financial statements.
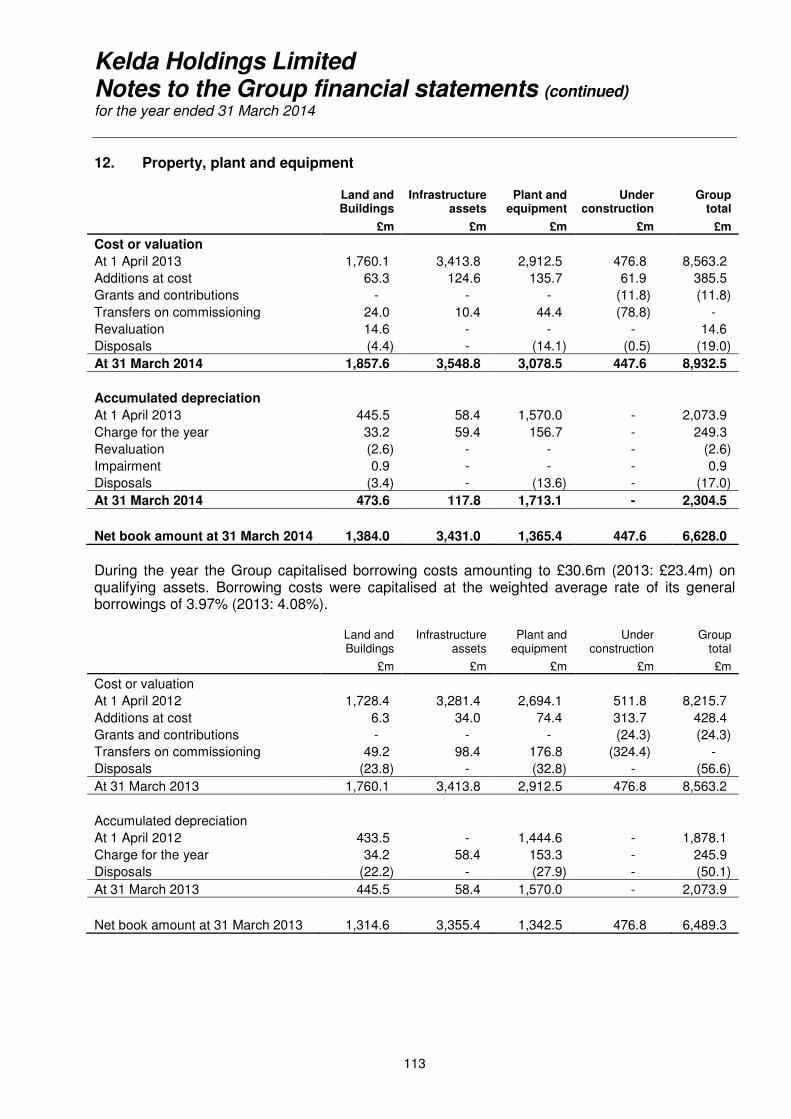
Kelda Holdings Limited Notes to the Group financial statements (continued) for the year ended 31 March 2014
113
12. Property, plant and equipment
Land and Buildings
Infrastructure assets
Plant and equipment
Under construction
Group total
£m £m £m £m £m
Cost or valuation
At 1 April 2013 1,760.1 3,413.8 2,912.5 476.8 8,563.2
Additions at cost 63.3 124.6 135.7 61.9 385.5
Grants and contributions - - - (11.8) (11.8)
Transfers on commissioning 24.0 10.4 44.4 (78.8) -
Revaluation 14.6 - - - 14.6
Disposals (4.4) - (14.1) (0.5) (19.0)
At 31 March 2014 1,857.6 3,548.8 3,078.5 447.6 8,932.5
Accumulated depreciation
At 1 April 2013 445.5 58.4 1,570.0 - 2,073.9
Charge for the year 33.2 59.4 156.7 - 249.3
Revaluation (2.6) - - - (2.6)
Impairment 0.9 - - - 0.9
Disposals (3.4) - (13.6) - (17.0)
At 31 March 2014 473.6 117.8 1,713.1 - 2,304.5
Net book amount at 31 March 2014 1,384.0 3,431.0 1,365.4 447.6 6,628.0
During the year the Group capitalised borrowing costs amounting to £30.6m (2013: £23.4m) on qualifying assets. Borrowing costs were capitalised at the weighted average rate of its general borrowings of 3.97% (2013: 4.08%).
Land and Buildings
Infrastructure assets
Plant and equipment
Under construction
Group total
£m £m £m £m £m
Cost or valuation
At 1 April 2012 1,728.4 3,281.4 2,694.1 511.8 8,215.7
Additions at cost 6.3 34.0 74.4 313.7 428.4
Grants and contributions - - - (24.3) (24.3)
Transfers on commissioning 49.2 98.4 176.8 (324.4) -
Disposals (23.8) - (32.8) - (56.6)
At 31 March 2013 1,760.1 3,413.8 2,912.5 476.8 8,563.2
Accumulated depreciation
At 1 April 2012 433.5 - 1,444.6 - 1,878.1
Charge for the year 34.2 58.4 153.3 - 245.9
Disposals (22.2) - (27.9) - (50.1)
At 31 March 2013 445.5 58.4 1,570.0 - 2,073.9
Net book amount at 31 March 2013 1,314.6 3,355.4 1,342.5 476.8 6,489.3
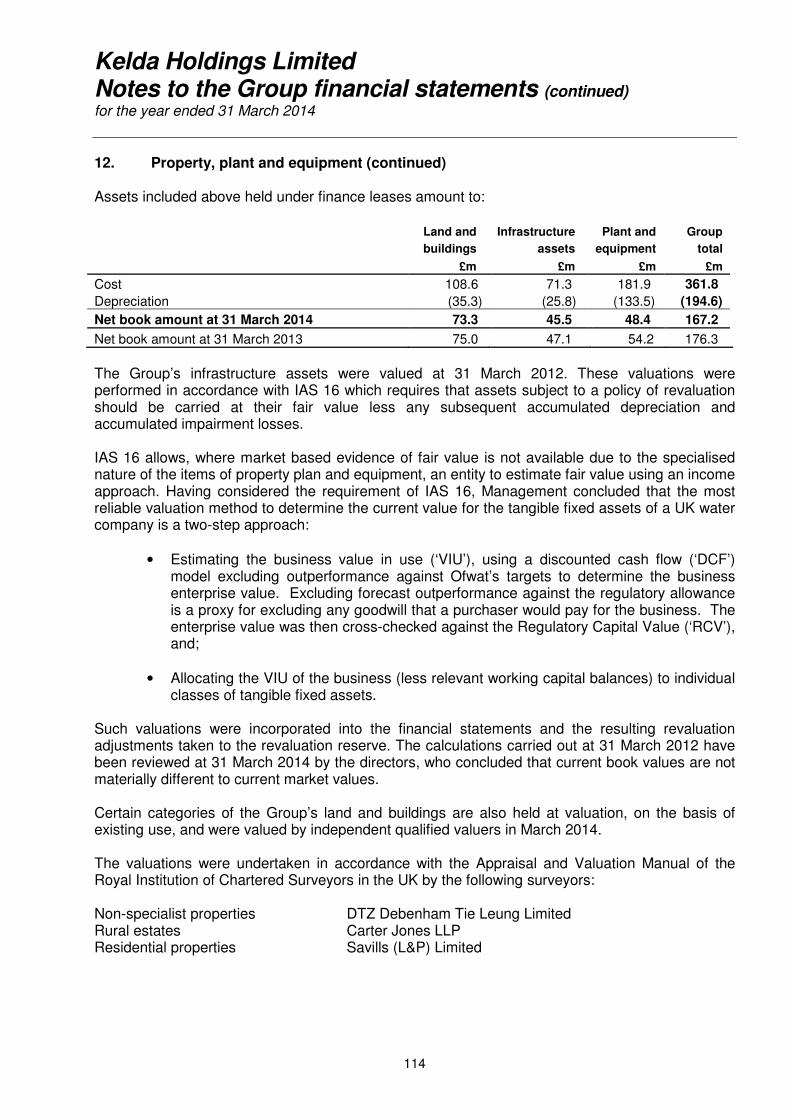
Kelda Holdings Limited Notes to the Group financial statements (continued) for the year ended 31 March 2014
114
12. Property, plant and equipment (continued) Assets included above held under finance leases amount to: Land and Infrastructure Plant and Group
buildings assets equipment total
£m £m £m £m
Cost 108.6 71.3 181.9 361.8
Depreciation (35.3) (25.8) (133.5) (194.6)
Net book amount at 31 March 2014 73.3 45.5 48.4 167.2
Net book amount at 31 March 2013 75.0 47.1 54.2 176.3
The Group’s infrastructure assets were valued at 31 March 2012. These valuations were performed in accordance with IAS 16 which requires that assets subject to a policy of revaluation should be carried at their fair value less any subsequent accumulated depreciation and accumulated impairment losses. IAS 16 allows, where market based evidence of fair value is not available due to the specialised nature of the items of property plan and equipment, an entity to estimate fair value using an income approach. Having considered the requirement of IAS 16, Management concluded that the most reliable valuation method to determine the current value for the tangible fixed assets of a UK water company is a two-step approach:
• Estimating the business value in use (‘VIU’), using a discounted cash flow (‘DCF’) model excluding outperformance against Ofwat’s targets to determine the business enterprise value. Excluding forecast outperformance against the regulatory allowance is a proxy for excluding any goodwill that a purchaser would pay for the business. The enterprise value was then cross-checked against the Regulatory Capital Value (‘RCV’), and;
• Allocating the VIU of the business (less relevant working capital balances) to individual
classes of tangible fixed assets. Such valuations were incorporated into the financial statements and the resulting revaluation adjustments taken to the revaluation reserve. The calculations carried out at 31 March 2012 have been reviewed at 31 March 2014 by the directors, who concluded that current book values are not materially different to current market values. Certain categories of the Group’s land and buildings are also held at valuation, on the basis of existing use, and were valued by independent qualified valuers in March 2014. The valuations were undertaken in accordance with the Appraisal and Valuation Manual of the Royal Institution of Chartered Surveyors in the UK by the following surveyors: Non-specialist properties DTZ Debenham Tie Leung Limited Rural estates Carter Jones LLP Residential properties Savills (L&P) Limited
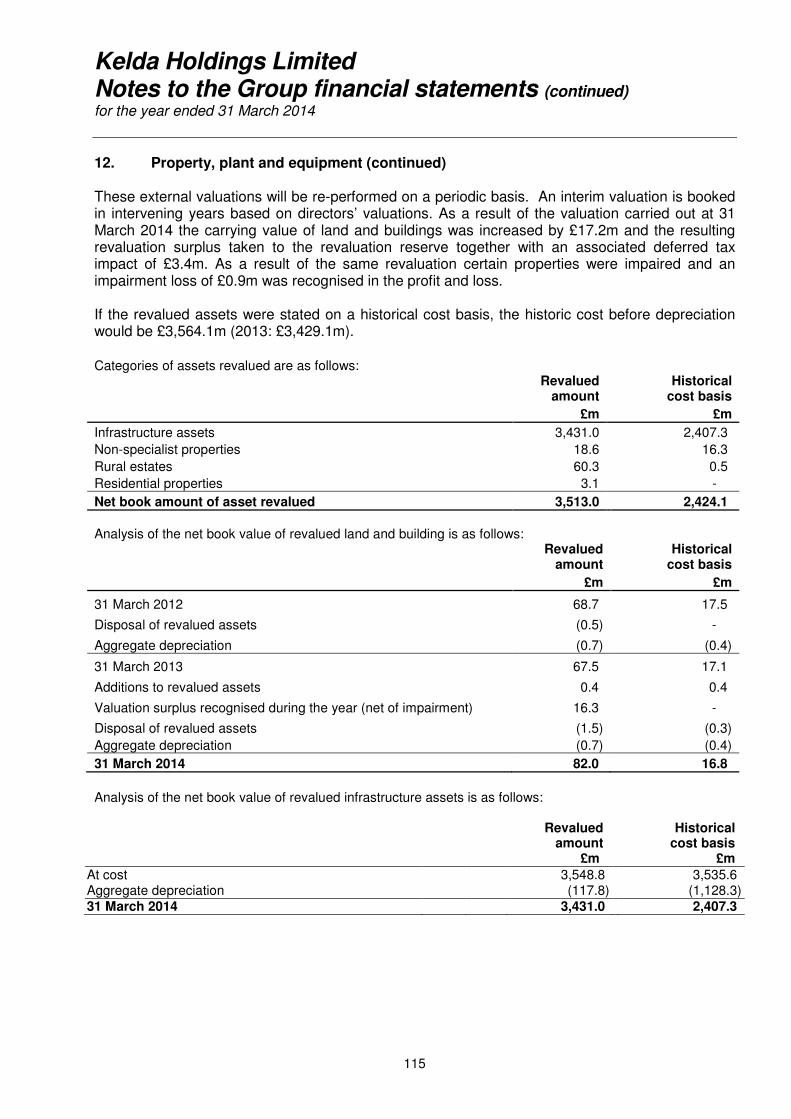
Kelda Holdings Limited Notes to the Group financial statements (continued) for the year ended 31 March 2014
115
12. Property, plant and equipment (continued) These external valuations will be re-performed on a periodic basis. An interim valuation is booked in intervening years based on directors’ valuations. As a result of the valuation carried out at 31 March 2014 the carrying value of land and buildings was increased by £17.2m and the resulting revaluation surplus taken to the revaluation reserve together with an associated deferred tax impact of £3.4m. As a result of the same revaluation certain properties were impaired and an impairment loss of £0.9m was recognised in the profit and loss. If the revalued assets were stated on a historical cost basis, the historic cost before depreciation would be £3,564.1m (2013: £3,429.1m). Categories of assets revalued are as follows:
Revalued
amount Historical
cost basis
£m £m
Infrastructure assets 3,431.0 2,407.3
Non-specialist properties 18.6 16.3
Rural estates 60.3 0.5
Residential properties 3.1 -
Net book amount of asset revalued 3,513.0 2,424.1
Analysis of the net book value of revalued land and building is as follows:
Revalued
amount Historical
cost basis
£m £m
31 March 2012 68.7 17.5
Disposal of revalued assets (0.5) -
Aggregate depreciation (0.7) (0.4)
31 March 2013 67.5 17.1
Additions to revalued assets 0.4 0.4
Valuation surplus recognised during the year (net of impairment) 16.3 -
Disposal of revalued assets (1.5) (0.3)
Aggregate depreciation (0.7) (0.4)
31 March 2014 82.0 16.8
Analysis of the net book value of revalued infrastructure assets is as follows:
Revalued
amount Historical
cost basis £m £m
At cost 3,548.8 3,535.6 Aggregate depreciation (117.8) (1,128.3) 31 March 2014 3,431.0 2,407.3
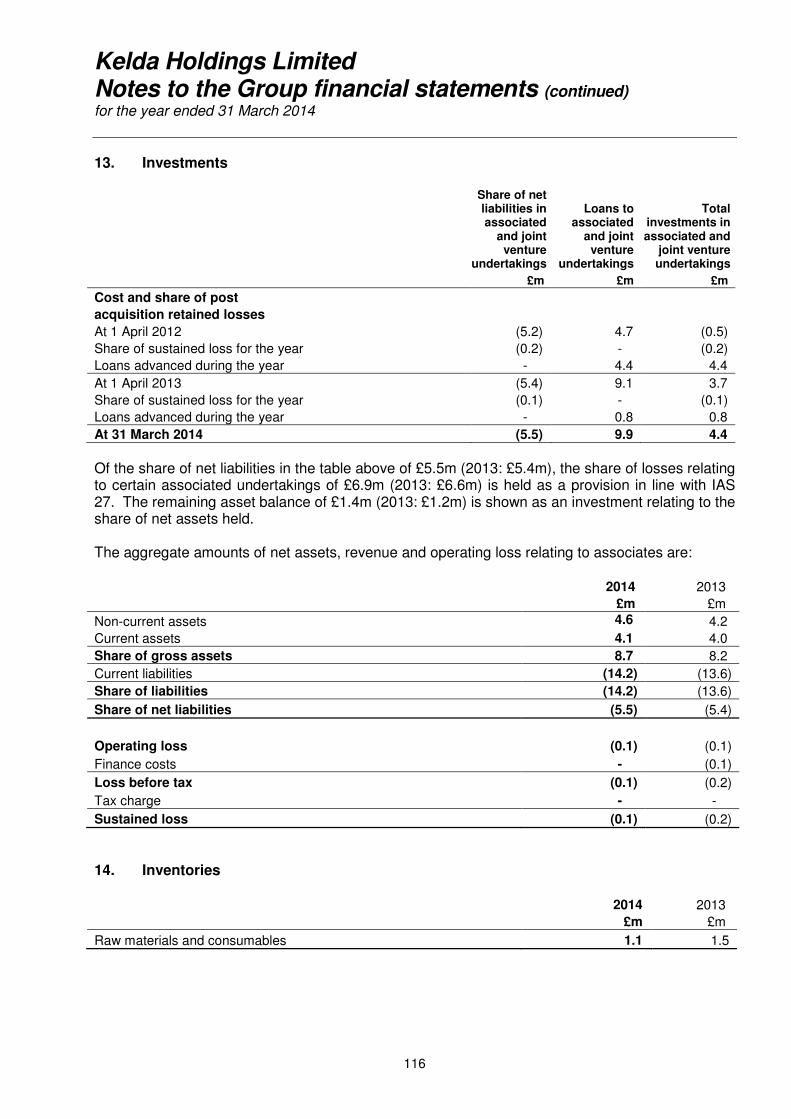
Kelda Holdings Limited Notes to the Group financial statements (continued) for the year ended 31 March 2014
116
13. Investments
Share of net liabilities in associated
and joint venture
undertakings
Loans to associated
and joint venture
undertakings
Total investments in associated and
joint venture undertakings
£m £m £m
Cost and share of post
acquisition retained losses
At 1 April 2012 (5.2) 4.7 (0.5)
Share of sustained loss for the year (0.2) - (0.2)
Loans advanced during the year - 4.4 4.4
At 1 April 2013 (5.4) 9.1 3.7
Share of sustained loss for the year (0.1) - (0.1)
Loans advanced during the year - 0.8 0.8
At 31 March 2014 (5.5) 9.9 4.4
Of the share of net liabilities in the table above of £5.5m (2013: £5.4m), the share of losses relating to certain associated undertakings of £6.9m (2013: £6.6m) is held as a provision in line with IAS 27. The remaining asset balance of £1.4m (2013: £1.2m) is shown as an investment relating to the share of net assets held. The aggregate amounts of net assets, revenue and operating loss relating to associates are:
2014 2013
£m £m
Non-current assets 4.6 4.2
Current assets 4.1 4.0
Share of gross assets 8.7 8.2
Current liabilities (14.2) (13.6)
Share of liabilities (14.2) (13.6)
Share of net liabilities (5.5) (5.4)
Operating loss (0.1) (0.1)
Finance costs - (0.1)
Loss before tax (0.1) (0.2)
Tax charge - -
Sustained loss (0.1) (0.2)
14. Inventories 2014 2013
£m £m
Raw materials and consumables 1.1 1.5
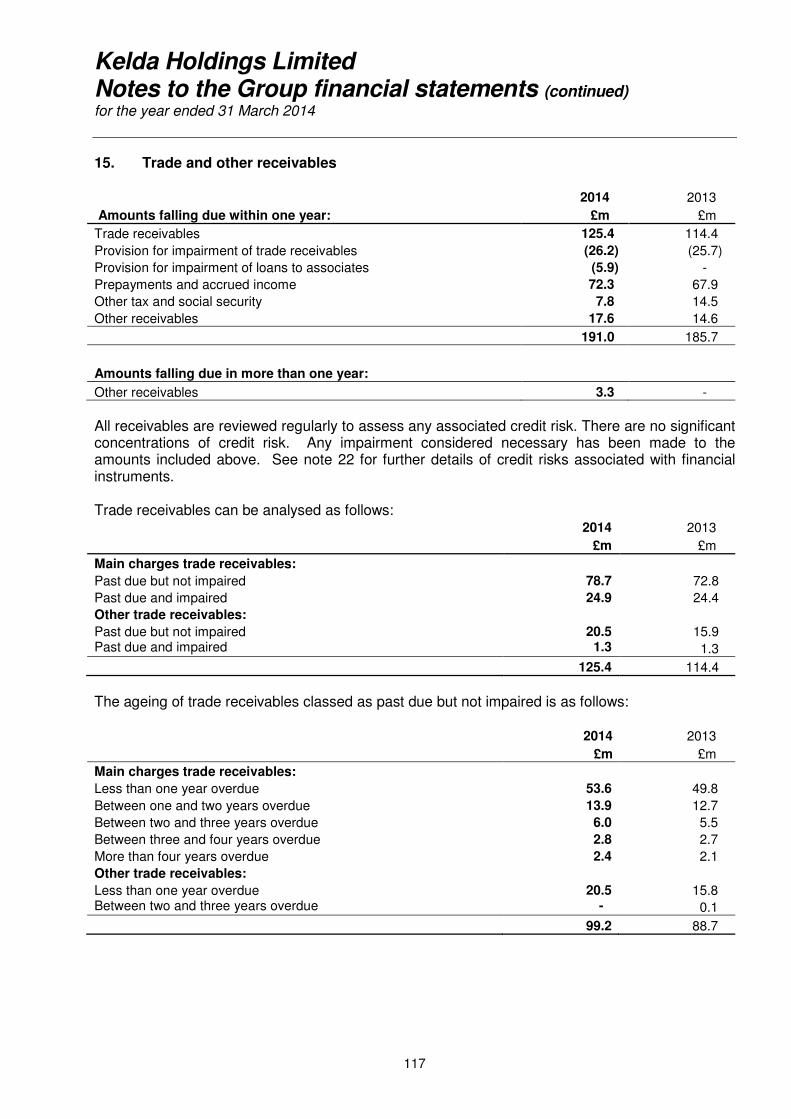
Kelda Holdings Limited Notes to the Group financial statements (continued) for the year ended 31 March 2014
117
15. Trade and other receivables 2014 2013
Amounts falling due within one year: £m £m
Trade receivables 125.4 114.4
Provision for impairment of trade receivables (26.2) (25.7)
Provision for impairment of loans to associates (5.9) -
Prepayments and accrued income 72.3 67.9
Other tax and social security 7.8 14.5
Other receivables 17.6 14.6
191.0 185.7
Amounts falling due in more than one year:
Other receivables 3.3 -
All receivables are reviewed regularly to assess any associated credit risk. There are no significant concentrations of credit risk. Any impairment considered necessary has been made to the amounts included above. See note 22 for further details of credit risks associated with financial instruments. Trade receivables can be analysed as follows: 2014 2013
£m £m
Main charges trade receivables:
Past due but not impaired 78.7 72.8
Past due and impaired 24.9 24.4
Other trade receivables:
Past due but not impaired 20.5 15.9 Past due and impaired 1.3 1.3
125.4 114.4
The ageing of trade receivables classed as past due but not impaired is as follows: 2014 2013
£m £m
Main charges trade receivables:
Less than one year overdue 53.6 49.8
Between one and two years overdue 13.9 12.7
Between two and three years overdue 6.0 5.5
Between three and four years overdue 2.8 2.7
More than four years overdue 2.4 2.1
Other trade receivables:
Less than one year overdue 20.5 15.8 Between two and three years overdue - 0.1
99.2 88.7
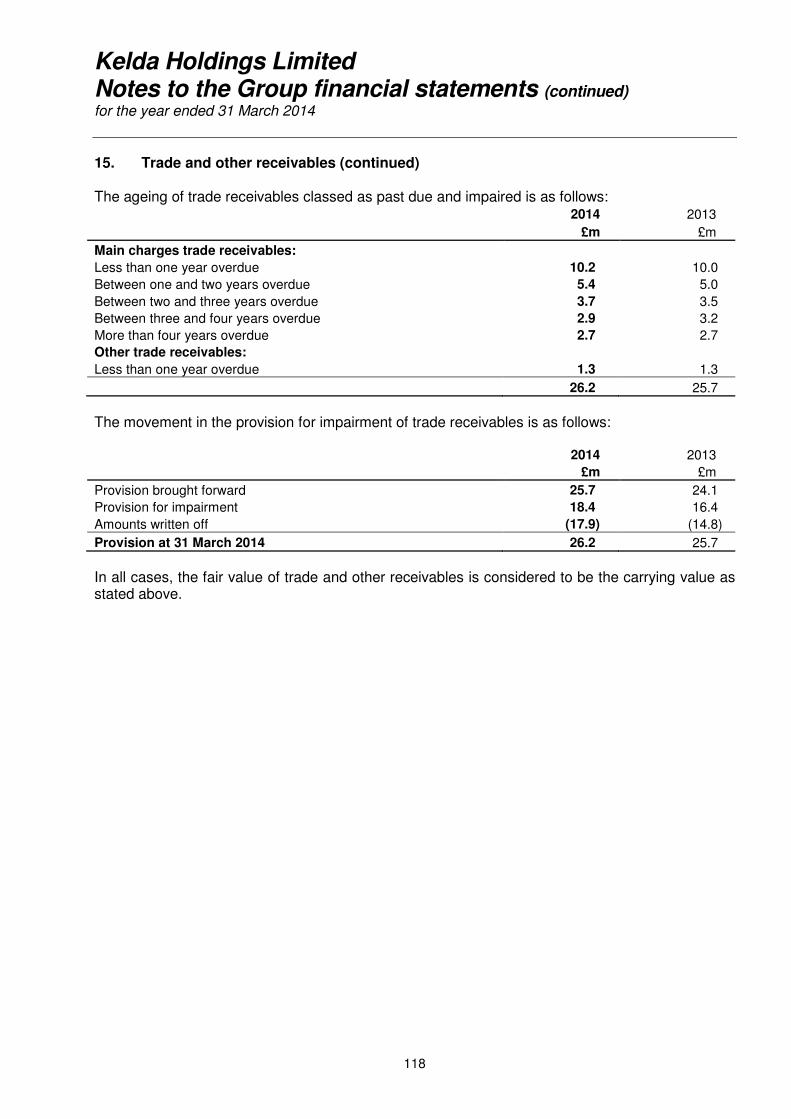
Kelda Holdings Limited Notes to the Group financial statements (continued) for the year ended 31 March 2014
118
15. Trade and other receivables (continued) The ageing of trade receivables classed as past due and impaired is as follows: 2014 2013
£m £m
Main charges trade receivables:
Less than one year overdue 10.2 10.0
Between one and two years overdue 5.4 5.0
Between two and three years overdue 3.7 3.5
Between three and four years overdue 2.9 3.2
More than four years overdue 2.7 2.7
Other trade receivables:
Less than one year overdue 1.3 1.3
26.2 25.7
The movement in the provision for impairment of trade receivables is as follows:
2014 2013
£m £m
Provision brought forward 25.7 24.1
Provision for impairment 18.4 16.4
Amounts written off (17.9) (14.8)
Provision at 31 March 2014 26.2 25.7
In all cases, the fair value of trade and other receivables is considered to be the carrying value as stated above.
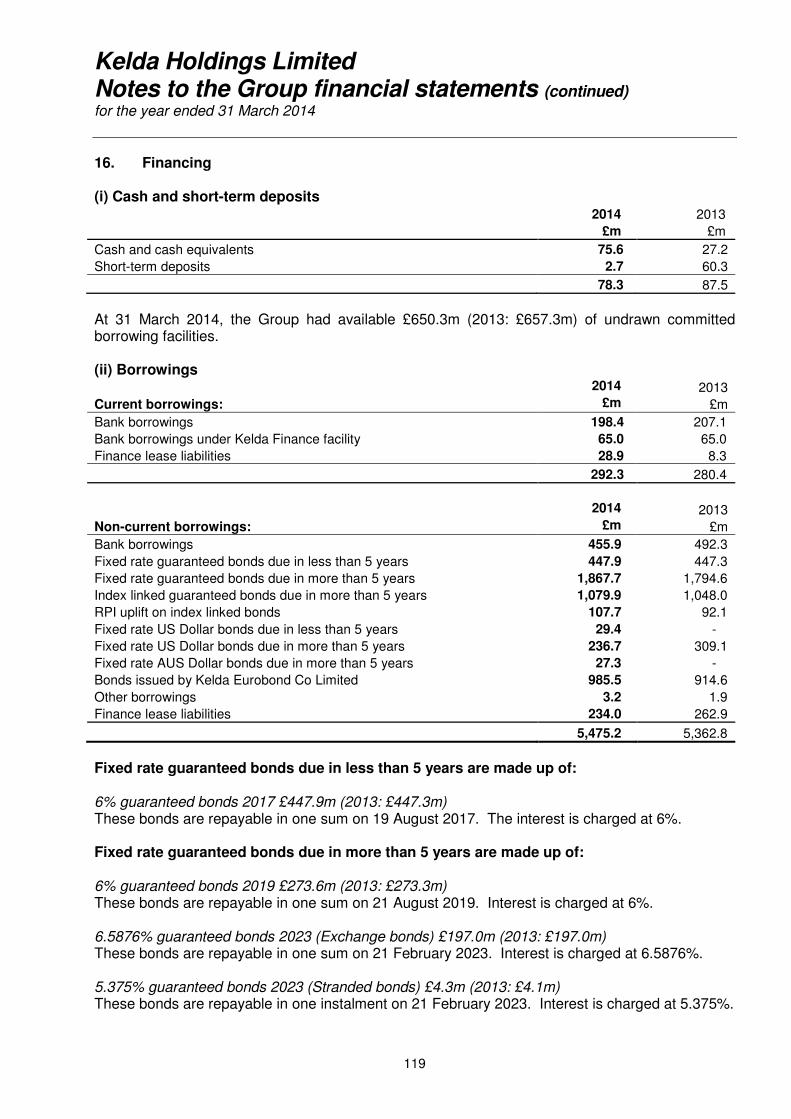
Kelda Holdings Limited Notes to the Group financial statements (continued) for the year ended 31 March 2014
119
16. Financing (i) Cash and short-term deposits 2014 2013
£m £m
Cash and cash equivalents 75.6 27.2
Short-term deposits 2.7 60.3
78.3 87.5
At 31 March 2014, the Group had available £650.3m (2013: £657.3m) of undrawn committed borrowing facilities. (ii) Borrowings
2014 2013
Current borrowings: £m £m
Bank borrowings 198.4 207.1
Bank borrowings under Kelda Finance facility 65.0 65.0
Finance lease liabilities 28.9 8.3
292.3 280.4
2014 2013
Non-current borrowings: £m £m
Bank borrowings 455.9 492.3
Fixed rate guaranteed bonds due in less than 5 years 447.9 447.3
Fixed rate guaranteed bonds due in more than 5 years 1,867.7 1,794.6
Index linked guaranteed bonds due in more than 5 years 1,079.9 1,048.0
RPI uplift on index linked bonds 107.7 92.1
Fixed rate US Dollar bonds due in less than 5 years 29.4 -
Fixed rate US Dollar bonds due in more than 5 years 236.7 309.1
Fixed rate AUS Dollar bonds due in more than 5 years 27.3 -
Bonds issued by Kelda Eurobond Co Limited 985.5 914.6
Other borrowings 3.2 1.9
Finance lease liabilities 234.0 262.9
5,475.2 5,362.8
Fixed rate guaranteed bonds due in less than 5 years are made up of: 6% guaranteed bonds 2017 £447.9m (2013: £447.3m) These bonds are repayable in one sum on 19 August 2017. The interest is charged at 6%. Fixed rate guaranteed bonds due in more than 5 years are made up of: 6% guaranteed bonds 2019 £273.6m (2013: £273.3m) These bonds are repayable in one sum on 21 August 2019. Interest is charged at 6%. 6.5876% guaranteed bonds 2023 (Exchange bonds) £197.0m (2013: £197.0m) These bonds are repayable in one sum on 21 February 2023. Interest is charged at 6.5876%. 5.375% guaranteed bonds 2023 (Stranded bonds) £4.3m (2013: £4.1m) These bonds are repayable in one instalment on 21 February 2023. Interest is charged at 5.375%.
Kelda Holdings Limited Notes to the Group financial statements (continued) for the year ended 31 March 2014
120
16. Financing (continued) 5.5% guaranteed bonds 2027 (Stranded bonds) £6.3m (2013: £6.3m) These bonds are repayable in one instalment on 28 May 2027. Interest is charged at 5.5%. 6.454% guaranteed bonds 2027 (Exchange bonds) £124.6m (2013: £124.6m) These bonds are repayable in one sum on 28 May 2027. Interest is charged at 6.454%. 6.6011% guaranteed bonds 2031 (Exchange bonds) £262.9m (2013: £262.9m) These bonds are repayable in one sum on 17 April 2031. Interest is charged at 6.6011%. 6.625% guaranteed bonds 2031 (Stranded bonds) £0.7m (2013: £0.7m) These bonds are repayable in one sum on 17 April 2031. Interest is charged at 6.625%. 5.5% guaranteed bonds 2037 £182.2m (2013: £182.1m) These bonds are repayable in one instalment on 28 May 2037. Interest is charged at 5.5%. 6.375% guaranteed bonds 2039 £305.3m (2013: £305.7m) These bonds are repayable in one sum on 19 August 2039. The interest is charged at 6.375%. 5.75% guaranteed bonds 2020 £196.7m (2013: £196.2m) These bonds were taken out on 6 February 2013 and are repayable in one sum on 17 February 2020. The interest is charged at 5.75%. 3.625% guaranteed bonds 2029 £227.9m (2013: £241.7m) These bonds were issued on 1 August 2012 are repayable in one instalment on 1 August 2029. The interest is charged at 3.625%. 4.965% Class B guaranteed bonds 2033 £86.2m (2013: £nil) These bonds were issued in May 2013 and are repayable in one instalment on 12 December 2033. The interest is charged at 4.965%. Index linked guaranteed bonds due in more than 5 years are made up of: 3.3066% index linked guaranteed bonds 2033 (Exchange bonds) £166.6m (2013: £163.2m) These bonds are repayable in one instalment on 29 July 2033. The interest is charged at 3.3066% multiplied by an index ratio and the principal amount is increased semi-annually in line with the retail price index. 2.718% index linked guaranteed bonds 2039 £322.2m (2013: £314.5m) These bonds are repayable in one instalment on 30 December 2039. The interest is charged at 2.718% multiplied by an index ratio and the principal amount is increased semi-annually in line with the retail price index. 2.16% % index linked guaranteed bonds 2041 £52.8m (2013: £51.4m) These bonds are repayable in one instalment on 30 December 2041. The interest is charged at 2.16% multiplied by an index ratio and the principal amount is increased semi-annually in line with the retail price index.
Kelda Holdings Limited Notes to the Group financial statements (continued) for the year ended 31 March 2014
121
16. Financing (continued) 1.8225% index linked guaranteed bonds 2050 £67.6m (2013: £65.5m) These bonds are repayable in one instalment on 1 February 2050. The interest is charged at 1.8225% multiplied by an index ratio and the principal amount is increased semi-annually in line with the retail price index. 1.462% index linked guaranteed bonds 2051 £115.4m (2013: £111.1m) These bonds are repayable in one instalment on 1 August 2051. The interest is paid at 1.462% multiplied by an index ratio and the principal amount is increased semi-annually in line with the retail price index. 1.758% index linked guaranteed bonds 2054 £86.1m (2013: £83.3m) These bonds are repayable in one instalment on 1 February 2054. The interest is charged at 1.758% multiplied by an index ratio and the principal amount is increased semi-annually in line with the retail price index. 1.46% index linked guaranteed bonds 2056 £118.0m (2013: £113.7m) These bonds are repayable in one instalment on 1 August 2056. The interest is paid at 1.46% multiplied by an index ratio and the principal amount is increased semi-annually in line with the retail price index. 1.709% index linked guaranteed bonds 2058 £98.8m (2013: £95.5m) These bonds are repayable in one instalment on 1 February 2058. The interest is charged at 1.709% multiplied by an index ratio and the principal amount is increased semi-annually in line with the retail price index. 1.803% index linked guaranteed bonds 2042 £52.4m (2013: £51.0m) These bonds were issued on 22 May 2012 are repayable in one instalment on 22 May 2042. The interest is charged at 1.803% multiplied by an index ratio and the principal amount is increased semi-annually in line with the retail price index. The Group has an early repayment option on all of the above bonds, subject to the agreement of the issuer. Fixed rate US Dollar bonds
During the year ended 31 March 2012 the Group raised $455m of US bonds in tranches with durations of 7, 10, 12 and 15 years, incurring fixed rate interest charges at rates from 3.18% to 5.07%, as follows:
• $30m fixed rate bonds expiring in 2018 carrying fixed rate interest at 3.18%; and • $115m fixed rate bonds expiring in 2021 carrying fixed rate interest at 3.77%.
The above bonds were issued on 13 December 2011.
Kelda Holdings Limited Notes to the Group financial statements (continued) for the year ended 31 March 2014
122
16. Financing (continued)
• $15m fixed rate bonds expiring in 2019 carrying fixed rate interest at 3.18%; • $40m fixed rate bonds expiring in 2022 carrying fixed rate interest at 3.77%; • $75m fixed rate bonds expiring in 2022 carrying fixed rate interest at 5.07%; • $150m fixed rate bonds expiring in 2023 carrying fixed rate interest at 3.87%; and • $30m fixed rate bonds expiring in 2024 carrying fixed rate interest at 3.87%.
The above bonds were issued on 5 January 2012. The Group hedges the fair value of the dollar bonds using a series of combined interest rate and foreign currency swaps that in combination form cross currency interest rate swaps, swapping dollar principal repayments into sterling and fixed rate dollar interest payments into sterling floating rate interest payments (see note 22 for more details). Fixed rate Australian Dollar bonds In May 2013 Yorkshire Water Services Bradford Finance Limited raised AU$50m of Australian dollar fixed rate bonds. These are repayable in one lump sum on 15 August 2023 and attract interest at 5.875%. Bank loans Bank loans within long term borrowings relates to facilities held with European Investment Bank, repayable as £29.0m (1 - 2 years), £109.9m (2 – 5 years) and £167.2m (more than 5 years), and PFI loans relating to service concession contracts repayable as £10.2m (1 – 2 years), £32.8m (2 – 5 years) and £106.8m (more than 5 years). Short and long term bank loans are held in sterling and bear interest at normal commercial rates. The weighted average interest rates associated with the bank loans were 3.001% (2013: 3.315%). Eurobonds issued by Kelda Eurobond Co Limited Eurobonds are repayable 2018. The interest rates are based on a 7.0% margin plus LIBOR. (iii) Finance leases Minimum lease Minimum lease
payments payments
2014 2013
Amounts payable under finance leases: £m £m
No later than 1 year 42.5 11.0
Later than 1 year and no later than 5 years 194.4 228.7
Later than 5 years 131.6 145.5
368.5 385.2
Less: future finance charges on finance lease liabilities (105.6) (114.0)
Present value of lease obligations 262.9 271.2
Amount due for settlement within 12 months 28.9 8.3
Amount due for settlement after 12 months 234.0 262.9
262.9 271.2
All lease obligations are denominated in sterling.

Kelda Holdings Limited Notes to the Group financial statements (continued) for the year ended 31 March 2014
123
16. Financing (continued) The weighted average lease term is 11.0 years (2013: 13.0 years). For the year ended 31 March 2014 the average effective borrowing rate was 1.8% (2013: 2.6%). All leases are on a fixed repayment basis and no arrangements have been entered into for contingent rental payments. 17. Trade and other payables
Amounts falling due within one year: 2014
£m 2013 £m
Trade payables 58.3 60.5
Capital payables 66.4 100.9
Social security and other taxes 2.6 2.8
Receipts in advance 57.2 51.0
Interest payable 111.7 98.4
Deferred income 161.9 148.9
Other payables 34.3 34.4
492.4 496.9
Amounts falling due after more than one year:
Interest payable 42.7 50.8
Other payables 16.2 13.4
58.9 64.2
Trade and other payables principally comprise amounts outstanding for trade purchases and on-going costs. The directors consider that the carrying amount of trade and other payables approximate to their fair value. 18. Provisions for other liabilities and charges £m
At 1 April 2012 23.2
Provision created in relation to losses sustained in associated undertakings 0.1
Utilised in year (1.8)
At 1 April 2013 21.5
Provision created in relation to losses sustained in associated undertakings 0.3
Provision created in relation to dilapidation claims 0.8
Provision created in relation to an onerous contract 0.2
At 31 March 2014 22.8
Provisions include £14.4m (2013: £14.2m) in relation to expected losses from the contract to provide sewerage services to the City of Bridgeport in Connecticut, US. The contract terminated in December 2013. The provision will be utilised as termination costs on the contract are incurred and while the expected future losses are uncertain management do not expect any material difference to the amounts provided.
In addition provisions include £6.9m (2013: £6.6m) in relation to losses relating to certain associated undertakings (note 13) and £0.8m in relation to the expected cost of rectification work at the end of a property lease held by the Group.
Kelda Holdings Limited Notes to the Group financial statements (continued) for the year ended 31 March 2014
124
19. Deferred income tax liabilities Accelerated
capital allowances
Revaluation reserve
Fair value adjustment of infrastructure
assets
Roll-over relief
Financial instruments
Pension obligations
Total
£m £m £m £m £m £m £m
At 1 April 2012 716.7 269.4 39.2 0.8 (324.8) (24.5) 676.8
(Credit)/charge to income statement
(58.0) - 6.1 - (55.2) 8.7 (98.4)
Credit to equity - (16.5) - - (0.5) (20.1) (37.1) At 1 April 2013 (restated)
658.7 252.9 45.3 0.8 (380.5) (35.9) 541.3
Transfer on capitalisation of revaluation reserve
- (252.9) 252.9 - - - -
(Credit)/charge to income statement
(159.5) - 48.1 (0.1) 97.3 (2.4) (16.6)
Charge/(credit) to equity
- 3.4 (39.6) - 3.3 20.2 (12.7)
At 31 March 2014 499.2 3.4 306.7 0.7 (279.9) (18.1) 512.0
The Group has unrecognised capital losses of £17.3m (2013: £17.3m) which are available indefinitely against future eligible capital profits of the Group. No deferred tax asset has been recognised on capital losses as their utilisation is not currently foreseen. 20. Pensions (i) Characteristics of and risks associated with the Group’s schemes The Group sponsors a UK pension scheme, called the Kelda Group Pension Plan (KGPP). This scheme was previously sponsored by Kelda Group Limited (formerly plc) before its acquisition by Saltaire Water Limited. The KGPP has a number of benefit categories providing benefits on a defined benefit basis and a defined contribution basis. The responsibility for the governance of the Group’s defined benefit pension scheme lies with the Pension Trustees. The scheme is managed by a Trustee board (the Trustee) whose role is to ensure that the Scheme is administered in accordance with the Scheme rules and relevant legislation, and to safeguard the assets in the best interests of all members and beneficiaries. The Trustee is solely responsible for setting investment policy and for agreeing funding requirements with the employer through the triennial valuation process. The board of Trustees must be composed of representatives of the Company and plan participants in accordance with the Scheme’s regulations. The majority of members paid contributions over the year ended 31 March 2014 at rates of 5%, 6%, 7%, or 8.5% of pensionable pay (depending on benefit category). The majority of members pay contributions through a salary sacrifice arrangement. The Group contributed 14.6% of pensionable pay. The Group also paid lump sum deficit contributions of £1m per month in the year to 31 March 2014. An accrual for unfunded benefits of £7.4m has been included in the Group's financial statements at 31 March 2014 (2013: £7.2m).
Kelda Holdings Limited Notes to the Group financial statements (continued) for the year ended 31 March 2014
125
20. Pensions (continued) Risk exposure of the defined benefit scheme Whilst the Group is not exposed to any unusual, entity specific or scheme specific risks in its defined benefit pension scheme, it is exposed to a number of significant risks, detailed below: Inflation rate risk: KGPP has entered into an inflation mechanism with the Group. This has been entered into as part of a de-risking mandate agreed with the Pension Trustee and is aimed at reducing the volatility in future funding and contributions. The swap mechanism is based upon a long-term fixed inflation assumption for the scheme valuation of 2.8% per annum. In periods when actual inflation is higher than 2.8%, the Group will make additional contributions (smoothed over a five-year period) in respect of the increased liabilities caused by higher inflation. Given the principal subsidiary of the Group, Yorkshire Water Services Limited, has a natural hedge against inflation as its revenue and debt are linked to RPI, management believes that this is an appropriate structure to have put in place. Whilst this reduces the pension scheme funding risk and therefore the actuarial valuation of the scheme, it should be noted that it will not necessarily have a similar impact on the IAS 19 valuation. IAS 19 assumptions are based upon current market expectations and will remain subject to market related inflation rates at future reporting dates. It should therefore be noted that any disclosed IAS 19 material increases to market related inflation expectations will continue to negatively impact the disclosed IAS 19 basis position. Interest rate risk: The defined benefit obligation is determined using a discount rate derived from yields on high quality corporate bonds. A decrease in corporate bond yields will increase plan liabilities although this will be partially offset by an increase in the value of bond holdings. Longevity risk: The majority of the scheme’s obligations are to provide benefits for the life of the members so increases in life expectancy will result in an increase in the plan’s liabilities. Investment risk: Scheme assets are invested in a diversified portfolio of debt securities, equities and other return-seeking assets. If the assets underperform the discount rate used to calculate the defined benefit obligation, it will reduce the surplus or increase the deficit. Volatility in asset values and the discount rate will lead to volatility in the net pension liability on the Group’s balance sheet and in other comprehensive income. To a lesser extent this will also lead to volatility in the pension expense in the Group’s income statement. The ultimate cost of the defined benefit obligations to the Group will depend upon actual future events rather than the assumptions made. The assumptions made are unlikely to be borne out in practice and as such the cost may be higher or lower than expected.
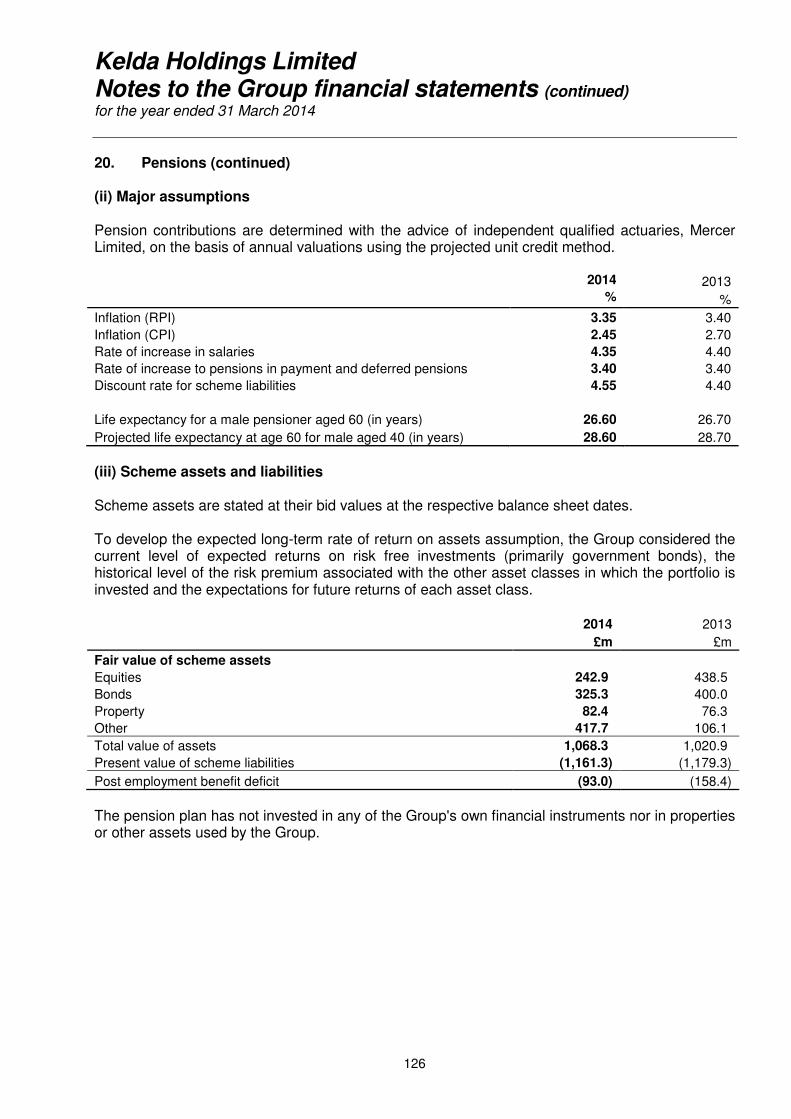
Kelda Holdings Limited Notes to the Group financial statements (continued) for the year ended 31 March 2014
126
20. Pensions (continued) (ii) Major assumptions Pension contributions are determined with the advice of independent qualified actuaries, Mercer Limited, on the basis of annual valuations using the projected unit credit method. 2014 2013
% %
Inflation (RPI) 3.35 3.40
Inflation (CPI) 2.45 2.70
Rate of increase in salaries 4.35 4.40
Rate of increase to pensions in payment and deferred pensions 3.40 3.40
Discount rate for scheme liabilities 4.55 4.40
Life expectancy for a male pensioner aged 60 (in years) 26.60 26.70
Projected life expectancy at age 60 for male aged 40 (in years) 28.60 28.70
(iii) Scheme assets and liabilities
Scheme assets are stated at their bid values at the respective balance sheet dates. To develop the expected long-term rate of return on assets assumption, the Group considered the current level of expected returns on risk free investments (primarily government bonds), the historical level of the risk premium associated with the other asset classes in which the portfolio is invested and the expectations for future returns of each asset class.
2014 2013
£m £m
Fair value of scheme assets
Equities 242.9 438.5
Bonds 325.3 400.0
Property 82.4 76.3
Other 417.7 106.1
Total value of assets 1,068.3 1,020.9
Present value of scheme liabilities (1,161.3) (1,179.3)
Post employment benefit deficit (93.0) (158.4)
The pension plan has not invested in any of the Group's own financial instruments nor in properties or other assets used by the Group.
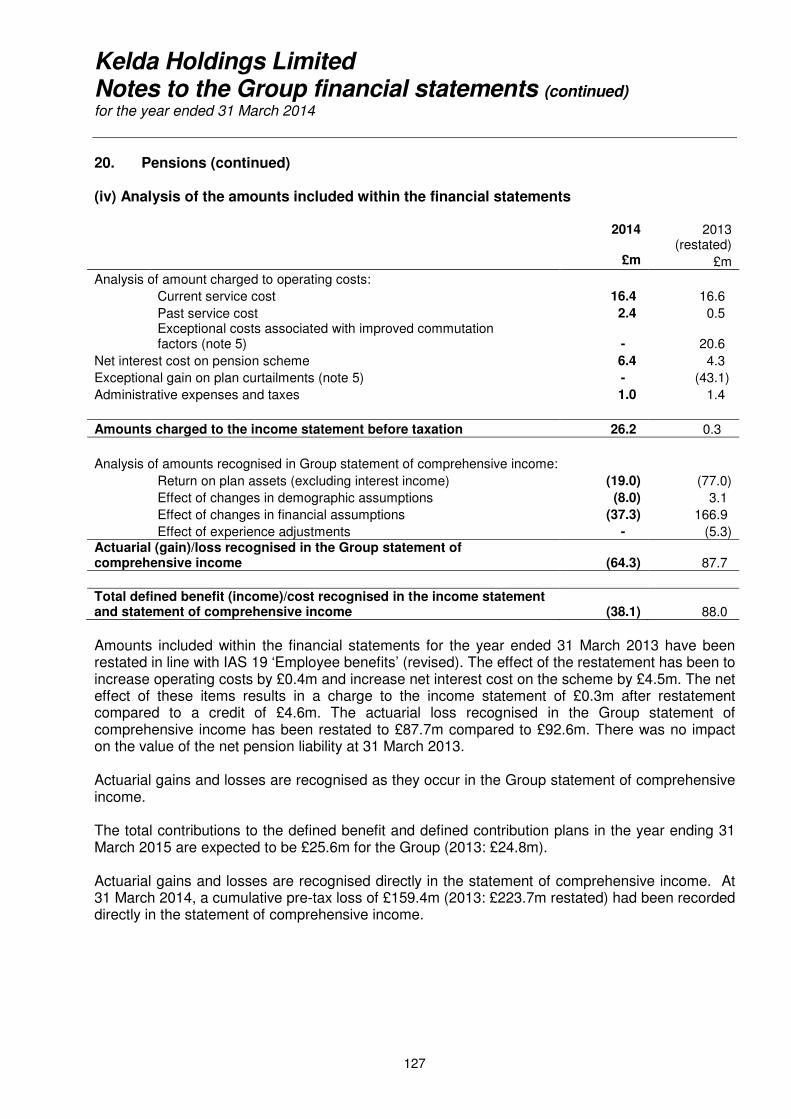
Kelda Holdings Limited Notes to the Group financial statements (continued) for the year ended 31 March 2014
127
20. Pensions (continued) (iv) Analysis of the amounts included within the financial statements
2014 2013
(restated)
£m £m
Analysis of amount charged to operating costs:
Current service cost 16.4 16.6
Past service cost 2.4 0.5
Exceptional costs associated with improved commutation factors (note 5) - 20.6
Net interest cost on pension scheme 6.4 4.3
Exceptional gain on plan curtailments (note 5) - (43.1)
Administrative expenses and taxes 1.0 1.4
Amounts charged to the income statement before taxation 26.2 0.3
Analysis of amounts recognised in Group statement of comprehensive income:
Return on plan assets (excluding interest income) (19.0) (77.0)
Effect of changes in demographic assumptions (8.0) 3.1
Effect of changes in financial assumptions (37.3) 166.9
Effect of experience adjustments - (5.3) Actuarial (gain)/loss recognised in the Group statement of comprehensive income (64.3) 87.7
Total defined benefit (income)/cost recognised in the income statement and statement of comprehensive income (38.1) 88.0
Amounts included within the financial statements for the year ended 31 March 2013 have been restated in line with IAS 19 ‘Employee benefits’ (revised). The effect of the restatement has been to increase operating costs by £0.4m and increase net interest cost on the scheme by £4.5m. The net effect of these items results in a charge to the income statement of £0.3m after restatement compared to a credit of £4.6m. The actuarial loss recognised in the Group statement of comprehensive income has been restated to £87.7m compared to £92.6m. There was no impact on the value of the net pension liability at 31 March 2013. Actuarial gains and losses are recognised as they occur in the Group statement of comprehensive income. The total contributions to the defined benefit and defined contribution plans in the year ending 31 March 2015 are expected to be £25.6m for the Group (2013: £24.8m). Actuarial gains and losses are recognised directly in the statement of comprehensive income. At 31 March 2014, a cumulative pre-tax loss of £159.4m (2013: £223.7m restated) had been recorded directly in the statement of comprehensive income.
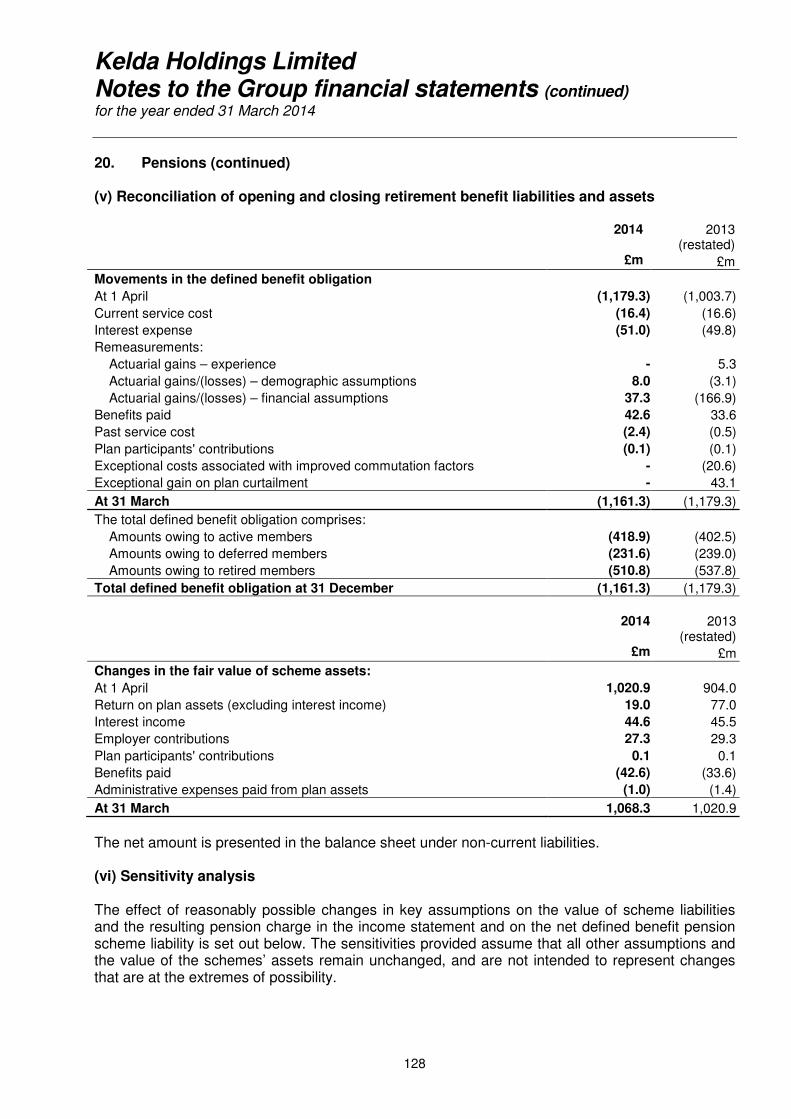
Kelda Holdings Limited Notes to the Group financial statements (continued) for the year ended 31 March 2014
128
20. Pensions (continued) (v) Reconciliation of opening and closing retirement benefit liabilities and assets
2014 2013
(restated)
£m £m
Movements in the defined benefit obligation
At 1 April (1,179.3) (1,003.7)
Current service cost (16.4) (16.6)
Interest expense (51.0) (49.8)
Remeasurements:
Actuarial gains – experience - 5.3
Actuarial gains/(losses) – demographic assumptions 8.0 (3.1)
Actuarial gains/(losses) – financial assumptions 37.3 (166.9)
Benefits paid 42.6 33.6
Past service cost (2.4) (0.5)
Plan participants' contributions (0.1) (0.1)
Exceptional costs associated with improved commutation factors - (20.6)
Exceptional gain on plan curtailment - 43.1
At 31 March (1,161.3) (1,179.3)
The total defined benefit obligation comprises:
Amounts owing to active members (418.9) (402.5)
Amounts owing to deferred members (231.6) (239.0)
Amounts owing to retired members (510.8) (537.8)
Total defined benefit obligation at 31 December (1,161.3) (1,179.3)
2014 2013
(restated)
£m £m
Changes in the fair value of scheme assets:
At 1 April 1,020.9 904.0
Return on plan assets (excluding interest income) 19.0 77.0
Interest income 44.6 45.5
Employer contributions 27.3 29.3
Plan participants' contributions 0.1 0.1
Benefits paid (42.6) (33.6)
Administrative expenses paid from plan assets (1.0) (1.4)
At 31 March 1,068.3 1,020.9
The net amount is presented in the balance sheet under non-current liabilities. (vi) Sensitivity analysis The effect of reasonably possible changes in key assumptions on the value of scheme liabilities and the resulting pension charge in the income statement and on the net defined benefit pension scheme liability is set out below. The sensitivities provided assume that all other assumptions and the value of the schemes’ assets remain unchanged, and are not intended to represent changes that are at the extremes of possibility.
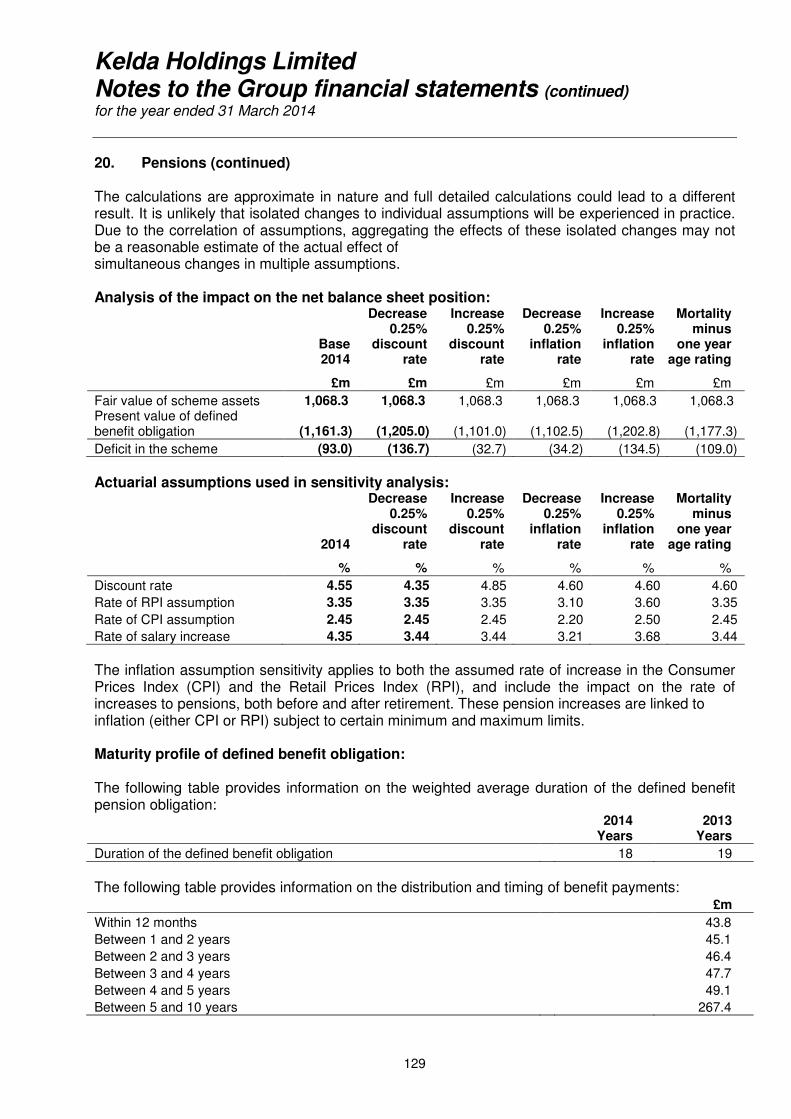
Kelda Holdings Limited Notes to the Group financial statements (continued) for the year ended 31 March 2014
129
20. Pensions (continued) The calculations are approximate in nature and full detailed calculations could lead to a different result. It is unlikely that isolated changes to individual assumptions will be experienced in practice. Due to the correlation of assumptions, aggregating the effects of these isolated changes may not be a reasonable estimate of the actual effect of simultaneous changes in multiple assumptions. Analysis of the impact on the net balance sheet position:
Base 2014
Decrease0.25%
discount rate
Increase 0.25%
discount rate
Decrease 0.25%
inflation rate
Increase 0.25%
inflation rate
Mortality minus
one year age rating
£m £m £m £m £m £m
Fair value of scheme assets 1,068.3 1,068.3 1,068.3 1,068.3 1,068.3 1,068.3 Present value of defined benefit obligation (1,161.3) (1,205.0) (1,101.0) (1,102.5) (1,202.8) (1,177.3)
Deficit in the scheme (93.0) (136.7) (32.7) (34.2) (134.5) (109.0)
Actuarial assumptions used in sensitivity analysis:
2014
Decrease 0.25%
discount rate
Increase 0.25%
discount rate
Decrease 0.25%
inflation rate
Increase 0.25%
inflation rate
Mortality minus
one year age rating
% % % % % %
Discount rate 4.55 4.35 4.85 4.60 4.60 4.60
Rate of RPI assumption 3.35 3.35 3.35 3.10 3.60 3.35
Rate of CPI assumption 2.45 2.45 2.45 2.20 2.50 2.45
Rate of salary increase 4.35 3.44 3.44 3.21 3.68 3.44
The inflation assumption sensitivity applies to both the assumed rate of increase in the Consumer Prices Index (CPI) and the Retail Prices Index (RPI), and include the impact on the rate of increases to pensions, both before and after retirement. These pension increases are linked to inflation (either CPI or RPI) subject to certain minimum and maximum limits. Maturity profile of defined benefit obligation: The following table provides information on the weighted average duration of the defined benefit pension obligation:
2014
Years 2013
Years
Duration of the defined benefit obligation 18 19
The following table provides information on the distribution and timing of benefit payments:
£m
Within 12 months 43.8
Between 1 and 2 years 45.1
Between 2 and 3 years 46.4
Between 3 and 4 years 47.7
Between 4 and 5 years 49.1
Between 5 and 10 years 267.4
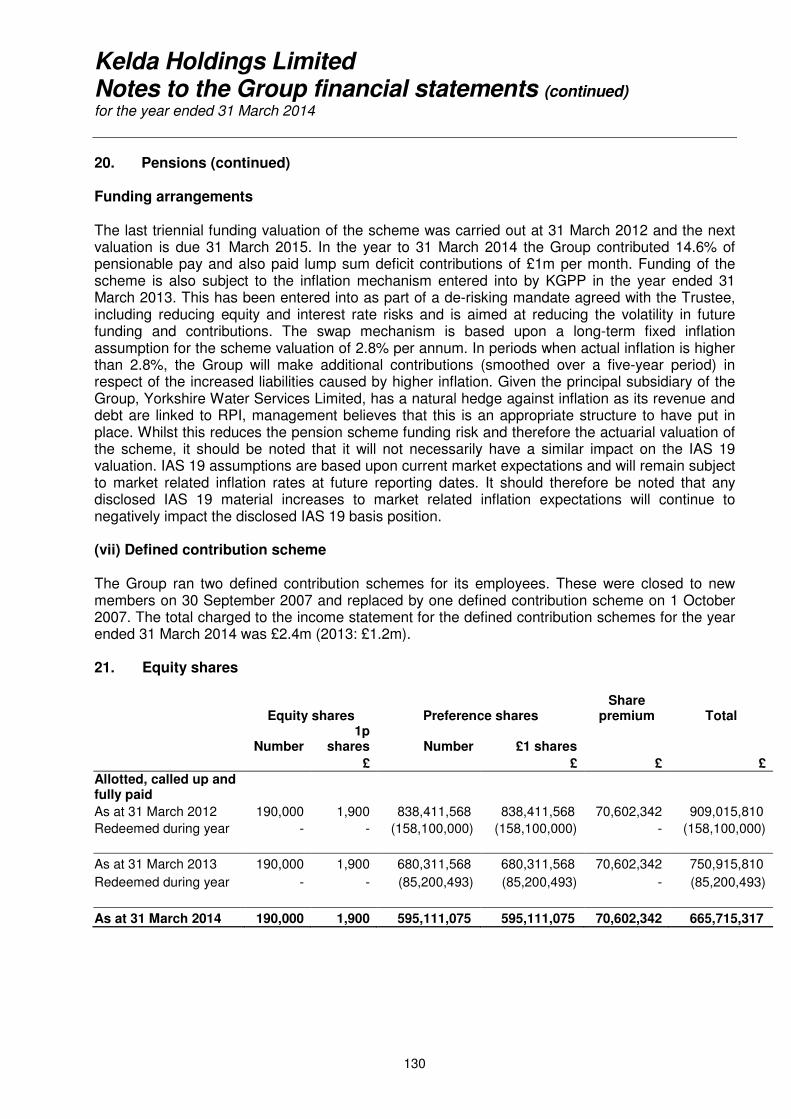
Kelda Holdings Limited Notes to the Group financial statements (continued) for the year ended 31 March 2014
130
20. Pensions (continued) Funding arrangements The last triennial funding valuation of the scheme was carried out at 31 March 2012 and the next valuation is due 31 March 2015. In the year to 31 March 2014 the Group contributed 14.6% of pensionable pay and also paid lump sum deficit contributions of £1m per month. Funding of the scheme is also subject to the inflation mechanism entered into by KGPP in the year ended 31 March 2013. This has been entered into as part of a de-risking mandate agreed with the Trustee, including reducing equity and interest rate risks and is aimed at reducing the volatility in future funding and contributions. The swap mechanism is based upon a long-term fixed inflation assumption for the scheme valuation of 2.8% per annum. In periods when actual inflation is higher than 2.8%, the Group will make additional contributions (smoothed over a five-year period) in respect of the increased liabilities caused by higher inflation. Given the principal subsidiary of the Group, Yorkshire Water Services Limited, has a natural hedge against inflation as its revenue and debt are linked to RPI, management believes that this is an appropriate structure to have put in place. Whilst this reduces the pension scheme funding risk and therefore the actuarial valuation of the scheme, it should be noted that it will not necessarily have a similar impact on the IAS 19 valuation. IAS 19 assumptions are based upon current market expectations and will remain subject to market related inflation rates at future reporting dates. It should therefore be noted that any disclosed IAS 19 material increases to market related inflation expectations will continue to negatively impact the disclosed IAS 19 basis position. (vii) Defined contribution scheme The Group ran two defined contribution schemes for its employees. These were closed to new members on 30 September 2007 and replaced by one defined contribution scheme on 1 October 2007. The total charged to the income statement for the defined contribution schemes for the year ended 31 March 2014 was £2.4m (2013: £1.2m). 21. Equity shares
Equity shares Preference shares Share
premium Total
Number 1p
shares Number £1 shares
£ £ £ £
Allotted, called up and fully paid
As at 31 March 2012 190,000 1,900 838,411,568 838,411,568 70,602,342 909,015,810
Redeemed during year - - (158,100,000) (158,100,000) - (158,100,000)
As at 31 March 2013 190,000 1,900 680,311,568 680,311,568 70,602,342 750,915,810
Redeemed during year - - (85,200,493) (85,200,493) - (85,200,493)
As at 31 March 2014 190,000 1,900 595,111,075 595,111,075 70,602,342 665,715,317
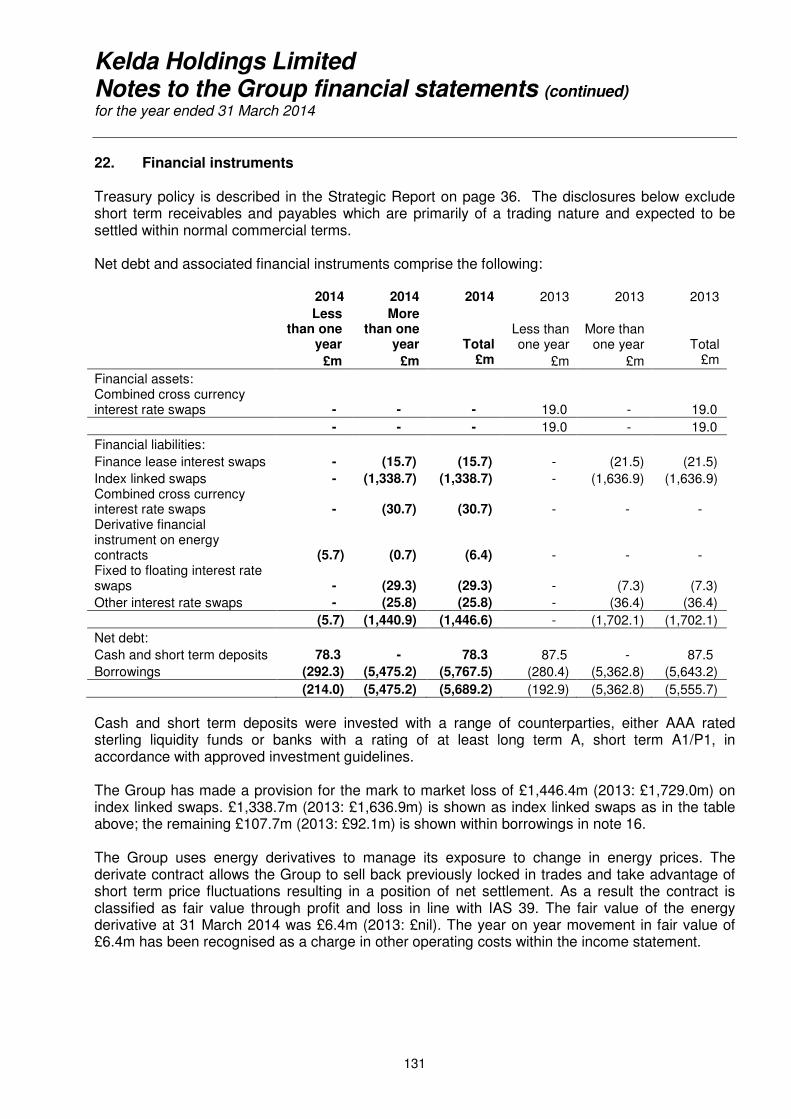
Kelda Holdings Limited Notes to the Group financial statements (continued) for the year ended 31 March 2014
131
22. Financial instruments Treasury policy is described in the Strategic Report on page 36. The disclosures below exclude short term receivables and payables which are primarily of a trading nature and expected to be settled within normal commercial terms. Net debt and associated financial instruments comprise the following: 2014 2014 2014 2013 2013 2013
Less than one
year
More than one
year Total Less than one year
More than one year Total
£m £m £m £m £m £m
Financial assets:
Combined cross currency interest rate swaps
-
-
- 19.0 -
19.0
- - - 19.0 - 19.0
Financial liabilities:
Finance lease interest swaps - (15.7) (15.7) - (21.5) (21.5)
Index linked swaps - (1,338.7) (1,338.7) - (1,636.9) (1,636.9) Combined cross currency interest rate swaps - (30.7) (30.7) - - - Derivative financial instrument on energy contracts (5.7) (0.7) (6.4) - - - Fixed to floating interest rate swaps - (29.3) (29.3) - (7.3) (7.3)
Other interest rate swaps - (25.8) (25.8) - (36.4) (36.4)
(5.7) (1,440.9) (1,446.6) - (1,702.1) (1,702.1)
Net debt:
Cash and short term deposits 78.3 - 78.3 87.5 - 87.5
Borrowings (292.3) (5,475.2) (5,767.5) (280.4) (5,362.8) (5,643.2)
(214.0) (5,475.2) (5,689.2) (192.9) (5,362.8) (5,555.7)
Cash and short term deposits were invested with a range of counterparties, either AAA rated sterling liquidity funds or banks with a rating of at least long term A, short term A1/P1, in accordance with approved investment guidelines. The Group has made a provision for the mark to market loss of £1,446.4m (2013: £1,729.0m) on index linked swaps. £1,338.7m (2013: £1,636.9m) is shown as index linked swaps as in the table above; the remaining £107.7m (2013: £92.1m) is shown within borrowings in note 16. The Group uses energy derivatives to manage its exposure to change in energy prices. The derivate contract allows the Group to sell back previously locked in trades and take advantage of short term price fluctuations resulting in a position of net settlement. As a result the contract is classified as fair value through profit and loss in line with IAS 39. The fair value of the energy derivative at 31 March 2014 was £6.4m (2013: £nil). The year on year movement in fair value of £6.4m has been recognised as a charge in other operating costs within the income statement.
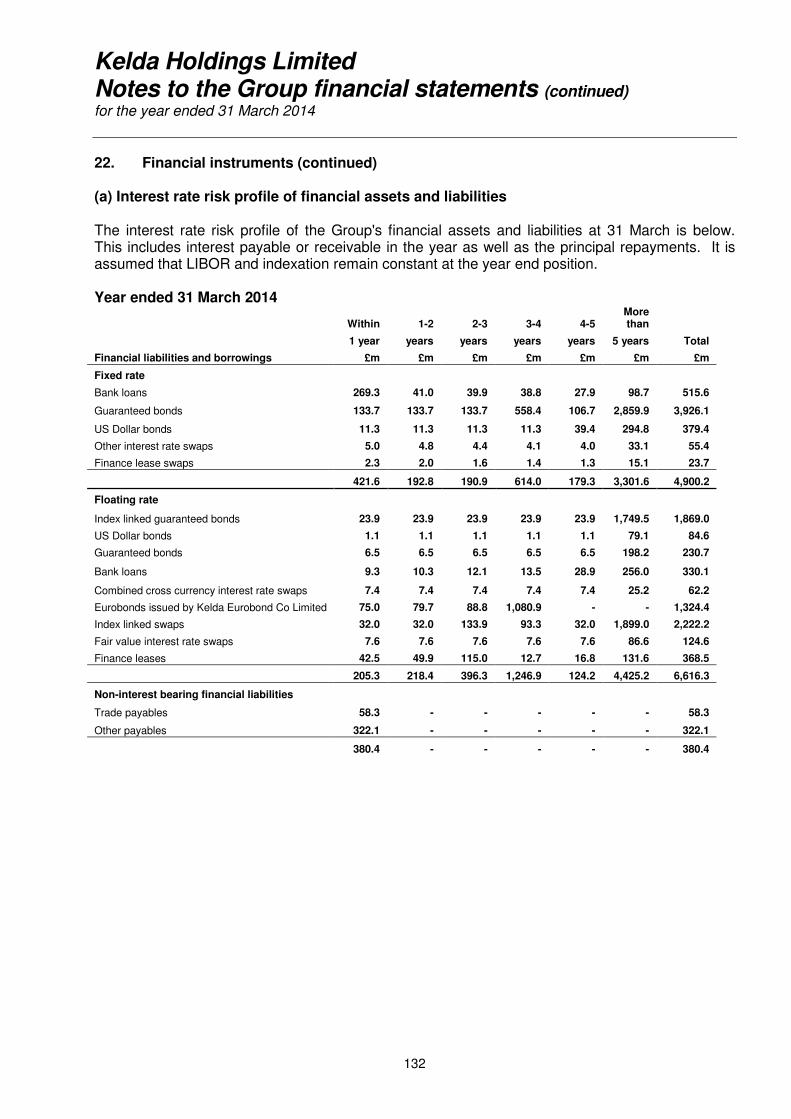
Kelda Holdings Limited Notes to the Group financial statements (continued) for the year ended 31 March 2014
132
22. Financial instruments (continued) (a) Interest rate risk profile of financial assets and liabilities The interest rate risk profile of the Group's financial assets and liabilities at 31 March is below. This includes interest payable or receivable in the year as well as the principal repayments. It is assumed that LIBOR and indexation remain constant at the year end position. Year ended 31 March 2014
Within 1-2 2-3 3-4 4-5 More than
1 year years years years years 5 years Total
Financial liabilities and borrowings £m £m £m £m £m £m £m
Fixed rate
Bank loans 269.3 41.0 39.9 38.8 27.9 98.7 515.6
Guaranteed bonds 133.7 133.7 133.7 558.4 106.7 2,859.9 3,926.1
US Dollar bonds 11.3 11.3 11.3 11.3 39.4 294.8 379.4
Other interest rate swaps 5.0 4.8 4.4 4.1 4.0 33.1 55.4
Finance lease swaps 2.3 2.0 1.6 1.4 1.3 15.1 23.7
421.6 192.8 190.9 614.0 179.3 3,301.6 4,900.2
Floating rate
Index linked guaranteed bonds 23.9 23.9 23.9 23.9 23.9 1,749.5 1,869.0
US Dollar bonds 1.1 1.1 1.1 1.1 1.1 79.1 84.6
Guaranteed bonds 6.5 6.5 6.5 6.5 6.5 198.2 230.7
Bank loans 9.3 10.3 12.1 13.5 28.9 256.0 330.1
Combined cross currency interest rate swaps 7.4 7.4 7.4 7.4 7.4 25.2 62.2
Eurobonds issued by Kelda Eurobond Co Limited 75.0 79.7 88.8 1,080.9 - - 1,324.4
Index linked swaps 32.0 32.0 133.9 93.3 32.0 1,899.0 2,222.2
Fair value interest rate swaps 7.6 7.6 7.6 7.6 7.6 86.6 124.6
Finance leases 42.5 49.9 115.0 12.7 16.8 131.6 368.5
205.3 218.4 396.3 1,246.9 124.2 4,425.2 6,616.3
Non-interest bearing financial liabilities
Trade payables 58.3 - - - - - 58.3
Other payables 322.1 - - - - - 322.1
380.4 - - - - - 380.4
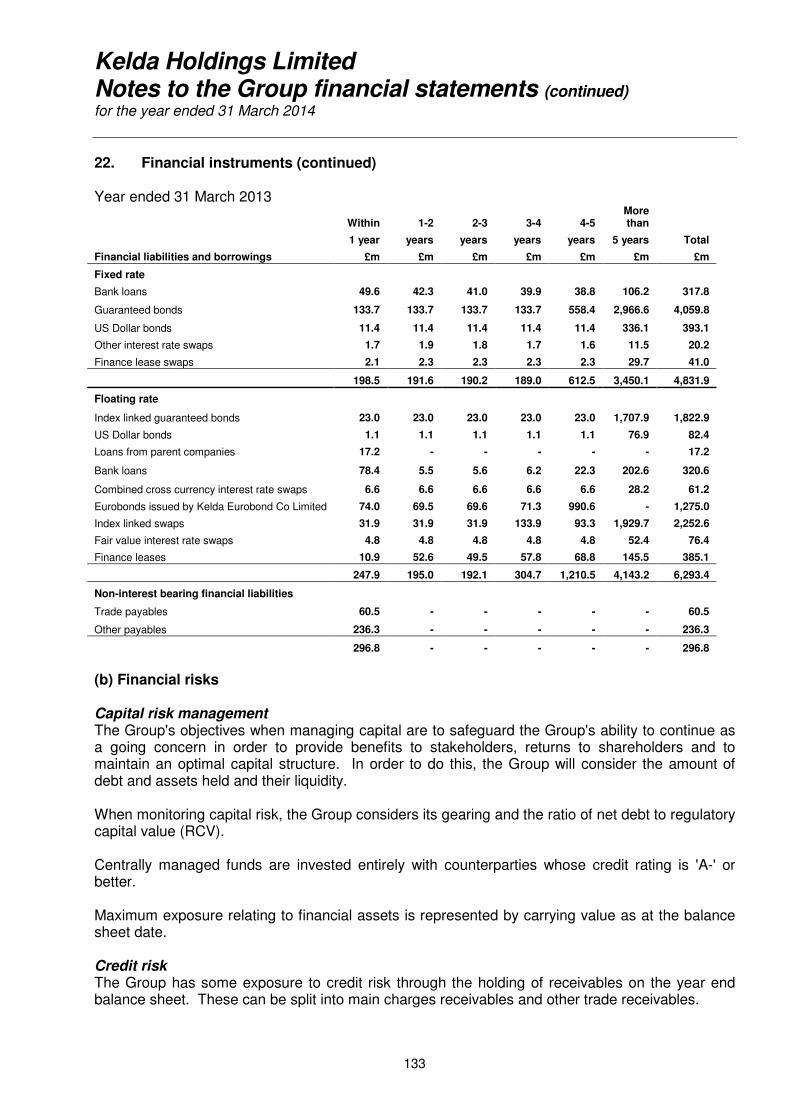
Kelda Holdings Limited Notes to the Group financial statements (continued) for the year ended 31 March 2014
133
22. Financial instruments (continued) Year ended 31 March 2013
Within 1-2 2-3 3-4 4-5 More than
1 year years years years years 5 years Total
Financial liabilities and borrowings £m £m £m £m £m £m £m
Fixed rate
Bank loans 49.6 42.3 41.0 39.9 38.8 106.2 317.8
Guaranteed bonds 133.7 133.7 133.7 133.7 558.4 2,966.6 4,059.8
US Dollar bonds 11.4 11.4 11.4 11.4 11.4 336.1 393.1
Other interest rate swaps 1.7 1.9 1.8 1.7 1.6 11.5 20.2
Finance lease swaps 2.1 2.3 2.3 2.3 2.3 29.7 41.0
198.5 191.6 190.2 189.0 612.5 3,450.1 4,831.9
Floating rate
Index linked guaranteed bonds 23.0 23.0 23.0 23.0 23.0 1,707.9 1,822.9
US Dollar bonds 1.1 1.1 1.1 1.1 1.1 76.9 82.4
Loans from parent companies 17.2 - - - - - 17.2
Bank loans 78.4 5.5 5.6 6.2 22.3 202.6 320.6
Combined cross currency interest rate swaps 6.6 6.6 6.6 6.6 6.6 28.2 61.2
Eurobonds issued by Kelda Eurobond Co Limited 74.0 69.5 69.6 71.3 990.6 - 1,275.0
Index linked swaps 31.9 31.9 31.9 133.9 93.3 1,929.7 2,252.6
Fair value interest rate swaps 4.8 4.8 4.8 4.8 4.8 52.4 76.4
Finance leases 10.9 52.6 49.5 57.8 68.8 145.5 385.1
247.9 195.0 192.1 304.7 1,210.5 4,143.2 6,293.4
Non-interest bearing financial liabilities
Trade payables 60.5 - - - - - 60.5
Other payables 236.3 - - - - - 236.3
296.8 - - - - - 296.8
(b) Financial risks Capital risk management The Group's objectives when managing capital are to safeguard the Group's ability to continue as a going concern in order to provide benefits to stakeholders, returns to shareholders and to maintain an optimal capital structure. In order to do this, the Group will consider the amount of debt and assets held and their liquidity. When monitoring capital risk, the Group considers its gearing and the ratio of net debt to regulatory capital value (RCV). Centrally managed funds are invested entirely with counterparties whose credit rating is 'A-' or better. Maximum exposure relating to financial assets is represented by carrying value as at the balance sheet date. Credit risk The Group has some exposure to credit risk through the holding of receivables on the year end balance sheet. These can be split into main charges receivables and other trade receivables.
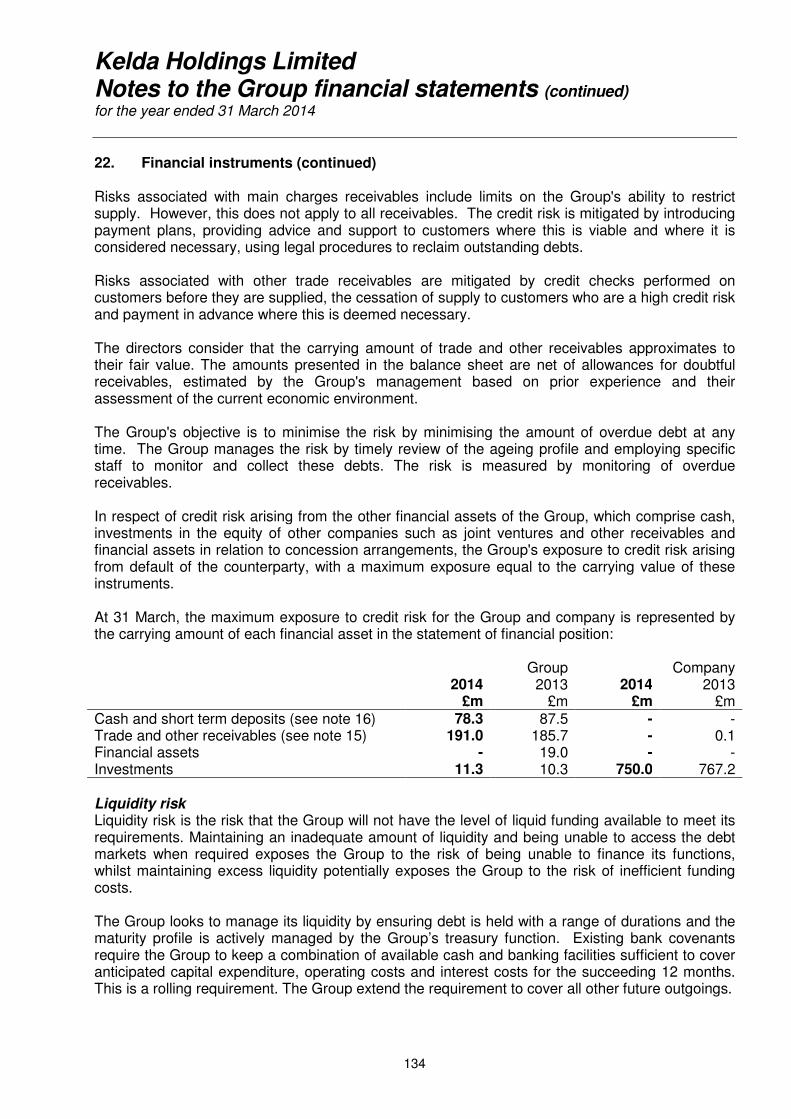
Kelda Holdings Limited Notes to the Group financial statements (continued) for the year ended 31 March 2014
134
22. Financial instruments (continued) Risks associated with main charges receivables include limits on the Group's ability to restrict supply. However, this does not apply to all receivables. The credit risk is mitigated by introducing payment plans, providing advice and support to customers where this is viable and where it is considered necessary, using legal procedures to reclaim outstanding debts. Risks associated with other trade receivables are mitigated by credit checks performed on customers before they are supplied, the cessation of supply to customers who are a high credit risk and payment in advance where this is deemed necessary. The directors consider that the carrying amount of trade and other receivables approximates to their fair value. The amounts presented in the balance sheet are net of allowances for doubtful receivables, estimated by the Group's management based on prior experience and their assessment of the current economic environment. The Group's objective is to minimise the risk by minimising the amount of overdue debt at any time. The Group manages the risk by timely review of the ageing profile and employing specific staff to monitor and collect these debts. The risk is measured by monitoring of overdue receivables. In respect of credit risk arising from the other financial assets of the Group, which comprise cash, investments in the equity of other companies such as joint ventures and other receivables and financial assets in relation to concession arrangements, the Group's exposure to credit risk arising from default of the counterparty, with a maximum exposure equal to the carrying value of these instruments. At 31 March, the maximum exposure to credit risk for the Group and company is represented by the carrying amount of each financial asset in the statement of financial position: Group Company 2014
£m 2013
£m 2014
£m 2013
£m Cash and short term deposits (see note 16) 78.3 87.5 - - Trade and other receivables (see note 15) 191.0 185.7 - 0.1 Financial assets - 19.0 - - Investments 11.3 10.3 750.0 767.2 Liquidity risk Liquidity risk is the risk that the Group will not have the level of liquid funding available to meet its requirements. Maintaining an inadequate amount of liquidity and being unable to access the debt markets when required exposes the Group to the risk of being unable to finance its functions, whilst maintaining excess liquidity potentially exposes the Group to the risk of inefficient funding costs. The Group looks to manage its liquidity by ensuring debt is held with a range of durations and the maturity profile is actively managed by the Group’s treasury function. Existing bank covenants require the Group to keep a combination of available cash and banking facilities sufficient to cover anticipated capital expenditure, operating costs and interest costs for the succeeding 12 months. This is a rolling requirement. The Group extend the requirement to cover all other future outgoings.
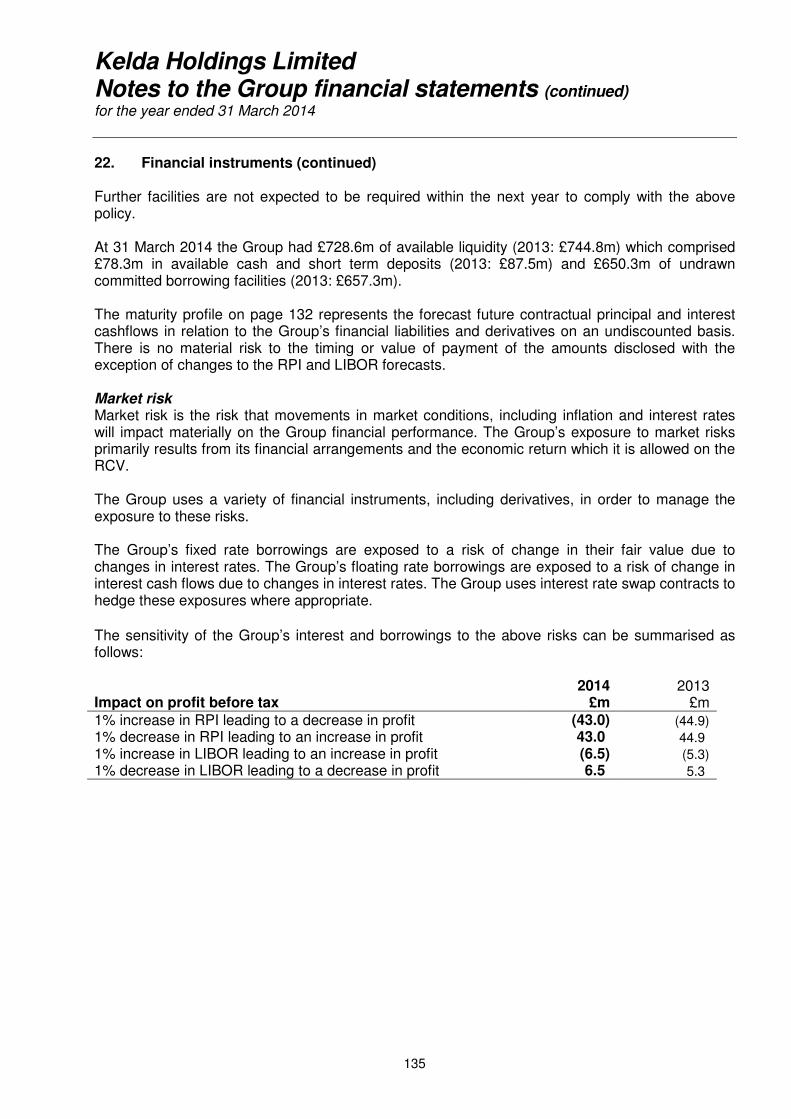
Kelda Holdings Limited Notes to the Group financial statements (continued) for the year ended 31 March 2014
135
22. Financial instruments (continued) Further facilities are not expected to be required within the next year to comply with the above policy. At 31 March 2014 the Group had £728.6m of available liquidity (2013: £744.8m) which comprised £78.3m in available cash and short term deposits (2013: £87.5m) and £650.3m of undrawn committed borrowing facilities (2013: £657.3m). The maturity profile on page 132 represents the forecast future contractual principal and interest cashflows in relation to the Group’s financial liabilities and derivatives on an undiscounted basis. There is no material risk to the timing or value of payment of the amounts disclosed with the exception of changes to the RPI and LIBOR forecasts. Market risk Market risk is the risk that movements in market conditions, including inflation and interest rates will impact materially on the Group financial performance. The Group’s exposure to market risks primarily results from its financial arrangements and the economic return which it is allowed on the RCV. The Group uses a variety of financial instruments, including derivatives, in order to manage the exposure to these risks. The Group’s fixed rate borrowings are exposed to a risk of change in their fair value due to changes in interest rates. The Group’s floating rate borrowings are exposed to a risk of change in interest cash flows due to changes in interest rates. The Group uses interest rate swap contracts to hedge these exposures where appropriate. The sensitivity of the Group’s interest and borrowings to the above risks can be summarised as follows: 2014 2013 Impact on profit before tax £m £m 1% increase in RPI leading to a decrease in profit (43.0) (44.9)
1% decrease in RPI leading to an increase in profit 43.0 44.9
1% increase in LIBOR leading to an increase in profit (6.5) (5.3)
1% decrease in LIBOR leading to a decrease in profit 6.5 5.3
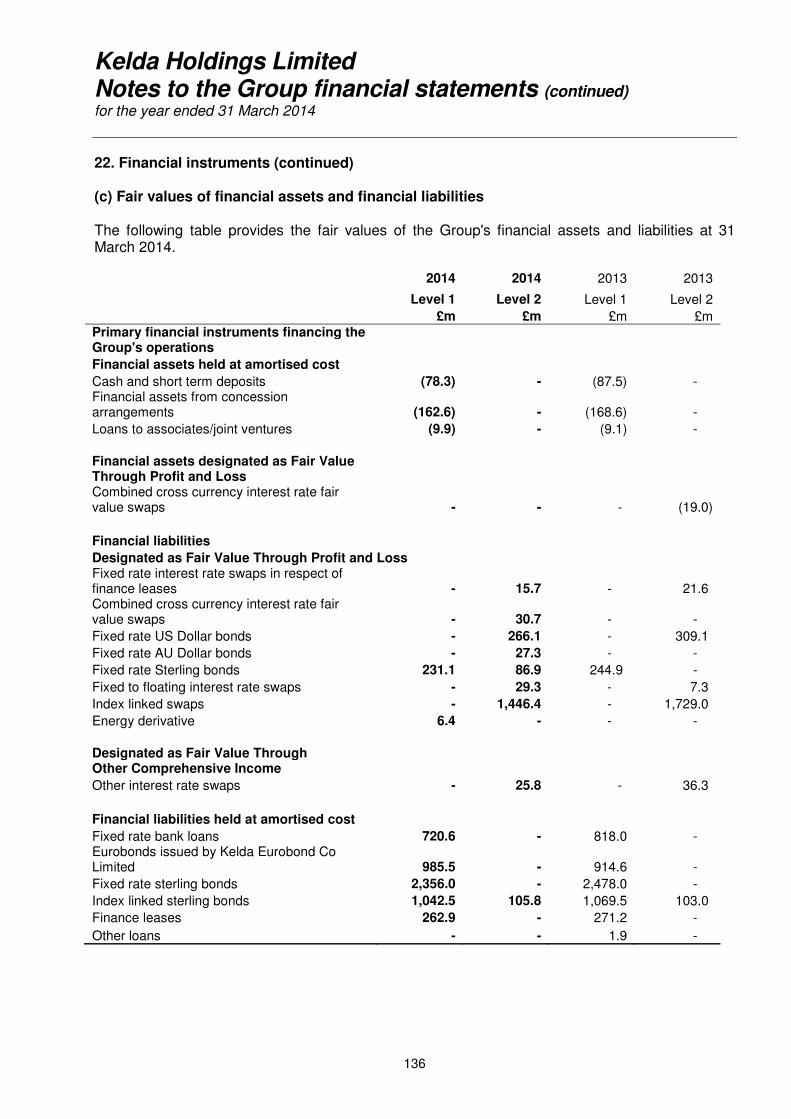
Kelda Holdings Limited Notes to the Group financial statements (continued) for the year ended 31 March 2014
136
22. Financial instruments (continued) (c) Fair values of financial assets and financial liabilities The following table provides the fair values of the Group's financial assets and liabilities at 31 March 2014. 2014 2014 2013 2013
Level 1 Level 2 Level 1 Level 2
£m £m £m £m Primary financial instruments financing the Group's operations
Financial assets held at amortised cost
Cash and short term deposits (78.3) - (87.5) - Financial assets from concession arrangements (162.6) - (168.6) -
Loans to associates/joint ventures (9.9) - (9.1) -
Financial assets designated as Fair Value Through Profit and Loss Combined cross currency interest rate fair value swaps - - - (19.0)
Financial liabilities
Designated as Fair Value Through Profit and Loss Fixed rate interest rate swaps in respect of finance leases - 15.7 - 21.6 Combined cross currency interest rate fair value swaps - 30.7 - -
Fixed rate US Dollar bonds - 266.1 - 309.1
Fixed rate AU Dollar bonds - 27.3 - -
Fixed rate Sterling bonds 231.1 86.9 244.9 -
Fixed to floating interest rate swaps - 29.3 - 7.3
Index linked swaps - 1,446.4 - 1,729.0
Energy derivative 6.4 - - -
Designated as Fair Value Through Other Comprehensive Income
Other interest rate swaps - 25.8 - 36.3
Financial liabilities held at amortised cost
Fixed rate bank loans 720.6 - 818.0 - Eurobonds issued by Kelda Eurobond Co Limited 985.5 - 914.6 -
Fixed rate sterling bonds 2,356.0 - 2,478.0 -
Index linked sterling bonds 1,042.5 105.8 1,069.5 103.0
Finance leases 262.9 - 271.2 -
Other loans - - 1.9 -
Kelda Holdings Limited Notes to the Group financial statements (continued) for the year ended 31 March 2014
137
22. Financial instruments (continued) The fair values for all financial instruments have been calculated either by discounting the expected future cash flows at interest rates prevailing for a comparable maturity period for each instrument and adjusting for own and counter-party credit risk or by reference to market values for similar instruments. Fair value hierarchy of derivative financial instruments For all financial instruments held by the Group, those that are held at fair value are to be classified by reference to the source of inputs used to derive the fair value. The following hierarchy is used: Level 1 - unadjusted quoted prices in active markets or identical assets or liabilities; Level 2 - inputs other than quoted prices that are observable for the asset or liability either directly as prices or indirectly through modelling based on prices; and Level 3 - inputs for the asset or liability that are not based on observable market data. The Group holds all derivatives at fair value using discounted cash flow models based on observable market rates adjusted for own and counter-party credit risk. Therefore all derivative financial instruments held by the Group fall into Level 2. No financial instruments have moved between the levels in the year. Movements in the fair value of index linked swaps in respect of borrowings of £282.6m were recognised in the income statement (2013: £325.3m). Of this movement a credit of £298.2m (2013: charge of £297.6m) is recognised in exceptional finance income and a charge of £15.6m (2013: £27.7m) is recognised in finance costs to accrue for the RPI bullet payment on the swaps. Movements in the fair value of fixed rate swaps in respect of finance leases of £5.9m were recognised in the income statement (2013: £3.8m). A charge from the movement in fair value of combined cross currency interest rate swaps of £49.7m was recognised in the income statement (2013: £22.4m income), offset by the change in fair value of the associated bonds of £49.4m (2013: £25.2m income). Of the change in fair value of associated bonds, £43.0m (2013: £25.2m income) relates to Fixed US Dollar bonds. The remaining £6.4m (2013: £nil) change in fair value relates to the movement between the fair value of AUS Dollar bonds of £33.7m when issued during the year and the fair value of £27.3m at 31 March 2014. Movements in the fair value of fixed to floating interest rate swaps of £22.0m was recognised in the income statement (2013: £7.3m), offset by the change in fair value of the associated bonds of £16.8m (2013: £5.1m). £13.8m (2013: £7.3m) of change in fair value of associated bonds relates to the 3.625% 2029 guaranteed bonds with a fair value of £227.9m (2013: £241.7m) at 31 March 2014. The remaining £3.0m (2013: £nil) change in fair value of associated bonds relates to the 4.965% 2033 Class B guaranteed bonds with a fair value of £86.2m (2013: £nil) at 31 March 2014. These bonds were valued at £89.2m (net of issue costs) when issued. All interest rate swaps have maturity dates in excess of five years. Some interest rate swaps in respect of borrowings have break dates at which time both parties have an option to repay the swap. The first of these break dates falls in August 2016.
Kelda Holdings Limited Notes to the Group financial statements (continued) for the year ended 31 March 2014
138
22. Financial instruments (continued) (d) Hedges The Group's policy is to hedge interest rate risk within approved board policies and guidelines. Interest rate swaps are used to manage interest rate exposure under a policy that requires at least 85% of Yorkshire Water and Kelda Holdco Limited net debt to be fixed or index linked. At the financial year end the proportions were 110% and 105% respectively (2013: 110% and 105%). Hedging of floating rate interest due on borrowings The Group has a number of borrowing facilities with a number of counterparties on which interest is linked to LIBOR. It is therefore exposed to changes in LIBOR which could have a material effect on interest costs from year to year and over time. In order to manage its exposure to movements in LIBOR, the Group has entered into a number of floating rate to index linked swaps and also a floating interest rate to fixed interest rate swap. The nominal value of index linked swaps total £1,289.0m and have an average life of 26 years. The nominal value of the floating interest rate to fixed interest rate swaps is £45.0m with a remaining life of 17 years. The hedging instruments are not a perfect cash flow hedge against changes in LIBOR as the dates and amounts of the swaps vary in some cases to the borrowings which they hedge. The fair value of the indexed linked hedging instruments at 31 March 2014 was a loss of £1,446.4m (2013: £1,729.0m loss). The fair value movement in the year has been recognised in the income statement as an exceptional item because the criteria for hedge accounting were not met. The fair value of the floating interest rate to fixed interest rate swap instruments was a loss of £25.8m (2013: £36.4m loss). The fair value movement in the year has been charged directly to reserves as hedging criteria were met. Hedging of interest due under finance leases The Group has a number of finance leases with a number of counterparties lasting from inception for periods up to 34 years. In most cases interest payable under the lease is set once a year in late March or early April based on 12 month LIBOR. The Group is therefore exposed to changes in 12 month LIBOR which could have a material effect on interest costs from year to year and over time. £59.2m of leases are reset semi-annually based on 6 month LIBOR. In order to fix the interest cost on a proportion of its net debt, the Group has entered into a number of floating to fixed interest rate swaps. The hedging instrument no longer meets the criteria to classify for hedge accounting. The Group has made a provision of £15.7m (2013: £21.6m) for the mark to market loss in the fair value of the hedging instrument at 31 March 2014.
Kelda Holdings Limited Notes to the Group financial statements (continued) for the year ended 31 March 2014
139
22. Financial instruments (continued) The cash flow hedge was assessed to be ineffective at 31 March 2014 and a credit of £5.9m (2013: £2.9m charge) relating to the hedging instrument was included in the income statement (net of deferred tax). Fair value hedges Combined cross currency interest rate swap contracts, exchanging fixed rate interest for floating rate interest on the Group’s US Dollar bonds, are designated and effective as fair value hedges in respect of interest rates and foreign currency risk. The Group has made a provision of £23.1m (2013: £19.0m asset) for the mark to market loss in the fair value of the combined cross currency interest rate swap instruments. The fair value movement in the year has been recognised in the income statement as an exceptional item as the instrument was nominated as fair value through profit and loss on inception in line with the prescribed treatment for fair value hedges. As, during the year and since inception, the hedge was at least 95% effective in hedging the fair value exposure to interest rate movements and foreign currency exposure, the carrying amount of the bonds was adjusted for a fair value gain of £43.0m (2013: £25.2m loss) which was included in the income statement at the same time that the fair value of the combined cross currency interest rate swap was included in the income statement. The Group has a £250m nominal fixed to floating interest rate swap which is designated as a fair value hedge of fixed rate bonds of the same value. The hedge was at least 95% effective in hedging the fair value exposure to interest rate movements. The Group has made a provision of £23.7m (2013: £7.3m) for the mark to market loss in the fair value of the fixed to floating interest rate swaps. The fair value movement in the year has been recognised in the income statement as an exceptional item as the instrument was nominated as fair value through profit and loss on inception in line with the prescribed treatment for fair value hedges. As, during the year and since inception, the hedge was at least 95% effective in hedging the fair value exposure to interest rate, the carrying amount of the bonds was adjusted for a fair value gain of £13.8m (2013: £5.1m) which was included in the income statement at the same time that the fair value of the fixed to floating interest rate swap was included in the income statement. During 2013/14 the Group entered into a £90m nominal fixed to floating interest rate swap which was designated as a fair value hedge of fixed rate bonds of the same value. During the year, the hedge was at least 95% effective in hedging the fair value exposure to interest rate movements. The Group has made a provision of £5.6m (2013: £nil) for the mark to market loss in the fair value of the fixed to floating interest rate swaps. The fair value movement in the year has been recognised in the income statement as an exceptional item as the instrument was nominated as fair value through profit and loss on inception in line with the prescribed treatment for fair value hedges. As, during the year and since inception, the hedge was at least 95% effective in hedging the fair value exposure to interest rate, the carrying amount of the bonds was adjusted for a fair value gain of £3.0m which was included in the income statement at the same time that the fair value of the fixed to floating interest rate swap was included in the income statement. During 2013/14 the Group entered into a £33.8m combined cross currency interest rate swap contract, exchanging fixed rate interest for floating rate interest on an Australian dollar bond, which was designated as a fair value hedge of fixed rate bonds of the same value. During the year, the hedges were at least 95% effective in hedging the fair value exposure to interest rate movements. The Group has made a provision of £7.6m (2013: £nil) for the mark to market loss in the fair value of the combined cross currency interest rate swap instruments.
Kelda Holdings Limited Notes to the Group financial statements (continued) for the year ended 31 March 2014
140
22. Financial instruments (continued) The fair value movement in the year has been recognised in the income statement as an exceptional item as the instrument was nominated as fair value through profit and loss on inception in line with the prescribed treatment for fair value hedges. As, during the year and since inception, the hedge was at least 95% effective in hedging the fair value exposure to interest rate, the carrying amount of the bonds was adjusted for a fair value gain of £6.4m which was included in the income statement at the same time that the fair value of the fixed to floating interest rate swap was included in the income statement. Foreign currency risk management The Group has a number of long term interest bearing liabilities denominated in foreign currencies; consequently exposures to exchange rate fluctuations arise. Exchange rate exposures are managed within approved policy parameters utilising combined cross currency interest rate swaps. 23. Share based payments Share options Previously, the Group operated a savings related share option scheme under which options were granted to employees. The scheme was closed following the acquisition of Kelda Group Limited (formerly plc.) by Saltaire Water Limited. Certain schemes have been allowed to continue until the planned maturity with members having the option to continue contributing. For any member who has taken that option, charges to the income statement will continue until the maturity of the scheme. For any other member who has opted to close their scheme, charges to the income statement ceased in the month that they chose to leave the scheme. The employee share option plans were open to all qualifying employees and provided for an exercise price equal to the daily average market price on the date of grant less 20%. The options previously vested if the employee remains in service for the full duration of the option scheme (either three or five years), but the choice to vest on takeover was available to all option holders. 2014 2013
Weighted
average Weighted
average
Options exercise
price Options exercise
price
£ £
Outstanding at the beginning of the year
-
-
6,929
7.41
Exercised during the year - - (6,929) 7.41
Outstanding at the end of the year - - - -
No share options were exercised during the year. The weighted average share price at the date of exercise for share options exercised during the prior year was £10.90 (2013: £10.90). There were no options outstanding at 31 March 2014 or 31 March 2013.
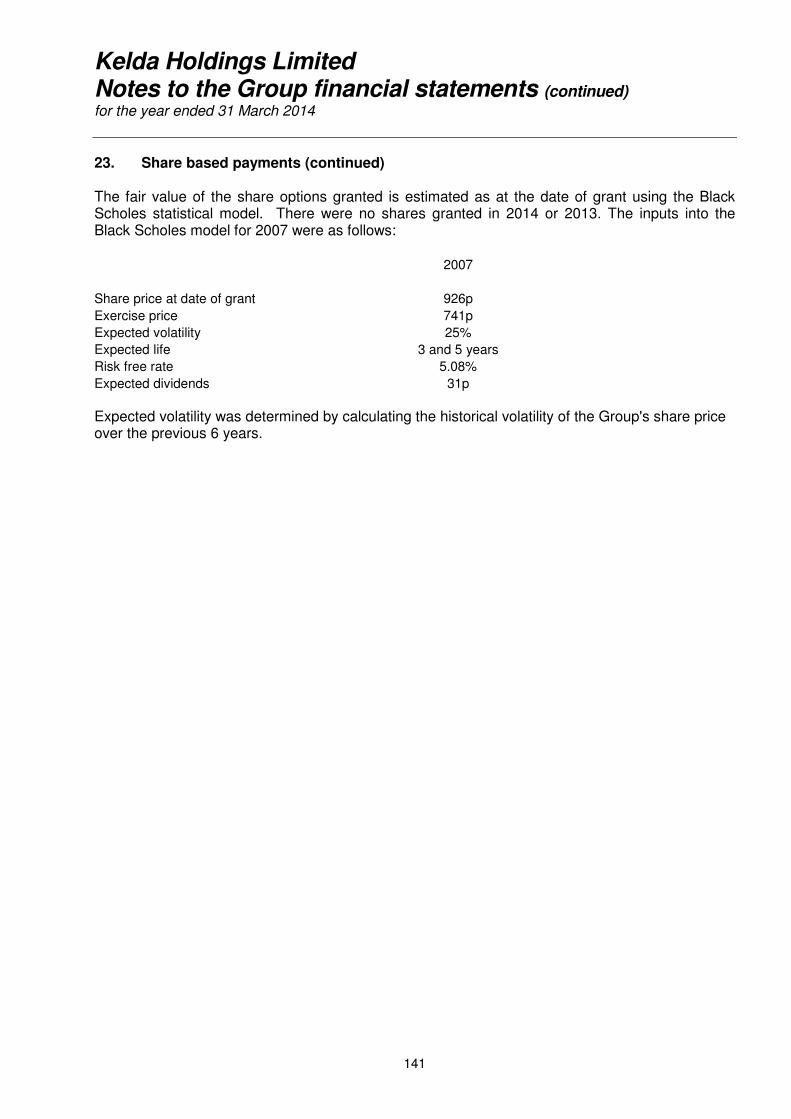
Kelda Holdings Limited Notes to the Group financial statements (continued) for the year ended 31 March 2014
141
23. Share based payments (continued) The fair value of the share options granted is estimated as at the date of grant using the Black Scholes statistical model. There were no shares granted in 2014 or 2013. The inputs into the Black Scholes model for 2007 were as follows: 2007
Share price at date of grant 926p
Exercise price 741p
Expected volatility 25%
Expected life 3 and 5 years
Risk free rate 5.08%
Expected dividends 31p
Expected volatility was determined by calculating the historical volatility of the Group's share price over the previous 6 years.
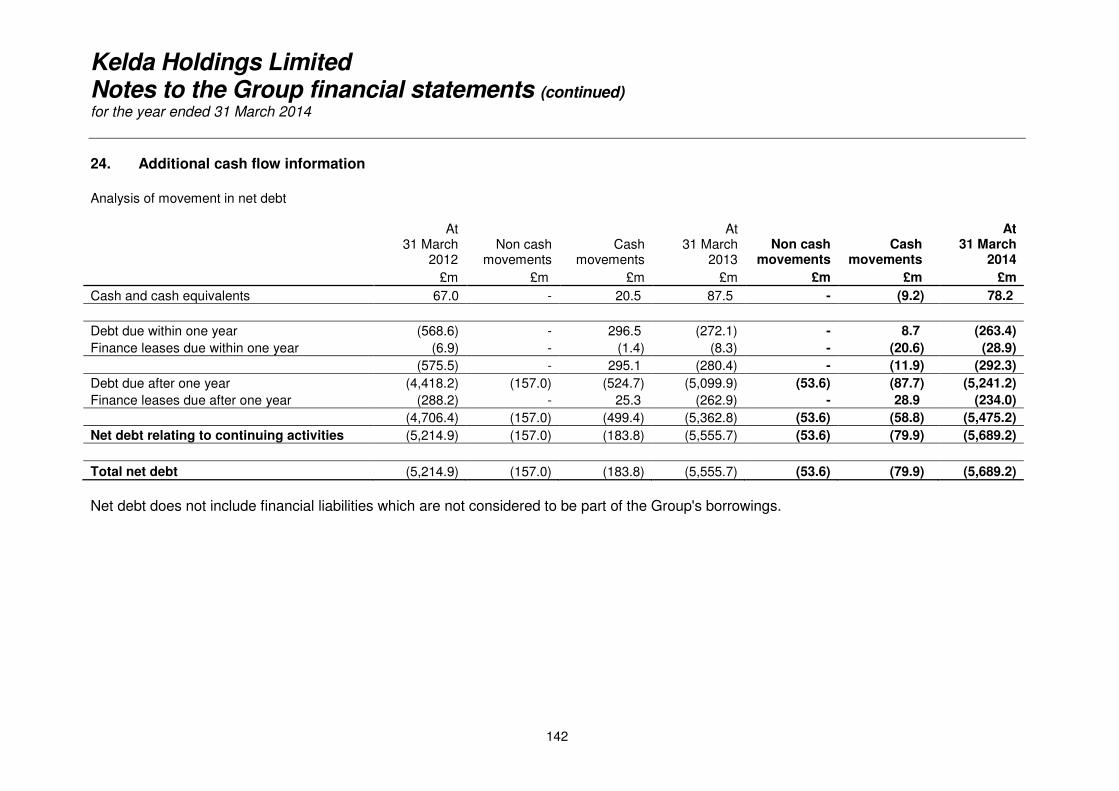
Kelda Holdings Limited Notes to the Group financial statements (continued) for the year ended 31 March 2014
142
24. Additional cash flow information Analysis of movement in net debt
At 31 March
2012
Non cash movements
Cash movements
At 31 March
2013 Non cash
movements Cash
movements
At 31 March
2014
£m £m £m £m £m £m £m
Cash and cash equivalents 67.0 - 20.5 87.5 - (9.2) 78.2
Debt due within one year (568.6) - 296.5 (272.1) - 8.7 (263.4)
Finance leases due within one year (6.9) - (1.4) (8.3) - (20.6) (28.9)
(575.5) - 295.1 (280.4) - (11.9) (292.3)
Debt due after one year (4,418.2) (157.0) (524.7) (5,099.9) (53.6) (87.7) (5,241.2)
Finance leases due after one year (288.2) - 25.3 (262.9) - 28.9 (234.0)
(4,706.4) (157.0) (499.4) (5,362.8) (53.6) (58.8) (5,475.2)
Net debt relating to continuing activities (5,214.9) (157.0) (183.8) (5,555.7) (53.6) (79.9) (5,689.2)
Total net debt (5,214.9) (157.0) (183.8) (5,555.7) (53.6) (79.9) (5,689.2)
Net debt does not include financial liabilities which are not considered to be part of the Group's borrowings.
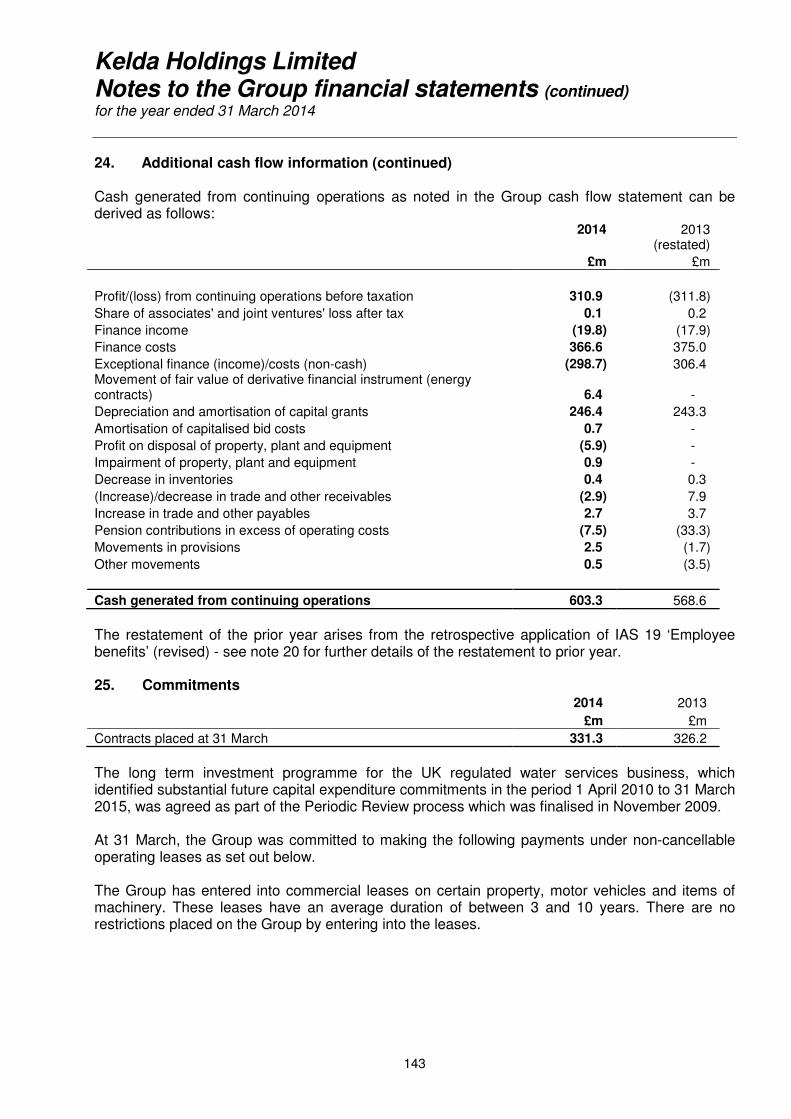
Kelda Holdings Limited Notes to the Group financial statements (continued) for the year ended 31 March 2014
143
24. Additional cash flow information (continued) Cash generated from continuing operations as noted in the Group cash flow statement can be derived as follows:
2014
2013
(restated)
£m £m
Profit/(loss) from continuing operations before taxation 310.9 (311.8)
Share of associates' and joint ventures' loss after tax 0.1 0.2
Finance income (19.8) (17.9)
Finance costs 366.6 375.0
Exceptional finance (income)/costs (non-cash) (298.7) 306.4 Movement of fair value of derivative financial instrument (energy contracts) 6.4 -
Depreciation and amortisation of capital grants 246.4 243.3
Amortisation of capitalised bid costs 0.7 -
Profit on disposal of property, plant and equipment (5.9) -
Impairment of property, plant and equipment 0.9 -
Decrease in inventories 0.4 0.3
(Increase)/decrease in trade and other receivables (2.9) 7.9
Increase in trade and other payables 2.7 3.7
Pension contributions in excess of operating costs (7.5) (33.3)
Movements in provisions 2.5 (1.7)
Other movements 0.5 (3.5)
Cash generated from continuing operations 603.3 568.6
The restatement of the prior year arises from the retrospective application of IAS 19 ‘Employee benefits’ (revised) - see note 20 for further details of the restatement to prior year. 25. Commitments 2014 2013
£m £m
Contracts placed at 31 March 331.3 326.2
The long term investment programme for the UK regulated water services business, which identified substantial future capital expenditure commitments in the period 1 April 2010 to 31 March 2015, was agreed as part of the Periodic Review process which was finalised in November 2009. At 31 March, the Group was committed to making the following payments under non-cancellable operating leases as set out below. The Group has entered into commercial leases on certain property, motor vehicles and items of machinery. These leases have an average duration of between 3 and 10 years. There are no restrictions placed on the Group by entering into the leases.
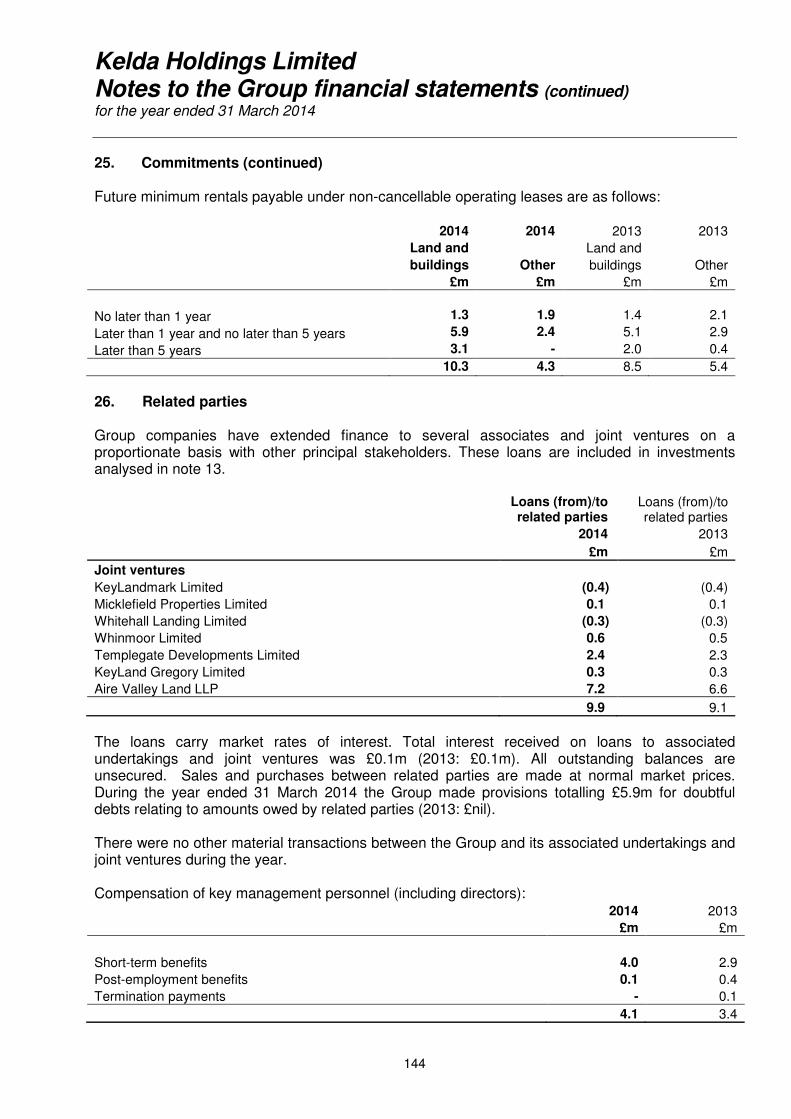
Kelda Holdings Limited Notes to the Group financial statements (continued) for the year ended 31 March 2014
144
25. Commitments (continued) Future minimum rentals payable under non-cancellable operating leases are as follows: 2014 2014 2013 2013
Land and Land and
buildings Other buildings Other
£m £m £m £m
No later than 1 year 1.3 1.9 1.4 2.1
Later than 1 year and no later than 5 years 5.9 2.4 5.1 2.9
Later than 5 years 3.1 - 2.0 0.4
10.3 4.3 8.5 5.4
26. Related parties Group companies have extended finance to several associates and joint ventures on a proportionate basis with other principal stakeholders. These loans are included in investments analysed in note 13.
Loans (from)/to related parties
Loans (from)/to related parties
2014 2013
£m £m
Joint ventures
KeyLandmark Limited (0.4) (0.4)
Micklefield Properties Limited 0.1 0.1
Whitehall Landing Limited (0.3) (0.3)
Whinmoor Limited 0.6 0.5
Templegate Developments Limited 2.4 2.3
KeyLand Gregory Limited 0.3 0.3
Aire Valley Land LLP 7.2 6.6
9.9 9.1
The loans carry market rates of interest. Total interest received on loans to associated undertakings and joint ventures was £0.1m (2013: £0.1m). All outstanding balances are unsecured. Sales and purchases between related parties are made at normal market prices. During the year ended 31 March 2014 the Group made provisions totalling £5.9m for doubtful debts relating to amounts owed by related parties (2013: £nil). There were no other material transactions between the Group and its associated undertakings and joint ventures during the year. Compensation of key management personnel (including directors): 2014 2013
£m £m
Short-term benefits 4.0 2.9
Post-employment benefits 0.1 0.4
Termination payments - 0.1
4.1 3.4
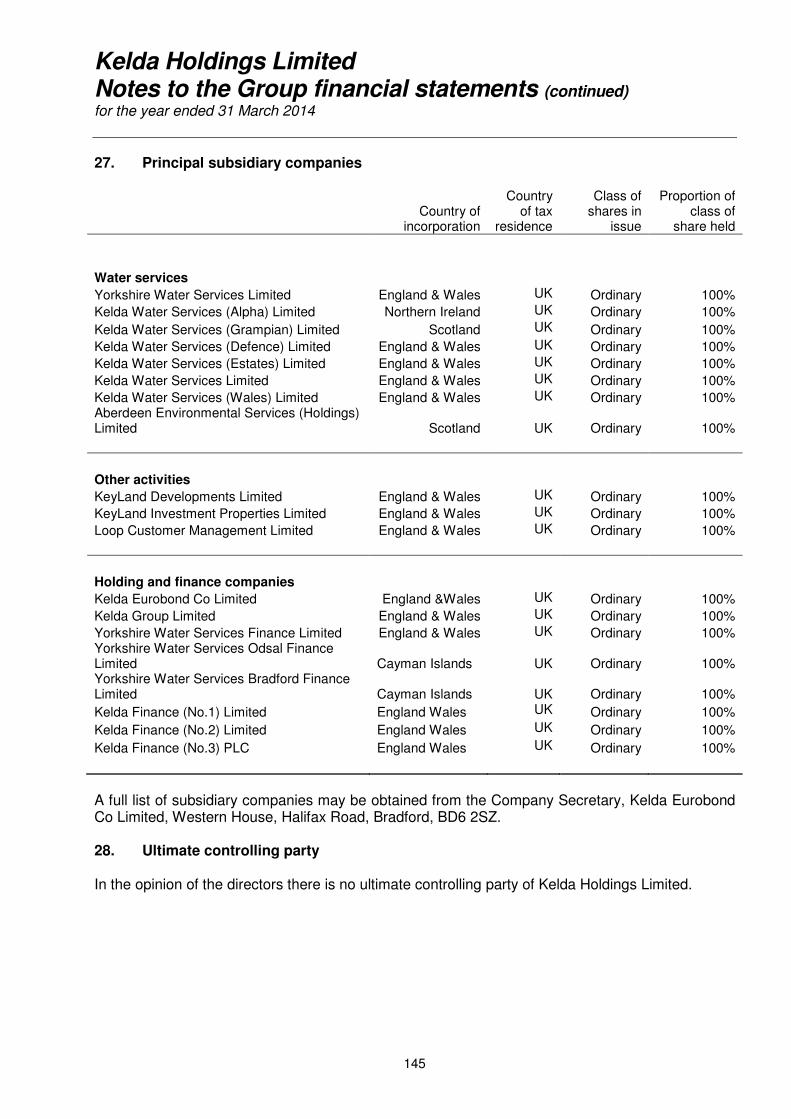
Kelda Holdings Limited Notes to the Group financial statements (continued) for the year ended 31 March 2014
145
27. Principal subsidiary companies
Country of
incorporation
Country of tax
residence
Class of shares in
issue
Proportion of class of
share held
Water services
Yorkshire Water Services Limited England & Wales UK Ordinary 100%
Kelda Water Services (Alpha) Limited Northern Ireland UK Ordinary 100%
Kelda Water Services (Grampian) Limited Scotland UK Ordinary 100%
Kelda Water Services (Defence) Limited England & Wales UK Ordinary 100%
Kelda Water Services (Estates) Limited England & Wales UK Ordinary 100%
Kelda Water Services Limited England & Wales UK Ordinary 100%
Kelda Water Services (Wales) Limited England & Wales UK Ordinary 100% Aberdeen Environmental Services (Holdings) Limited Scotland
UK Ordinary 100%
Other activities
KeyLand Developments Limited England & Wales UK Ordinary 100%
KeyLand Investment Properties Limited England & Wales UK Ordinary 100%
Loop Customer Management Limited England & Wales UK Ordinary 100%
Holding and finance companies
Kelda Eurobond Co Limited England &Wales UK Ordinary 100%
Kelda Group Limited England & Wales UK Ordinary 100%
Yorkshire Water Services Finance Limited England & Wales UK Ordinary 100% Yorkshire Water Services Odsal Finance Limited Cayman Islands
UK Ordinary 100%
Yorkshire Water Services Bradford Finance Limited Cayman Islands
UK Ordinary 100%
Kelda Finance (No.1) Limited England Wales UK Ordinary 100%
Kelda Finance (No.2) Limited England Wales UK Ordinary 100%
Kelda Finance (No.3) PLC England Wales UK Ordinary 100%
A full list of subsidiary companies may be obtained from the Company Secretary, Kelda Eurobond Co Limited, Western House, Halifax Road, Bradford, BD6 2SZ. 28. Ultimate controlling party In the opinion of the directors there is no ultimate controlling party of Kelda Holdings Limited.
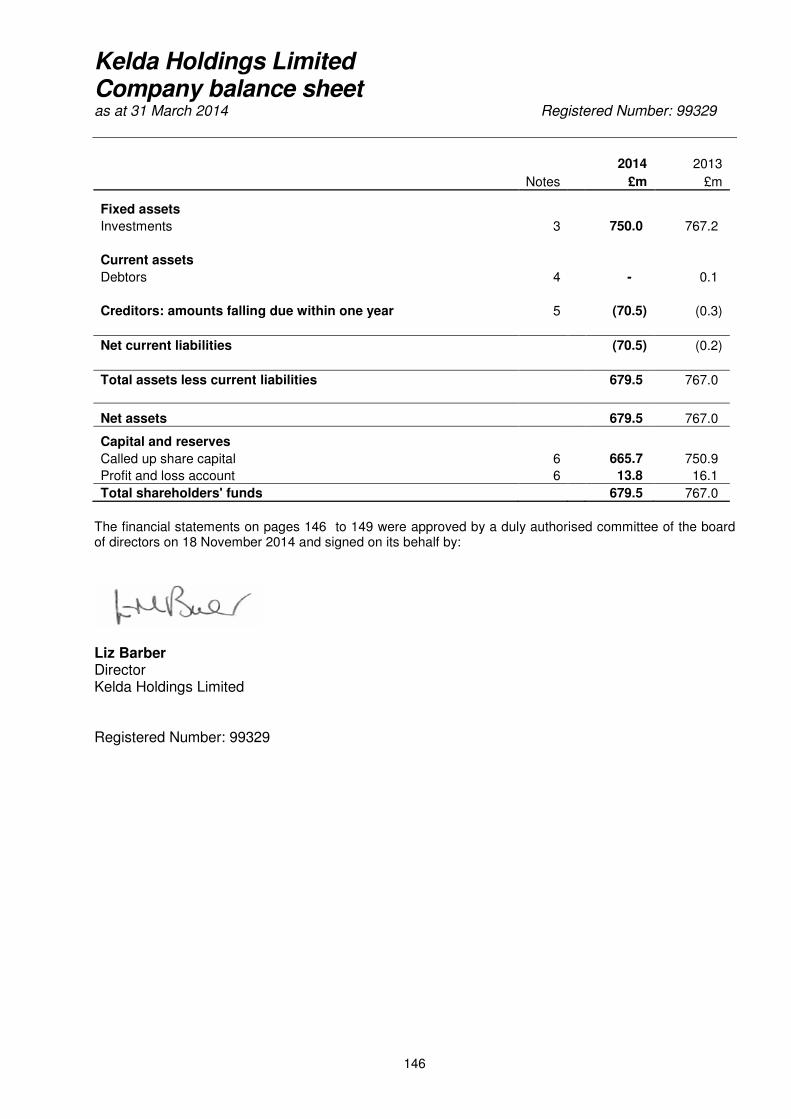
Kelda Holdings Limited Company balance sheet as at 31 March 2014 Registered Number: 99329
146
2014 2013
Notes £m £m
Fixed assets
Investments 3 750.0 767.2
Current assets
Debtors 4 - 0.1
Creditors: amounts falling due within one year 5 (70.5) (0.3)
Net current liabilities (70.5) (0.2)
Total assets less current liabilities 679.5 767.0
Net assets 679.5 767.0
Capital and reserves
Called up share capital 6 665.7 750.9
Profit and loss account 6 13.8 16.1
Total shareholders' funds 679.5 767.0
The financial statements on pages 146 to 149 were approved by a duly authorised committee of the board of directors on 18 November 2014 and signed on its behalf by:
Liz Barber Director Kelda Holdings Limited Registered Number: 99329
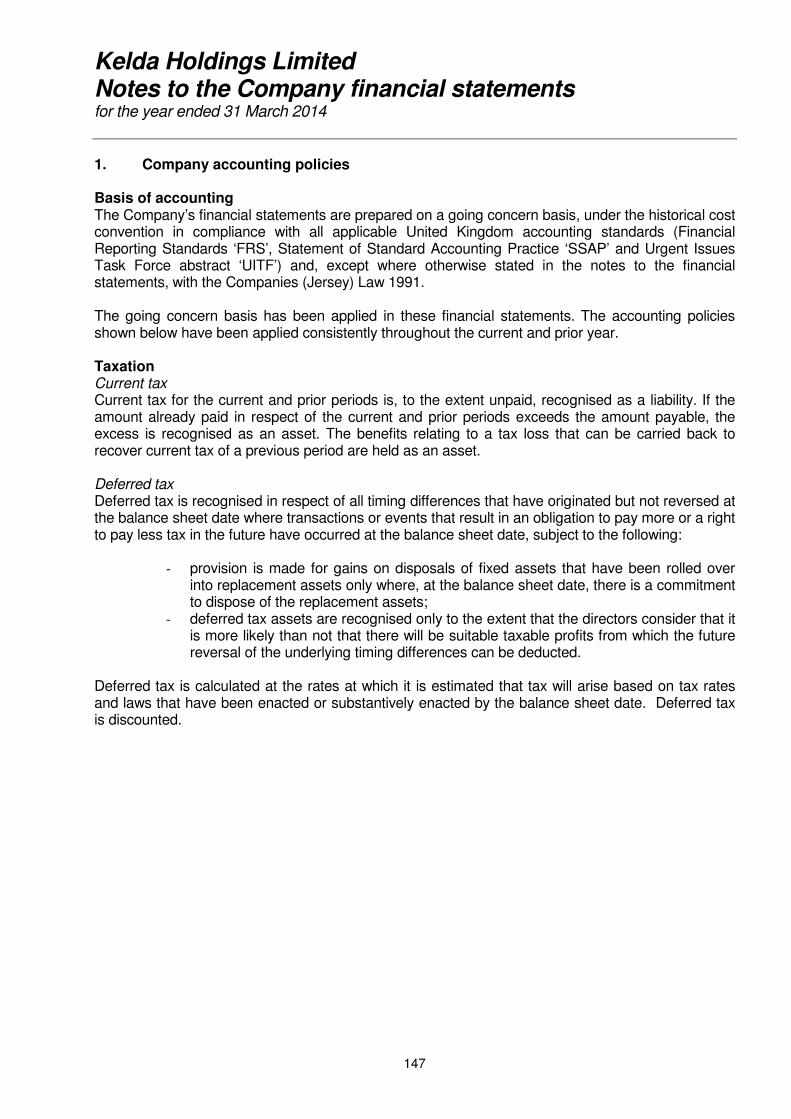
Kelda Holdings Limited Notes to the Company financial statements
for the year ended 31 March 2014
147
1. Company accounting policies Basis of accounting The Company’s financial statements are prepared on a going concern basis, under the historical cost convention in compliance with all applicable United Kingdom accounting standards (Financial Reporting Standards ‘FRS’, Statement of Standard Accounting Practice ‘SSAP’ and Urgent Issues Task Force abstract ‘UITF’) and, except where otherwise stated in the notes to the financial statements, with the Companies (Jersey) Law 1991.
The going concern basis has been applied in these financial statements. The accounting policies shown below have been applied consistently throughout the current and prior year. Taxation Current tax Current tax for the current and prior periods is, to the extent unpaid, recognised as a liability. If the amount already paid in respect of the current and prior periods exceeds the amount payable, the excess is recognised as an asset. The benefits relating to a tax loss that can be carried back to recover current tax of a previous period are held as an asset. Deferred tax Deferred tax is recognised in respect of all timing differences that have originated but not reversed at the balance sheet date where transactions or events that result in an obligation to pay more or a right to pay less tax in the future have occurred at the balance sheet date, subject to the following:
- provision is made for gains on disposals of fixed assets that have been rolled over into replacement assets only where, at the balance sheet date, there is a commitment to dispose of the replacement assets;
- deferred tax assets are recognised only to the extent that the directors consider that it is more likely than not that there will be suitable taxable profits from which the future reversal of the underlying timing differences can be deducted.
Deferred tax is calculated at the rates at which it is estimated that tax will arise based on tax rates and laws that have been enacted or substantively enacted by the balance sheet date. Deferred tax is discounted.
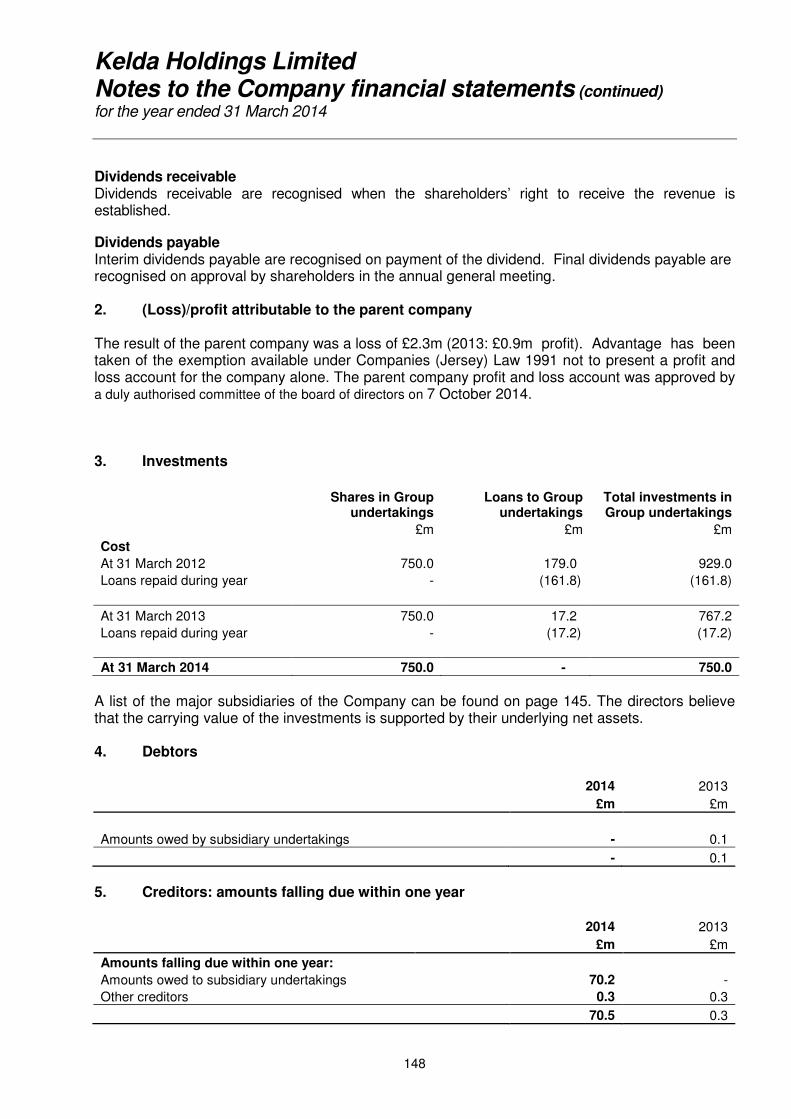
Kelda Holdings Limited Notes to the Company financial statements (continued)
for the year ended 31 March 2014
148
Dividends receivable Dividends receivable are recognised when the shareholders’ right to receive the revenue is established.
Dividends payable Interim dividends payable are recognised on payment of the dividend. Final dividends payable are recognised on approval by shareholders in the annual general meeting. 2. (Loss)/profit attributable to the parent company The result of the parent company was a loss of £2.3m (2013: £0.9m profit). Advantage has been taken of the exemption available under Companies (Jersey) Law 1991 not to present a profit and loss account for the company alone. The parent company profit and loss account was approved by a duly authorised committee of the board of directors on 7 October 2014. 3. Investments
Shares in Group
undertakings Loans to Group
undertakings Total investments in Group undertakings
£m £m £m
Cost
At 31 March 2012 750.0 179.0 929.0
Loans repaid during year - (161.8) (161.8)
At 31 March 2013 750.0 17.2 767.2
Loans repaid during year - (17.2) (17.2)
At 31 March 2014 750.0 - 750.0
A list of the major subsidiaries of the Company can be found on page 145. The directors believe that the carrying value of the investments is supported by their underlying net assets. 4. Debtors 2014 2013
£m £m
Amounts owed by subsidiary undertakings - 0.1
- 0.1
5. Creditors: amounts falling due within one year 2014 2013
£m £m
Amounts falling due within one year:
Amounts owed to subsidiary undertakings 70.2 -
Other creditors 0.3 0.3
70.5 0.3
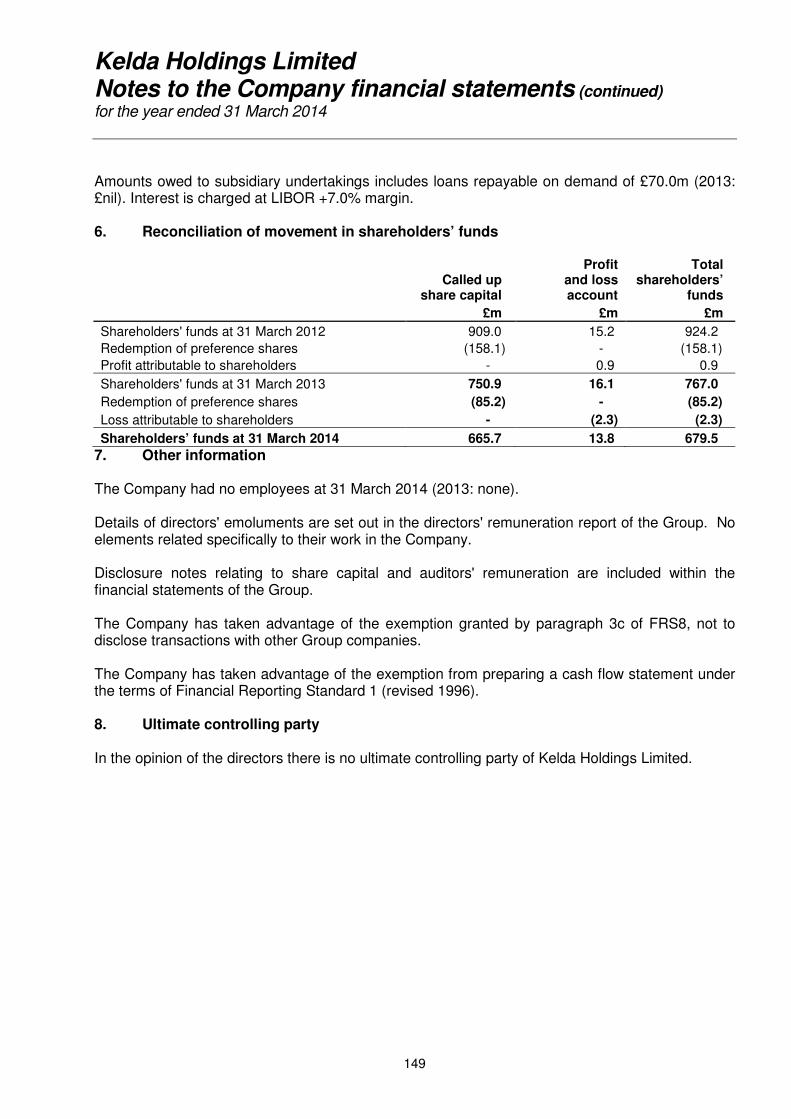
Kelda Holdings Limited Notes to the Company financial statements (continued)
for the year ended 31 March 2014
149
Amounts owed to subsidiary undertakings includes loans repayable on demand of £70.0m (2013: £nil). Interest is charged at LIBOR +7.0% margin. 6. Reconciliation of movement in shareholders’ funds
Called up
share capital
Profit and loss account
Total shareholders’
funds
£m £m £m
Shareholders' funds at 31 March 2012 909.0 15.2 924.2
Redemption of preference shares (158.1) - (158.1)
Profit attributable to shareholders - 0.9 0.9
Shareholders' funds at 31 March 2013 750.9 16.1 767.0
Redemption of preference shares (85.2) - (85.2)
Loss attributable to shareholders - (2.3) (2.3)
Shareholders’ funds at 31 March 2014 665.7 13.8 679.5
7. Other information The Company had no employees at 31 March 2014 (2013: none). Details of directors' emoluments are set out in the directors' remuneration report of the Group. No elements related specifically to their work in the Company. Disclosure notes relating to share capital and auditors' remuneration are included within the financial statements of the Group. The Company has taken advantage of the exemption granted by paragraph 3c of FRS8, not to disclose transactions with other Group companies. The Company has taken advantage of the exemption from preparing a cash flow statement under the terms of Financial Reporting Standard 1 (revised 1996). 8. Ultimate controlling party In the opinion of the directors there is no ultimate controlling party of Kelda Holdings Limited.