Embed Size (px)
DESCRIPTION
Louisville Downtown Partnership grocery study 2-28-2015
Citation preview

Retail Development Planning
KWA
Keith Wicks & Associates
Keith Wicks & Associates Office...952.953.0993
Cell...612.868.9871
Fax…952.953.0152 [email protected]
15008 Keller Lake Drive
Minneapolis, MN 55306
Retail Food Market Survey Update
Downtown Louisville, Kentucky
Prepared for:
Louisville Downtown Development Corporation
Project #LDDC102
March 10, 2014
Louisville, Kentucky Retail Food Market Survey Update #LDDC102 3-10-14 P a g e | 2
Keith Wicks & Associates
Keith Wicks & Associates Office...952.953.0993
Cell...612.868.9871
Fax…952.953.0152
15008 Keller Lake Drive
Minneapolis, MN 55306
EXECUTIVE SUMMARY The objective of this report is to update the original market survey #LDDC101 dated March
2013 for the purpose of assessing feasibility of and providing sales forecasts for new plans for
developing retail food service in the Downtown Louisville market.
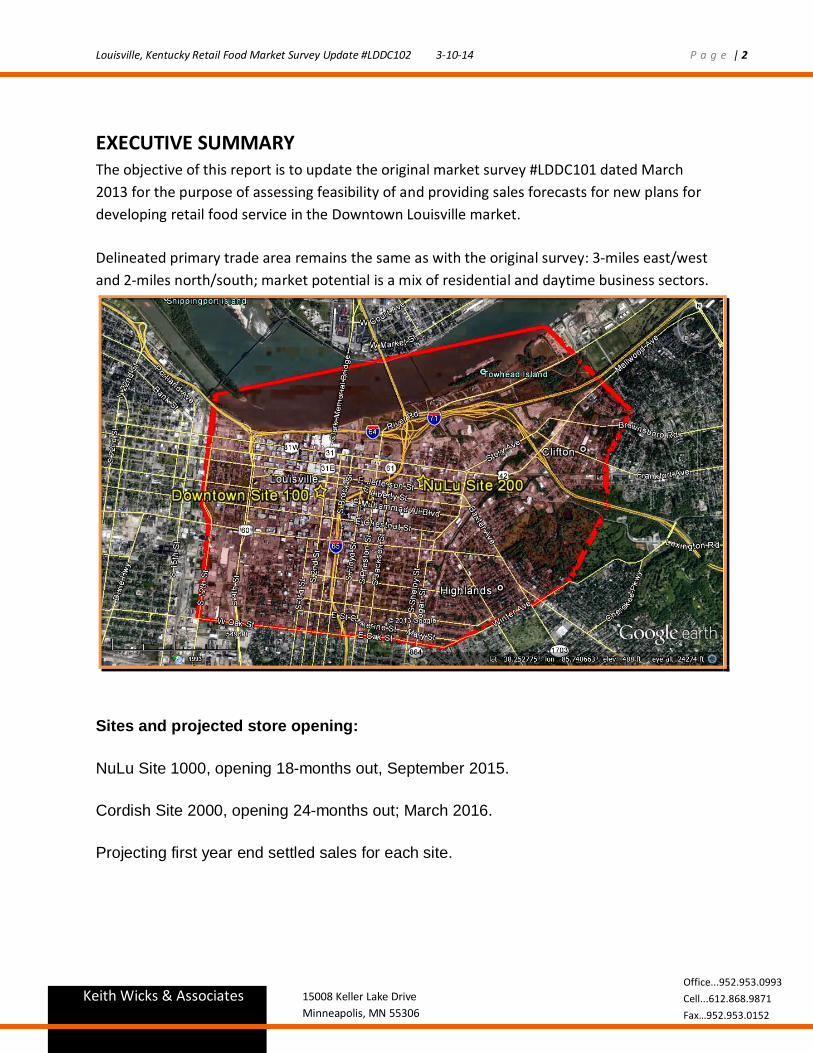
Delineated primary trade area remains the same as with the original survey: 3-miles east/west
and 2-miles north/south; market potential is a mix of residential and daytime business sectors.
Sites and projected store opening:
NuLu Site 1000, opening 18-months out, September 2015.
Cordish Site 2000, opening 24-months out; March 2016.
Projecting first year end settled sales for each site.
Louisville, Kentucky Retail Food Market Survey Update #LDDC102 3-10-14 P a g e | 3
Keith Wicks & Associates
Keith Wicks & Associates Office...952.953.0993
Cell...612.868.9871
Fax…952.953.0152
15008 Keller Lake Drive
Minneapolis, MN 55306
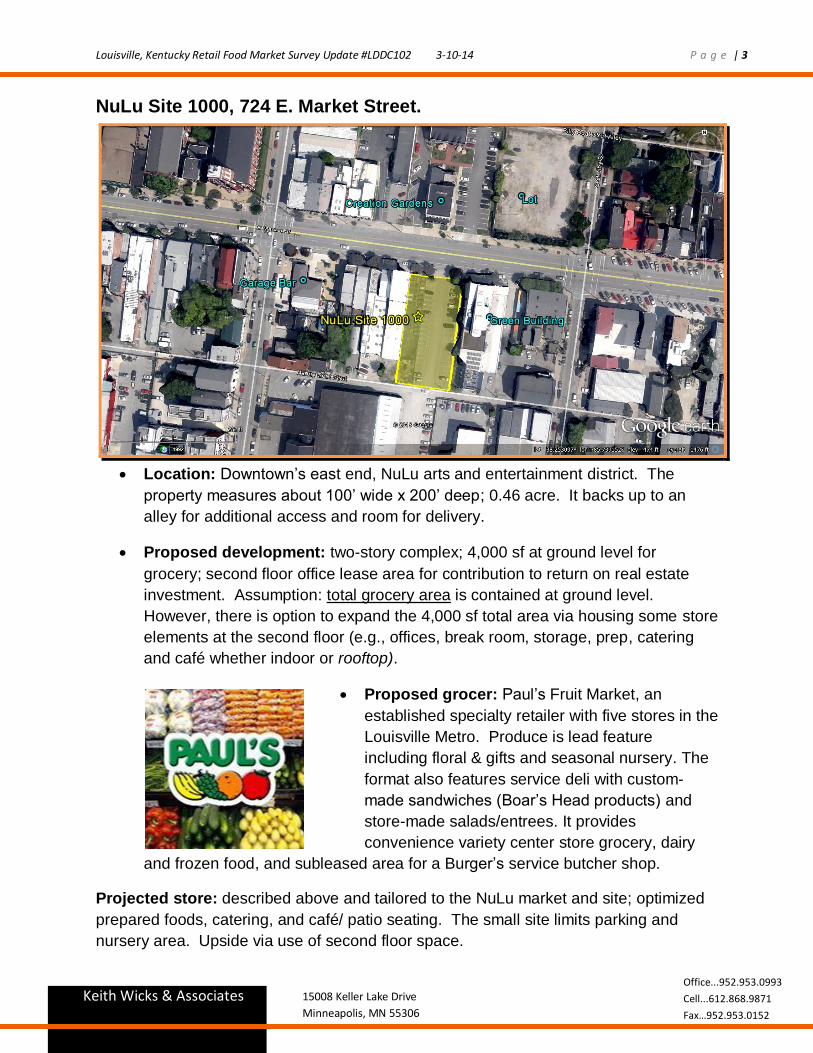
NuLu Site 1000, 724 E. Market Street.
Location: Downtown’s east end, NuLu arts and entertainment district. The
property measures about 100’ wide x 200’ deep; 0.46 acre. It backs up to an
alley for additional access and room for delivery.
Proposed development: two-story complex; 4,000 sf at ground level for
grocery; second floor office lease area for contribution to return on real estate
investment. Assumption: total grocery area is contained at ground level.
However, there is option to expand the 4,000 sf total area via housing some store
elements at the second floor (e.g., offices, break room, storage, prep, catering
and café whether indoor or rooftop).
Proposed grocer: Paul’s Fruit Market, an
established specialty retailer with five stores in the
Louisville Metro. Produce is lead feature
including floral & gifts and seasonal nursery. The
format also features service deli with custom-
made sandwiches (Boar’s Head products) and
store-made salads/entrees. It provides
convenience variety center store grocery, dairy
and frozen food, and subleased area for a Burger’s service butcher shop.
Projected store: described above and tailored to the NuLu market and site; optimized
prepared foods, catering, and café/ patio seating. The small site limits parking and
nursery area. Upside via use of second floor space.

Louisville, Kentucky Retail Food Market Survey Update #LDDC102 3-10-14 P a g e | 4
Keith Wicks & Associates
Keith Wicks & Associates Office...952.953.0993
Cell...612.868.9871
Fax…952.953.0152
15008 Keller Lake Drive
Minneapolis, MN 55306
Paul’s as a small specialty store would provide limited grocery and more so fresh
grocery fare to the immediate convenience area and would have potential to develop
business beyond the trade area east end. Paul’s specialties also attract a share of the
substantial daytime and transient trade in this market including the hospital district,
industrial businesses and entertainment corridor along Market and Main.

Louisville, Kentucky Retail Food Market Survey Update #LDDC102 3-10-14 P a g e | 5
Keith Wicks & Associates
Keith Wicks & Associates Office...952.953.0993
Cell...612.868.9871
Fax…952.953.0152
15008 Keller Lake Drive
Minneapolis, MN 55306
Cordish Site 2000
See Courier Journal March 7, 2014 article on this development, on page ___.
Location: planned redevelopment block between MLK Blvd. and Liberty Street, and
2nd and 3rd Streets. At the heart of downtown, with close proximity to 4th Street Live
and KFC Yum! Convention Center.
Proposed development: Cordish Co., owner operator of 4th Street Live,
propose a $261m mixed-use plan with a 600-room hotel and a 200-unit
apartment complex with first floor retail anchored by a specialty grocery store.
Proposed grocer: Cosentino’s, a Kansas City, MO retailer with portfolio of
(2) “Market”, (3) “Sun Fresh”, (3) “Apple” and (17) “Price Chopper”
supermarkets. Serviced by Associated Wholesale Grocers (AWG)
headquartered in Kansas City and with a wholesale division in Nashville.
Projected store: Cosentino’s operates a 33,000 sf
“Market” format in similar situation in Downtown
Kansas City. That store is a full-service supermarket
with emphasized prepared food service for the
downtown market. Site 1000 is projected as a scale
down version, 25,000 sf.
Louisville, Kentucky Retail Food Market Survey Update #LDDC102 3-10-14 P a g e | 6
Keith Wicks & Associates
Keith Wicks & Associates Office...952.953.0993
Cell...612.868.9871
Fax…952.953.0152
15008 Keller Lake Drive
Minneapolis, MN 55306
Cosentino’s Site 2000 is 0.9 mile west of NuLu Site 1000. These sites have minor
interaction with the proposed difference in store size and retail models, and with citing
the strong densities with the daytime trade in each area.
Site 2000 is exposed to a broader dynamic of traffic and business sectors which
support the larger store. The projected Cosentino’s Market is a scaled down version of
the Kansas City downtown retail model. That store size is assumed with scaled down
grocery area to allow for emphasize prepared foods area, yet hold a full-service
grocery set. Ground floor café seating would seem to be sacrificed in this store size
but it’s assumed that there will be other options for on premise dining via mezzanine
seating area or with seating in common areas of the associate retail complex.
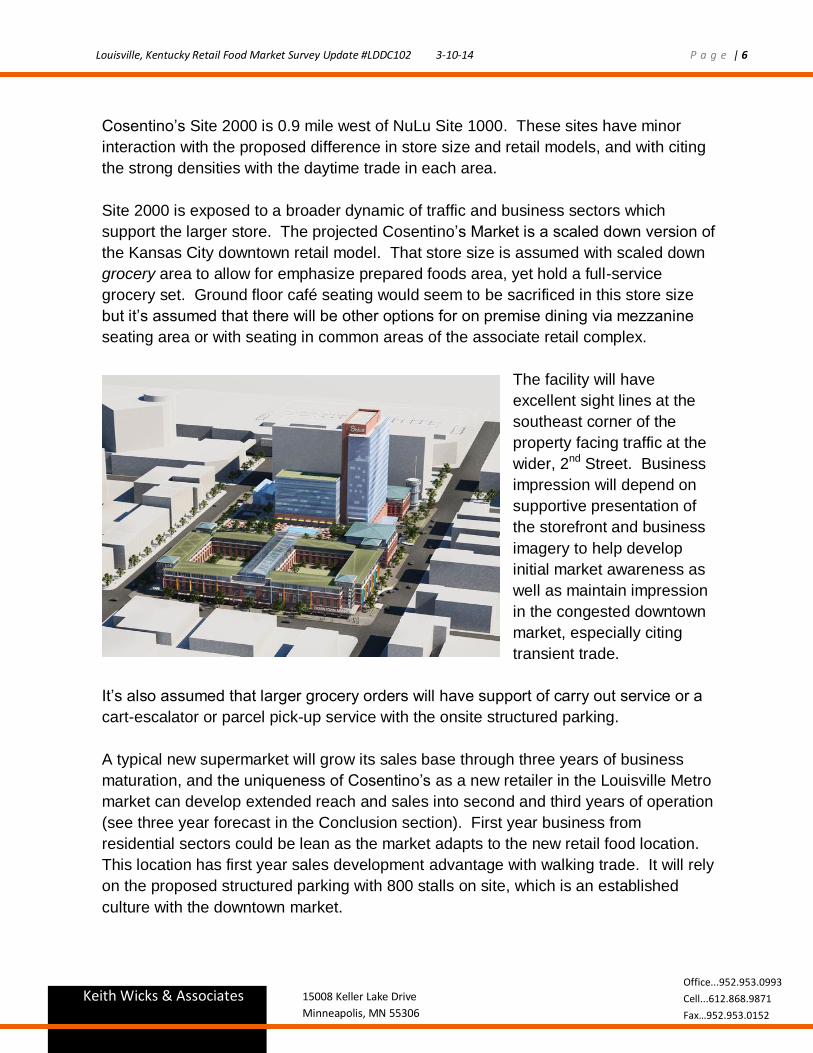
The facility will have
excellent sight lines at the
southeast corner of the
property facing traffic at the
wider, 2nd Street. Business
impression will depend on
supportive presentation of
the storefront and business
imagery to help develop
initial market awareness as
well as maintain impression
in the congested downtown
market, especially citing
transient trade.
It’s also assumed that larger grocery orders will have support of carry out service or a
cart-escalator or parcel pick-up service with the onsite structured parking.
A typical new supermarket will grow its sales base through three years of business
maturation, and the uniqueness of Cosentino’s as a new retailer in the Louisville Metro
market can develop extended reach and sales into second and third years of operation
(see three year forecast in the Conclusion section). First year business from
residential sectors could be lean as the market adapts to the new retail food location.
This location has first year sales development advantage with walking trade. It will rely
on the proposed structured parking with 800 stalls on site, which is an established
culture with the downtown market.

Louisville, Kentucky Retail Food Market Survey Update #LDDC102 3-10-14 P a g e | 7
Keith Wicks & Associates
Keith Wicks & Associates Office...952.953.0993
Cell...612.868.9871
Fax…952.953.0152
15008 Keller Lake Drive
Minneapolis, MN 55306

Louisville, Kentucky Retail Food Market Survey Update #LDDC102 3-10-14 P a g e | 8
Keith Wicks & Associates
Keith Wicks & Associates Office...952.953.0993
Cell...612.868.9871
Fax…952.953.0152
15008 Keller Lake Drive
Minneapolis, MN 55306
2013 Demographics NuLu Site 1000 Cordish Site 2000 Cosentino's KC*
1/2-Mile Reach -- Total Population 3,159 3,953 34,447
Estimated Retail Food Potential $135,837 $169,979 $155,115
Household Size 1.80 2.28 1.30
% Rental Housing. 86.3% 94.2% 80.2%
Consumer Median Age 33.5 39.0 31.3
Average Household Income $36,387 $32,937 $52,150
Median Household Income $23,949 $21,801 $42,839
% White Population 35.5% 41.2% 69.2%
% Black Population 59.4% 52.3% 20.8%
% Children (19 years or less) 21.5% 8.6% 8.6%
% Seniors (>65 years old) 6.9% 8.9% 8.9%
4 Years +, College 22.6% 26.4% 50.7%
1-Mile Reach -- Total Population 11,186 15,134 10,743
Estimated Retail Food Potential $447,440 $650,762 $483,435
HHD Size 1.80 1.70 1.60
% Rental Housing. 75.9% 91.5% 77.3%
Consumer Median Age 33.9 34.9 31.5
Average Household Income $38,514 $26,892 $49,779
Median Household Income $28,470 $18,471 $39,093
% White Population 46.2% 30.9% 59.4%
% Black Population 48.9% 63.9% 29.1%
% Children (19 years or less) 19.7% 23.0% 23.0%
% Seniors 7.6% 11.4% 11.4%
4 Years +, College 25.5% 18.1% 40.7%
2-Mile Reach -- Total Population 48,917 50,847 29,156
Estimated Retail Food Potential $1,956,680 $2,186,421 $1,312,020
HHD Size 1.80 1.90 1.90
% Rental Housing. 68.2% 73.5% 74.0%
Consumer Median Age 35.8 33.9 31.8
Average Household Income $43,525 $35,705 $45,247
Median Household Income $32,121 $26,146 $33,974
% White Population 60.2% 48.6% 44.0%
% Black Population 34.9% 46.6% 41.5%
% Children (19 years or less) 19.8% 23.1% 23.1%
% Seniors 11.7% 10.3% 10.3%
4 Years +, College 28.6% 21.4% 28.0%
Daytime Workers, 0.5-Mile 19,812 56,143 40,232
Daytime Pop., 1-Mile 75,024 99,995 79,403
Daytime Pop., 2-Mile 130,503 134,064 122,603
Cosentino's Downtown Kansas City Market included for comparison to Cordish Site 2000.

Louisville, Kentucky Retail Food Market Survey Update #LDDC102 3-10-14 P a g e | 9
Keith Wicks & Associates
Keith Wicks & Associates Office...952.953.0993
Cell...612.868.9871
Fax…952.953.0152
15008 Keller Lake Drive
Minneapolis, MN 55306
Sales forecast information
This market’s supermarket competitive structure is updated from that assessed
with the original field study. It is updated with the projected population trend and
2% annual inflation of consumer expenditures.
o One competitor change is included in all forecasted scenarios: Kroger
#348 at 2nd and Breckenridge has been upgraded with a $500k
investment. Store size remains the same but equipment was replaced as
needed, new décor added and natural and organic products were
expanded presumably for that area’s mix of students and seniors.
The sales model is with basis of trade area residents and supermarket
expenditures. Sales models are used first to assess current market competitive
structure and then to forecast sales for changes as with Sites 1000 and 2000.
Keep in mind that a central market positioned competitor or site is typically
assessed with 70-95% of its sales base coming from the primary resident trade
area…this percent of total sales is referred to as the Draw factor.
Sites 1000 and 2000 will each have low Draw factors because of this market’s
convenience area daytime demand (dining and going home needs with workers,
businesses, visitors). Daytime demand is a substantial factor with this market,
noting that consumer food-away-from-home expenditures are close (about 10%
less) than food-at-home expenditures. Downtown daytime workers are estimated
to have about 20-30% of food-away expenditure available for daytime dining
needs, which raises additional grocery demand for “going home needs”.
Cosentino’s Market Site 2000 is exposed to 50,000 to 100,000 daytime workers
in the range of 0.5 to 1-mile of Site 100, and 2,400 to 4,500 businesses in that
range. This doesn’t account for hotel guests and visitors. The demographic
comparison of Site 2000 to that for Cosentino’s Downtown Kansas City store
indicates that Site 2000 is exposed to less household income and a greater
share of lower income households, but conversely the Louisville market presents
an even stronger daytime demand. Louisville market growth is a factor that
would seem to favor Site 2000, comparatively, too.
Louisville, Kentucky Retail Food Market Survey Update #LDDC102 3-10-14 P a g e | 10
Keith Wicks & Associates
Keith Wicks & Associates Office...952.953.0993
Cell...612.868.9871
Fax…952.953.0152
15008 Keller Lake Drive
Minneapolis, MN 55306
Paul’s Fruit Market Site 1000 is exposed to 20,000 to 75,000 daytime workers
and 900 to 2,500 businesses in that range.
Daytime potential is further highlighted with downtown’s substantial office,
entertainment and health care sectors.
The baseline sales model defines resident expenditure potential for:
o Retail food (grocery).
o Beer.
Consumer pharmacy expenditures are not included in this market because
neither proposed retailer for Site 100 and 200 offer the service. The added sales
for competitors with that service shift into “outside Draw” business.
Wine & spirits expenditures are not included in this market because Kentucky
does not allow those sales in a supermarket. The issue has been actively
lobbied but the 6th U.S. Court of Appeals in January 2014 upheld the 1938 law.
Directly related downtown growth
In proximity of Cordish Site 100:
o ___ new hotel rooms under construction.
o ____ new apartments planned.
o $645m expansion plan for KFC Yum! Convention Center. This increases
the center’s ability to contend for 74% of convention demand to over 90%
of that demand. This is a key catalyst for the in-process and planned
growth of downtown’s hotel and entertainment sectors.
o _____ sf of new, mixed-use office space.
In proximity of NuLu Site 1000:
o Mainstreet Streetscape to improve presentation of the area between NuLu
and downtown.
o Close proximity to the university biotech district west of the freeway.
o Planned hotel across Mainstreet from Site 1000.
The subject sites are judged to draw a majority of their respective sales base
from within this market including residential and daytime business sectors. They
additionally can draw secondary business from residential sectors beyond this
trade area and more so contiguous to the primary trade area, including low
income sectors to the west.

Louisville, Kentucky Retail Food Market Survey Update #LDDC102 3-10-14 P a g e | 11
Keith Wicks & Associates
Keith Wicks & Associates Office...952.953.0993
Cell...612.868.9871
Fax…952.953.0152
15008 Keller Lake Drive
Minneapolis, MN 55306
Conclusion The following forecasts are reasonably achievable sales goals. The forecasts would likely be
altered upon further information for the proposed site developments and retail models. There
more so is upside to the forecasts as opposed to downside performance issues, given this
Downtown’s substantial development plans and proposals, and citing opportunity with the
substantial daytime trade.
Scenario 1 -- Paul’s NuLu Site 1000 open 3rd Qtr. 2015 – the limited variety specialty store is
projected accordingly in competitive ranking (sales model “Image).
Despite that conservative measure the lack of convenient grocery service in this area raises
reasonably this scenario’s grocery potential is just over $6/sf at $25.5k. Prepared foods
attraction to the daytime sector increases Paul’s potential about 20-points for the total forecast
of just of $35k per week. Store hours are assumed similar to Paul’s other stores; 8-7 daily. The
following is a first-pass at breaking down the forecast by retail element.
4,000 SF PAUL'S NULU SITE 1000
First-Pass Estimates of Forecast & Break Down by Retail Department
Department Distri-bution
Weekly Sales
Annual Sales
Comments
Produce 27.00% $9,765 $507,771 Paul's lead feature.
Floral & Gifts 3.00% $1,085 $56,419 Emphasized & creative presentation of this area as supplement to Produce and to maintain consumer perspectives of seasonal nursery service.
Seasonal Nursery 1.00% $362 $18,806 Contribution to annual weekly performance; 14-weeks.
Deli & Bakery 25.00% $9,042 $470,158 Serv. Case, island cheese.
Catering 3.00% $1,085 $56,419 Office deliver and pickup; no "service" program.
Grocery 18.00% $6,510 $338,514 Natural & organic products.
Frozen 3.00% $1,085 $56,419 Limited variety; upside w/signature Paul's product.
Dairy 5.00% $1,808 $94,032 Doors and open multi-deck case.
Burger's Meat 15.00% $5,425 $282,095 Challenging service department potential especially against Cosentino's Market Site 2000 if developed.
Total 100.00% $36,166 $1,880,632 First year.
Market Share 1.42% Second Year = $39,820 $9.82/sf
Store Size 4,000 sf Third Year = $42,212 $10.55/sf
$/SF Productivity $9.04

Louisville, Kentucky Retail Food Market Survey Update #LDDC102 3-10-14 P a g e | 12
Keith Wicks & Associates
Keith Wicks & Associates Office...952.953.0993
Cell...612.868.9871
Fax…952.953.0152
15008 Keller Lake Drive
Minneapolis, MN 55306
Notes regarding Paul’s upside options and changes to the assumed retail model
1. Paul’s doesn’t sell beer but which can be considered for this uptrend market especially if
Berger’s sales goal isn’t feasible thereby replacing that space with a beer department.
2. If Burger’s sales goal isn’t feasible then it’s assumed that this store would instead offer
frozen, fresh meat product (limited variety).
3. Frozen food sales goal is very conservative but could become much more significant
with a Paul’s signature, frozen product program (i.e., oven-ready products).
4. Prepared foods business potential benefits with café seating however that is developed
with indoor and patio options.
5. Paul’s is a known retailer in the metro and more specifically at the metro’s east side,
and NuLu is an emerging and spotlighted commercial district, but this is a start-up
convenience retail location and it will rely on strong initial marketing for convenience
trade and drawing business from the neighboring communities of Clifton and Highlands.
THREE YEAR SALES GROWTH FORECAST -- PAUL'S NULU SITE 1000
Facility Map Key = 1000 Sep 2016
Sales Forecast
Weekly Sales /SqFt
1st Year 36,166 9.04
2nd Year 39,280 9.82
3rd Year 42,212 10.55
Inflation is 2%
EXPLANATION OF SALES FORECAST
Paul's Fruit Mkt ------------Sales Transfer------------- --Total Transfer--
Map Key 1000 Sep 2016 Percent Sep 2017 Sep 2018 Sales Percent
Related Stores 20,708 57.26 770 575 22,053 52.24
Population 566 1.57 608 638 1,813 4.29
Inflation 425 1.18 490 546 1,461 3.46
Float 0 0.00 0 0 0 0.00
Outside Trade Area 14,466 40.00 1,246 1,173 16,885 40.00
Total 36,166 100.00 3,114 2,932 42,212 100.00
Cumulative 36,166 39,280 42,212
Related Stores ------------Sales Transfer------------ -Total Transfer-
Map Key Name Sep 2016 Percent Sep 2017 Sep 2018 Sales Percent
1 Save-A-Lot -797 -1.47 -30 -22 -849 -1.56
2 WM Nbhd Mkt -479 -1.37 -18 -13 -510 -1.46
3 Value Market -2,023 -1.50 -75 -56 -2,155 -1.59
224 Kroger -5,433 -2.20 -198 -148 -5,780 -2.34
327 Kroger -2,059 -2.49 -78 -58 -2,195 -2.66
348 Kroger 0 0.00 0 0 0 -2.66
348.1 Kroger -5,576 -1.86 -209 -156 -5,942 -1.98
753 Kroger -4,341 -1.68 -162 -121 -4,623 -1.79
Total -20,708 -1.86 -770 -575 -22,053 -1.98
Cumulative -20,708 -21,478 -22,053

Louisville, Kentucky Retail Food Market Survey Update #LDDC102 3-10-14 P a g e | 13
Keith Wicks & Associates
Keith Wicks & Associates Office...952.953.0993
Cell...612.868.9871
Fax…952.953.0152
15008 Keller Lake Drive
Minneapolis, MN 55306
Scenario 2 – Cosentino’s Cordish Site 2000 opens 1st Qtr. 2016 – the mixed-use plan reportedly
will take up to three years to develop so the actual timeline to Cosentino’s Market opening
could extend out another twelve months. This survey projects an optimistic timeline of 24-
months to opening which in effect makes the forecast conservative regarding inflation and
market growth in that additional time.
Site 2000 is a startup, convenience retail location which along with an unknown retailer can
cause a lean first year performance and extended timeline for business development, over the
typical supermarket’ three year timeline to business maturation in a new location.
However, Downtown Louisville’s business sectors density along with the proposed dynamic of
the Cordish plan and Cosentino’s retail expertise is judged to develop good short-term market
awareness and sales achievement.
Another supportive point of Scenario 2’s potential is Downtown’s substantial in-process,
planned and proposed major development projects. Daytime demand is already an exceptional
business sector with impressive planned growth surrounding this site.
Downtown’s housing units are projected to double in this decade including the 200 planned
apartments at Site 2000. Plans and logistics to this site are to be determined yet make this
market position a long-term growth opportunity. And Site 2000 is assumed to be connected to
Downtown’s skywalk system.

Louisville, Kentucky Retail Food Market Survey Update #LDDC102 3-10-14 P a g e | 14
Keith Wicks & Associates
Keith Wicks & Associates Office...952.953.0993
Cell...612.868.9871
Fax…952.953.0152
15008 Keller Lake Drive
Minneapolis, MN 55306
25,000 SF COSENTINO'S MARKET SITE 2000
First-Pass Estimates of Forecast & Break Down by Retail Department
Department Distri-bution
Weekly Sales
Annual Sales
Comments
Prepared Food 20.00% $46,201 $2,402,473 Aggressive distribution forecast & in line with potential & the "Market" model. Potential in the scaled down store size is dependent on details.
Bakery 4.50% $10,395 $540,556 On-premise baking; Euro breads, pastries, deserts.
Coffee bar 3.00% $6,930 $360,371 Branded coffeehouse; see note below.
Produce 15.00% $34,651 $1,801,855 W/salad bar.
Floral & Gifts 1.50% $3,465 $180,185 Considers daytime demand including hospitals.
Meat & Seafood 11.00% $25,411 $1,321,360 Featuring service along with convenient self-serve.
Grocery 29.00% $66,992 $3,483,586 Natural & organic products.
Frozen 5.00% $11,550 $600,618
Dairy 7.00% $16,170 $840,865
Beer 4.00% $9,240 $480,495 Craft beer featured set.
Total 100.00% $231,007 $12,012,364 First year end.
Market Share 1.42% Second Year = $248,630 $9.95/sf
Total Store SF 25,000 Third Year = $265,345 $10.61/sf
$/SF Productivity $9.24
Notes regarding Cosentino’s upside options and changes to the assumed retail model
1. This forecast is very dependent on details of the plan with regard to the scaled down
model, prepared foods formatting, site presentations and shopping support factors. It’s
judged to be a fair forecast more so with upside as opposed to downside issues.
2. Recommending Cosentino’s leverage Italian and International themes in variety,
features and signatures with that this metro has no other specialty grocer of that
character, which strengthens potential for extended reach; a difference-maker.
3. A branded coffee bar is assumed even though the KC store doesn’t appear to have one.
But this is fitting for this market and as a replacement feature with KY not allowing a
liquor lounge as the KC store features.
4. Catering is add-on sales to this forecast due to the KC store offering a full-service
program which needs to be defined for this situation.

Louisville, Kentucky Retail Food Market Survey Update #LDDC102 3-10-14 P a g e | 15
Keith Wicks & Associates
Keith Wicks & Associates Office...952.953.0993
Cell...612.868.9871
Fax…952.953.0152
15008 Keller Lake Drive
Minneapolis, MN 55306
THREE YEAR SALES GROWTH FORECAST
SCENARIO 2 -- COSENTINO'S CORDISH SITE 2000
Facility Map Key = 2000 Mar 2017
Sales Forecast
Weekly Sales /SqFt
1st Year 231,007 9.24
2nd Year 248,630 9.95
3rd Year 265,345 10.61
Inflation is 2%
EXPLANATION OF SALES FORECAST
Cosentino's Mkt ------------Sales Transfer------------- --Total Transfer--
Map Key 2000 Mar 2017 Percent Mar 2018 Mar 2019 Sales Percent
Related Stores 143,229 62.00 3,895 2,867 149,990 56.53
Population 3,981 1.72 4,229 4,326 12,536 4.72
Inflation 2,944 1.27 3,331 3,672 9,948 3.75
Float 0 0.00 0 0 0 0.00
Outside Trade Area 80,852 35.00 6,168 5,850 92,871 35.00
Total 231,007 100.00 17,623 16,716 265,345 100.00
Cumulative 231,007 248,630 265,345
Related Stores ------------Sales Transfer------------ -Total Transfer-
Map Key Name Mar 2017 Percent Mar 2018 Mar 2019 Sales Percent
1 Save-A-Lot -4,990 -9.78 -157 -116 -5,263 -10.31
2 WM Nbhd Mkt -2,175 -6.45 -67 -50 -2,292 -6.79
3 Value Market -4,849 -3.60 -158 -117 -5,125 -3.80
224 Kroger -15,318 -6.35 -431 -318 -16,067 -6.66
327 Kroger -28,442 -49.89 -641 -468 -29,551 -51.83
348 Kroger 0 0.00 0 0 0 -51.83
348.1 Kroger -63,386 -25.66 -1,716 -1,263 -66,365 -26.87
753 Kroger -24,069 -9.94 -724 -535 -25,328 -10.46
Total -143,229 -14.22 -3,895 -2,867 -149,990 -14.89
Cumulative -143,229 -147,123 -149,990

Louisville, Kentucky Retail Food Market Survey Update #LDDC102 3-10-14 P a g e | 16
Keith Wicks & Associates
Keith Wicks & Associates Office...952.953.0993
Cell...612.868.9871
Fax…952.953.0152
15008 Keller Lake Drive
Minneapolis, MN 55306
Scenario 3 – Two-stores opened 1st Qtr. 2016
Opening both locations makes sense for two reasons:
1. Two stores bring a convenient network of retail food service for the broad Downtown market in support of the existing and planned business sectors including housing.
2. The two retail models are each significant and unique anchors for their respective business settings.
TWO-STORES OPENED 1ST QTR 2016
Scenario Store Size Sales Forecast $/SF Productivity Market Share
1 – Paul’s NuLu
Site 1000
4,000 sf $30,654 $7.66 1.18%
2 – Cosentino’s
Cordish Site 2000
25,000 sf $229,428 $9.18 9.56%
The downside to opening stores in both locations is that the sites are 0.9 mile apart so that
their convenience trade areas do overlap. The effect has minor impact on Cosentino’s sales
forecast but does lower Paul’s forecast about -10% more so taking grocery potential.
The two-store strategy further emphasizes the importance of prepared foods strategy for Paul’s
in the NuLu situation, which can minimize if not erase that impact. For example, in this
scenario Berger’s Meats isn’t recommended against Cosentino’s meat services so that space
could be replaced with prepared foods and related services.
Louisville, Kentucky Retail Food Market Survey Update #LDDC102 3-10-14 P a g e | 17
Keith Wicks & Associates
Keith Wicks & Associates Office...952.953.0993
Cell...612.868.9871
Fax…952.953.0152
15008 Keller Lake Drive
Minneapolis, MN 55306
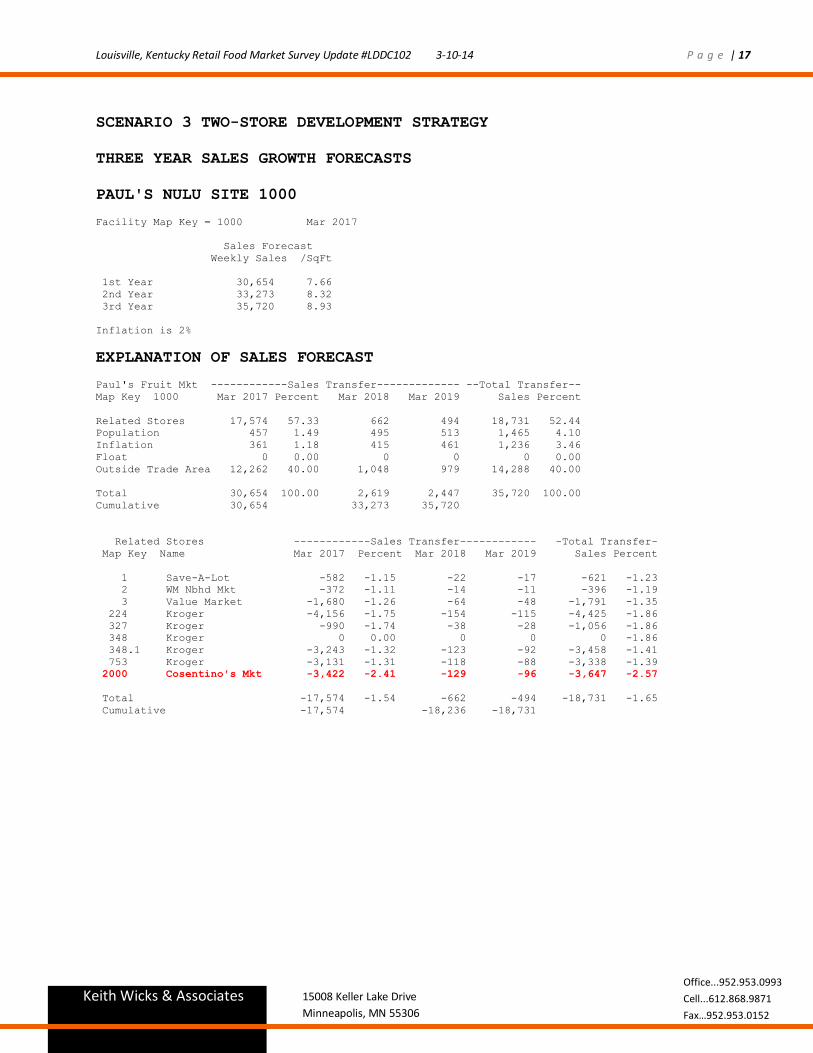
SCENARIO 3 TWO-STORE DEVELOPMENT STRATEGY
THREE YEAR SALES GROWTH FORECASTS
PAUL'S NULU SITE 1000
Facility Map Key = 1000 Mar 2017
Sales Forecast
Weekly Sales /SqFt
1st Year 30,654 7.66
2nd Year 33,273 8.32
3rd Year 35,720 8.93
Inflation is 2%
EXPLANATION OF SALES FORECAST
Paul's Fruit Mkt ------------Sales Transfer------------- --Total Transfer--
Map Key 1000 Mar 2017 Percent Mar 2018 Mar 2019 Sales Percent
Related Stores 17,574 57.33 662 494 18,731 52.44
Population 457 1.49 495 513 1,465 4.10
Inflation 361 1.18 415 461 1,236 3.46
Float 0 0.00 0 0 0 0.00
Outside Trade Area 12,262 40.00 1,048 979 14,288 40.00
Total 30,654 100.00 2,619 2,447 35,720 100.00
Cumulative 30,654 33,273 35,720
Related Stores ------------Sales Transfer------------ -Total Transfer-
Map Key Name Mar 2017 Percent Mar 2018 Mar 2019 Sales Percent
1 Save-A-Lot -582 -1.15 -22 -17 -621 -1.23
2 WM Nbhd Mkt -372 -1.11 -14 -11 -396 -1.19
3 Value Market -1,680 -1.26 -64 -48 -1,791 -1.35
224 Kroger -4,156 -1.75 -154 -115 -4,425 -1.86
327 Kroger -990 -1.74 -38 -28 -1,056 -1.86
348 Kroger 0 0.00 0 0 0 -1.86
348.1 Kroger -3,243 -1.32 -123 -92 -3,458 -1.41
753 Kroger -3,131 -1.31 -118 -88 -3,338 -1.39
2000 Cosentino's Mkt -3,422 -2.41 -129 -96 -3,647 -2.57
Total -17,574 -1.54 -662 -494 -18,731 -1.65
Cumulative -17,574 -18,236 -18,731

Louisville, Kentucky Retail Food Market Survey Update #LDDC102 3-10-14 P a g e | 18
Keith Wicks & Associates
Keith Wicks & Associates Office...952.953.0993
Cell...612.868.9871
Fax…952.953.0152
15008 Keller Lake Drive
Minneapolis, MN 55306
COSENTINO'S CORDISH SITE 2000
Facility Map Key = 2000 Mar 2017
Sales Forecast
Weekly Sales /SqFt
1st Year 229,428 9.18
2nd Year 246,935 9.88
3rd Year 263,533 10.54
Inflation is 2%
EXPLANATION OF SALES FORECAST
Cosentino's Mkt ------------Sales Transfer------------- --Total Transfer--
Map Key 2000 Mar 2017 Percent Mar 2018 Mar 2019 Sales Percent
Related Stores 142,271 62.01 3,892 2,866 149,029 56.55
Population 3,933 1.71 4,179 4,276 12,388 4.70
Inflation 2,924 1.27 3,309 3,647 9,880 3.75
Float 0 0.00 0 0 0 0.00
Outside Trade Area 80,300 35.00 6,128 5,809 92,237 35.00
Total 229,428 100.00 17,508 16,598 263,533 100.00
Cumulative 229,428 246,935 263,533
Related Stores ------------Sales Transfer------------ -Total Transfer-
Map Key Name Mar 2017 Percent Mar 2018 Mar 2019 Sales Percent
1 Save-A-Lot -4,832 -9.60 -153 -113 -5,099 -10.13
2 WM Nbhd Mkt -2,086 -6.26 -65 -48 -2,199 -6.60
3 Value Market -4,510 -3.39 -149 -111 -4,769 -3.59
224 Kroger -14,043 -5.93 -396 -292 -14,731 -6.22
327 Kroger -27,507 -49.35 -623 -455 -28,585 -51.29
348 Kroger 0 0.00 0 0 0 -51.29
348.1 Kroger -61,558 -25.34 -1,678 -1,235 -64,470 -26.54
753 Kroger -23,066 -9.67 -700 -518 -24,285 -10.18
1000 Paul's NuLu Mkt -4,669 -26.90 -128 -94 -4,891 -28.18
Total -142,271 -14.11 -3,892 -2,866 -149,029 -14.78
Cumulative -142,271 -146,163 -149,029

Louisville, Kentucky Retail Food Market Survey Update #LDDC102 3-10-14 P a g e | 19
Keith Wicks & Associates
Keith Wicks & Associates Office...952.953.0993
Cell...612.868.9871
Fax…952.953.0152
15008 Keller Lake Drive
Minneapolis, MN 55306
Original Survey Competitor Assessment; March 2013
Map
Market Key Store TSQFT Sales $/SF Draw* $ in T.A. Share
348 Kroger Food & Drug 26,000 $285,000 $10.96 90% $256,500 19.40%
924 S. 2nd Street
1 Save A Lot 17,000 $85,000 $5.00 50% $42,500 3.86%
1311 S. Shelby St.
2 Walmart Nbhd. Mkt. 40,000 $325,000 $8.13 10% $32,500 2.46%
3101 Poplar Level Rd w/pharmacy
3 Value Market 30,000 $250,000 $8.33 50% $125,000 9.45%
1250 Bardstown Road
224 Kroger Fd, Drug & Fuel 39,000 $520,000 $13.33 18% $92,040 17.70%
2200 Brownsboro Rd w/pharmacy
327 Kroger Food & Drug 47,000 $530,000 $11.28 10% $53,000 6.01%
2710 W. Broadway w/pharmacy
753 Kroger Food & Drug 69,000 $700,000 $10.14 10% $70,000 18.27%
1265 Goss Avenue w/pharmacy
7 Competitors Totals 268,000 $2,695,000 $10.06 n/a $671,540 77.15%
Competitors Averages 38,286 $385,000 $10.06 n/a $95,934 11.02%
Total Float $ $302,141 22.85%
Total Market Potential $1,322,141 100.00%
Louisville, Kentucky Retail Food Market Survey Update #LDDC102 3-10-14 P a g e | 20
Keith Wicks & Associates
Keith Wicks & Associates Office...952.953.0993
Cell...612.868.9871
Fax…952.953.0152
15008 Keller Lake Drive
Minneapolis, MN 55306
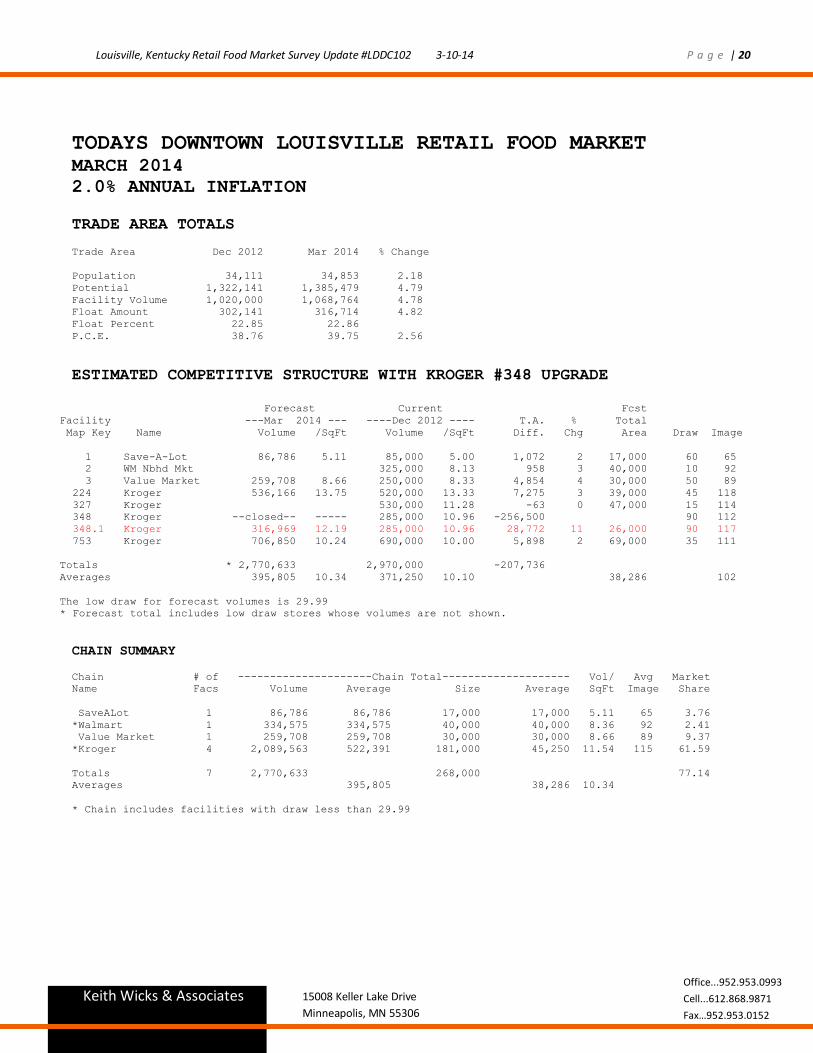
TODAYS DOWNTOWN LOUISVILLE RETAIL FOOD MARKET MARCH 2014
2.0% ANNUAL INFLATION
TRADE AREA TOTALS
Trade Area Dec 2012 Mar 2014 % Change
Population 34,111 34,853 2.18
Potential 1,322,141 1,385,479 4.79
Facility Volume 1,020,000 1,068,764 4.78
Float Amount 302,141 316,714 4.82
Float Percent 22.85 22.86
P.C.E. 38.76 39.75 2.56
ESTIMATED COMPETITIVE STRUCTURE WITH KROGER #348 UPGRADE
Forecast Current Fcst
Facility ---Mar 2014 --- ----Dec 2012 ---- T.A. % Total
Map Key Name Volume /SqFt Volume /SqFt Diff. Chg Area Draw Image
1 Save-A-Lot 86,786 5.11 85,000 5.00 1,072 2 17,000 60 65
2 WM Nbhd Mkt 325,000 8.13 958 3 40,000 10 92
3 Value Market 259,708 8.66 250,000 8.33 4,854 4 30,000 50 89
224 Kroger 536,166 13.75 520,000 13.33 7,275 3 39,000 45 118
327 Kroger 530,000 11.28 -63 0 47,000 15 114
348 Kroger --closed-- ----- 285,000 10.96 -256,500 90 112
348.1 Kroger 316,969 12.19 285,000 10.96 28,772 11 26,000 90 117
753 Kroger 706,850 10.24 690,000 10.00 5,898 2 69,000 35 111
Totals * 2,770,633 2,970,000 -207,736
Averages 395,805 10.34 371,250 10.10 38,286 102
The low draw for forecast volumes is 29.99
* Forecast total includes low draw stores whose volumes are not shown.
CHAIN SUMMARY
Chain # of ---------------------Chain Total-------------------- Vol/ Avg Market
Name Facs Volume Average Size Average SqFt Image Share
SaveALot 1 86,786 86,786 17,000 17,000 5.11 65 3.76
*Walmart 1 334,575 334,575 40,000 40,000 8.36 92 2.41
Value Market 1 259,708 259,708 30,000 30,000 8.66 89 9.37
*Kroger 4 2,089,563 522,391 181,000 45,250 11.54 115 61.59
Totals 7 2,770,633 268,000 77.14
Averages 395,805 38,286 10.34
* Chain includes facilities with draw less than 29.99

Louisville, Kentucky Retail Food Market Survey Update #LDDC102 3-10-14 P a g e | 21
Keith Wicks & Associates
Keith Wicks & Associates Office...952.953.0993
Cell...612.868.9871
Fax…952.953.0152
15008 Keller Lake Drive
Minneapolis, MN 55306
MARKET POTENTIAL BY POPULATION SECTOR MARCH 2014
Sector -----Mar 2014----- -------Float-------
Map Key Population PCE Potential Percent Amount
1 806 37.67 30,358 21.74 6,601
2 983 33.70 33,127 22.04 7,300
3 790 36.25 28,637 19.83 5,678
4 833 39.73 33,095 18.31 6,060
5 1,315 43.41 57,083 19.52 11,140
6 867 36.13 31,325 14.03 4,396
7 498 32.70 16,283 19.43 3,164
8 1,017 43.88 44,629 20.56 9,175
9 1,144 41.79 47,807 20.68 9,885
10 982 32.27 31,686 21.43 6,790
11 1,512 32.33 48,884 20.01 9,784
12 1,571 29.67 46,614 22.86 10,655
13 1,191 36.73 43,744 17.27 7,556
14 870 36.74 31,963 24.57 7,853
15 754 32.46 24,473 19.51 4,776
16 1,291 32.55 42,018 23.69 9,956
17 1,717 38.89 66,780 26.13 17,448
18 809 39.84 32,230 20.79 6,700
19 1,028 41.40 42,557 23.61 10,047
20 862 43.17 37,217 20.74 7,719
21 772 43.20 33,350 25.83 8,615
22 904 47.88 43,288 24.88 10,769
23 1,102 45.18 49,792 27.00 13,443
24 713 43.73 31,183 24.30 7,578
25 879 46.00 40,433 26.06 10,535
26 929 47.95 44,546 26.59 11,843
27 1,208 47.38 57,238 27.33 15,643
28 2,425 38.67 93,780 26.91 25,238
29 932 45.08 42,014 28.40 11,933
30 973 43.95 42,761 25.85 11,054
31 1,172 44.39 52,026 21.98 11,435
32 882 42.14 37,168 21.97 8,167
33 1,122 42.24 47,390 16.41 7,778
Total 34,853 1,385,479 316,714
Average 39.75 22.86

Louisville, Kentucky Retail Food Market Survey Update #LDDC102 3-10-14 P a g e | 22
Keith Wicks & Associates
Keith Wicks & Associates Office...952.953.0993
Cell...612.868.9871
Fax…952.953.0152
15008 Keller Lake Drive
Minneapolis, MN 55306
SCENARIO 1 PAUL’S NULU SITE 1000 18-MONTHS TO STORE OPENING SEPTEMBER 2015
FIRST YEAR END FORECAST SEPTEMBER 2016
TRADE AREA TOTALS
Trade Area Dec 2012 Sep 2016 % Change
Population 34,111 36,560 7.18
Potential 1,322,141 1,529,507 15.68
Facility Volume 1,020,000 1,179,910 15.68
Float Amount 302,141 349,597 15.71
Float Percent 22.85 22.86
P.C.E. 38.76 41.84 7.93
COMPETITIVE STRUCTURE WITH PAUL’S NULU SITE 1000
Forecast Current Fcst
Facility ---Sep 2016 --- ----Dec 2012 ---- T.A. % Total
Map Key Name Volume /SqFt Volume /SqFt Diff. Chg Area Draw Image
1 Save-A-Lot 94,240 5.54 85,000 5.00 5,544 11 17,000 60 65
2 WM Nbhd Mkt 325,000 8.13 3,690 11 40,000 10 92
3 Value Market 280,662 9.36 250,000 8.33 15,331 12 30,000 50 89
224 Kroger 568,509 14.58 520,000 13.33 21,829 9 39,000 45 118
327 Kroger 530,000 11.28 6,761 9 47,000 15 114
348 Kroger --closed-- ----- 285,000 10.96 -256,500 90 112
348.1 Kroger 349,788 13.45 285,000 10.96 58,309 23 26,000 90 117
753 Kroger 766,415 11.11 690,000 10.00 26,745 11 69,000 35 111
1000 Paul's NuLu Mkt 36,166 9.04 0 0.00 21,700 0 4,000 60 80
Totals * 3,032,758 2,970,000 -96,591
Averages 379,095 11.15 371,250 10.10 34,000 100
Forecast total includes low draw stores whose volumes are not shown.
NEW CHAIN REPORT
Chain # of ---------------------Chain Total-------------------- Vol/ Avg Market
Name Facs Volume Average Size Average SqFt Image Share
SaveALot 1 94,240 94,240 17,000 17,000 5.54 65 3.70
*Walmart 1 361,903 361,903 40,000 40,000 9.05 92 2.37
Value Market 1 280,662 280,662 30,000 30,000 9.36 89 9.17
*Kroger 4 2,259,787 564,947 181,000 45,250 12.49 115 60.49
Paul's Markets 1 36,166 36,166 4,000 4,000 9.04 80 1.42
Totals 8 3,032,758 272,000 77.14
Averages 379,095 34,000 11.15
* Chain includes facilities with draw less than 29.99
COMPETITORS NEW MARKET SHARES
Facility -----Sep 2016 -----
Map Key Name M.S. Volume
1 Save-A-Lot 3.70 56,544
2 WM Nbhd Mkt 2.37 36,190
3 Value Market 9.17 140,331
224 Kroger 16.73 255,829
327 Kroger 5.64 86,261
348.1 Kroger 20.58 314,809
753 Kroger 17.54 268,245
1000 Paul's NuLu Mkt 1.42 21,700
Totals 77.14 1,179,910

Louisville, Kentucky Retail Food Market Survey Update #LDDC102 3-10-14 P a g e | 23
Keith Wicks & Associates
Keith Wicks & Associates Office...952.953.0993
Cell...612.868.9871
Fax…952.953.0152
15008 Keller Lake Drive
Minneapolis, MN 55306
SCENARIO 2 COSENTINO’S CORDISH SITE 2000 24-MONTHS TO STORE OPENING MARCH 2016
FIRST YEAR END FORECAST MARCH 2017
TRADE AREA TOTALS
Trade Area Dec 2012 Mar 2017 % Change
Population 34,111 36,902 8.18
Potential 1,322,141 1,559,651 17.96
Facility Volume 1,020,000 1,203,175 17.96
Float Amount 302,141 356,476 17.98
Float Percent 22.85 22.86
P.C.E. 38.76 42.26 9.04
COMPETITIVE STRUCTURE WITH COSENTINO’S CORDISH SITE 2000
Forecast Current Fcst
Facility ---Mar 2017 --- ----Dec 2012 ---- T.A. % Total
Map Key Name Volume /SqFt Volume /SqFt Diff. Chg Area Draw Image
1 Save-A-Lot 88,780 5.22 85,000 5.00 2,268 4 17,000 60 65
2 WM Nbhd Mkt 325,000 8.13 2,591 8 40,000 10 92
3 Value Market 279,998 9.33 250,000 8.33 14,999 12 30,000 50 89
224 Kroger 554,978 14.23 520,000 13.33 15,740 7 39,000 45 118
327 Kroger 530,000 11.28 -18,880 -24 47,000 15 114
348 Kroger --closed-- ----- 285,000 10.96 -256,500 90 112
348.1 Kroger 290,447 11.17 285,000 10.96 4,903 2 26,000 90 117
753 Kroger 722,568 10.47 690,000 10.00 11,399 5 69,000 35 111
2000 Cosentino's Mkt 231,007 9.24 0 0.00 150,155 0 25,000 65 90
Totals * 2,922,827 2,970,000 -73,325
Averages 365,353 9.98 371,250 10.10 36,625 101
* Forecast total includes low draw stores whose volumes are not shown.
NEW CHAIN REPORT
Chain # of ---------------------Chain Total-------------------- Vol/ Avg Market
Name Facs Volume Average Size Average SqFt Image Share
SaveALot 1 88,780 88,780 17,000 17,000 5.22 65 3.42
*Walmart 1 350,914 350,914 40,000 40,000 8.77 92 2.25
Value Market 1 279,998 279,998 30,000 30,000 9.33 89 8.98
*Kroger 4 1,972,127 493,032 181,000 45,250 10.90 115 52.87
Cosentino's 1 231,007 231,007 25,000 25,000 9.24 90 9.63
Totals 8 2,922,826 293,000 77.14
Averages 365,353 36,625 9.98
* Chain includes facilities with draw less than 29.99
COMPETITORS NEW MARKET SHARES
Facility -----Mar 2017 -----
Map Key Name M.S. Volume
1 Save-A-Lot 3.42 53,268
2 WM Nbhd Mkt 2.25 35,091
3 Value Market 8.98 139,999
224 Kroger 16.01 249,740
327 Kroger 3.89 60,620
348.1 Kroger 16.76 261,403
753 Kroger 16.22 252,899
2000 Cosentino's Mkt 9.63 150,155
Totals 77.14 1,203,175

Louisville, Kentucky Retail Food Market Survey Update #LDDC102 3-10-14 P a g e | 24
Keith Wicks & Associates
Keith Wicks & Associates Office...952.953.0993
Cell...612.868.9871
Fax…952.953.0152
15008 Keller Lake Drive
Minneapolis, MN 55306
SCENARIO 3 -- TWO NEW STORES STRATEGY 24-MONTHS TO STORES OPENING MARCH 2016
FIRST YEAR END FORECAST MARCH 2017
COMPETITIVE STRUCTURE WITH PAUL’S NULU SITE 1000 AND COSENTINO’S
CORDISH SITE 2000
Forecast Current Fcst
Facility ---Mar 2017 --- ----Dec 2012 ---- T.A. % Total
Map Key Name Volume /SqFt Volume /SqFt Diff. Chg Area Draw Image
1 Save-A-Lot 87,556 5.15 85,000 5.00 1,534 3 17,000 60 65
2 WM Nbhd Mkt 325,000 8.13 2,147 7 40,000 10 92
3 Value Market 276,187 9.21 250,000 8.33 13,093 10 30,000 50 89
224 Kroger 544,615 13.96 520,000 13.33 11,077 5 39,000 45 118
327 Kroger 530,000 11.28 -20,249 -25 47,000 15 114
348 Kroger --closed-- ----- 285,000 10.96 -256,500 90 112
348.1 Kroger 285,545 10.98 285,000 10.96 490 0 26,000 90 117
753 Kroger 711,607 10.31 690,000 10.00 7,562 3 69,000 35 111
1000 Paul's NuLu Mkt 30,654 7.66 0 0.00 18,393 0 4,000 60 80
2000 Cosentino's Mkt 229,428 9.18 0 0.00 149,128 0 25,000 65 90
Totals * 2,907,068 2,970,000 -73,325
Averages 323,008 9.79 371,250 10.10 33,000 99
The low draw for forecast volumes is 29.99
* Forecast total includes low draw stores whose volumes are not shown.
NEW CHAIN REPORT
Chain # of ---------------------Chain Total-------------------- Vol/ Avg Market
Name Facs Volume Average Size Average SqFt Image Share
SaveALot 1 87,556 87,556 17,000 17,000 5.15 65 3.37
*Walmart 1 346,469 346,469 40,000 40,000 8.66 92 2.22
Value Market 1 276,187 276,187 30,000 30,000 9.21 89 8.85
*Kroger 4 1,936,775 484,194 181,000 45,250 10.70 115 51.96
Paul's Markets 1 30,654 30,654 4,000 4,000 7.66 80 1.18
Cosentino's 1 229,428 229,428 25,000 25,000 9.18 90 9.56
Totals 9 2,907,068 297,000 77.14
Averages 323,008 33,000 9.79
* Chain includes facilities with draw less than 29.99
COMPETITORS NEW MARKET SHARES
Facility -----Mar 2017 -----
Map Key Name M.S. Volume
1 Save-A-Lot 3.37 52,534
2 WM Nbhd Mkt 2.22 34,647
3 Value Market 8.85 138,093
224 Kroger 15.71 245,077
327 Kroger 3.80 59,251
348.1 Kroger 16.48 256,990
753 Kroger 15.97 249,062
1000 Paul's NuLu Mkt 1.18 18,393
2000 Cosentino's Mkt 9.56 149,128
Totals 77.14 1,203,175

Louisville, Kentucky Retail Food Market Survey Update #LDDC102 3-10-14 P a g e | 25
Keith Wicks & Associates
Keith Wicks & Associates Office...952.953.0993
Cell...612.868.9871
Fax…952.953.0152
15008 Keller Lake Drive
Minneapolis, MN 55306
(Kansas City store opening review) Cosentino’s Market Downtown W RI T T E N BY : M A RY B LO C H - JU N• 01 • 1 2
If you haven’t already explored Cosentino’s Market downtown, treat
yourself to the experience. Regardless of whether you live or work
downtown, it’s worth the drive. A grocery store was the missing link
to entice people to live downtown, and Cosentino’s (the same family
that brought us the Brookside Market) really did it right.
Among other features, it has a salad bar that doesn’t quit, made-to-order
sandwiches, a coffee bar with Kansas City’s own Roasterie, pizza and
pasta, a bakery and pre-prepared foods for carry-out. And then there is
the sushi bar by Kaiyo. Kaiyo is my favorite sushi restaurant in Kansas
City, and David Loo travels from his Leawood outpost to prepare sushi
at lunchtime for downtowners who stop in. If you’re lucky, there will be
leftovers in the display case to take home for dinner.
If you’re a beer lover, you’ll be thrilled with the vast selection of
brews from around the country and world. There are very fine wine
labels to choose from, too–worthy of a picnic or romantic dinner.
If you’d rather eat your meal in the store, there’s tons of table seating (within store and on 2nd
level).
Many people think parking is a problem. Far from it. Drive into the parking garage off Main, just north of
13th St. There’s a door from the garage into a corridor that leads to the grocery store. The store will validate
your parking ticket and an elevator makes it easy to get your cart full of groceries to the car. Piece of cake.

Louisville, Kentucky Retail Food Market Survey Update #LDDC102 3-10-14 P a g e | 26
Keith Wicks & Associates
Keith Wicks & Associates Office...952.953.0993
Cell...612.868.9871
Fax…952.953.0152
15008 Keller Lake Drive
Minneapolis, MN 55306
Omni, Cordish partner with Kentucky, Louisville on $261 million downtown hotel, grocery store Mar. 7, 2014 |
The Courier-Journal, Written by Sheldon S. Shafer
Downtown hotel
A city block in the heart of Louisville’s downtown will see a 600-room luxury hotel, a major grocery
store, retail stores and 200 apartments — all part of a $261 million project announced Thursday.
Louisville and Kentucky are joining with Omni Hotels & Resorts and the Cordish Co., which runs 4th
Street Live!, to build the massive project within three years on the Louisville Water Co. block — owned
by the city and bounded by Second, Third and Liberty streets and Muhammad Ali Boulevard.
The project’s cost will be split between the public and private partners, with $105 million from Omni,
$30 million from Cordish and $126 million from the city and state, according to Gov. Steve Beshear and
Mayor Greg Fischer, who were joined Thursday by Nick Benjamin, Cordish’s director of development,
and by Mike Garcia, Omni CFO and senior vice president of development.
“This project is a major infusion in our downtown and to the city’s entire economy,” Fischer said.
“It will create jobs, both temporary construction positions and permanent jobs, and it will boost our
convention and tourism industry as Omni provides a new level of luxury hotel.”
Each parties’ obligations include:
• Omni will build the hotel, which will be adjacent to 200 apartments that Cordish will develop.
• The state will contribute $90.5 million through tax rebates.
• The city will contribute $35.5 million. That includes the $17 million value of the land, which the city
purchased years ago, and another $17 million the city will spend to construct a parking garage that will
be paid for with Parking Authority bonds . The city also will provide $1.5 million for contingencies.
• A financing district will be created within the block and part of an adjoining block, with a portion of the
new tax revenue helping to finance the development.
The block holds several historic buildings, including the Morrissey Parking Garage, the Odd Fellows Hall,
the Falls City Theatre Equipment building and the former Louisville Water Co. building. Garcia said Omni
is sensitive to preservation issues.

Louisville, Kentucky Retail Food Market Survey Update #LDDC102 3-10-14 P a g e | 27
Keith Wicks & Associates
Keith Wicks & Associates Office...952.953.0993
Cell...612.868.9871
Fax…952.953.0152
15008 Keller Lake Drive
Minneapolis, MN 55306
Steve Rowland, the city’s chief finance officer, said the city will issue $104 million in bonds next year —
likely with a 30-year term — to provide the funds to build the project. Although the city will guarantee
the bonds, Rowland said he is confident that the project will generate enough tax revenue to cover the
debt.
The development will be among the largest projects under construction in the region. Construction is
anticipated to begin in 2015, with the entire project expected to open no later than 2017.
“This investment will be a catalyst for more convention activity, while bringing more out-of-state visitors
to Kentucky,” said Beshear. Fischer called it a catalyst for Louisville’s downtown revitalization.
Fischer said he had been negotiating the deal for more than a year, which is expected to create 1,350
construction jobs and 350 permanent positions.
Fischer said he is particularly pleased that downtown Louisville will get a new grocery store. “Citizens
and visitors have told us for years that a grocery was the biggest missing component to downtown,”
Fischer said.
The Omni Louisville Hotel will be the fourth four-diamond, luxury hotel in the area, and will feature 600
guestrooms and suites, 70,000 square feet of meeting space, a spa, fitness center, two full-service
restaurants, rooftop pool-side café, street level retail venue and a lobby lounge, according to the plans.
It will be the company’s first property in Kentucky.
The project will also include 44,000 square feet of retail, including a full-service, 30,000-square-foot
downtown grocery store. Those facilities will be developed by Cordish; the grocery operator has not
been signed, officials said.
An 850-space parking garage will be built to service the hotel, residential and retail/grocery and will be
developed by the Parking Authority of River City.
Metro Council President Jim King, D-10th District, said the council must approve the bond issue and the
creation of the tax district. But he expressed high confidence in Cordish, calling the development plans
“a home run.”
Fischer also praised Cordish, saying the company “stepped up, when no one else would.” Cordish has
been criticized in the past by some Metro Council members, who argued that the city had given the
company sweetheart deals that it hasn’t extended to other private businesses.
The public sector’s assistance is consistent with comparable developments in other major cities, officials
said.

Louisville, Kentucky Retail Food Market Survey Update #LDDC102 3-10-14 P a g e | 28
Keith Wicks & Associates
Keith Wicks & Associates Office...952.953.0993
Cell...612.868.9871
Fax…952.953.0152
15008 Keller Lake Drive
Minneapolis, MN 55306
Louisville has more than 4,000 hotel rooms in the downtown area, around 2,300 of which are linked by
the elevated walkway system with the Kentucky International Convention Center and the new KFC Yum!
Center.
Other hotels with a total of about 800 rooms in or near downtown are on the drawing board. And
several large suburban hotels are also in sight, including a long-planned 500-room luxury hotel on
Phillips Lane near Gate 1 to the Kentucky Exposition Center.
But officials said the Omni is needed. Fischer said the Omni will offer rooms to the more than one
million tourists expected to visit the Bourbon Trail this year.
And Karen Williams, acting CEO of the Louisville Convention & Visitors Bureau, called the Omni “a game
changer in Louisville’s chances of landing some of the major trade shows.
Linda Edwards, vice president of sales and marketing for the Kentucky State Fair Board, a primary local
convention recruiter, said another major hotel would help bring in new business, especially larger
conventions and groups considering use of both the Yum! Center and KICC, which may soon be in line
for a $175 million expansion and renovation.
Additional hotel rooms downtown, for instance, Edwards said, would save groups the cost of having to
shuttle delegates in from suburban properties.
The Dallas-based Omni has about 40 U.S. hotels, including ones in Nashville, Indianapolis and St. Louis.
Omni classifies about a dozen of the sites as resort properties.

Louisville, Kentucky Retail Food Market Survey Update #LDDC102 3-10-14 P a g e | 29
Keith Wicks & Associates
Keith Wicks & Associates Office...952.953.0993
Cell...612.868.9871
Fax…952.953.0152
15008 Keller Lake Drive
Minneapolis, MN 55306
Qualifier This report is furnished pursuant to a request by Louisville Downtown Development Corp. (client). The request is to update the original market survey dated March 2013. The client acknowledges that while they believe the services to be performed hereunder by Keith Wicks & Associates will be a valuable tool in management decision making it also understands that an important part of said services involves subjective judgment, which is dependent upon the correctness of the information made available to Keith Wicks & Associates. Therefore, the client further acknowledges its understanding that Keith Wicks & Associates does not guarantee any result from the use of the analysis or other services performed hereunder, not shall Keith Wicks & Associates be responsible for any loss incurred as a result of the use of said analysis or other services. Furthermore, these projections are based on the conditions identified in the original survey and the information made available for this update. Any deviation from the study assumptions or changes in economic conditions could cause significant variation between these projections and actual sales. The possibility of this occurring increases with time.

Louisville, Kentucky Retail Food Market Survey Update #LDDC102 3-10-14 P a g e | 30
Keith Wicks & Associates
Keith Wicks & Associates Office...952.953.0993
Cell...612.868.9871
Fax…952.953.0152
15008 Keller Lake Drive
Minneapolis, MN 55306
Update Source Data Louisville Downtown Development Corp., including a meeting with Clark Welch to review the sites in February 2014. Internet sources. Sites USA, demographics.