Embed Size (px)
Citation preview

Keep Up with the Trends and Best Practices of E-Billing Carlos Seoane, General Manager, eBillingHub
2 © Thomson Reuters, 2013
QUICK INTRODUCTORY NOTE
• eBillingHub does will not share any firm or client-specific information
• All data presented here refers to US or international firms who are currently using eBillingHub to submit their electronic bills
• The data shared in this presentation is a sampling of the data available within our system and should not be construed as being representative of any particular client or law firm.
• Copyright © Thomson Reuters, 2013. All Rights Reserved. No part of this document may be reproduced without Thomson Reuter's express consent.

3 © Thomson Reuters, 2013
BILLING STAFF
e-BILLING VENDORS CLIENT
T&B Syst
LAW FIRM
eBILLINGHUB
eBIllingHub takes a very central position in a firm’s eBilling process

4 © Thomson Reuters, 2013
eBILLINGHUB IN NUMBERS
1,909,776 eBills Processed in last 12 months
$19,600,000,000 dollars submitted
in the last 12 months
330+ Large Law Firms
3,500 Clients Mapped
4,600 Billing Professionals
Using the system
5 © Thomson Reuters, 2013
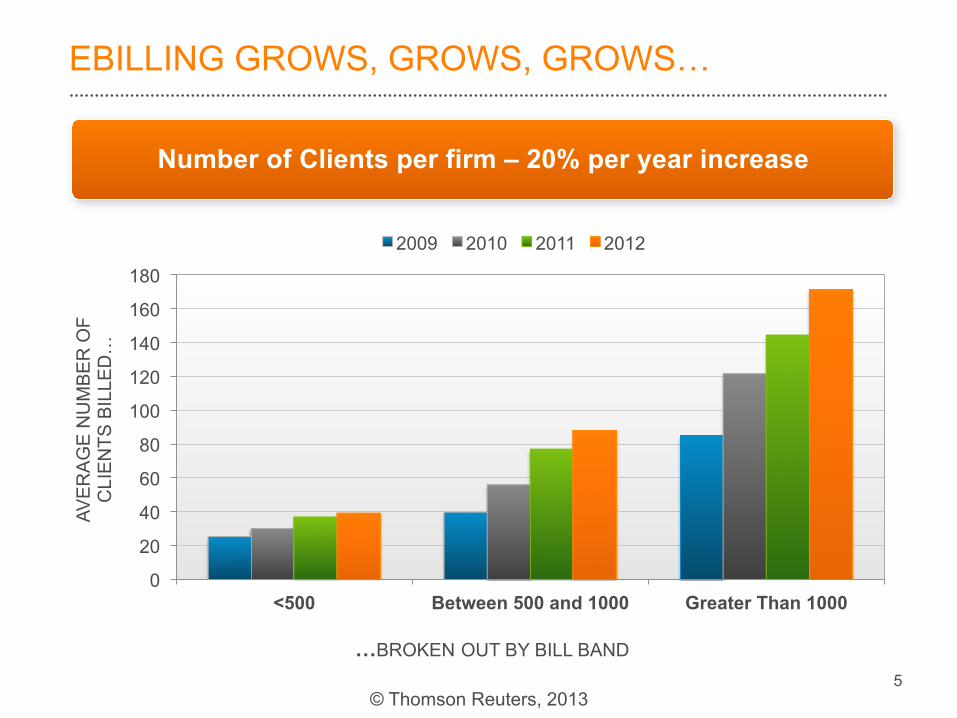
EBILLING GROWS, GROWS, GROWS… AV
ER
AG
E N
UM
BE
R O
F C
LIE
NTS
BIL
LED
…
…BROKEN OUT BY BILL BAND
0
20
40
60
80
100
120
140
160
180
<500 Between 500 and 1000 Greater Than 1000
2009 2010 2011 2012
Number of Clients per firm – 20% per year increase
6 © Thomson Reuters, 2013
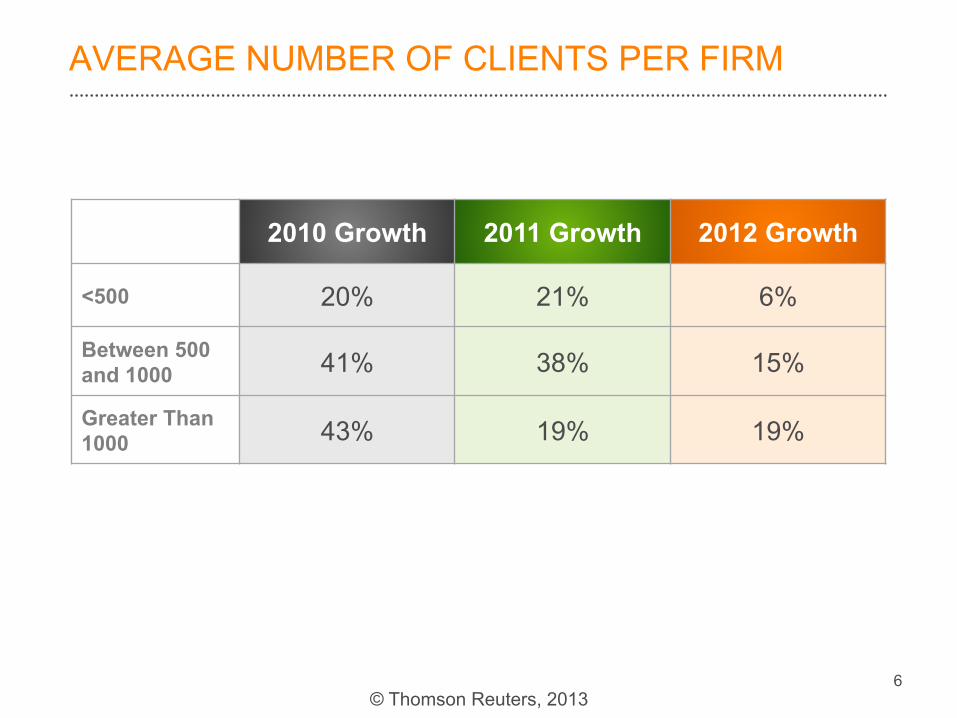
AVERAGE NUMBER OF CLIENTS PER FIRM
2010 Growth 2011 Growth 2012 Growth
<500 20% 21% 6%
Between 500 and 1000 41% 38% 15%
Greater Than 1000 43% 19% 19%
7 © Thomson Reuters, 2013
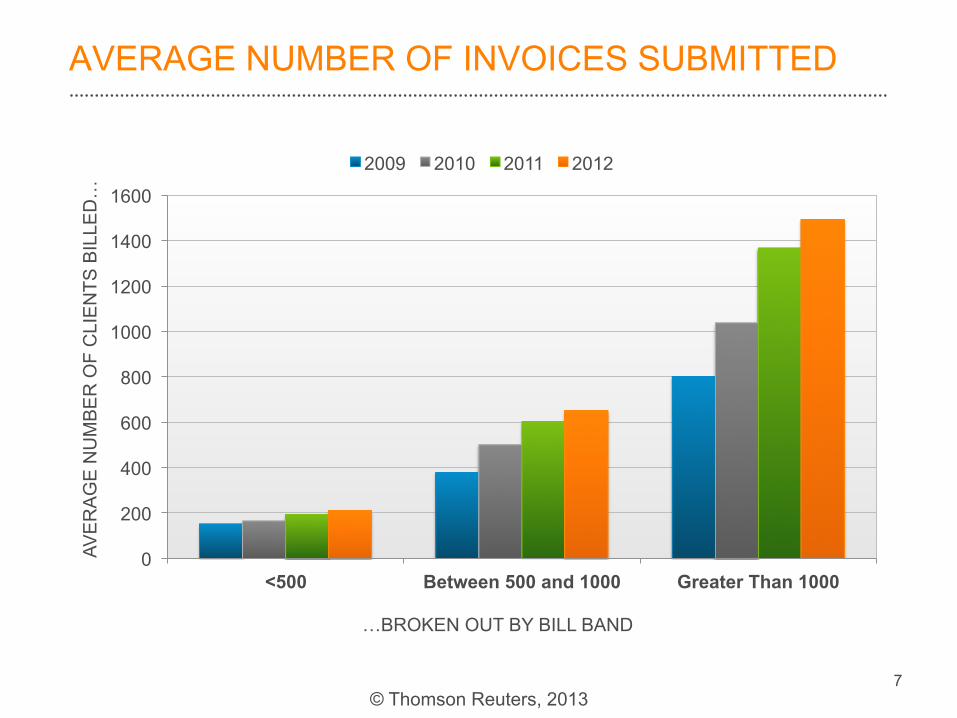
AVERAGE NUMBER OF INVOICES SUBMITTED
0
200
400
600
800
1000
1200
1400
1600
<500 Between 500 and 1000 Greater Than 1000
AVE
RA
GE
NU
MB
ER
OF
CLI
EN
TS B
ILLE
D…
…BROKEN OUT BY BILL BAND
2009 2010 2011 2012
8 © Thomson Reuters, 2013
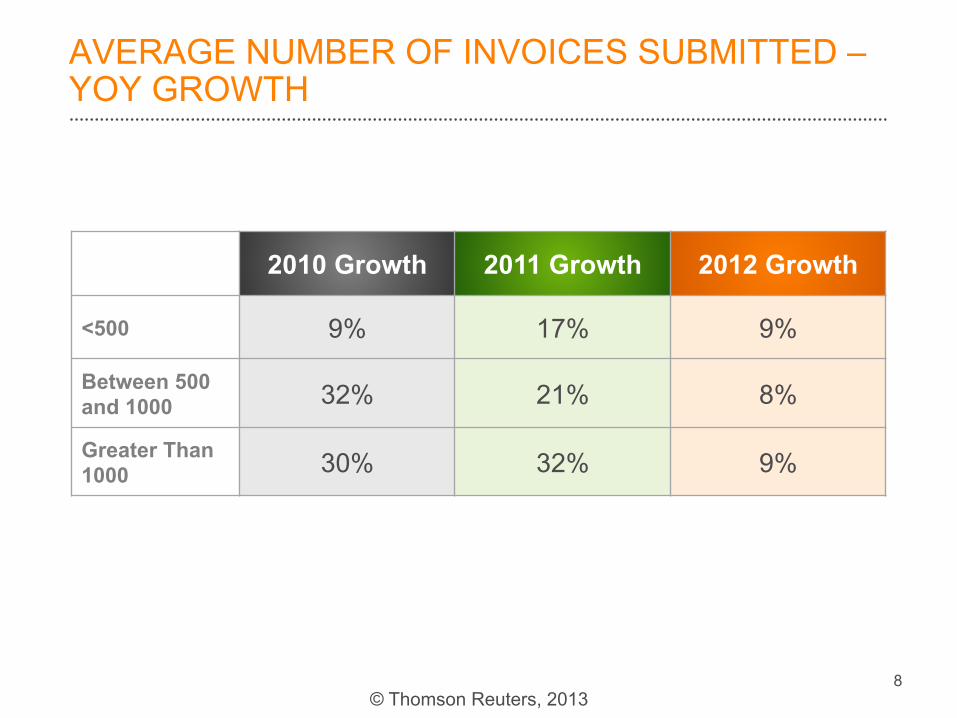
AVERAGE NUMBER OF INVOICES SUBMITTED – YOY GROWTH
2010 Growth 2011 Growth 2012 Growth
<500 9% 17% 9%
Between 500 and 1000 32% 21% 8%
Greater Than 1000 30% 32% 9%
9 © Thomson Reuters, 2013
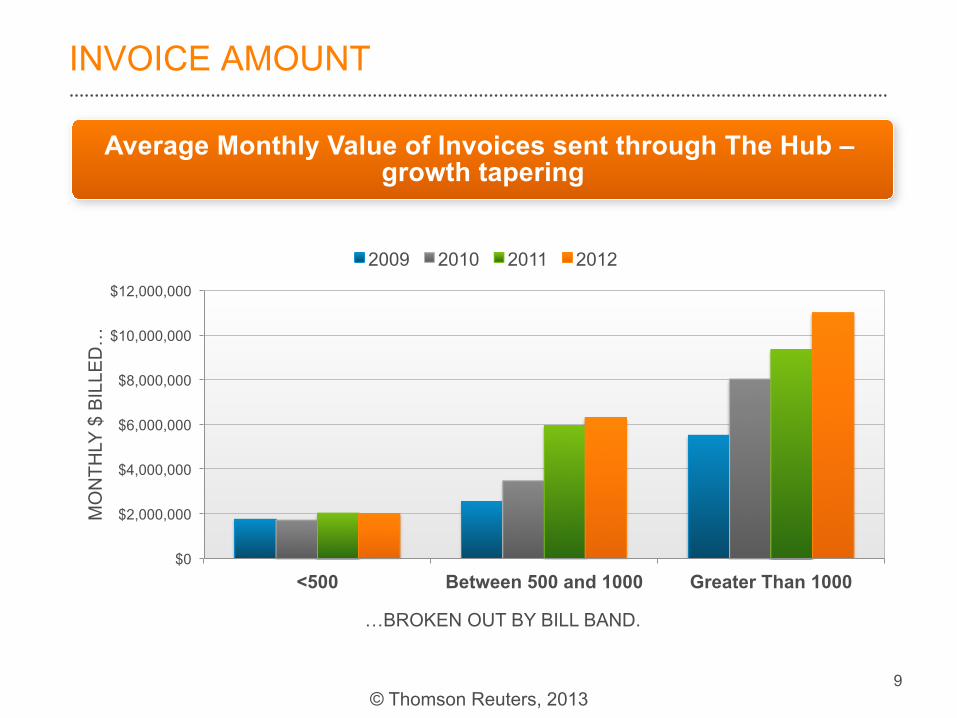
INVOICE AMOUNT
$0
$2,000,000
$4,000,000
$6,000,000
$8,000,000
$10,000,000
$12,000,000
<500 Between 500 and 1000 Greater Than 1000
MO
NTH
LY $
BIL
LED
…
…BROKEN OUT BY BILL BAND.
2009 2010 2011 2012
Average Monthly Value of Invoices sent through The Hub – growth tapering

10 © Thomson Reuters, 2013
INVOICE AMOUNT
2010 Growth 2011 Growth 2012 Growth
<500 9.8% 17% 9%
Between 500 and 1000 37% 71% 6%
Greater Than 1000 45% 16% 18%

11 © Thomson Reuters, 2013
GROWTH MOVING DOWNMARKET
2010 Growth 2011 Growth 2012 Growth <500 20% 21% 6% Between 500 and 1000 41% 38% 15% Greater Than 1000 43% 19% 19%
2010 Growth 2011 Growth 2012 Growth <500 9.8% 17% 9% Between 500 and 1000 37% 71% 6% Greater Than 1000 45% 16% 18%
CLIENT GROWTH:
INVOICE AMOUNT GROWTH:

12 © Thomson Reuters, 2013
NEW CLIENT SET-UP – MONTHLY AVERAGE
0
20
40
60
80
100
120
NE
W C
LIE
NTS
AD
DE
D T
O
THE
HU
B’S
LIB
RA
RY
…
…MONTH BY MONTH
New Clients Setup Total

13 © Thomson Reuters, 2013
NEW CLIENT SET-UP – MONTHLY AVERAGE
Year Average
2009 38.1
2010 27.3
2011 35.1
2012 37.0
2013 YTD 54.6
14 © Thomson Reuters, 2013
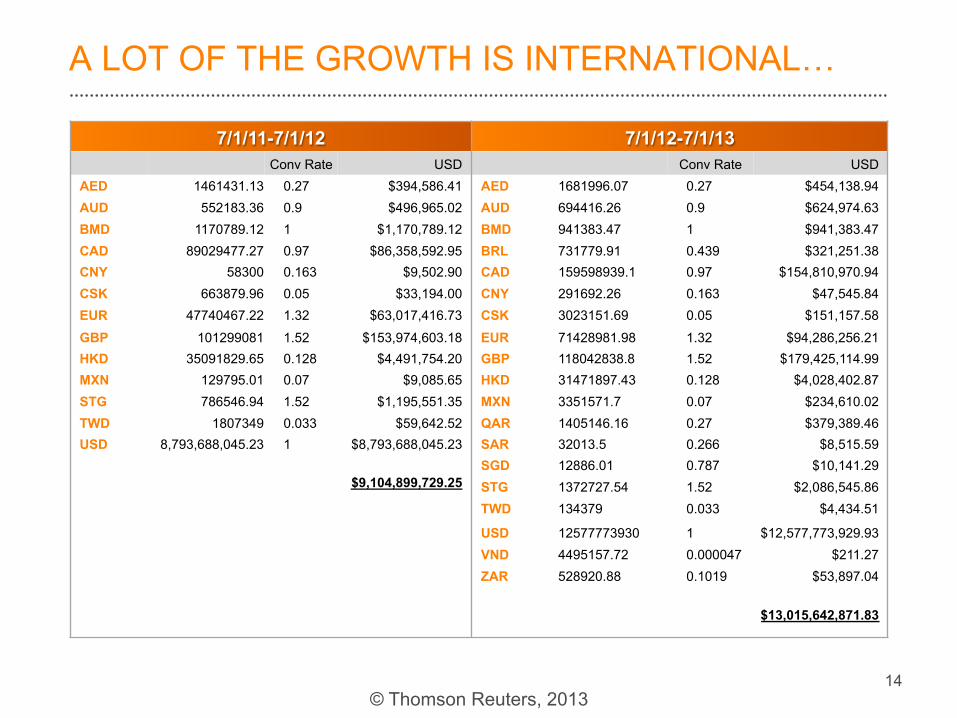
A LOT OF THE GROWTH IS INTERNATIONAL…
7/1/11-7/1/12 7/1/12-7/1/13 Conv Rate USD Conv Rate USD
AED 1461431.13 0.27 $394,586.41 AED 1681996.07 0.27 $454,138.94 AUD 552183.36 0.9 $496,965.02 AUD 694416.26 0.9 $624,974.63 BMD 1170789.12 1 $1,170,789.12 BMD 941383.47 1 $941,383.47 CAD 89029477.27 0.97 $86,358,592.95 BRL 731779.91 0.439 $321,251.38 CNY 58300 0.163 $9,502.90 CAD 159598939.1 0.97 $154,810,970.94 CSK 663879.96 0.05 $33,194.00 CNY 291692.26 0.163 $47,545.84 EUR 47740467.22 1.32 $63,017,416.73 CSK 3023151.69 0.05 $151,157.58
GBP 101299081 1.52 $153,974,603.18 EUR 71428981.98 1.32 $94,286,256.21 HKD 35091829.65 0.128 $4,491,754.20 GBP 118042838.8 1.52 $179,425,114.99 MXN 129795.01 0.07 $9,085.65 HKD 31471897.43 0.128 $4,028,402.87 STG 786546.94 1.52 $1,195,551.35 MXN 3351571.7 0.07 $234,610.02 TWD 1807349 0.033 $59,642.52 QAR 1405146.16 0.27 $379,389.46 USD 8,793,688,045.23 1 $8,793,688,045.23 SAR 32013.5 0.266 $8,515.59
SGD 12886.01 0.787 $10,141.29 $9,104,899,729.25 STG 1372727.54 1.52 $2,086,545.86
TWD 134379 0.033 $4,434.51
USD 12577773930 1 $12,577,773,929.93 VND 4495157.72 0.000047 $211.27 ZAR 528920.88 0.1019 $53,897.04
$13,015,642,871.83
15 © Thomson Reuters, 2013
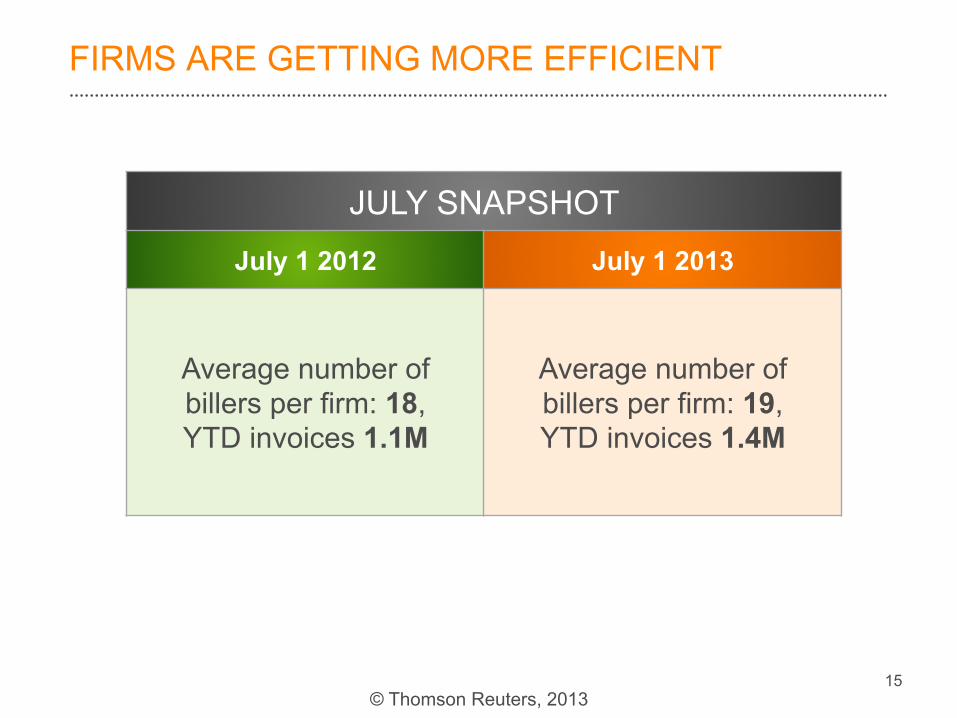
FIRMS ARE GETTING MORE EFFICIENT
JULY SNAPSHOT
July 1 2012 July 1 2013
Average number of billers per firm: 18, YTD invoices 1.1M
Average number of billers per firm: 19, YTD invoices 1.4M
16 © Thomson Reuters, 2013
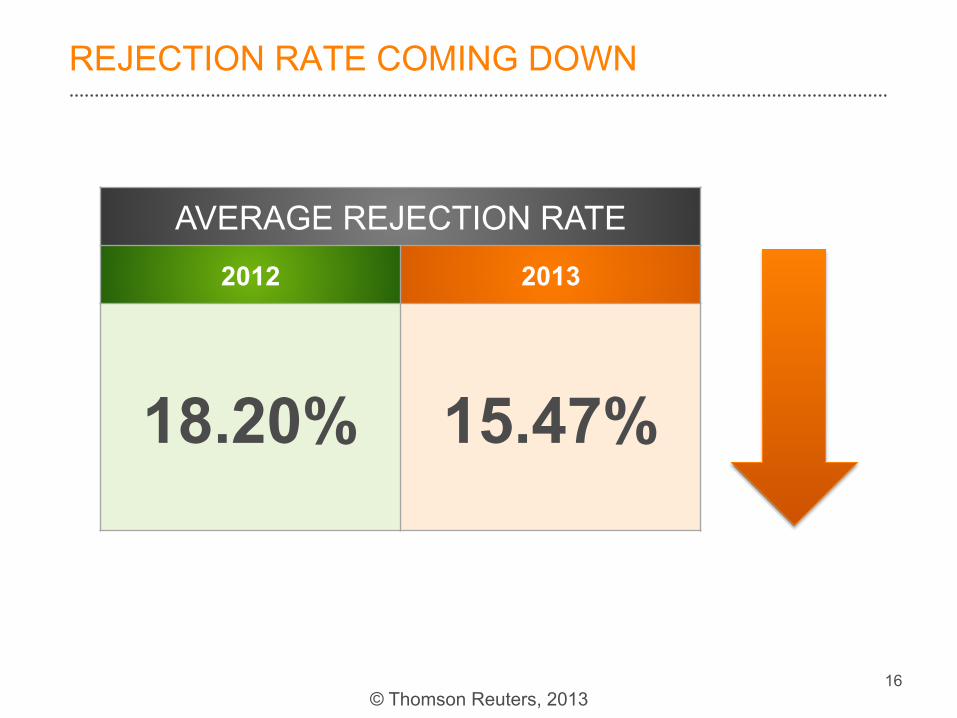
REJECTION RATE COMING DOWN
AVERAGE REJECTION RATE
2012 2013
18.20% 15.47%
17 © Thomson Reuters, 2013
0%
5%
10%
15%
20%
25%
30%
35%
40%
45%
50%
PE
RC
EN
TAG
E O
F B
ILLS
RE
JEC
TED
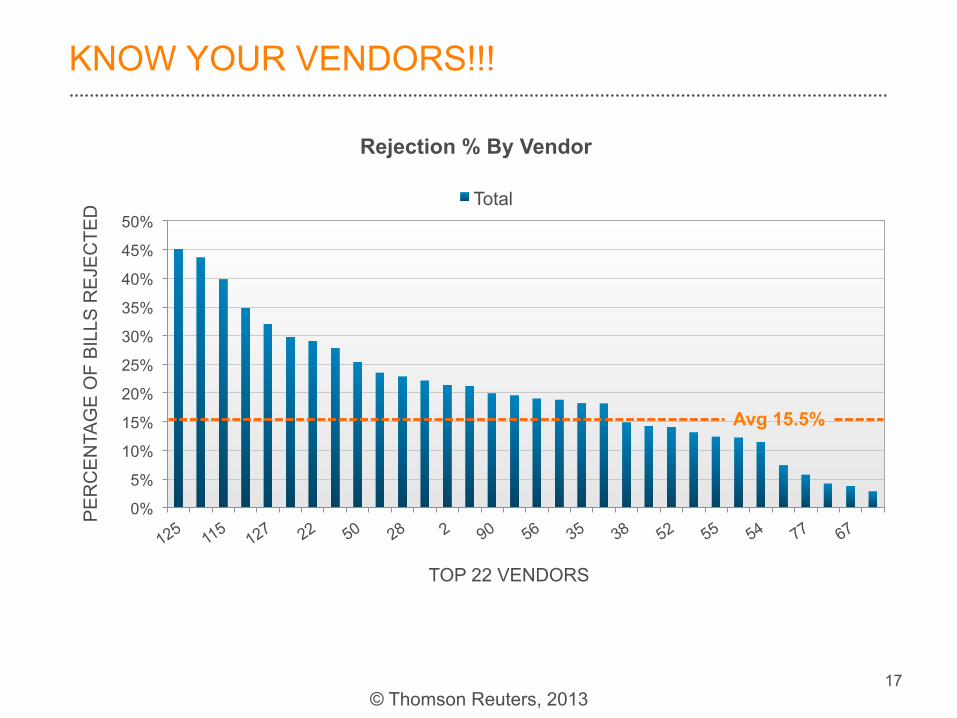
TOP 22 VENDORS
Rejection % By Vendor
Total
KNOW YOUR VENDORS!!!
Avg 15.5%
18 © Thomson Reuters, 2013
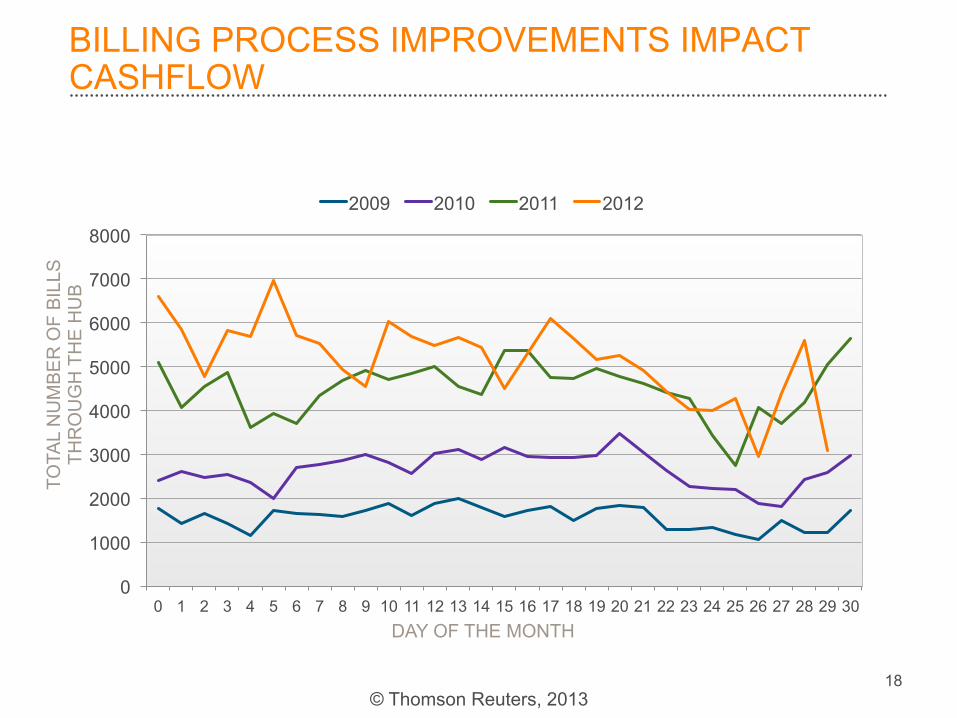
BILLING PROCESS IMPROVEMENTS IMPACT CASHFLOW
0
1000
2000
3000
4000
5000
6000
7000
8000
0 1 2 3 4 5 6 7 8 9 10 11 12 13 14 15 16 17 18 19 20 21 22 23 24 25 26 27 28 29 30
2009 2010 2011 2012
DAY OF THE MONTH
TOTA
L N
UM
BE
R O
F B
ILLS
TH
RO
UG
H T
HE
HU
B

19 © Thomson Reuters, 2013
BILLING PROCESS IMPROVEMENTS IMPACT CASHFLOW
0
50
100
150
200
250
300
350
400
450
500
0 1 2 3 4 5 6 7 8 9 10 11 12 13 14 15 16 17 18 19 20 21 22 23 24 25 26 27 28 29 30
NU
MB
ER
OF
BIL
LS T
HR
OU
GH
TH
E H
UB
(EA
CH
FIR
M)
DAY OF THE MONTH
20 © Thomson Reuters, 2013
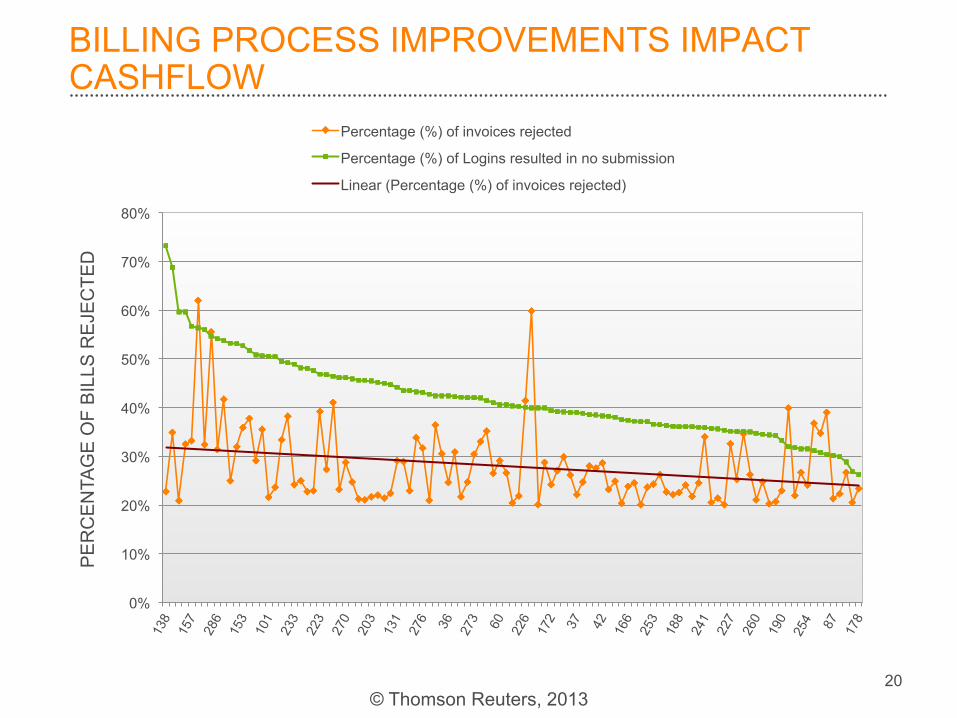
BILLING PROCESS IMPROVEMENTS IMPACT CASHFLOW
PE
RC
EN
TAG
E O
F B
ILLS
RE
JEC
TED
0%
10%
20%
30%
40%
50%
60%
70%
80%
Percentage (%) of invoices rejected
Percentage (%) of Logins resulted in no submission
Linear (Percentage (%) of invoices rejected)
21 © Thomson Reuters, 2013
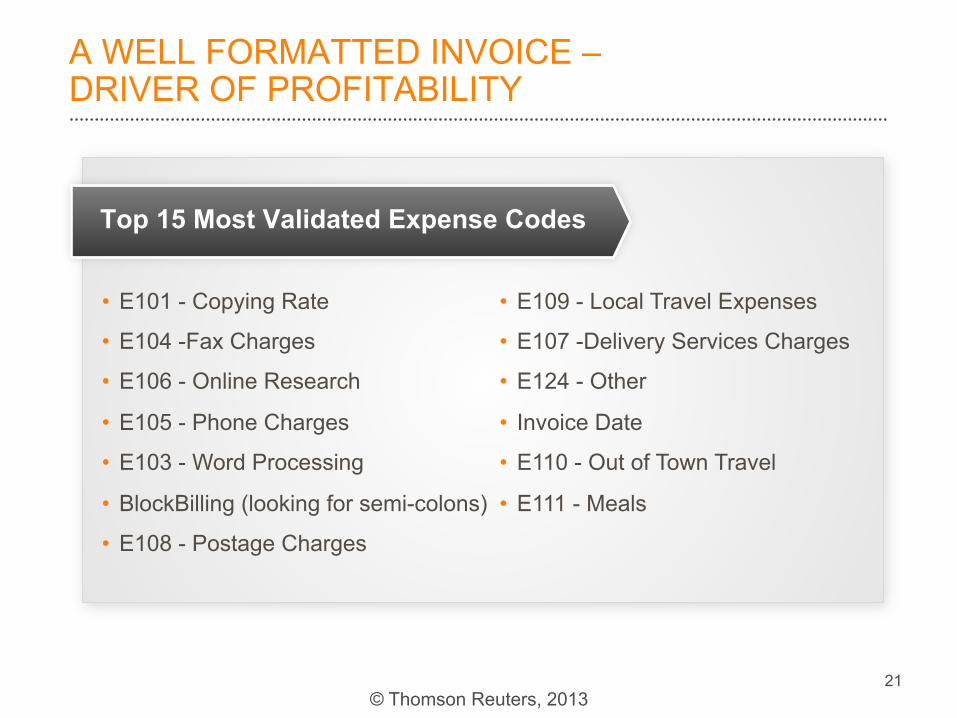
A WELL FORMATTED INVOICE – DRIVER OF PROFITABILITY
Top 15 Most Validated Expense Codes
• E101 - Copying Rate
• E104 -Fax Charges
• E106 - Online Research
• E105 - Phone Charges
• E103 - Word Processing
• BlockBilling (looking for semi-colons)
• E108 - Postage Charges
• E109 - Local Travel Expenses
• E107 -Delivery Services Charges
• E124 - Other
• Invoice Date
• E110 - Out of Town Travel
• E111 - Meals
22 © Thomson Reuters, 2013
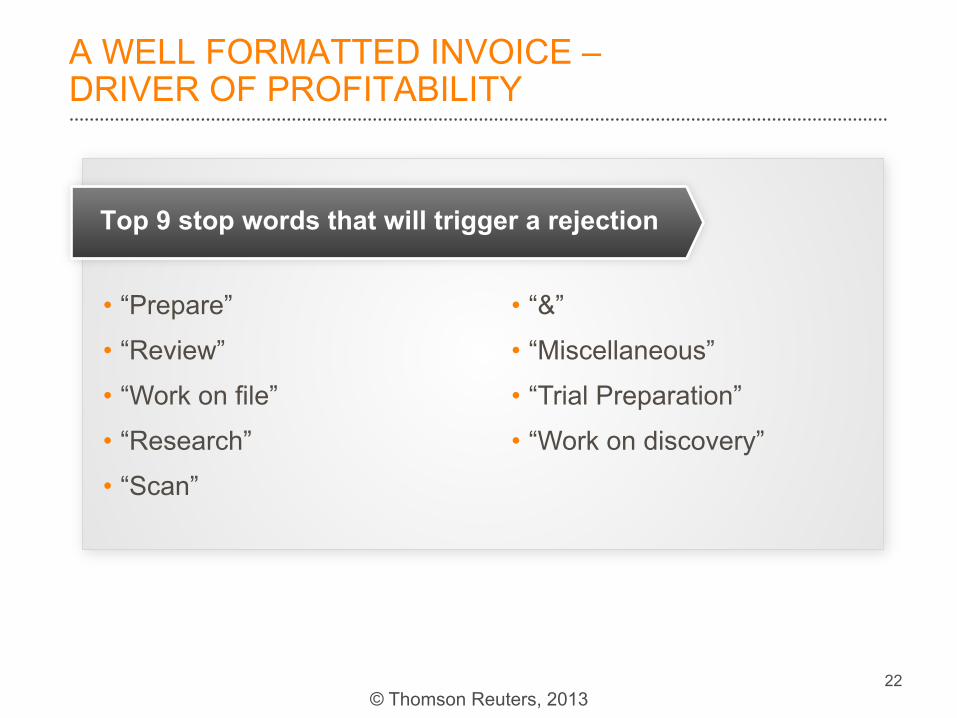
A WELL FORMATTED INVOICE – DRIVER OF PROFITABILITY
Top 9 stop words that will trigger a rejection
• “Prepare”
• “Review”
• “Work on file”
• “Research”
• “Scan”
• “&”
• “Miscellaneous”
• “Trial Preparation”
• “Work on discovery”
23 © Thomson Reuters, 2013
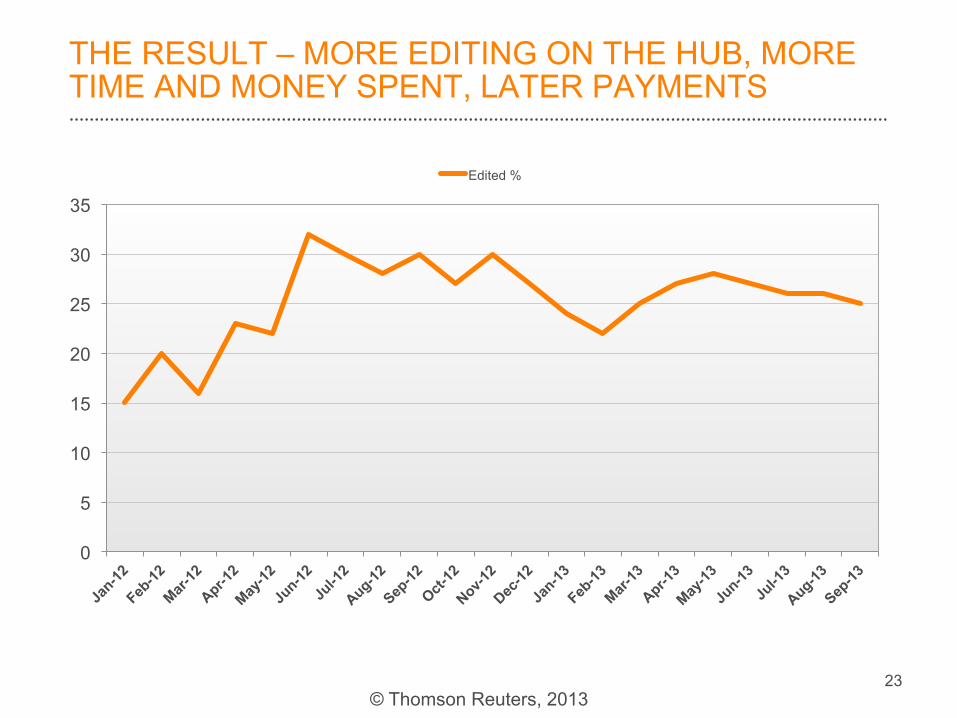
THE RESULT – MORE EDITING ON THE HUB, MORE TIME AND MONEY SPENT, LATER PAYMENTS
0
5
10
15
20
25
30
35
Edited %

24 © Thomson Reuters, 2013
25 © Thomson Reuters, 2013

26 © Thomson Reuters, 2013
FORMATTING IS NOT ENOUGH – TRAIN YOUR CLIENT!
85%
15%
Invoices
Approved Rejected 83%
17%
Rejected Invoices
Invoice Content/Format Issues Clerical Reasons
50% 50%
Clerical Reasons
■ Matter Set up ■ 1. Budget Exceeded
2. Incorrect/Missing/Expired Credentials