Embed Size (px)
Citation preview

AD-L13 OW DEFNSE COMUN~ICATIONS IMNEERING CENTER RESTON VA F/0 11/2.1
ERORA NC ANALYSIS OF DISITAL. LOS LINK, MANILA EMBASSY - SAN?-4YC(Ul
K;CSSPE 8C 1 N JD ISOVACU, D SMITH, 0 9 PARKERIED DCEC-TRi-01
Iiffff~l..fl..flI~IIIIIIIIIIIIIIfll~fflIIIIIIIEEIIIIEEEEIIIIIEIII

111112.2
MI( RO(OPY R~ YLUII) [Il -HARI

TR 26-81
,DEFENSE COMMUNICATIONS ENGINEERING CENTER
TECHNICAL REPORT NO. 26-81
PERFORMANCE ANALYSIS OF DIGITAL
LOS LINK, MANILA EMBASSY-
SANTA RITA, PHILIPPINES
DECEMBER 1981
I.J ' I.
.L-
APPROVED FOR PUBLIC RELEASE; DISTRIBUTION UNLIMITED
82 04 o0 110

UNCLASSIFIED R230 26 January 19R2rY CLASSIFICATION OF THIS PAGE (hen Data Entered)
REPOT DCUMHTATOH AGEREAD INSTRUCTIONSREPORT DOCUMENTATION PAGE BEFORE COMPLETING FORM
REPORT NUMBER 2. GOVT ACCESSION NO. 3. RECIPIENT'S CATALOG NUMBER
DCEC TR 26-81 -14 1' c,.
4. TITLE (and Subtitle) S. TYPE OF REPORT & PERIOD COVERED
Technical ReportPERFORMANCE ANALYSIS OF DIGITAL LOS LINK 6. PERFORMING ORG. REPORT NUMBER
MANILA EMBASSY - SANTA RITA, PHILIPPINES7. AUTHOR() 8. CONTRACT OR GRANT NUMBER(&)
N. J. SorovacuD. SmithD. E. Parker
9. PERFORMING ORGANIZATION NAME AND ADDRESS 10. PROGRAM ELEMENT, PROJECT. TASK
Defense Communications Engineering Center AREA & WORK UNIT NUMBERS
Transmission Engineering Directive R2001860 Wiehle Avenue, Reston, VA 22090 N/A
I. CONTROLLING OFFICE NAME AND ADDRESS 12. REPORT DATE
December 1981IS. NUMBER OF PAGES
(Same as 9) 8114. MONITORING AGENCY NAME & ADDRESS(UI different frm Controlling Office) IS. SECURITY CLASS. (of this report)
Unclassified/a. ECLASSIFICATION/DOWNGRADING
N/A SCHEDULE N/A16. DISTRIBUTION STATEMENT (of this Report)
A. Approved for public release; distribution unlimited.
17. DISTRIBUTION STATEMENT (of the abstract entered In Block 20, it different from Report)
IAN/A
IS. SUPPLEMENTARY NOTES
Review relevance 5 years from submission date. -'
9IS. KEY WORDS (Continue on rever*e side if neceoary and Identfy by block niiber)Link Performance DuctingPat Profile Diversity ModeDighital Upgrade Antenna Radiation PatternLOS Path
24L AU067*%V (Cestilaw m revurse aftb N n=ueeond ,-- dWir by block n )
The U.S. Navy has been tasked to upgrade OCS microwave link M1433, SantaRita - U.S. Embassy, Philippines, to digital operation using the DRAMA equipment.Impact on bit error rate performance of the new digital radio link caused by areflection path on Manila Bay is being evaluated in this analysis. Recommenda-tions are made for a link configuration expected to provide an optimum perform-ance in concert with DCS criteria.
UNCLASS IFI ED1ECUI"Y CLAvSSIFICATIO OF THIS PAGE (3kn, Dote Entered)
#6J

*1SECURITY CLASSIPICATION OP TISi PAGr(Ihm Doa memio
SECURITY CLASSIPICATION O IIHIIS PAORChon Do&. Ener@*.
44

i-
TECHNICAL REPORT NO. 26-81
PERFORMANCE ANALYSIS OF DIGITAL LOS LINK,MANILA EMBASSY - SANTA RITA, PHILIPPINES
DECEMBER 1981
Prepared by:
* N. Sorovacu# D. Smith9 D. E. Parker
Technical Content Approved: Approved for Release:
Colonel, USA Prnia ppt Director
Deputy Director forTransmission Engineering
FOREWORD
The Defense Communications Engineering Center Technical Reports (TR's)are published to inform interested members of the defense community regardingtechnical activities of the Center, completed and in progress. They areintended to stimulate thinking, encourage information exchange, and provideguidance for related planning and research. They are not an integralpart of the DoD PPBS cycle and should not be interpreted as a source ofprogram guidance.
Comments or technical inquiries concerning this document are welcome,and should be directed to:
Director Ac.ai -Defense Communications Engineering Center - v1860 Wiehle AvenueReston, Virginia 22090
SI. i .:} 1 '. .Dis

EXECUTIVE SUMMARY
This Technical Report (TR) contains the performance analysis andrecommendations for an optimum implementation of the DCS microwave linkbetween Santa Rita and the U.S. Embassy in the Republic of the Philippinesscheduled for a digital upgrade in FY 82 and FY 83. The content of this TR isstructured as follows:
a. The purpose of this analysis is introduced in section I, followed-upwith a summary of the actions leading to such an analysis in the "Background"section II.
b. In Section III, the performance expected to be derived from thesubject link is assessead in terms of the path clearance for various K-factorvalues ranging from 0.34 to 1.67 and associated Fresnel zones varying fromvalues of 0.3 to 11.0. The degradation in link performance caused by varioustypes of fading is defined in terms of power loss in the receive signal level(RSL), and appropriate corrective actions. The link performance is derivedfor alternatives in link configuration obtained through various diversitymodes, antenna sizes, transmitter power levels, and receiver noise figures.
c. An optimum link configuration is recommended in Section IV. Itconsists of OCS standard equipment utilizing 12 feet parabolic antennasarranged in a dual space diversity configuration and the DRAMA radioequipment. A minimum of 120 feet height would be required at the U.S. Embassylocation for an adequate path clearance to the existing antenna tower heightsat Santa Rita. The DRAMA radio equipment is specified for maximum transmitpower and a minimum noise figure.
d. The conclusions are presented in Section V. Additional supportingtechnical material and a synopsis of on-going DoD test and evaluationactivities for characterization of service fading effects on digital LOS pathsare included in Appendixes A to D.
iii
4 ..4ffAL

TABLE OF CONTENTS
Page
EXECUTIVE SUMMARY iii
I. INTRODUCTION 1
II. BACKGROUND 2
III. LINK PERFORMANCE ANALYSIS 4
1. Areas of Concern 4
2. Yearly K Factor Distribution 4
3. Path Profiles 5
4. Performance Degradation Caused by Normal Fading 5
a. Multipath Flat Fading 10
b. Multipath Frequency Selective Fading 10
5. Performance Degradation Caused by Abnormal Fading 15
a. Sub- and Superrefractive Fading 15
b. Ducting 19
c. Rain Attenuation 19
6. Summary of Expected Performance Degradation 24
7. Expected Link Performance 24
IV. RECOMMENDED LINK CONFIGURATION 29
V. CONCLUSIONS 31
REFERENCES 32
APPENDIXES
A Determining the K Factor to Use in LOS Microwave Links A-1
B Fading Characteristics for Over-the-Water Microwave Links B-1
C Hybrid Simulation of the DRAMA Radio and Line-of-Sight Multipath C-1Channel
D Synopsis of Selective Fading Test and Evaluation for Digital LOS D-iChannels
iv
lo , '

LIST OF ILLUSTRATIONS
Figure Title Page
1. YEARLY DISTRIBUTION OF K FACTOR FOR THE PHILIPPINES 6
2. PATH PROFILES FOR VARIABLE K FACTOR (K - 0.34, 0.5, AND 0.67) 7
3. PATH PROFILES FOR VARIABLE FRESNEL CLEARANCE AND K - 0.67 8(F = 0.3, 1.0, 2.0 and 11.0)
4. PATH PROFILE FOR VARIABLE FRESNEL CLEARANCE (F = 3.0, 4.0, 95.0, AND 11.0) AND K = 1.67
5. 'M' AMPLITUDE VS PATH LENGTH DIFFERENCE VS VARIABLE K FACTOR 11AND TIDE HEIGHT
6. TIME DELAY VS PATH LENGTH DIFFERENCE FOR VARIABLE K FACTOR 12AND TIDE HEIGHT
7. 'M' AMPLITUDE VS PATH LENGTH DIFFERENCE FOR K = 0.65 13
8. TIME DELAY VS PATH LENGTH DIFFERENCE FOR K = 0.65 14
9. DEGRADATION IN SIGNAL-TO-NOISE RATIO VS DELAY FOR SIMULATION 16OF DRAMA RADIO
10. ANTENNA HEIGHT VS AVAILABILITY FOR K c I (BASED ON 18METEOROLOGICAL DATA)
11. 'F' AMPLITUDE VS PATH LENGTH DIFFERENCE FOR VARIABLE K FACTOR 20AND TIDE HEIGHT
12. 'F' AMPLITUDE VS PATH LENGTH DIFFERENCE FOR K = 0.65 21
13. SURFACE DUCTING EFFECTS 22
14. ATTENUATION DUE TO PRECIPITATION (AFTER CCIR) 23
15. EXAMPLE OF EP 27-77 LINK PERFORMANCE CALCULATIONS 26
16. TYPICAL RADIATION PATTERN OF A 12 FT. CIRCULAR PARABOLIC 30ANTENNA
Al

1
LIST OF TABLES
Table Title Page
I. EXPECTED FREQUENCY SELECTIVE FADING OF MANILA EMBASSY-SANTA RITA 17LINK
II. SUMMARY OF EXPECTED PERFORMANCE DEGRADATION CAUSED BY FADING 25MANILA EMBASSY-SANTA RITA DIGITAL LOS LINK
III. ALTERNATIVES FOR MANILA EMBASSY-SANTA RITA DIGITAL LOS LINK 28CONFIGURATION
vi
-| °
g 6

I.
I. INTRODUCTION
The purpose of this analysis is to assess performance of the digital LOSradio link between the U.S. Embassy in Manila and Santa Rita, Republic of thePhilippines, and to provide technical guidance for an optimum implementationof this link in accordance with OCS performance standards.
OCA PAC as a result of concern over the degradation in performance of theradio link tasked DCEC to study the link and develop alternatives forimproving the performance. A detailed account of correspondence involving thestudy is given in Section II, Background. The link performance analysis isdescribed in detail in Section III, and recommendations for an optimum linkdesign given in Section IV. The analysis is concluded in Section V, followedby a list of references and additional technical information contained inAppendixes A to 0.
j

II. BACKGROUND
Abnormal propagation conditions, excessive path length and inadequate pathclearance at the reflecting point in the vicinity of the Manila Embassy endwere identified by NAVSEEACT PAC (Msg 280049Z, December 1976 and TEP Report ofApril 1977) as major sources of excessive RSL fading (over 40 dB at times) onanalog link M1433.
DCA PAC (Msg 302033Z, April 1980) expressed concern over degradation inthe performance of DRAMA radio equipment due to the multipath fadingconditions on the subject link. Two alternatives employing coherent IFcombining, adaptive equalization (AE) and space diversity (SD) wererecommended to OCEC for evaluation.
The host government (HG) authorities recommended the following frequencieson the subject link (NAVSEEACT Msg 2301180Z, June 1980): 7635.35 MHz for theEmbassy to Santa Rita link, and 7412.5 MHz for the Santa Rita to Embassy link;ECAC (Msg 161440Z, July 1980) evaluated the new frequencies and found themcompatible.
In reply to the DCA PAC request of April 1980, DCEC (Msg 301739Z, June1980) reviewed the "in-house" R&D program related to analysis of frequencyselective fading (FSF) effects on digital LOS links, scheduled preliminaryresults of the analysis, and expanded alternatives to include a quad-diversity(QD) configuration, or addition of an active repeater at Angat.
The alternative of adding an active repeater at Angat was ruled out by DCAPAC (Msg 080053Z, July 1980) and NAVSEEACT PHILIPPINES (Msg 142230Z, July1980) as being operationally unacceptable due to the requirement for expansionof the building at Angat, the possibility of path obstruction by futurehigh-rise construction, and reduction in survivability. Information on quaddiversity was provided by DCEC (Msg 23181lZ, July 1980).
Results of the preliminary analysis (1 August 1980) were presented by theDCCC action officer during the PAC area visit of 21-31 August 1980. Theresults indicate possible substandard performance caused mostly by variationin K factor (subrefractive) and negligible degradation due to frequencyselective fading (FSF). A recommendation was made to raise the antenna heightat the Embassy location and employ SD in lieu of programed frequencydiversity (FD) configuration. A follow-up message (291443Z, October 1980)reiterated the findings of the preliminary analysis, recommended a change inprocurement in DRAMA radio equipment (i.e. AN/FRC-171 instead of AN/FRC-173),and indicated no significant performance advantage to be gained with radioequipment employing adaptive equalization.
OCA PAC (Msg 171953Z, November 1980) and NAVSEEACT PAC (Msg 042314Z,November 1980) requested additional information on the analysis, assumptions,and rationale for using SO and not using AE, and questioned the validity ofresults based on Clark AB meteorological data.
2

The distinction between multipath flat fading versus frequency selectivefading and the appropriate corrective actions were contained in DCEC replies(Msgs 181911Z, November 1980 and 011333Z, December 1980) to messages of thepreceding paragraph. It also -equested data to characterize type andmagnitude of fading affecting performance of the existing analog link to beconsidered in the final analysis.
In reply to the OCA 471 request on the impact on the PDU program (Msg042047Z, November 1980), OCA PAC indicated (Msg 092113Z, December 1980) thatDRAMA radio equipment could not be used unless AE would be available by August1982, requesting a confidence level for such a deadline. OCA also reiteratedfindings of NAVSEEACT PHIL (Msg 080430Z, August 1980) that the antenna towerat the Manila Embassy would not support the additional antenna required for anSD or QO configuration.
A DCA/DCEC reply (Msg 162045Z, December 1980) recapitulated informationfrom previous DCEC messages, indicated that a review of data on-hand showedevidence of flat fading and no FSF, thus precluding use of AE, expected to beavailable in 2-1/2 years. It stated that for a fixed K factor of 2/3, DCSperformance standards are met with subject LOS link configured in FD with 15foot antennas, or SD with 12 foot antennas, or SD with 10 foot antennas andlow noise preamplification. The reply suggested another look at the additionof another antenna on the embassy tower to accommodate the SD configuration.
COMNAVTELCOM estimated a two-year delay in schedule if procurement of theDRAMA radio equipment was changed to SD instead of FD, and requestedCOMNAVELEXSYSCOM to proceed with FO and investigate using smaller antennasin SD at Manila (Msg 291657Z, December 1980).
The OCEC final analysis (Msg 071629Z, April 1981), which confirmedpreliminary results, summarized results of two digital LOS link tests showingnegligible effects of FSF on link performance and recommended an SDconfiguration with a 12 foot antenna. It further recommended 3 to 6 months ofin-service monitoring to determine/optimize link performance with thepossibility of reorienting the antenna boresight to compensate for thesubrefractive K factor.
The results of a structural analysis performed by NAVSEEACT PHILIPPINES(Msg 200215Z, May 1981) showed that the existing 105 ft. tower at the ManilaEmbassy would not support an additional 15 foot antenna, and recommended a newantenna tower.
COMNAVTELCOM requested NAVSEEACT PHILIPPINES (Msg 082017Z, June 1981) that
cost estimates for the new tower at the Embassy include both options: (1) FDwith a 15 foot antenna, (2) SD with two 12 foot antennas.
NAVSEEACT PAC study on various types of diversity (Ltr of 17 April 1981)recommended a hybrid diversity system (SD at Santa Rita and FD at the Embassy)as a compromise link configuration.
3

I1. LINK PERFORMANCE ANALYSIS
The expected performance for the upgraded and cut over Manila Embassy -
Santa Rita link is assessed in terms of link availability and channel qualitycriteria described in DCEC TR 12-76, "DCS Digital Transmission SystemPerformance," November 1976. The design procedures for LOS digitaltransmission systems contained in DCEC EP 27-77, "Design Objectives for DCSLOS Digital Radio Links," December 1977 were followed in this analysis withemphasis on the areas of concern identified below.
1. AREAS OF CONCERN
The following areas of concern are addressed in this performance analysis,most of which were identified in the extensive correspondence reviewed insection I:
a. Yearly variation of K factor.
b. Path clearance required for corresponding K factors.
c. Performance degradation caused by normal fading conditions (multipath,absorption and fog).
d. Performance degradation caused by abnormal fading conditions (variableK factor, ducting and rain).
e. Path loss calculations accounting for contributions of areas c. and d.
f. Expected link performance considering improvements gained throughdiversity configuration, larger antenna size and boresight reorientation, lownoise preamplifier and other equipment.
g. Link design and activities selected to achieve optimum performance ona cost-efficient basis.
h. Improvement in link performance gain by using non-DRAMA radio
equipment with an adaptive equalizer.
h 2. YEARLY K FACTOR DISTRIBUTION
The most recent publications dealing with the weather conditions,meteorological data and distribution of the refractivity gradient data (dN/dh)typical of the Central Luzon Island area were reviewed in order to determinethe K factor distribution characteristic of the subject link. Therefractivity gradient data shown for the Clark Field, Luzon area in reference[1], were used, following the technique described in Appendix A to derive theK factor distribution curve shown in Figure 1. The error introduced by usingthe Clark Field data (-50 miles NW of Manila) instead of either end locationis insignificant, when compared with equivalent empirical data depicted inreference [2]. Note the subrefractive characteristics (i.e., K <<l) of the K
4

factor governing the subject link throughout most of the year. An average Kfactor of 0.35 was measured by USNEL [2] at both the Santa Rita and ManilaEmbassy locations during the February-April months (dry season). The rainyseason, extending from may to December, is characterized by frequent and heavyprecipitation. The variations in the propagation media of the subject linkall controlled mostly by the high humidity and frequent temperature inversionsduring the dry season months (January-April), and to a much smaller extent bythe local preciptations of the wet season (May-December). Their impact on thelink performance is assessed in the path clearance (subsection 3.) and pathloss/fade margin (subsection 6.) calculations.
3. PATH PROFILES
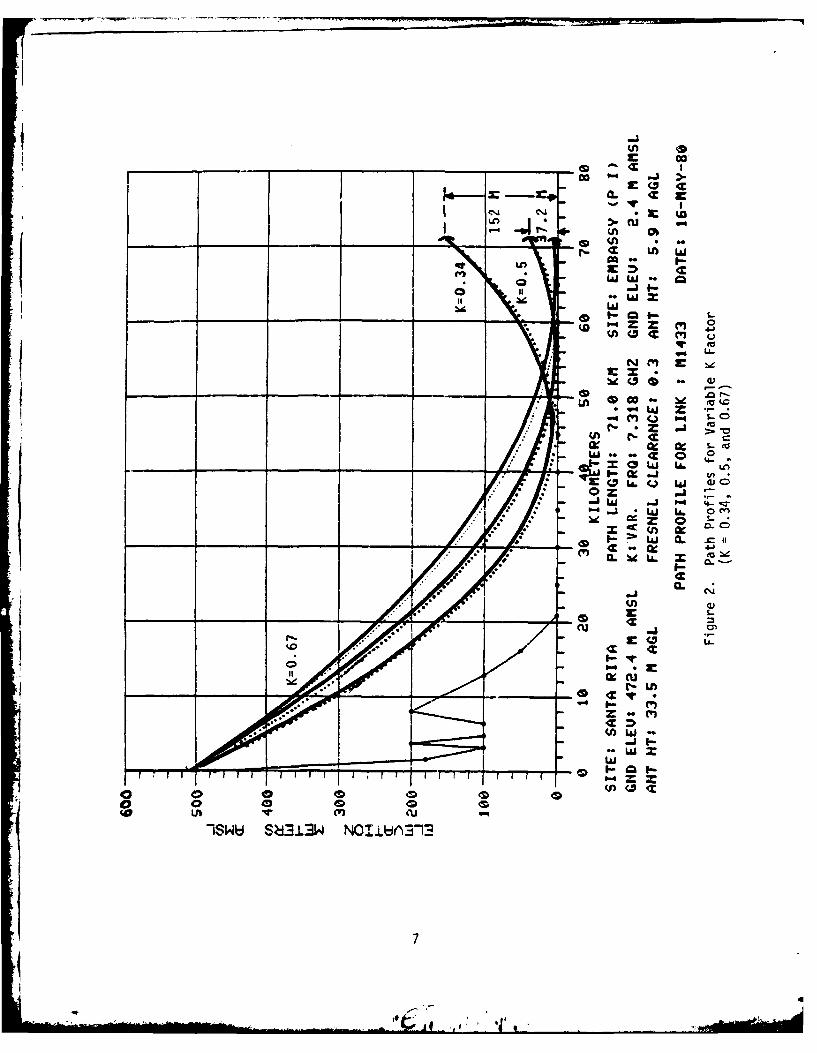
A set of path profiles presented in this section is based on thevariations in the propagation media calculated in the previous section, and onthe previous test results/analysis performed by NAVSEEACT FAC on the existinganalog link connecting the same end locations. The most stringent valuescontrolling such variations range from the subrefractive K factor distribution(Figure 1) to the multi-Fresnel zones (up to 12) mentioned in the NAVSEEACTPAC analysis. OCEC PFLOS program is used to plot the path profiles shown inFigures 2-4. The path profiles of Figure 2 depict the relationship of theantenna tower height at the Embassy to the minimum path clearance required forsubrefractive values of K = 0.34, 0.5, and 0.67, and a fixed Fresnel clearanceof 0.3. Note that the height of the existing tower (26 meters~i.e., 85 feet)at the Embassy would satisfy the minimum path clearance for K = 0.67 and 0.3F, but not for smaller K values. An antenna tower height of 152 meters wouldbe required for the path clearance corresponding to K = 0.34 and 0.3 F. Theset of path profile curves shown in Figure 3 depicts the path clearancerelationship corresponding to a fixed K factor of 0.67 and a wide variation inthe Fresnel zones ranging from 0.3 F to 11.0 F. Note that partial or totalpath blockage results for Fresnel zones higher than 1.0 F. The path profilesof Figure 4 show the same variation in the Fresnel zones for a K factor of1.67, where an adequate path clearance is obtained with Fresnel zones up to3.0 F.
Therefore, the existing antenna heights would meet the minimum pathclearance criteria for any combinations of K and F values ranging from K =0.67/2.0 F to a K a 1.67/3.0 F. Any other mix of K and F values outside thisrange would require a proportionate increase in antenna tower height(s).
4. PERFORMANCE DEGRADATION CAUSED BY NORMAL FADING
In general, the performance of a LOS link is defined in terms of thecharacteristics of atmospheric conditions above the path of propagation.Variations in the received signal strength (RSL) are caused by fading, usuallya combination of various normal and abnormal types of fading. The normalfading occurs a large percentage of time, with a predictable (90-95%) behaviorand occurrence. Cause include the following: (1) atmospheric multipath,which could be either flat (all frequencies) or frequency selective (onlyspecific frequencies); (2) atmospheric absorption; (3) fog; and (4) dust.
5
t6

.999999j
.999997
.999995
.999990
.99997
.99995
.99990
.9998
.9997
.9995
.9990
.998
S.997
.-995
-- .99
• 98
.97
.95
• 90
-80
.70
.50.2 .4 .6 .8 1.0 1.2 1.4 1.6
EFFECTIVE EARTH RADIUS FACTOR, K
t@ .995. _____
Figur 1.Yal itrbto\ fK atrfrth hlpie
1 __ __ _ __ __ __ __ _ __ __ _ __ __ _ _6_
3 <
_ _ _ _ I
V-4 (A 4lovE
- ~ S-
4--
~3I-
II LJ6 4-JZ
LLI j4-qA L1 0C-)
S-
CL tj u -Z
i4 (')i ~
r- LA ..
0 Wi. .
.U,E(La. W W
ISW SWd13 NOA--n

..... 0.3 F1.0OF
KEY; - - 2.0 F
660--
10
40-
300-
h200- _ _ _ _ _
Lee- ___
0 s 29 3 ILOF~!ERS s0 66 70 as
SITE SANTA RITA PATH LENGTH: 71.0 KM SITE$ EMBASSV(PI)GND ELEU: 473.6 MI ANSL KI 0.6? FRO$ 7.318 0HZ OND ELEUI 8.4 M AMSLANT NT: 34.6 M AOL FRESNEL CLEARMnCE: VAR. ANT NT: 26.6 M AOL
PATH PROFILE FOR LINK t M1433 DATE 12-JWI-81
Figure 3. Path Profiles for Variable Fresnel Clearance and K =0.67(F = 0.3, 1.0, 2.0 and 11.0)
8
-

3.OFKEY: 4.0 F
040300-
-f'_ I' - - --1-l-eT
* to 20 36 KILOAVOTERS se 60 70 80
SITE: SANTA RITA PATti LENGTHS 71.0 KM SITES EMBASSY (PI)GND ELEVs 472.4 M AMSL Kgl.67 FRO$ 7.318 GHZ GND ELEUs 2.4 M ANSLANT HT1 33.5 H AGL FRESHEL CLEARANCE: VAR. ANT HTS 85.9 M AGL
PATH PROFILE FOR LINK s M1433 DATEs 15-JUN-80
Figure 4. Path Profile for Variable 'resnel Clearance(F = 3.0, 4.0, 5.0, and 11.0) and K = 1.67
9

The effects of multipath are considered in this section; the other effectsmake a negligible contribution to the link performance.
a. Multipath Flat Fading. The LOS link design of EP 27-77, "DesignObjectives for DCS LOS Digital Radio Links," December 1977, describes thistype of fading and relates it to the DCS performance criteria throughapplicable outage types and related probabilities. A link margin (M4)design objective of ML = 9 log D + 18 in dB (D = path length in km) is usedin conjunction with path clearance criteria of K - 2/3 and 0.3 F to meet sucha criterion. This results in a link margin of -35 dB for the case of averageclimate, terrain, and temperature using dual space diversity (with verticalantenna separation of 9 meters).
Results of previous tests run on an existing link reported in theTechnical Evaluation Report (TEP) of 1977 and message correspondence ofNAVSEEACT PAC (see section Il) have indicated attenuations in RSL ranging from30-40 dB, most of the drop being caused by multipath fading. The presentanalog configuration employs dual frequency diversity and is sized for a 120voice channel capacity.
b. Multipath Frequency Selective Fading. This section addresses the mostdisputed area of concern (refer to summary of correspondence in section II) -the multipath frequency selective fading (FSF).
A computer program was developed in support of the FSF analysis tocalculate path length difference versus power ratio and time delayvariations. The program is based on a two-ray channel model, comprising adirect signal path versus a reflected/refracted signal path. A description ofthese program calculations, supporting subprograms, and an example of theresults is presented in Appendix B. The program has been "customized" to thesubject link, but it can be used for any other LOS link depending on theavailability of input parameters. This program takes into account thefollowing parameters: (a) various antenna heights at Santa Rita (1660-1550feet, in steps of 10 feet), (b) changes in tide heights at the reflectionpoint (4 to -1 foot, above mean sea level (AMSL) by 1 foot increments), and(c) different values of K factor (ranging from 0.55 to 2.0).
The results of this program are summarized in Figures 5 through 8. Thepath length difference (AR in feet) versus the ratio of the reflected signalpath amplitude to the direct signal path amplitude (M in dB) is shown inFigure 5 for variable tide and K factor, or for K = 0.65 as shown in Figure7. The time delay (DTM in nanoseconds) versus path length difference(AR in feet) relationships for a variable K factor and for K = 0.65 are shownin Figure 6 and Figure 8 respectively. Note the maximum value of M for K >0.83 (Figure 6) and the negligible effect on AM caused by variation in tideheight (Figure 7). Also of significance is the steep increase in DTM for K >0.65 (Figure 6), and the fact that tide height variation has no effect on 0TM(Figure 8).
The values of the power ratio and delay of the two-ray signal path areused for inputs to the hybrid simulation of the DRAMA radio and a LOS fading
10
. ,

W-C -
O(D-. -. 14-
1-4-U-)U _j - I J4
V) L.1
-Z LL OLA
VIE~~ tn ILL
V)0 <r- LIME
0 r. Rr W CL -
' E: Zm- =_j C V5 cc LLJ =U4P.- U LLJ w 4
-UJI
-4
In 'cc2
U-
(SP) W '3aflIldWV
11

__ LO
C9C
.4--
'.0 0jL0 F
ul -j4-.
= n La=*-a Lac
LLJ I-- .'LLiJ
U- in F.
I-
co~ C%
(03SN a.'AV3 3~
12J
- (~~-J 4-'PRE-

-j In
ca,
~~1 CIA),ca,
4J ;E
LnI
r.U-L-
133

Ice-
oL
'4
V0)
UJJ 4Jf- 0ui 0i
4n1
43)
.4. 4w P-u-u
0L LLIul (Amcu
it'LA. I=-L=Aj -
(03SN Mia AVI.30 3W-
14-
, #
channel described in Appendix C. Performance degradation caused by FSF isassessed from the yearly distribution of the K factor shown in Figure 1, thevariation in amplitude (M) and delay (DTM) depicted in Figures 5 and 6, andother input parameters for the hybrid simulation specific to the DRAMA radioequipment and the LOS channel characteristic of the link. The family ofcurves of Figure 9 illustrates the results of this simulation. Degradation inthe SNR required for a 10-3 BER is related to the time delay (measured inbit times) and various power ratio values (1/2 < a < 1/8). A sumary of thedegradation in performance caused by FSF expected oW the subject LOS link ispresented in Table I. Note that with the small delay values, approaching
zero, there is a gain in SNR, resulting from constructive (rather thandestructive) interference of the two signal rays. Hence, for a K = 0.67, aSNR improvement of 1.5 dB results from the simulation of the DRAMA radio. Forhigher values of delay, the degradation in SNR ranges from 3 (K = 1) to 4 dB(K = 2). The FSF changes in SNR listed in Table I were assessed for a singlediversity mode. Improvements in SNR performance from diversity combining andthe capability of diminishing FSF effects of various radio combiner/switchingconfigurations have been documented as described in Appendix D.
5. PERFORMANCE DEGRADATION CAUSED BY ABNORMAL FADING
Abnormal fading occurs a small percentage of time, with an unpredictablebehavior and occurrence. The following types are included under thiscategory: (1) subrefractive (K <<I), (2) superrefract;ve (K >>l), (3)ducting, and (4) rain attenuation. The geographical location, topography,climate and weather conditions indicate that all four types of abnormal fadingaffect the performance of the subject link. This subsection deals with eachof these propagation impairments and assesses their performance degradation.
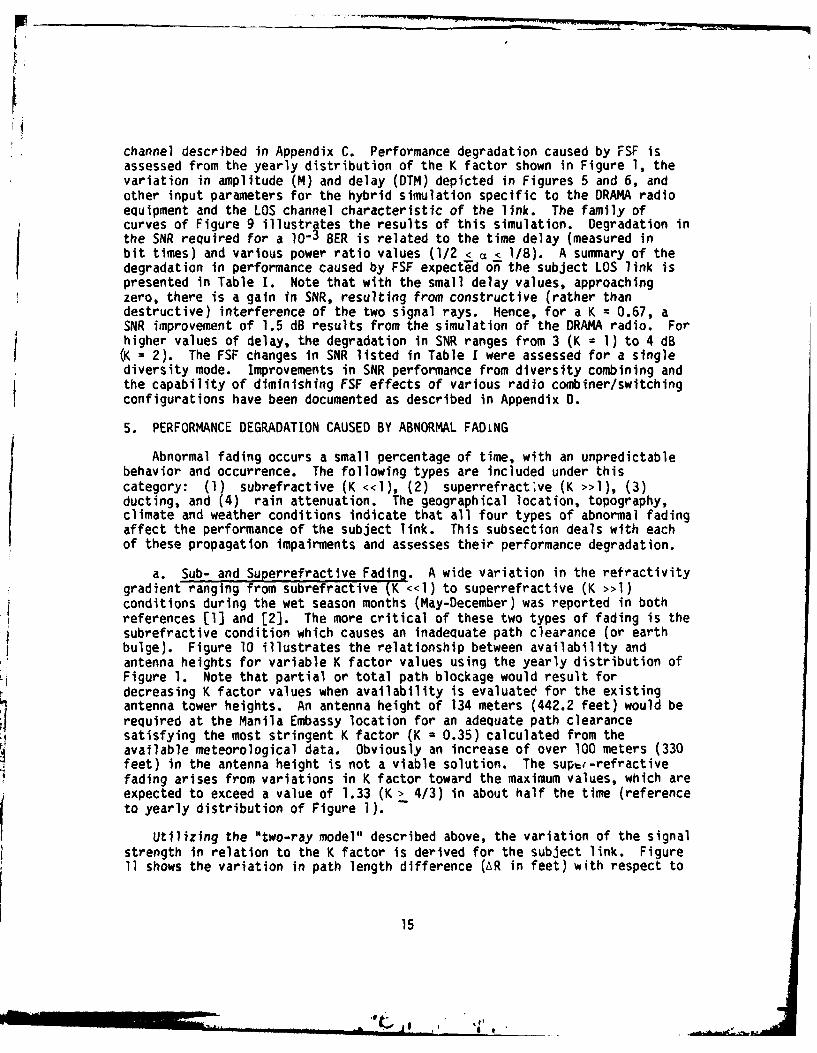
a. Sub- and Superrefractive Fading. A wide variation in the refractivitygradient ranging from subrefractive (K <<l) to superrefractive (K >>l)conditions during the wet season months (May-December) was reported in bothreferences [l and [23. The more critical of these two types of fading is thesubrefractive condition which causes an inadequate path clearance (or earthbulge). Figure 10 illustrates the relationship between availability andantenna heights for variable K factor values using the yearly distribution ofFigure 1. Note that partial or total path blockage would result fordecreasing K factor values when availability is evaluated for the existingantenna tower heights. An antenna height of 134 meters (442.2 feet) would besatisfying the most stringent K factor (K = 0.35) calculated from the
available meteorological data. Obviously an increase of over 100 meters (330feet) in the antenna height is not a viable solution. The supt-refractivefading arises from variations in K factor toward the maximum values, which areexpected to exceed a value of 1.33 (K > 4/3) in about half the time (referenceto yearly distribution of Figure 1). -
Utilizing the "two-ray model" described above, the variation of the signalstrength in relation to the K factor is derived for the subject link. Figure11 shows the variation in path length difference (AR in feet) with respect to
15

3-NOTES:o Single Diversity ________________________________V_______________
o 2 Ray Path T_________________
3t~ Reflected Power
0.
0.
33
4 to -1.5 dBRANGE
-
0.5 1.0 1.5
DELAY BETWEEN 2 RAYS, NORM1ALIZED BY DATA BIT WIDTH
Figure 9. Degradation in Signal-to-Noise Ratio vs Delay forSim~ulation of DRAMA Radio
16

, MR"",, i
TABLE I.
EXPECTED FREQUENCY SELECTIVE FADING OF MANILA EMBASSY-SANTA RITA LINK
K FACTOR TIME AMPLITUDE POWER TIME DELAY, IN SNREXCEEDED RATIO-M RATIO- DELAY-DTM BIT WIDTHS DEGRADATION
(FIG. 1) (FIG. 1) (FIG. 5) (NOTE 1) (FIG. 6) (NOTES 2&4) (FIG. 9)
0.67 0.985 0.56 0.32 1 nsec 0.026 -1.5 dB
1.0 0.9 (Note 3) 0.63 0.4 5 nsec 0.13 3 dB
1.33 0.5 (Note 3) 0.63 0.4 7 nsec 0.18 3.5 dB
2.0 0.63 0.4 10 nsec 0.26 4 dB
NOTES: 1. a A M2
2. Delay A DTM x Bit Rate (For QPR)
3. Extrapolated Value
4. Bit Rate = 26 Mbs
1717 17
• I,

102 99
PEETANT. HEIGHT AT SNART
505
103 99.99
RECEIVE EN ANTENN HEIGHT AT NL MAS MLMTR
w I ,H IHT9 .9

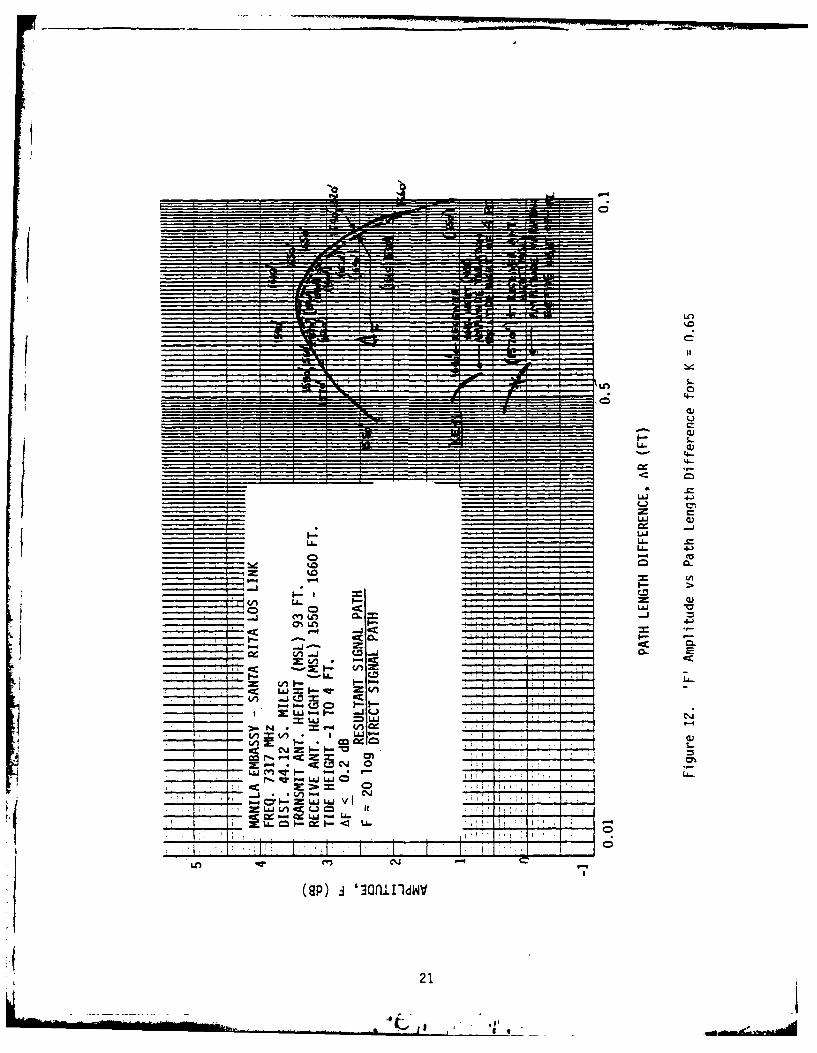
the ratio of the resultant path to direct signal path (F in dB) for a K factorranging from 0.55 to 2.0, a tide height of -1 to 4 feet, and an antenna heightat Santa Rita varying from 1550 to 1660 feet. The same relationship for afixed K = 0.65 is shown in Figure 12. Note in Figure 11 the numerous Fresnelzones (15) within a K factor variation of 0.55 <K < 2.0 where the signal ratioranges from a maximum value of 4 dB down to a NinTmum of -8.5 dB. Also notethe negligible effect of tide height variation shown in Figure 12.Furthermore, the efficiency of space diversity (antennae spaced 33 feet apart)and optimum antenna heights in relation to the even Fresnel zone nulls aredepicted in these two figures.
Experience gained through the design and performance of other DCS LOSpaths has indicated that the effective K factor over the entire path reaches aminimum (K a 0.3 in Figure 1), or a maximum (K = 2.0 in Figure 11), value fora much smaller percentage of time than would be indicated by the distributionof K value as found by meteorological measurements at single points. Theexplanation given in reference [3] is that the unusual conditions causingthese extreme values are unlikely to occur over more than a small part of thepath at any given instant. Hence the analysis of this link consideredvariations in K factor ranging from 0.5 to 2.0, and a median, or "normal", of0.67.
b. Ductinq. Surface ducting caused by a combination ofsuper-refractivity, heavy humidity layering, and sudden temperature inversionsthat prevail during the dry season months (January-April) has been identifiedin reference (2] as the major cause for deep fading in the RSL of the subjectlink. The worst fading conditions occurred during mid-April, between 0800 and1600-2200 hours of the day, with a wide fade duration of several minutes (10or less) when the RSL dropped from 15 dB (2-5 minutes) to more than 25 dB(less than a minute). Such a fade distribution was measured at the Mani:aEmbassy terminal, at a 152 foot elevation using a freqjer.y "of 1745 MHz(reference [2]). An additional 12.5 dB in this fadinQ 1-crib-,,) (20 log(7.318-1.745)) is expected for the median frequency f 1.318 GHz. The effectsof surface ducting are shown in Figure 13. The path profile of thepreliminary BESEP [4] was used for- a better illustration of the signal path,earth bulge and ducting effects. Note the reflection of the signal and thedisruption of signal paths (both direct and ;ea-reflected) caused by thesurface duct layer.
c. Rain Attenuation. The weather during the rainy season (May-December)has been characterized (in reference £2]) "by frequent and heavyprecipitation, much of each is the result of a local squall condition ratherthan the passing of large frontal air masses. Frequent rain tends to mix theair of the lower atmosphere, reducing the probability of stratification".
The magnitude of rain attenuation is controlled mostly by the maximuminstantaneous intensity of the rainfall, and the size of the area over whichthe high intensity (rain) cell extends at any given moment. Very littleinformation on these two entities is available for the subject link; thus therain attenuation is a probabilistic estimation. The attenuation due toprecipitation (CCIR model) is shown in Figure 14. Accounting for the
19
" I ... .. . .... ,I J ' ' ' ,wlU

IL.C~0
L- A- J!'. w -
I I4-
~~,a CD~g
=7 -1 Z
=~( Li nU
LLI 0 I ~ 0 4
I-- (= L
4-n~I J 4 4-)
-= a
cc 0l I-
UJ ...! * I
- ~ LJ L-a.LA 0,1 ILL.4 U
*-
anp 3ani~ldWV
____ ____).- - = -20
*1OS.-
LL
4.-
L6 cu!no LLJ
*~O LiO
V) I-
P ~~a ED ;
L-
c-r LU vtL U
(SP) A '3Qf.LIdWV
21

-l-
.4.-
Sc 0 .3aQ.
I. U
-Lt
L /7 N ) V
0 / -C a
aLL 0 c r .4 0
< 0 '
IL -C CL .7
43C /43~~(,e 7= 43'£0
0 6 43 06 43 A3
O> U7~ 070 22

10~
0.01
3 4 8 t 0 30 40 630 so0100
FAIGUENCY -O0HS
Atitinwatoni in rasntali tgnietv of! A. 0.23 mfftv~ (462101 - 01 inth3. 1 0 mmfflhv lq Illfl un 06 nIhw
.( .0MmR/tw imderuts tual - 16 mnohi0. 1 mnmlh? ilwv frfi -44 njnvf
a. 1 00 mm/hr jvery megr rain) - 4.0 inth?
Attemaatioftn og or clco:. F 0.032 giflEY ivisicilitv grlster *."Sn 600 mgteru(3. 0.32 gmm (visibvitv smit 120 metersa
H2.3 gm 3 Ivuwaaitv sait 30 Mr-Aw
*Ann -681~0 .1 61 c IAttfl An08kMI
Figure 14. Attenuation Due to Precipitation (After CCIR)
4 23
to__

intensity and area of precipitation reported for the rainy season, the rainattenuation could vary from 2 to 10 dB (see arrows in Figure 14). Note that,since negligible multipath fading and ducting occur during periods of heavyrainfall, most of the fade margin is available to combat the rain attenuation.
6. SUMMARY OF EXPECTED PERFORMANCE DEGRADATION
The various types of fading expected that affect the performance ofsubject link are summarized in Table II. The magnitude (in dB) of degradationand corrective actions designed to alleviate such effects are tabulated foreach type of fading considered in this section. The expected or measured rate
of occurrence for each type of fading is listed in the "Remarks" column.
In general, a combination of normal fading (predictability =90 to 95% oftime) with a specific type of abnormal fading (predictability 1-5% of time)would characterize the propagation conditions and in turn, the linkperformance. Such a fading mix includes: multipath plus sub-refractive orsuper-refractive fading, multipath plus surface ducting, and others. At thesame time, some of the fading occurrences are mutually exclusive, such as:multipath or ducting that would not occur during rain attenuation fading, andsub-refractive that would exclude super-refractive fading. It would be aformidable task to determine their distribution in relation to time andlocation along the path. Instead, the major contributors to link performancedegradations are analyzed and corrective actions are recommended to diminishtheir effects on overall path reliability.
7. EXPECTED LINK PERFORMANCE
A closer review of Table II indicates that the atmospheric anomalies whichwill probably cause degradation of system performance most of the time on theManila Embassy-Santa Rita digital LOS link will be a combination of multipathflat fading and surface ducting. These have been reported [2] to occur duringthe month of April, when the atmospheric conditions are characterized bysurface layering of high humidity causing above-standard gradients (low Kfactor) and abrupt temperature inversions. Depending on the duration andlocation of such adverse atmospheric conditions, the performance of thesubject link could be degraded to the level of complete outages that arerepetitive (less than 10 deep fades per day) and each lasting a very shorttime (few seconds). Use of space diversity would alleviate the effects ofthis type of fading combination. Also, depending on the thickness and heightof the ducting layer, a slight upward offsetting in the bore angle of theupper antenna at the Manila Embassy would further increase the linkperformance. The same link design approach would diminish degrading effectscaused by another fading combination - flat multipath with sub-refractivefading.
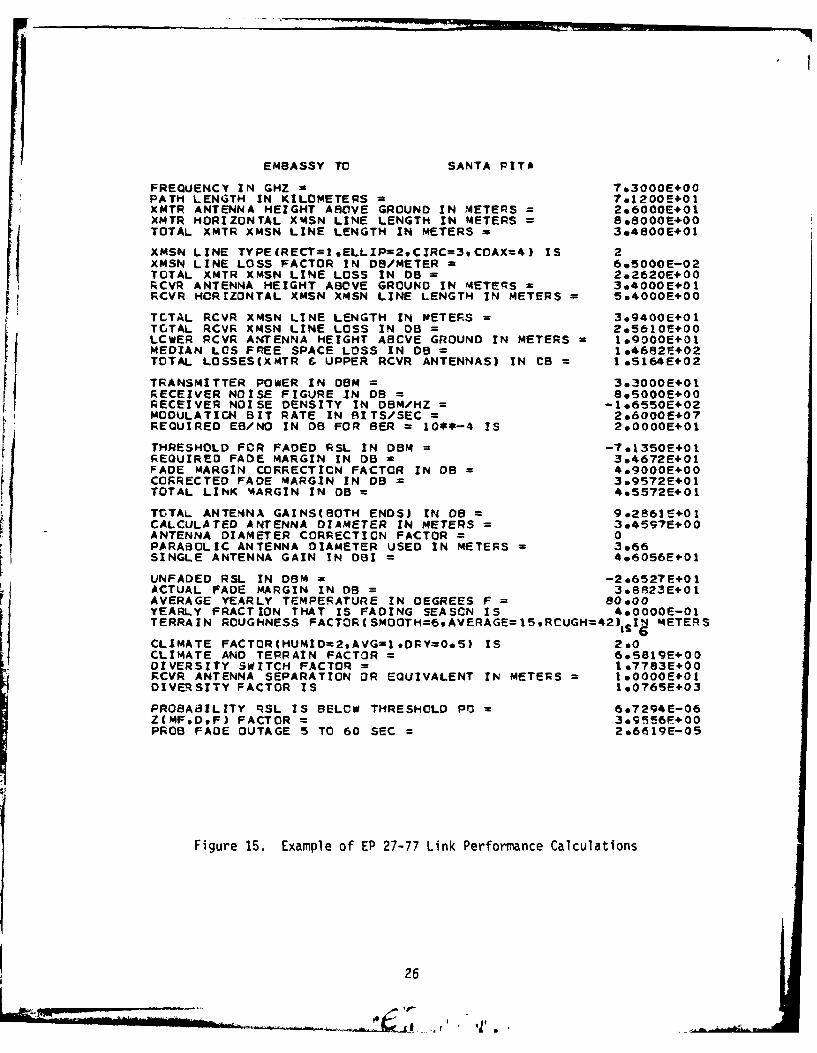
Design trade-offs among specific parameters of major components affectinglink performance (such as diversity, antenna size and bore angle, transmitteroutput power, receiver noise figure) are reviewed in order to optimizeperformance at a minimum cost. An example of link performance calculationsusing the EP 27-77 computer program is shown in Figure 15. For a dual space
24

30
tA '4- 4;1w) .- 0 0 L-
L/) 4.) 41 r L4- 1-. C -j r0 0 (L) I 0 j wAa m
LU- 41. 06C - toE * ~ - 4-E If0 ' CA to - =4I
LAI C 0 0 >1 a) ) Ua) S- Ec : C,.o
413 toE 410 PE) .0 L.E
o~ 4- A o L.t
w 4 1 EU a). ) -J . C0S- .- m S - < S S
to CP a) .0Q mc0 U
S a) 0) a)
LAJ I to 0 =V) ,- to)c
:" 43 441 w3 ~
L.) -! u, .- 4- W uS-
:.I 0. L. u CLL)oS .- (J 4J =
LLJ c ui o m5
im~~ j,: CLL-
EMBASSY TO SANTA PITA
FREQUENCY IN GHZ 73000E+0O0PATH LENGTH IN KILOMETERS = 7e1200E01XMTR ANTENNA HEIGHT ABOVE GROUND IN METERS = 2e6OOOE+01XMTR HORIZONTAL XMSN LINE LENGTH IN METERS = 8,8000E+00TOTAL XMTR XMSN LINE LENGTH IN METERS = 3*4800E+OI
XMSN LINE TYPE(RECT=1,ELLIP=2CIRC=3,CDAX=4) IS 2XMSN LINE LOSS FACTOR IN D8/METER = 695000E-02TOTAL XMTR XMSN LINE LOSS IN 08 = 202620E+O0RCVR ANTENNA HEIGHT ABOVE GROUND IN METECfS = 3*4000E+01
RCVR HORIZONTAL XMSN XMSN LINE LENGTH IN METERS = 5*4000E+00
TOTAL RCVR XMSN LINE LENGTH IN METEFS = 3*9400E+01TOTAL RCVR XMSN LINE LOSS IN 08 = 2e56106+00LCWER RCVR ANTENNA HEIGHT ABOVE GROUND IN METERS = le9000E+01MEDIAN LOS FREE SPACE LOSS IN DS = 1*4682E+02TOTAL LOSSES(XMTR & UPPER RCVR ANTENNAS) IN CB = 1.5164E02
TRANSMITTER POWER IN OBM = 3*3000E+ORECEIVER NOISE FIGURE IN DB - 80S000E+00RECEIVER NOISE DENSITY IN DBM/HZ = -196550E+02MODULATICN BIT RATE IN SITS/SEC = 2e6000E+07REQUIRED EB/NO IN 08 FOR BER = 10**-4 IS 2OOOOE+01
THRESHOLD FOR FADED RSL IN DBM = -7*1350E+0REQUIRED FADE MARGIN IN DB = 394672E+01FADE MARGIN CORRECTION FACTOR IN 0B = *9000E+O0CORRECTED FADE MARGIN IN D8 - 3o9572E+01TOTAL LINK MARGIN IN 0B = 4A5572E40
TOTAL ANTENNA GAINS(BOTH ENDS) IN OS = 9.2861E 01CALCULATED ANTENNA DIAMETER IN METERS = 3*45S7Et00ANTENNA DIAMETER CORRECTICN FACTOR = 0PARABOLIC ANTENNA DIAMETER USED IN METERS 3e66SINGLE ANTENNA GAIN IN 051 = 4*6056E 01
UNFADED RSL IN DSM = -2o6527E+01ACTUAL FADE MARGIN IN DS = 38R23E+0IAVERAGE YEARLY TEMPERATURE ZN DEGREES F = 80.00YEARLY FRACTION THAT IS FADING SEASON IS 4O0000E-01TERRAIN ROUGHNESS FACTOR(SMOOTH=6.AVERAGE=15.RCUGH=42) SIN METERS
CLIMATE FACTOR(HUMID-2*AVG=,DRY=O.5) IS 2.0CLIMATE AND TERRAIN FACTOR = 6*5819E+OODIVERSITY SWITCH FACTOR = 1*7783E+0!RCVR ANTENNA SEPARATION OR EQUIVALENT IN METERS = IO000OE 0DIVERSITY FACTOR IS teO?65E 03
PROBAaiLITY RSL IS BELOW THRESHOLD PC = 6e7294E-06Z(MF,DF) FACTOR = 3e9556F+O0PROS FADE OUTAGE 5 TO 60 SEC = 2*661 E-05
Figure 15. Example of EP 27-77 Link Performance Calculations
26
........

diversity configuration using 12 foot antennae 33 feet (10 meter) apart, atotal link margin of 45.6 dB summed up from a combination of a fade margin(multipath) of 34.7 dB, a correction factor (atmospheric and rain attenuation)of 4.9 dB, and 6 dB for system miscellaneous losses (refer to calculations ofFigure 15 for details). The performance of such a link configuration meetsthe DCS design criteria for digital LOS links specified in terms of theprobability that the fade outage duration will be greater than 5 seconds butless than or equal to 60 seconds and be less than or equal to 3.69 x l0
-5
(i.e. 2x2.6xlO " x D, in km). This is representative of the linkperformance calculations that account for normal multipath fading, averageterrain and climate of the subject link. Other design alternatives satisfyingthe DCS performance criteria are shown in Table III. Three types of systemconfigurations are compared through power budget trade-offs among varioussizes of antenna ranging from 10 to 15 feet, output transmitter power rangingfrom 2 to 5 watts, and receiver noise ranging from 6 to 10 dB. A retrofit oradditional equipment would be required for the parameters listed in Table IIIthat are more stringent than the DRAMA equipment specifications (i.e., 5wpower and 6 dB for NF).
I7

TABLE 11.
ALTERNATIVES FOR MANILA EMBASSY-SANTA RITA DIGITAL LOS LINK CONFIGURATION
DIVERSITY ANTENNA TRANSMITTER RECEIVER(NOTE) SIZE (FT.) POWER (w) NOISE FIGURE (dB)
e Dual-Frequency 15 2 10(2F)
10 5* 10
e Dual-Space 15 2 10(2S)
12 2 8.5
10 5* 10
10 2 6*
@ Quad (2F/2S)* 10 2 10
*DRAMA radio equipment is specified with a xmtr P.O. of 2 w (max), and NF equivof 8.5 dB (max).. Additional equipment, or a retrofit may be required forother values shown for transmitter P.O. (5 w) and NF (6 dB).
NOTE: Improvement factor of 2S is - 4 times that of 2F.Improvement factor of 2F/2S is slightly better than that of 2S.
28
4 o l .. . ..... i

IV. RECOMMENDED LINK CONFIGURATION
The design alternative recommended for configuration of subject link wouldprovide an optimum link performance through a maximum link margin and anadequate path clearance at the reflection point. This design is constrainedby existing antenna tower heights at Santa Rita and possibly a new antennatower at the Manila Embassy, by ruling-out the addition of an active repeaterat Angat, by the parameters specified for DRAMA radio equipment, and expectedlink performance described above.
Based on the assumptions made throughout this analysis and on theperformance degradation sun~narized in Table II, the following linkconfiguration is recommended:
*1 (1) Dual space diversity with antenna separation of 33 feet (10 meters).A minimum 120 feet antenna tower height would be required at the ManilaEmbassy location to accommodate such a configuration.
(2) Antenna dishes of 12 feet in diameter at each end.
(3) Transmitter power output of 2 watts.
(4) If necessary, elevate bore angle of upper antenna at Manila Embassyby % 0.150 to compensate for adverse effects of subrefractive K values(refer to Figure 1 in Appendix A) and to increase penetration angle through anelevated ducting layer (refer to Figure 13). A penalty of :l dB in signalstrength is expected to result from such an offset. Figure 16 shows a typicalradiation pattern of a 12 ft. parabolic antenna with a cosine distribution;the arrows point to the 0.150 offsetting in the bore angle and the I dBsignal degradation. Such an optimization is recommended for implementationbased upon results of a performance monitoring activity designed to defineducting/subrefractive adverse conditions.
The performance of the recommended link configuration is expected to meetthe DCS performance criteria. Further characterization is recommended todefine impact of surface ducting (most severe in April) and subrefractive Kvariations in terms of signal level attenuation and distribution ofoccurrences. Route diversity (via Angat and DAU) is recommended for allcritical circuits.
29

VERTICAL POLARIZATION
/R& DISTRIBUTION
Par NDAiRY AntenMNRLOBES
+ SIGN INDICATES THIE
L__"DEGREES OFF BORE SIGHT
__ stidef2nd Sidell3rd Sidel4th Side th..S" --- Lbe ob Fobe 'Lobe ALob tLobe
Figure 16. Typical Radiation Pattern of a 12 Ft. CircularParabolic Antenna
30
Sr _--

V. CONCLUSIONS
Various combinations of fading have been identified on the Manila Embassy- Santa Rita radio link which could affect its performance, with the worstoffender being a mix of multipath fading and surface ducting conditionsprevailing during the dry season months. Partial or total traffic disruptioncould result from such anomalous propagation conditions.
A digital LOS link configuration in concert with the DCS performancecriteria is recommended to alleviate such deleterious effects. Thisconfiguration is based on the performance improvement offered by a dual spacediversity, availability of the DRAMA radio equipment, a 120-foot antenna towerheight at the Manila Embassy location, and if necessary offsetting the antennabore angle of the upper antenna at the same location.
In addition, based on the link performance degradation expected to becaused mostly by a combination of multipath flat fading and surface ducting,the assessment was made that insignificant improvements would be gained byusing the DRAMA radio equipment in a quadruple or hybrid diversityconfiguration, or by using a non-DRAMA radio equipment with an adaptiveequalizer.
31

REFERENCES
[1] OT Report 75-59, "Refractivity Gradients in the Northern Hemisphere,"Sampson, C. A. (1975).
[2] US NAVELEX Research Report 566, "Propagation Characteristics of aProposed Microwave Communication System in the Philippine Islands,"Hopkins, R. U. F., and Hughes, L. R. (1975).
[3] GTE Lenkurt Inc., Engineering Considerations for Microwave CommunicationsSystemsjEngineering Report, (1975).
[4] USNSEEAC Philippines (1980), Philippine DCS Digital Microwave, U.S.
Embassy, Preliminary BESEP.
32
let,

i.!
p I
APPENDIX A
DETERMINING THE K FACTOR TO USE IN LOSMICROWAVE LINKS FROM CUMULATIVE PROBABILITY
DISTRIBUTIONS OF THE REFRACTIVITY GRADIENT DATA,
dN/dh, FOR A GIVEN KFACTOR AVAILABILITY
iI
-,

BACKGROUND
In many parts of the world, there are frequent occasions where the Kfactor, effective earth radius, is less than unity. This condition isfrequently referred to as inverse bending and is caused by a subrefractiveatmosphere. The effect produced is that of the earth bulging up into themicrowave path which starts to block the path (no longer LOS); the diffractionmode of propagation then comes into play causing increased path loss. Thisloss of signal due to inverse bending is usually counteracted by providingmore path clearance.
PURPOSE
The purpose of this paper is to present a technique which would beapplicable to determining the K value to be used in LOS microwave pathengineering when a value of media availability is to be met on a LOS path in aparticular region of the world.
TECHNICAL DISCUSSION
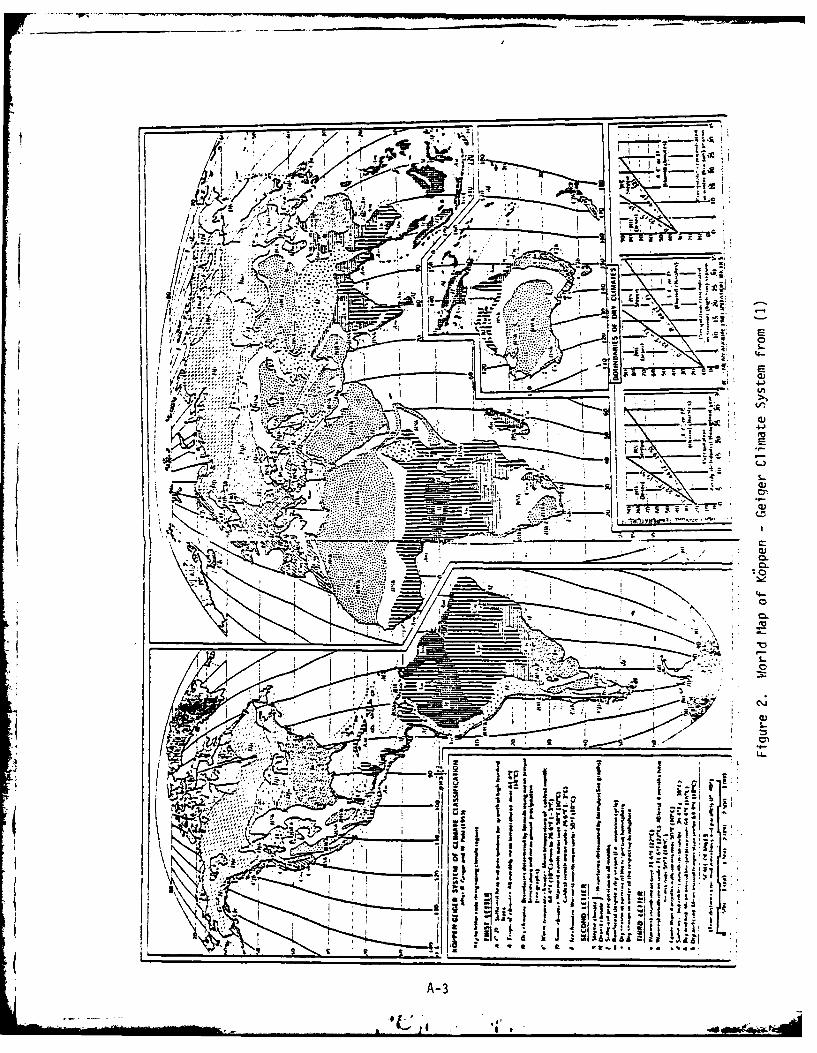
Substandard or less than standard refraction occurs with certainmeteorological conditions which causes the atmospheric density to actuallyincrease with height. This condition described earlier as earth's buldge orinverse beam bending, causes an effective upward curvature of the earth asshown in Figure 1. A substandard atmospheric condition may occur through theformation of fog created with the passage of warm air over cool air or a moistsurface. This will cause the atmospheric density to be lower near the groundthan at higher elevations, causing an upward bending of the beam. Fog issimply a form of stratus cloud lying very close to the ground. One type,known as a radiation fog, commonly accompanies temperature inversion and isformed at night when temperature of the basal air falls below the dew point.Another type, advection fog, results from the movement of warm, moist air overa cold or snow-covered ground surface. Losing heat to the ground, the airlayer undergoes a drop of temperature below the dew point, and condensationsets in. A similar type of advection fog is formed over oceans when a warmcurrent blows across the cold surface of an adjacent cold current. Fogs ofthe Grand Banks off Newfoundland are largely of this origin because here thecold Labrador current comes in contact with warm waters of the Gulf Stream.Coastal areas and river valleys are especially likely to have anomalouspropagation (substandard) relative to air stratification, and extremerefractivity values are most likely to occur in layers of rather limitedvertical extent. Tropical and sub-tropical regions generally have largerdiurnal and interdiurnal variations in refractivity gradients than dotemperate regions. Refractivity is highly sensitive to humidity. Figure 2illustrates the Koppen-Geiger climate system of the world which is useful inpredicting where in the world these substandard regions occur.
Collins Radio(2 ) has treated the effect of earth (bulge) clearance onthe free space path loss, as outlined here. Figure 3, taken from Bullington'sarticle on Radio Propagation, BSTJ, May, 1957, shows the effect of clearanceon the transmission loss relative to free space. The terms used in Figure 3are as follows:
A-l
a6

i l 'I
I
a. Normal refractivity condition.
b. Grazing refractivity condition.
c. Earth bulge refractivity condition,diffraction mode. (K could be 2/3 and lower).
Figure 1. Simplified Diagram Illustrating Inverse Bending
4! A-2
IPI
TI.~ = i. 'T
II P
-:1 E z -
......... MR
04.M j'1k 7' jIt
SL-
.. ........
A-3II

E'4
us, uJ
Iz ul
zto
UAU
Z n U.)
CC UA
zt
1 0
4" 410
K U.
A-4-

Z]
hl and h2 =absolute antenna heights, ft.
K = effective earth radiustrue earth radius
F = operating frequency, MHz
r= reflection coefficient of surface
(rc = -1 smooth sphere diffraction)
H = clearance, ft.
R= first Fresnel radius, ft.
The attenuation due to inverse bending may be estimated assuming differentvalues of K. Earth bulge may be calculated as:
h = 0.667 dl d2, (2)
resulting in the earth bulge, h, assuming a K factor of unity (true earthradius). It may be expressed in more general terms as
Earth bulge, h = F1 2 (3)
where,
hi earth bulge, feet
dl distance from initial end of system, miles
1d2 adistance from far end of system, miles
effective earth radiusK true earth radius
A path would normally be designed to allow at least 0.3 fresnel zoneclearance. In areas where the K factor is subject to severe variation,the earth bulge can be estimated for the lowest K factor. From this,
( A-5
4- --

the amount of reduced clearance can be estimated. Then, using Figure 3, themagnitude of the fade can be estimated assuming smooth sphere diffraction.
Basically, the problem of fading due to inverse bending is combated byproviding larger Fresnel radius clearance. It is sometimes more economical toprovide additional fade margin In the form of a larger antenna and higherpower transmitters.
DETERMINING K FACTOR FOR A REGION
The data needed to determine the K factor for a given region is thecumulative refractivity gradients for the region of concern. Information onthe refractivity gradients to be expected in any part of the world isavailable in several publications. 3 , 4, 5) These data are the bestavailable at the present time and they have some serious shortcomings. Thesewill be explained in the following paragraphs. These references contain mapsshowing the 100-m gradients exceeded for selected percentages of time. Forapplication to the design of radio links, many engineers prefer a completecumulative time probability distribution of the gradients at specificlocations. Data for 4 months of the year are shown on the same graph tofacilitate seasonal comparisons. Accompanying each graph is information onthe length of record analyzed, the hours at which observations were taken, andgeneral climatic and topographic details in the vicinity of the station.Figure 4 is data for Hilo, Hawaii from reference (5) and is typical of thedata available. This data will be used in this report for illustrativepurposes.
Refractivity gradients can be calculated from the radiosonde observations(RAOBs) made by national meteorological services in the various countries.However, these observations of the vertical changes in temperature, pressure,and humidity do not provide as much detail and accuracy as is desirable forstudies of radio refractivity.
Climatological RAOB data for the United States and many foreign locationsare on file at the National Climatic Center in Asheville, N.C. The analysisof these data to obtain refractivity statistics requires that the refractiveindex be calculated for the individual data points on each sounding; aninterpolation must be made to obtain the refractivity value at the desiredheight, and the gradient over the interval can then be calculated. To avoidpossible misleading indications related to the year-to-year variations inweather conditions, data for a number of years must be considered if a goodclimatological average is to be obtained. Climatic data for a 5-year period,including two observations per day, were used in this analysis. Only onemonth in each season was processed, and the observations at different times ofday were not treated separately. Stations were selected to provide widegeographical coverage, rather than to give a dense coverage in a few areas.Each graph in reference (5) has a dual scale on the ordinate to show both therefractivity gradient in N-units/km and the equivalent effective earth radiusfactor, "K", which is used to compensate for ray bending in terrain profile
A-6

PERCENT F TIME ORDINATE IS NOT EXCmEwD
99 .995. 9998 95 90 80 7 60 50 40 30 20 10 5 2 1 .5 .2 J.05 .0130G " ' _ __ _--___S: : - : Cumulove Distribution of the
- --- C.sffvedRodwo Refractivity Gradientn t. &= e -Gbased /O0-mefor LOW
• t I .HILO .
L fWay -_ A*it1-"
tadA- -"0 -
PERCENT OF TIME OROINA4TE IS £ XCEEDED
Ni1o, Hawaii
19-44 N, 155-04 W. 1. meters MSLData: Radiosonde. 0300 and 1500Z (1700 and 0500 LST)
8/52 - 8/54 and 2/55 - 5/57
(Also 0300, 0900, 1500, and 2100Z for 11/54 only)
Temperature (OF): January 79/63; July 82/67
Mean Dewpoint (OF): January 62; July 68
Precipitation (inches): Annual 136.6; December 15.18; June 6.79
Station is located near the eastern shore of a large, mountainous island(area 4038 sq. miles; peaks above 13600 ft); it is within the northeasttrade wind belt. Day-to-day and seasonal weather changes generally smallat locations near sea level, but temperatures, precipitation, and cloudi-ness in vicinity vary greatly with elevation and degree of exposure tothe trade winds.
Figure 4. Cumulative Refractivity Gradient for Hilo, Hawaii
A-7

analysis of radio links. The factor "K" is related to the refractivitygradient N/ h in N-units/km by
k 1 + 6370 6N x 10 6
W -(4)
where 6370 km represents the actual earth radius.
Also:
k1L dN
157 (5)
The graphs show the cumulative distribution of the radio refractivitygradients in the gound-based 100-m layer, as calculated from an radiosondeobservations during the period specified under "Data".
Figure 4 shows the percentage of the observations in which variousrefractivity gradients were found in the lowest 100 meters; they do notindicate the percentage of time in a year that such gradients can beexpected. Although the latter statistics are desired for propagation andsystem performance estimates, the available data are insufficient to make sucha determination. The radiosonde package rises through the lowest 100-m layerin less than 30 seconds, and this only twice a day at most stations. Thus, wehave available two very brief samplings of atmospheric structure daily, ratherthan frequent or continuous measurements. It seems unlikely that the extremesof the diurnal gradient variation would always occur at OOOOZ and 1200Z (or0300Z and 1500Z); therefore the refractivity gradient statistics based on
RAOBs can be assumed to show a lower probability of occurrence of the extremegradients than would be the case if observations were made hourly.
The graphs in the references are especially useful for station-to-stationcomparisons, such as estimating the probability of subrefraction in two areaswith differing climates where performance data are available for only one ofthe areas. Thus, the relative probability of a certain K-value being exceededcan be estimated by reference to the graphs, as can strong superrefraction orducting. In making such estimate, however, one should check both the lengthof record and the number of observations per day at a particular station.Also, the local time of the observations should be considered; for example, adistribution b-ased primat ly on nighttime (or only daytime) observations maygive a distorted indication of the overall probability of occurrence ofvarious gradients.
A-8
I.J

Variations in refractivity gradients tend to be closely related to thelocal or sun-referenced time, because of the influence of heating and coolingof the earth's surface on the stratification of air layers near the ground.For example, extreme gradients of refractivity often occur near sunrise whennocturnal temperature inversions tend to be most pronounced, and near sunsetwhen there is a rapid shift from gain to loss of heat in the air layer nearthe ground. RAOBs, however, are taken at standard times which do not alwayscoincide with the local time when extreme gradients are most likely to occur.The variation of sunrise/sunset times during the year should also beconsidered, particularly at high-latitude stations. The atmospheric layersnear the surface are greatly influenced by terrain features, ground moisturesources, and vegetation; thus, on most long overland paths, low-levelrefractivity gradients can be expected to vary by appreciable amounts overdistances on the order of a few kilometers. The net result of this variationin space should be to produce less extreme effective path gradients than mightbe assumed from consideration of radiosonde data at one point on the path. Onthe other hand, the RAOB data are likely to yield conservative indications ofgradient intensity because of the very limited sampling periods per day. Thisposes a dilemma not easily resolved. The relationship between point and pathrefractivity is not known, and the total time per year in which certaingradients will affect a given path must be estimated from the statistics ofoccurrence during two very brief observations each day at some weather stationpossibly hundreds of kilometers from the radio path.
The more extreme positive refractivity gradients near the surface aregreatly influenced by local conditions of terrain, moisture sources, etc., andare not likely to extend over wide areas. A further comment fromLenkurt(6), is as follows:
"Experience has indicated that, for actual microwave paths,the effective k over the entire path reaches a very high or verylow value for a much smaller percentage of time than would beindicated by the distribution of k values as found by meteorologicalmeasurements at single points. The most probable explanation isthat the usual conditions causing these extreme values are unlikelyto occur over more than a small part of the path of any giveninstant."
Coastal areas and river valleys are especially likely to have anomalouspropagation related to air stratification, and extreme refractivity values aremost likely to occur in layers of rather limited vertical extent.
Tropical and subtropical regions generally have larger diurnal andinterdiurnal variations in refractivity gradients than do temperate regions.Extreme gradients are also much more common in the tropics, and over layers oflimited thickness (up to a few tens of meters) may at times exceed +1000N-units/km. Use of the data from the nearest RAOB station is not aTways asatisfactory approach to radio-climatological estimates in the tropics, unlesslocal modifications of the indicated refractivity are considered.
A-9

The refractivity is highly sensitive to humidity, which can change rapidlyover comparatively limited horizontal or vertical distances in the tropics.Such changes often occur in land/sea breeze circulations, trade-windsubsidence regions, and monsoonal flows. At higher latitudes, however, themovement of air masses involved in large-scale weather systems may effectivelyproduce a temporary "tropical" environment in a normally "temperate" region,as when warm, moist air masses move over the central United States from theGulf of Mexico. Thus the extreme gradients common to many tropical regionscan also be expected to occur at times in more temperate regions.
In summary, the available data on refractivity gradients is deficient foruse by engineers to perform detailed K factor analysis on microwave paths inthe following areas:
1. Few number of point observations per day.
2. Only one month of data in each 3 month season was processed.
3. Observations at different times of day were not treated separately.
4. Stations selected to give geographical coverage, rather than densecoverage in a few areas.
5. Some data are based on only one month of observations.
6. The time of day most data are taken does not correspond to the localtime when extreme gradients are most likely to occur.
Not withstanding the above discussion, the following procedure can be usedto determine "ball park" values of K factors for problem regions. Once moreaccurate and fine grain data is provided on cumulative refractivity gradients,more accurate values of K factors can be calculated by using the followingtechniques.
K FACTOR DETERMINATION PROCEDURE
Figure 4 will be used to determine the K factor to be used in LOS pathengineering analyses for the region of Hilo, Hawaii. The problem is todetermine a K factor for the area so that this K value is not exceeded for acertain K factor availability, in percent of a year. Let us use, as anexample, 99.9% of the year for the K factor availability.
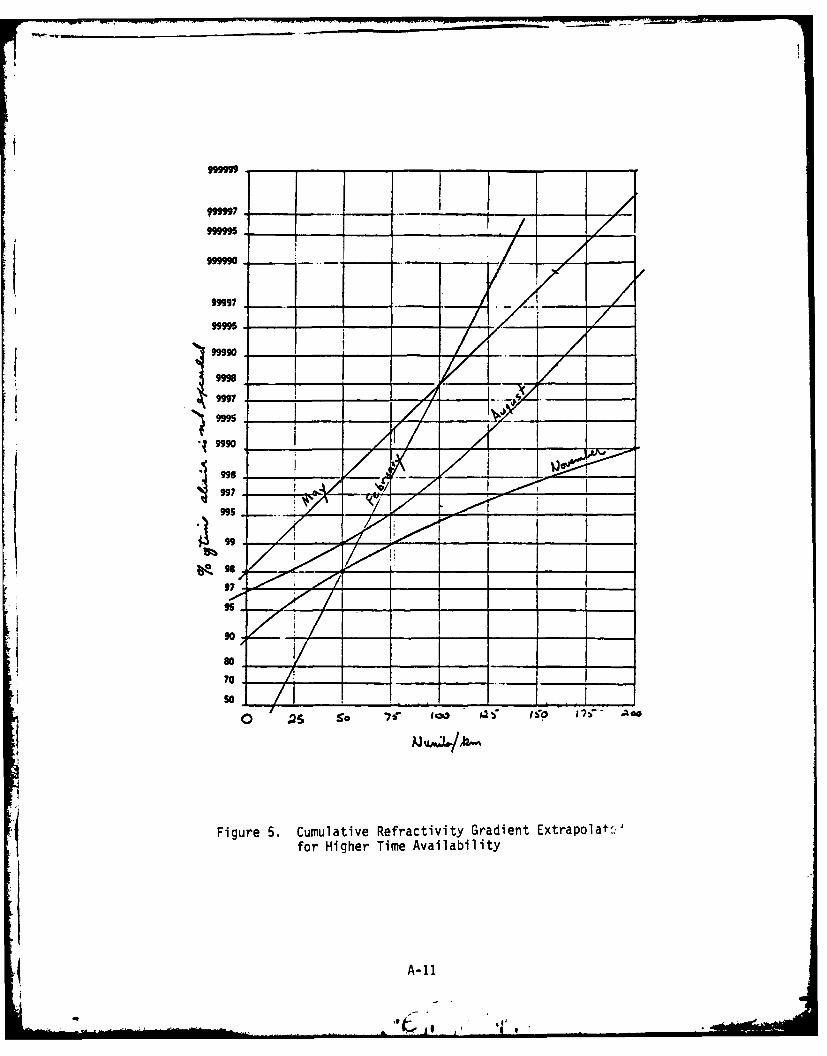
Notice in looking at Figure 4 that data are scarce for large values ofpositive refractivity gradient area of the graph. The only recourse for thisanalysis, keeping in mind the limitations of this chdrt as discussed inprevious section, is to extrapolate into the uncharted region of the graph.This has to be done with extreme caution. This can be done by observing thetrend of the curves in the rest of the graph. Figure 5 is such anextrapolated graph from Figure 4 and shows the relationship of refractivity topercent of time in the higher availability areas.
A-10
99"7
990 - __ _-
.99
M__________
o "95* ~ ~
Fgur .Cmltv ercivt rdetEtaoa4 orHihr im Aalailt
4 A-li

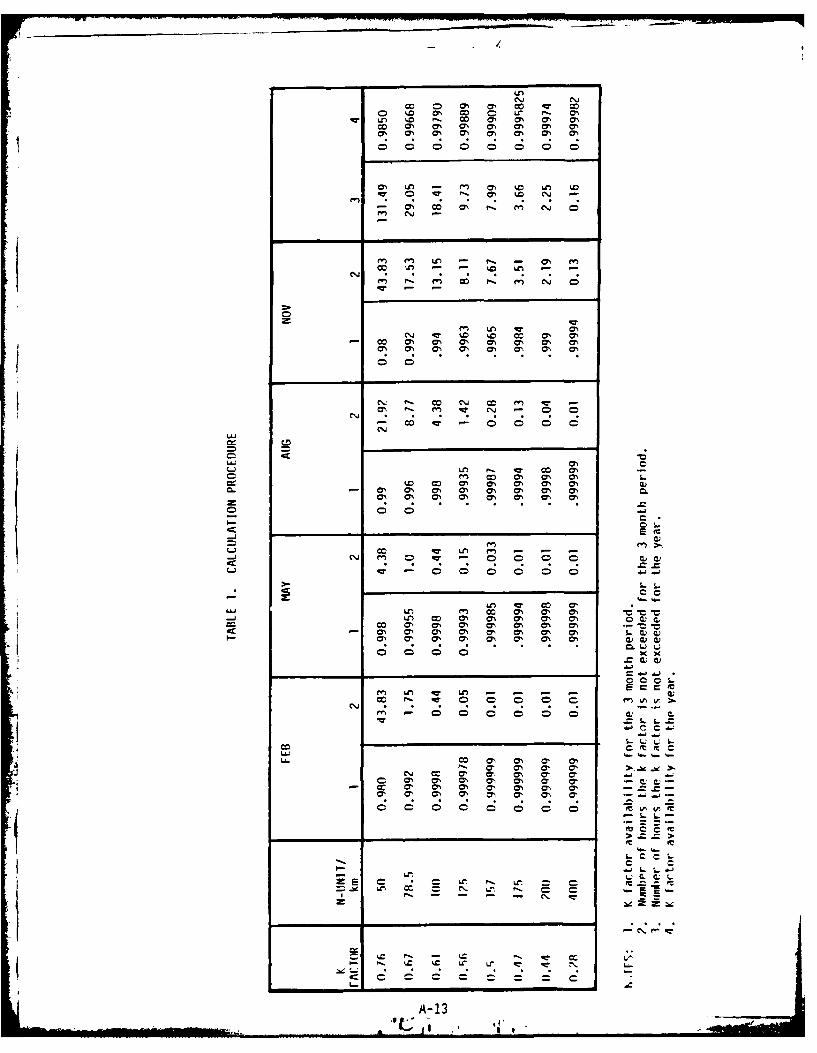
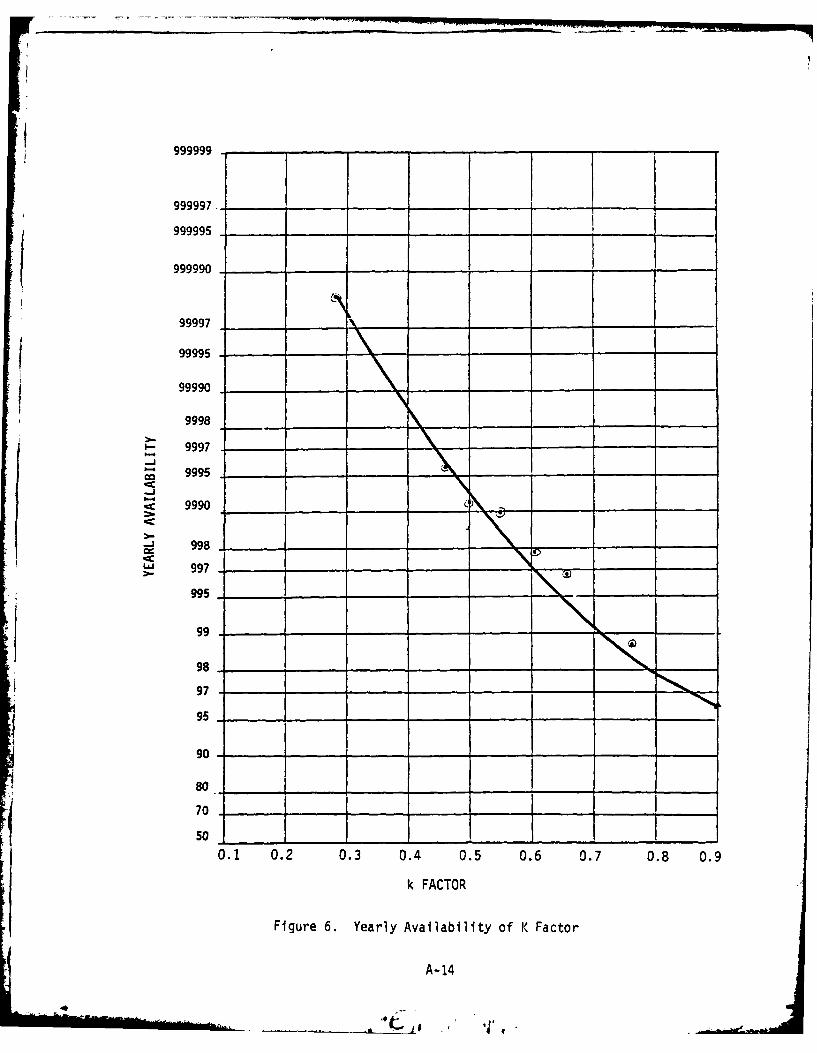
The next step is to prepare a table as shown in Table 1 in which data fromFigure 5 are entered for several K factors (and refractivity gradients) andfor the 4 months of the year, as shown in Figure 4. There are 2191.5 hours ina typical 3 month period and 8766 hours in a year. Since each of the monthsin Figure 4 represents really 3 months of data, the percentage of time the Kfactor is exceeded is multiplied by the number of hours in 3 months and thisrepresents the number of hours that particular gradient is exceeded duringthat period. This number of hours is entered in the appropriate place inTable 1. Once this is accomplished for all gradient values of interest, thesum of the hours is taken for each gradient value and this sum is then thenumber of hours in the year that this gradient value is exceeded. Todetermine the media availability for the year, divide into this year sum hoursthe total number of hours in a year (8766 hr) and subtract this q from one,which gives the yearly value of refractivity gradient (or K factor) which isnot exceeded for each of the K factors (last column in Table 1). These Kvalues are then plotted on probability paper as shown in Figure 6. FromFigure 6, it is seen that a K factor availability of 0.999 is obtained when
using a K factor of approximately 0.5 in the Hilo, Hawaii region.
The actual value of K factor is more than likely larger than this, but dueto the coarse grain of the available data, the distribution of therefractivity gradient during any 3 month period is not known, and these dataare needed if more accurate K factors are to be determined. The procedureoutlined above still holds; just more accurate data is needed.
The determination of media availability from the K factor availabilitywill be discussed in a future paper. This has to do with determining thedistribution of increase of free space path loss as a function of theprevailing K factor in a certain region by the implementation of Figure 3 inthis report.
A-12
4
, * C: 1 ,
CD %0 m 0 Lrol %0o co~0~ - 0
ON % m% m% m% 0% aN
C % 0% 0 % 0 %j 0
0C C-400 0
0% ~ ~ r L1n ~ 0 'c0 U) .
-1 0% C7 m% i ~ e
m ON ON C.. m 0% ON
cl C.
LA.;~ 0C-) LM '.0 '.0 m %
CD 0 0
0% 1-c Ln m % - 0 0
-s n - 0 0 0D 0 ud
kn c m ON (7 0% 0W(L
- o 0% ON 0, Ch ON ON.(),% CN 0% 0% ON m% m0U%1
CO %A LA ., -
F.. O..
0; = ; C;
999999. ___
999950
999907 ____ ____
99995 ____
I- 9997 ____
ca 9995 ____
S 9990 __________ ____
997. _ _ _ _ _ _ _ _
995_ _ __ _
98 _________
97. _ _ __ _
90 ____ ________
70T
I.0.1 0.2 0.3 0.4 0.5 0.6 0.7 0.8 0.9
k FACTOR
Figure 6. Yearly Availability of K Factor
A- 14

REFERENCES
1. Strahler, A. N., Ph sical Geography , Second Edition, John Wiley & Son,Inc., New York, 19.
2. Collins Radio Company, "Propagation Considerations for 6 and 12 GHzMicrowave Communication Systems", CEL-22, September 10, 1962.
3. Bean, B. R., B. A. Cahoon, C. A. Samson, and G. 0. Thayer (1966), "AWorld Atlas of Atmospheric Radio Refractivity", ESSA Monograph 1(NTIS, AD648805).
4. NBS Monograph 22, "Climatic Charts and Data of the Radio Refractive Indexfor the United States and the World", 1960.
5. OT Report 75-59, Samson, C. A., "Refractivity Gradients in the NorthernHemisphere", April 1975.
6. Lenkurt 6000 MC-ENG-l, "Microwave Path Engineering Considerations6000-8000 MHz", September 1961.
A-15 j

If
APPENDIX B
FADING CHARACTERISTICS FOR OVER-THE-WATERMICROWAVE LINKS
-4 , ¢ , •,

*1i
APPENDIX B. FADING CHARACTERISTICS FOR OVER-THE-WATER
MICROWAVE LINKS
In this appendix, a mathematical model for predicting the characteristicsof a received microwave signal modified by interference due to reflectionsfrom the sea is described. The change in absolute signal level or fadingdepth depends on the state of polarization of the radiation, thecharacteristics of the sea and the geometry of the radio link. The geometrywhich defines the relative positions of the transmitter, receiver andreflection zone allows for earth curvature. Plane polarized radiation isassumed with circular aperture using parabolic antennas. Also, an allowedseatide variation is built into the model.
After presentation of this model, the Santa Rita - Embassy link analysisis set up by showing values selected for input to the model. Finally, thecomputer program written for this model is attached.
1. Flat Earth Geometry
Figure 1. Flat Earth Geometry
a. Grazing Angle. From the geometry in Figure 1 it is clear that theangle of incidence and hence the angle of reflection P is given by:
_____I . I (B.1)
B-?
Af 1"

where
HT = transmitter height above MSL - sea tide heightHR = receiver height above MSL - sea tide heightD = Path length.
b. Path Difference. Also from the geometry in Figure 1, the direct rayf has length
R(B.2)
and the reflected ray has length
-- (B.3)
The path difference is therefore
i a : Cr+ T<(B.4)
2. Correction For Curved Earth
DIRECT PATH
Figure 2. Curved Earth Geometry
B- 2
-_ ,.."C "

Figure 2 illustrates the pertinent geometry for curved earth. Fromreference 1, it is shown that
where
+ (B.6)11T
and
2- 4 C (B.7)
and ae = earth radius (3958.32 miles).
We now define four parameters,S, ST, SR, and T:
T a- (B.8)
cia
(B.9)
(B.11)
The three correction factors for curved earth are then defined In terms of these
four parameters
( (B.12)
B-3t
- *~-.* te -~ '

- (.14)
a. Grazing Angle. The grazing angle corrected for curved earth is givenby
tams~ 4- + *kC%1(S,) (B.15)
b. Path Difference. The path difference corrected for curved earth isgiven by
R [(B.16)
3. Ratio of Resultant Signal to Direct Signal
Figure 3. Two Ray Geometry
Consider a two path microwave link withER = amplitude of resultantED = amplitude of direct pathEI = amplitude of indirect (reflected) path.
By the simple geometry of Figure 3 and the law of cosines
(B.17)
B-4

Defining o ISO (9- ( ) , the above expression becomes
or (B.19)EV = -.
where
y = -- degradation of the indirect signal in relationED to direct signal
X z -9 - phase difference between direct and indirectsignals
phase shift due to reflection off surface ofearth
physical path length difference expressed in
radians.
The ratio, rr) , of indirect to direct signals is a function of the antennaradiation pattern, the magnitude of the reflection coefficient, and thedivergence factor, as shown below:
iwerMr = ' ),- Rv 'I R (B.20)
where
Dc = divergence factor, D(S,T), for curved earthRv = magnitude of the reflection coefficientET = ratio of signal at boresight of transmit antenna to signal
off boresight in direction of reflection point on surfaceof earth
ER = same as ET but for receive antenna.
B-5

Also, taking into account the antenna geometry¥ e- CT - (B.21)
where 6 and are as previously defined and
~e- 1 , & = are 0 when reflected signal is in main lobe ofantenna pattern or in an even numbered side lobe, and
are v radians when reflected signal either enters or
leaves an odd numbered side lobe of the antenna.
a. Calculation of Divergence Factor. Radiation reflected from a
spherical surface diverges at a greater rate after reflection than it would
from a plane surface. To allow for this, the divergence factor D(S,T) is
introduced. This factor modifies the reflection coefficient as a multiplying
factor in the same way as the grazing angle and path difference were
modified. See Eq. (B. 12).
b. Calculation of Complex Reflection Coefficient. For vertically
polarized radiation the complex reflection coefficient is [2]:
- ~.(B.22)
and for horizontally polarized radiation
SIN - - CO (B.23
where
RV,H represents amplitude change due to reflection for vertical and
horizontal polarization
V,H rpeetphschnedue to reflection for vertical and
horizontal polarization
and
00 E- (B.24)
where
= relative permittivity of the medium
= conductivity, mho-meters/square meter
= carrier frequency in MHZ.
c. Calculation of Antenna Patterns
B-6

The relation between the field strengths of direct versus reflected paths maybe expressed conveniently as a ratio. From Figure 4, this ratio for thetransmit antenna is given by
Z - (B.25)
&OT
and for the receive antenna is given by
P7 E7k(B.26)
For parabolic antennas (circular aperatur4 the field intensity is proportionalto [3]:
E (c4 (B.27)
where r.
* first-order Bessel function
= antenna radius
angle of antenna with respect to boresight.
Using the geometry of Figure 4, we can calculate the antenna angles off bore-sight toward the reflection point. For the flat earth model,
7 C(B.28)
-(B.29)
(B -7

For curved earth, the above two expressions are modified by K(S,T) as follows:
T - tv Ar (8.30)
The four field strengths,ERT, EOT, ERR and EORsmay be calculated using
Eq. (B. 27) in conjunction with Eqs. (B. 30) and (B. 31).
4 8pplication to Phillipines Link. Table I shows pertinent link parameters
for the Manila Embassy - Santa Rita link. Finally, a listing of the computer
program with subroutines is included, which was used to obtain results shown
in the main body of this report.
II Fioure 4. Antenna Pattern Geometry
B-8
.. . . . .. *ll ...... . . .. . . .. . . . J - "
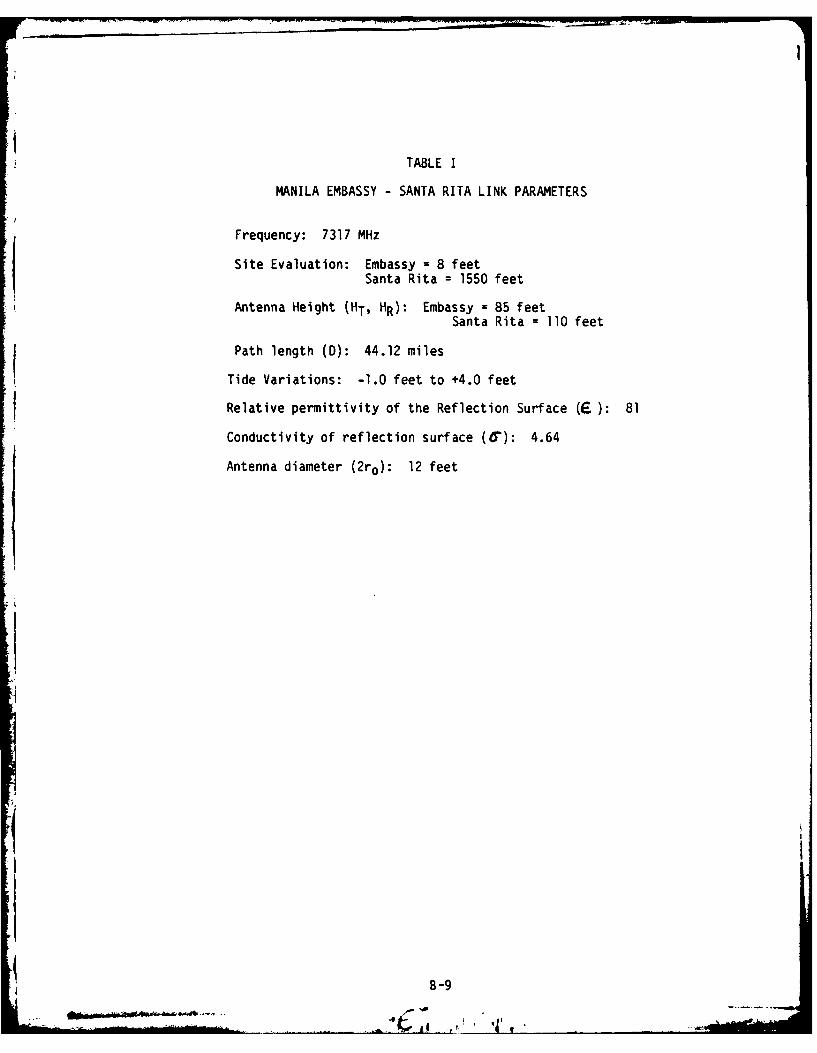
TABLE I
MANILA EMBASSY - SANTA RITA LINK PARAMETERS
Frequency: 7317 MHz
Site Evaluation: Embassy = 8 feetSanta Rita = 1550 feet
Antenna Height (HT, HR): Embassy = 85 feet
Santa Rita = 110 feet
Path length (D): 44.12 miles
Tide Variations: -1.0 feet to +4.0 feet
Relative permittivity of the Reflection Surface (E): 81
Conductivity of reflection surface (6): 4.64
Antenna diameter (2ro): 12 feet
B-9
- ; i ' . . . . .... . .. . .. . .. ,. . . . .. . .. .... ... .. . . .. . ! .., !
I !! .

REFERENCES
1. D. E. Kerr, "Propagation of Short Radio Waves", M.I.T. Radiation LaboratorySeries, Vol. 13.
2. Henry R. Reed and Carl M. Russell, Ultra High Frequency Propagation,Science Paperbacks and Chapman & Hall Ltd, 1966.
3. Merrill J. Skolnik, Introduction to Radar Systems, McGraw-Hill BookCompany, Inc., 1962.
! 4. D. R. Gager, "Signal Fading Characteristics Due to Reflections from the
Sea", The Marconi Review, Vol. XXXIV, No. 180, 1971.
B-10
-O * 4

ICLC
P-Z.......Cfi... ........CC
Mr L.:
dc 91.oc~o~~oooocO~cCexr tn. =lc ==-MC csC rf.C
cw *
16'00 N0 N ~ ~ 0
V' -c iz: m !eO =c mO z "o e~o
1. 6
B-1
b3 go va- u~ Mh b3 63 02
* .. . . . * .** .......
00000004M M0*777777777
I lit. e 't
~c~c~~cC~oo~eCC~Co~~OalcCCOC
cc~cccca~ecocccoceocoaBoc12
4*~~~ Sim*.**,**** *****

EflCLA, SS IF IED
ST>~JFDCC TT~~'?P~1 DS!'TA9E=FJR9i3.L0S.Fn2T?7PAL*4 !,!,TjC jjJj- 03010REAL*Q ,Lvl ,C 42TC)S E c S KTL.I,) 00060
c 00000INlZ'TZR S:TE- J0000
C 0000011TEr,7T*2 7.0L, PCL-T (3) 00000
C 00000
DATA PLL~xZ, V I,1 00c 0 30001
f EADING i,,PUT DIT 00000C 00000
00000
C WIIVING OUT' INPTT DATA 00030
IIT7 6,10) SrTE S!TZR,F,D -uD!ATIGH'1gTL 00 00~FDT!LrVI E)SLT. 00000
10 F3 P T (/' TMS'I.'TFF SITE ')X rAf4,//,l RECEIVEP s:T E : '.2X 3o000F S 4,/ FRE-yJ-E'YCY,(~Z (~%' FibA/ PATH! LENGTH (3iI) ',B.2,//00000,'TP4 'S~TT~S~ EL~T1iO ABVE 'ISL (FT) ',F93.2,/ 00000e 12ANMITTE Ar TP1A HEIGHT ABOVE GROUJND (FTs 1,F19 .2//1 00F PEC71VER S2 E ELEVATIOT 130YE '.SL (FT) ,Fl10 2,/1/000I. .CTE AfiTENWA H!:TrVT .130VE (IJ\ (T 0 D8 I ,P 0~EFFECTIVE EARTH ?ADIU3; P.CTnp , F.2//11 ACT'JA Eirl~! 00030
F, AX L)W ID)E* BELOW 3Ta (FT) 1F;. 2,, TI DEZ IN C 7_11E I (FT) 00000F 6 11f ' -ECE'IVER IIIMT HLT ,'',F 1'). 2,,// ' 1,ECETV! !00
C.' IFT) ' F.,41, ' ?OtAI ZATION,' ,X Al/, EPOOSOFl6. 1) / 00
WRIT'(6, _39))
3 c5 F 0RAa T 4X '?T', AI F' lOX r'S. T',7Xs2 1 8X'D2',9X,'DEI',l 000007-6L 00000
C~is1 1.1~Lz00500000?= 3 .11 r927 0000
C CC 77 FE FTS PATH L3N'mTHf ?!ra STATUT7 II1LES TO PE3T 0 k ) 00r) D * r, 2 Q6. 00000
C IE EFFEC-ITv2 F~T ADIIS C)7VEPT3D FF.CI STATUITE L17LES TO FET001000*A7 A * K * r,2PO. 00000
2' H 7TA + :171" - 00000ip vEribG + ilANT -TH 300000
15 ?ST= ATAN~2(U{TT + Hp.) D) 000000ST,1_S_ 57: pT S?) 330000'1 = FT /SI!IST 000000
1= 1? :31! / TNS 1 20))0V TZ(6 10 20) D , tt ,'T : __1S I s Tps 1, 1 F 2 000000
1j2) F0T7! T(( F. 12 '.14 f I = 1 712. 4 fir= -,1 4 E12.-' t4=' 1 3001 2 ., 1 S PSI4 = ti 12. 4 ' ~1 = ' 21 24, 2 D1 U 0 0(* C <TT !(A l'?63 ) '00000
S, FT C' i' (MT* + ) 000001 + ',2 r, 00000i
C _Ur)1001) 000001-2 ? r; (2 0! A1 ) -M)P)/(*3) 0 00
ST DET =1- (. * A.3~ /1 T-) 300Wo )O00
- 4 7 0000C W3 b r Ut, 2)1 41 1S3,~'~T 3000c01 '3 ( Pr cp '0000
'. 8,9 / ( * 1 ZF
!JI1CLA SETFIED
IF 1~~tl) '.0 IT (6,200)) 0000')111 OR~~r STIS 1& 7ATER THAN I? .. IRG . aU 7F'INATIN193) 1012t' FA ( ~ 3W-TI!r3 4 20011, 000)1)iF (S T. G-T .1 .-) .) P .3?. r,*1 .0) GO TO 5 5 000O1
73=3 D (S T 3: T+ D E N of) 0.C W'Y RO ! ~ ( S MI D 0 0 0).T RT .TIT jr ) 00000(1F (T. 5,T. 1.0) RT- E- 102 5) 100'Ju.
1 02c T)'A (/1 T 13 i- r" T HA N C NE... ~R O RP * SW. T E F4 iL' IN3ITN5')- 00000.IF(~c1l' 0 TO 995 3000
C 'N-9ATINC :)S'- '121 o00)oC S! 33.)03-11.
S- = 4.* (ST**2) * SP * r J0000-7! S*=1* - (3**2)) * (1. + T) 0000)WI: , ,10 1J) STST 0W 00)0
101 OPl TVST3 -12. 4 , 9Z DEN El '12. 4) 0000C Fl-Im E46 10332 000)01 0 OPIA8 (1 Arl K? siBTh DN)*Ts) 1 *2 0000
D S = 1 SQT~ + STS3T D3)01
?SIO = (1.AS(*')?) 1.* KS)) )ooC SEPO00000,
DST = 3l6S** 1.* -~ /T*2 -A, BDA (1 13)00311)
C ~00000?Sir ATI (0 *AO(lI T. / AST) 0Uu~)
DIC=DR * 1.01 00010 L'1_ SEE C o 0000)
ORCDEC' =6 121 * 71 LA. IDAF1 FDTDDJTO
A3 ?ETEA(Tr(' )*S 00010PA3 DL =-I*D )Z 1J 000)01,
F5= 20. *-Lll./AS(KU0 01Dr = DF =.16 46E 00 r ,* c~T333
WR TT734 EDP ri!DS--JST000001IJ3 FOP MA. ( ( 41LMT0 ' E2f4UIUZ*E2 , X ,212.4,2X,1
:AF E1 41 /( 2.C ;-24 X0I
K. '73T /2 4,X ' 000001='U T)P *t 2A / 1, HAN D* 01)30)301AM W ;U .4 TAI( '(Sr 000001
C S~ 173 4130001CALLR PSIJ AT,1,BESS(H.RO- HE) , 0) 000
102 i'I T(6 AT 1) 'l 4 IT ,3S C ~ f 77lI...B R llI 0)0901CALL UTEJ(1 E-, 12. 4,S 2X,1ES ooooIoE12 4 2X
113) F3 r-- (' ATT Ai S2.4, I flE I..E =':) 000001EI I IT IA * *C 3E12S 4; 1. ! 1
- JP??/~!~' 00001
X ( (2:*AA) / LA.) * 3-1 (-T UC) 33001L X. LT. 1~L X =1.-~ 033) 1CA 7SJ (7,1 ,P53 ,0 301 EPz030001
102 2 ? MAT( A' A2E7 N 3 5)'E~=,3 000001"HR= ?-1 * A**-2 * BESS / 0)00
6J3 = C.'-~(l.?S 1' BES 10 001* IG!A /03 1)
= 0 000001102- F(Y~L t QCT 1) BFL =S 17EPI0 300)01
TF (X. L. 1. pr -UET2 :LX = 2 .C-4 0)3 1; A I :, !3ETA( l 3,001 - 000301
;F (T?-OF.E~~. (3) F. ) 2300001() I .1 5 0 2 j

tINCL A SSIFIED
VA CAFS (!)03000 1c Si: ?1211 000001
I= "ST! * !'V*.!G * F T * R 000031G A IA 1 = 2 . * M * D-IC / L A I3 1A 0300.) 1
C r;7).I:(F 1 3 1 DST? RV'A LI!.- ErF 0000011 31 F 1?'1 A- ': OS ,1. 2X, I'4 f, 12 4 ,X, ?V'!A-3 E ,E2. 4/, ET 0011
X , T 1000031
c CALC'L lT Y!'ST EPSR 000001ZS U-C, E-3ST AN! D,)
CALL H PSTP (!TJ-C,E?S-R AN- D F)000r3.-'A= GA'IlAl - ? 6ol-r7 00000 1
COSIV! = COS (GAII'A) o0io0C W hRI 17(:6,' 10 07 0000011007 FORF!iA A'! S~ S2RT') 000001C S i"T ? d.' 000001
ERD17FS SQRT( 1. +(M**2) + 2. * COSciAM) 00?FSrI! 20. * ALO1U (RDEFS)l 000001
C WRI E6 IJ 3) * ,3A..A 1 G\AIAEPST Eps EDEFS PF3DB COSGAM 0003031loop 4O ?SP' = ',2 4.?D3F = ',E12., 000001
C 000001
Dl = Dl /29;) . 0 01D-7 = '2 52q0.00000?STC OSIC* 18. ?1000001
FEE FEE_ *l18. / T000001110= HP' + TH 000031
WRITE(6,t40) ii"0TT,Dl,D2,PS;IC 7VkMAG, FEE, DRC3)EG,9i,FFSDB,DT~k 00000140 FOPM~A'r(X, HF11.2,E12.4,Fll.2,El.4) 000001c 5 HR = H- 000031oo
'IfR'4D = ITPMOD - DHP 000001F (H10 ~D. 1E. 17GilD) GO TO 3 0 00010 1
I F (11 F !OD. IE. 9. IN) "0 -0 15 00000131) T3 Tff - DTHr. 000001
IF('1.-,-.TL) -,C TO 29 30001rm 50 00000'2
20 S:O's. 300030i,2
i I FIND OF D2E:-C JPRTNT PROGRAM1 L-IN1-S PNTE 202 000
'0B1A
B -1 .*': A-

APPENDIX C
HYBRID SIMULATION OF THE DRAMA RADIO ANDLINE-OF-SIGHT MULTIPATH CHANNEL
4
, , .. . .
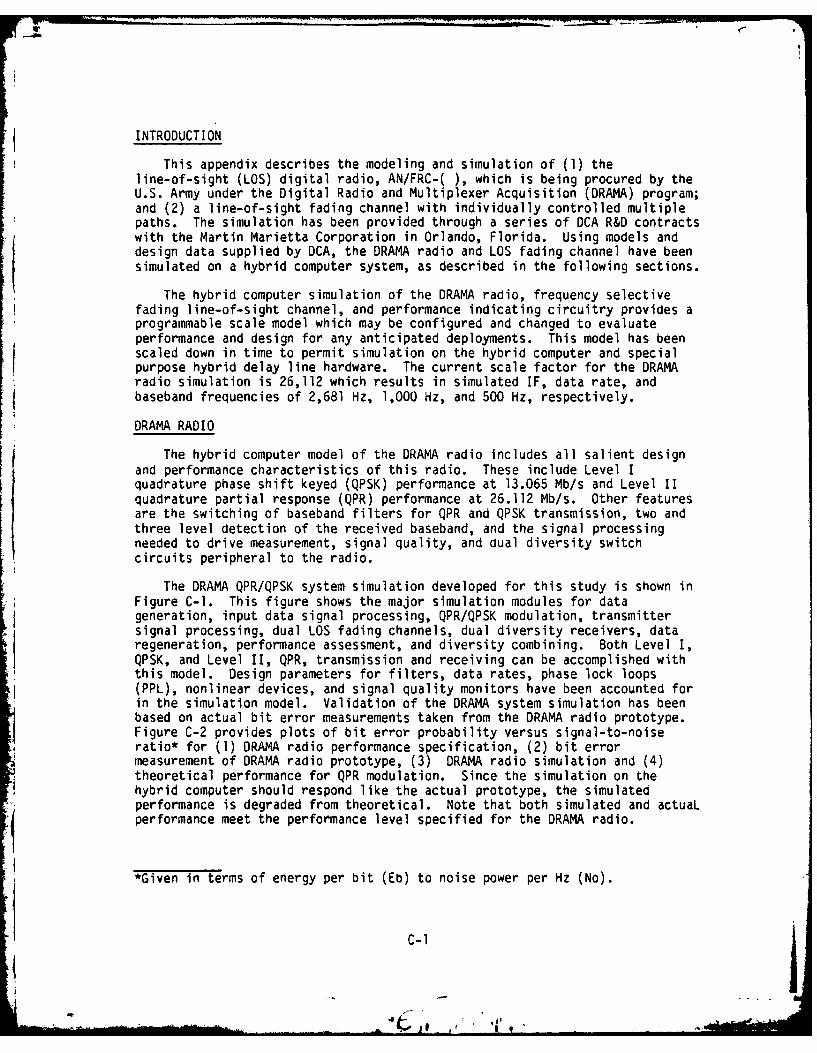
INTRODUCTION
This appendix describes the modeling and simulation of (1) theline-of-sight (LOS) digital radio, AN/FRC-( ), which is being procured by theU.S. Army under the Digital Radio and Multiplexer Acquisition (DRAMA) program;and (2) a line-of-sight fading channel with individually controlled multiplepaths. The simulation has been provided through a series of DCA R&D contractswith the Martin Marietta Corporation in Orlando, Florida. Using models anddesign data supplied by DCA, the DRAMA radio and LOS fading channel have beensimulated on a hybrid computer system, as described in the following sections.
The hybrid computer simulation of the DRAMA radio, frequency selectivefading line-of-sight channel, and performance indicating circuitry provides aprogrammable scale model which may be configured and changed to evaluateperformance and design for any anticipated deployments. This model has beenscaled down in time to permit simulation on the hybrid computer and specialpurpose hybrid delay line hardware. The current scale factor for the DRAMAradio simulation is 26,112 which results in simulated IF, data rate, and
baseband frequencies of 2,681 Hz, 1,000 Hz, and 500 Hz, respectively.
DRAMA RADIO
The hybrid computer model of the DRAMA radio includes all salient designand performance characteristics of this radio. These include Level Iquadrature phase shift keyed (QPSK) performance at 13.065 Mb/s and Level IIquadrature partial response (QPR) performance at 26.112 Mb/s. Other featuresare the switching of baseband filters for QPR and QPSK transmission, two andthree level detection of the received baseband, and the signal processingneeded to drive measurement, signal quality, and dual diversity switchcircuits peripheral to the radio.
The DRAMA QPR/QPSK system simulation developed for this study is shown inFigure C-l. This figure shows the major simulation modules for datageneration, input data signal processing, QPR/QPSK modulation, transmittersignal processing, dual LOS fading channels, dual diversity receivers, dataregeneration, performance assessment, and diversity combining. Both Level I,QPSK, and Level II, QPR, transmission and receiving can be accomplished withthis model. Design parameters for filters, data rates, phase lock loops(PPL), nonlinear devices, and signal quality monitors have been accounted forin the simulation model. Validation of the DRAMA system simulation has beenbased on actual bit error measurements taken from the DRAMA radio prototype.Figure C-2 provides plots of bit error probability versus signal-to-noiseratio* for (1) DRAMA radio performance specification, (2) bit errormeasurement of DRAMA radio prototype, (3) DRAMA radio simulation and (4)theoretical performance for QPR modulation. Since the simulation on thehybrid computer should respond like the actual prototype, the simulatedperformance is degraded from theoretical. Note that both simulated and actuaLperformance meet the performance level specified for the DRAMA radio.
*Given in terms of energy per bit (Eb) to noise power per Hz (No).
C-l

The block diagram of Figure C-i is briefly described here. A psuedorandomdata stream (PRDS) representing digital traffic is generated in Module 1 ofthe simulation. In Module 2, the PRDS is scrambled using a self-synchronizingscrambler, split into cophasal and quadrature branches and differentiallyencoded. Up to this point the information is still in binary form. In Module3, the cophasal and quadrature bit streams are presented to separate impulsemodulators (actually pulse generators which generate very short pulses at thequadrature data rates). The outputs of the impulse modulators are presentedto separate low pass filters which transform the binary cophasal andquadrature branches into three level baseband signals. Finally, in Module 3,the cophasal and quadrature bit streams are phase modulated onto a scaled IF(representing the actual 70 MHz IF of the AN/FRC-( )( ) radio). Module 4represents the RF stages of the AN/FRC-( )( ) transmitter and includes abandpass nonlinearity to represent the TWT RF amplifier amplitude togetherwith post-amplification filtering.
Module 5 simulates the RF stages of the AN/FRC-( )( ) receivers. Dualreceivers are simulated to represent the dual diversity configuration of theradio and contain the IF filters (to provide frequency selectivity) as well asthe Automatic Gain Control (AGC) function. In Module 6, the simulated IF QPRsignal is demodulated by the modified Costas loop quadrature demodulatorchosen by the AN/FRC-( )( ) contractor. Module 6 also contains the carrierrecovery and tracking circuitry and like Module 5, has redundant circuits tosimulate a dual diversity radio configuration. The output of Module 6 is th,analog version of the three-level partial response baseband which has an "eyepattern" representation. In Module 7, the diversity three-level basebands areregenerated by slicers, the bit timing is recovered, and now-digitalthree-level signals are decoded into several binary forms. Also, in Module 7the diversity bit streams are descrambled for processing in the diversityswitch.
In Module 8, in-service performance of the dual diversity bit streams ismonitored. This module implements psuedo-error rate and AGC monitors for eachof the diversity bit streams, and, based on a preprogrammable algorithm,develops a control voltage which is used to select the better diversity pathin the AN/FRC-( )( ) diversity combiner. In Module 9, the AN/FRC-( )( ) dualdiversity combiner is simulated. It is a selection combiner that uses analgorithm based on AGC and signal quality monitors.
LOS FADING CHANNEL
The fading channel model is implemented using a combination of hybridcomputer technology and charge-coupled device (CCD) integrated circuits. Thesimulation consists of three elements: a delay line, a delay module, and acomponent fading module. A block diagram of the overall simulated channel isshown in Figure C-3. The delay line consists of a CCD integrated circuit withinterconnection for up to 12 taps. The channel simulator actually has 2 delaylines, each having 12 taps. Delay line 1 is the in-phase tapped delay line,while the quadrature delay, line 2, contains an additional /2 phase shift ateach tap. The complex multiplication required for setting the individual tapgains is shown functionally in Figure C-4. A wideband analog Gaussian noise
C-2
4

source provides noise to simulate fading conditions for each tap of the delayline. Multiplier pairs provide the multiplication of the incoming (delayed)path with noise for each of the 12 taps. The output of the 12 multiplierpairs is then summed by an analog summing amplifier network to provide thefinal channel output.
The simulator allows the user to select thL ,jmber of active taps andchange the tap gains, tap delay spacing, and signal-to-noise ratio. Alsoincluded is the capability to designate specific taps as Rayleigh fading orstationary, and to specify the correlation coefficient between the dualdiversity fading signal envelopes from 0.10 to 0.95. The intertap spacing isselectable over two time scales: (1) 0.025 to 0.25 of a bit or (2) 0.25 to 2.5of a bit. For a choice of QPR modulation with bit rate of 26.112 Mb/s, thesetwo time scales provide the capability to simulate from approximately I to 100nanoseconds. Referring to the block diagram in Figure C-4, a stationary tapis implemented from the Rayleigh fading tap by zeroing the quadraturecoefficient and setting the in-phase coefficient to a constant value(determined from the relative mean power desired for that tap).
C-3
I

J.
- i ,|i
I a a
I iII - I
I I U
,I U.
"_ ,I _ '" . - -
I - - - -- I
I *, I
I ,, I
I I-I aJ
I L . ... . ti:
.4~

10-
H Aa--
:10
10
10.?
2 A10 12 !a 16 18 20 22 24
Fi nurl C-2. Sit Error Probability VIersus Signal-to-N4oise
Ratio for DRAMA Radio
C-5
C* r-1

- I
4-)
LL
0.- *'.
0A '0 t
C-4C
. fa vi
41) o 4) E
3c :m 03
S-
C.) 0
4J~ o- D
C~ S E .1
0 - S
.
C- 6

-- I L.
K -
LL
LA-
CDC
C- 7

APPENDIX D
SYNOPSIS OF SELECTIVE WAING TEST ANDEVALUATION FOR DIGITAL LOS CHANNELS

INTRODUCTION
Concern for the presence and effect of frequency selective fading on DCSdigital links has prompted a number of DoD test and evaluation projects. Thisappendix briefly describes each of those projects in which DCA has someinvolvement.
Results of these T&E efforts will be used to (1) determine the need tomake any necessary modifications to the DRAMA radio such as an improveddiversity combiner or use of adaptive equalizer, and to (2) modify LOS channelmodels used by DCEC in providing guidance on DCS link design and availabilityobjectives.
The milestone chart shown as Figure D-1 shows the phasing of these variousT&E efforts.
DEB I LINK TEST AND EVALUATION
This project consisted of a two month test conducted by the Institute ofTelecommunications Sciences (ITS) under a DCA RDT&E contract. Data wascollected within the Digital European Backbone Stage I (DEB I) on three LOSlinks (see Figure D-2) in the spring of 1980. The object of this set ofmeasurements was to obtain statistics about presence and effect of distortionwithin the received IF spectrum of a 3-level partial response, line-of-sightmicrowave radio system.
Test instrumentation was installed at the Mt. Coma site which is thecommon site among the three DEB I links tested. Each link was monitored forevidence of selective fading but only the Mt. Venda-Mt. Corna link was foundto exhibit any significant fading. The following signals were monitored, butrecorded only if any activity was observed.
(1) 70 MHz IF, both A and B receivers.
(2) On-line receiver indicator.
(3) Received signal level, both A and B receivers.
(4) 3-Level errors.
(5) Multiplex reframes.
Data was analyzed at the ITS Boulder Labs and results were published in DCECReport No. 040022, March 1981. Salient conclusions were:
(1) Large values of distortion (I dB/MHz) were observed during multipathfading events.
(2) Diversity reception looks very promising as an effective tool incounteracting these distortion effects.
D-1
4O

(3) Multipath received-signal-level statistics can be used to predict thefrequency and severity of this type of distortion on a line-of-sight path.
(4) The 3-level-partial-response modulation system used her. was veryrobust in terms of its susceptibility to the severity of amplitude distortionobserved on this path during the measurements.
WAWS LINK TEST AND EVALUATION
This RDT&E project consists of a two phase test and evaluation on theWashington Area Wideband System (WAWS) Blue Ridge Summit to Liberty Dammicrowave path. Western Union is both the carrier providing the WAWS systemas a lease to the U.S. Government and the contractor for this DCA RDT&Eproject. The object of this T&E effort is to obtain detailed statistics aboutthe presence and effect of selective fading on wideband (30 MHz bandwidth, 90Mbps data rate) digital LOS links. (The radio equipment tested was a Collins8PSK digital radio operating in the 6 GHz band and enploying space diversity.)
Phase I provided the following data on botn receivers of the dualdiversity system.
a. Bit Error Rate (BER) measurements.
b. IF Amplitude characteristics.
c. Received Signal Level (RSL).
These data were monitored continuously with a granularity of 100 msec. Asshown in Figure D-3, a computer was used to assemble this data from the BERtest sets, the spectrum analyzer, RSL voltmeters, alarms and a clock(date/time) to form records. Under unfaded conditions, data records were notrecorded to avoid storing useless data. Records were recorded only whenfading activity was present as indicated by errors or changes in the spectrumor RSL. These data were then delivered on magnetic tape to DCEC for in-house
analysis. Phase I data collection was conducted between October 1980 andFebruary 1981, and in that time period about 73 days of valid data wereobserved. Most of the analysis has been completed with the following results:
(1) Modest values of distortion (0.5 dB/MHz) were observed during fadingevents.
(2) Deep fading events were rare: (1) the top receiver had a total of 16seconds outage below RSL corresponding to BER = 0-; (2) the bottomreceiver had less than I second outage below RSL corresponding to BER = 10- .
(3) The top receiver had 99.988802% error free blocks, and the bottomrece4 ,er had 99.999747% error free blocks, where the block length wasapproximately 100 msec of data.
Phase II data collection was completed in the summer of 1981 and provided
the following data:
0-2

a. Amplitude distortion.
b. Group delay distortion.
c. Received signal level.
As shown in Figure D-4, the same computer system was used to monitor the data,assemble the data into records and record these records on tape during periodsof channel activity. Results from this second phase are necessary tocharacterize the channel for this 38 mile path. Such a channelcharacterization will in turn assist in the refinement of LOS channel models,taking into account the presence of frequevy selective fading. Reduction andanalysis of Phase II data is expected to be -ompleted by March 1982.
DRAMA RADIO TEST AND EVALUATION
A three phased T&E program is currently planned for the DRAMA radio.These tests will characterize performance of the DRAMA radio in variousmultipath environment via simulation and, if possible, by actual linktesting. A second objective is the characterization of multipath for typicalDEB links. Once radio performance as a function of simulated or actualmultipath conditions has been established, channel signatures for DEB andother DCS links can be used to predict outages due to multipath. Shouldoutage predictions exceed DCA objectives, remedial action will consist of twopossible actions:
(1) Modification of DRAMA radio including consideration of improveddiversity combining and adaptive equalization.
(2) Modification of DCA link design criteria and link availabilityobjectives.
Each of the three phases of testing is briefly described below:
(1) Multipath Simulation
USACEEIA at Ft. Huachuca has developed a three-ray multipathsimulator in hardware to allow radio performance characterization. Thissimulator allows selection of the amplitude and delay for the multiple paths.Specifically, the attenuation of the direct path, ratio of amplitudes for thesecond and thrid paths, gross delay between direct and secondary paths, andphase of the sum of paths are selectable. A radio modem can be interfacedwith the simulator (at 70 MHz IF), and for a particular combination ofsimulator settings, radio performance is characterized by measuring BER. Toallow prediction of outagl, a BER signature is developp, which is a plot ofconstant BER (say for 10- BER) as a function of delay nd amplitudesettings.
This simulator has been used to characterize performance of theAVANTEK DR 8-A modem, which operates at 12.6 Mo/s, uses QPR modulation, andhas been used as a prototype in the DRAMA program. Results have been used in
D-3
*e.° *,'i.

conjunction with channel models, derived principally by Bell Labs, to predictoutage as a function of link distance. A similar test and outage analysis isplanned for the DRAMA radio modem in the July 1981 timeframe.
(2) Pt. Mugu Link Tests
The Pacific Missile Test Center (PMTC) at Point Mugu, California, iscurrently conducting multipath tests of a commercial digital radio over a 65mile link between Pt. Mugu and San Nicolas Island. This long, over-the-waterlink is known to exhibit significant multipath, although the link is atypicalof DCS links. Testing to date has involved a Collins 8 GHz, 44.7 Mb/s, 20 MHzbandwidth digital radio employing space diversity and adaptive equalization.Also a PN probe is being used to characterize the channel impulse response.Data collection is being provided by the Institute for TelecommunicationsSciences (ITS), while data analysis is being done by PMTC.
Testing of the DRAMA radio is planned for July-August 1981 over thissame link at Pt. Mugu. Data collection and analysis is to be provided byITS. The purpose of this test is to characterize radio performance over alink with known multipath conditions. Results will not be directly applicableto DEB links but through extrapolation and use of a channel model, theseresults will be of help in predicting performance on shorter links.
(3) DEB Link Testing
Under USAF sponsorship and funding, channel characterization testingis being conducted for certain DEB links in the fall of 1981. Specifically,Langerkopf will be instrumented for data collection for up to three incomingLOS links. Tests are to be conducted by ITS using the PN probe and radio testinstrumentation used previously at Pt. Mugu. Results of the PN probe tests
will provide a multipath signature for these links tcsted. Using previousresults of DRAMA radio testing at Pt. Mugu and at Ft. Huachuca with themultipath simulator, outage predictions will be possible for DEB.
D-4
4

-1 L6.- - -- -
z
P-11
00
0
Cl 0.j c
* ---------- i~~y"'~1 ' zf
- ---- ---
-j -c to - - - - -P- - - - - -A
-Ujj ~ 1 0 .,-)'U"ac
4) to
WA )N m. -P- -P- Z
4- U- CA
w 40 I.L.# 0 01 0 go4- +j M- .0-
1. w W &. E' 41 4 0 "- 1=
4--1 IC 41) i = ) CL *3. mC. fa a )
CDC i P : Li w w c _ ) WU 1. "C .,IV 4 0) 4) 4 fL.
4-5 L . n C A 0 4 U4- . C 6
CDW w 1 4)6 2 .222 4; E
La - 4
01.4 cm) 04 0 A C4c 4 41 O. % 0%
0 ~ ~ ~ ~ D 5-~ a1 1 a
fai L)0 4 ~ 6

I Vaihingen
/ iHohg.nstadt
/1 G4ERMANY
Ai
AUSTRIA
SWIrZERLAND
f Cama oIvinno
JTALr 0
Mt. Comna 90.2 kin
Adriat
Mt. Cimone
Med/f erraneon Sea
Mi. Sofro
Coltoao
Fiqure D-2. Line-of-Siqht Milcrowave Links Converging at 'Mt. Corna, Italy
D- 6

1 0 0 3
c~LZ
CPI
vs-0
-C
S-1S
I ICI 'm
.4 a )
a 0a
oG
D- 7~
'10)

L-1-
I~on 4J
4J
-a,.-
'III
zi U.
06C~
D- 8

DISTRIBUTION LIST
STANDARD:
RlOO/R1Ol - 1 R400 -1R120/R121/R140 - 1 R600 - 1R141 - 9 (8 for stock) R800 - 1R10 - 1 NCS-TS - 1R141B - 1 (Library) 101A - 1R141A - 1 (for Archives) 312 - IR200 -1 970 -l
R141 - 12 (Unclassified/Unlimited Distribution)
DCA-EUR - 2 (Defense Communications Agency European AreaATTN: Technical LibraryAPO New York 09131)
OCA-PAC - 3 (CommanderDefense Communications Agency Pacific AreaWheeler AFB, HI 96854)
OCA SW PAC - 1 (Commander, DCA - Southwest Pacific RegionAPO San Francisco 96274)
DCA NW PAC - I (CommaNDER, DCA - Northwest Pacific RegionAPO San Francisco 96328)
DCA KOREA - 1 (Chief, DCA - Korea Field OfficeAPO San Francisco 96301)
OCA-Okinawa - 1 (Chief, DCA - Okinawa Field OfficeFPO Seattle 98773)
DCA-Guam - 1 (Chief, DCA - Guam Field OfficeBox 141 NAVCAMS WESTPACFPO San Francisco 96630)
US NAV Shore EE PAC - I (U.S. Naval Shore Electronics EngineeringActivity Pacific, Box 130, ATTN: Code 420Pearl Harbor, HI 96860)
1843 EE SQ - 1 (1843 EE Squadron, ATTN: EIEXMHickam AFB, HI 96853)
DCA FO ITALY - I (DCA Field Office Italy, Box 166FPO New York 09524)
USOCFO - I (Unclassified/Unlimited Distribution)(Chief, USDCFO/US NATOAPO New York 09667)
DISTRIBUTION LIST (cont'd)
SPECIAL:
PAC COMM DIV -1Hickam AFB, HI 96853
NAVTELCOMM 621A - 1Washington, DC 20390
NAV ELEC SYS COM 51032 - 1Washington, DC 20390
NAVCOMM AREA MASTER-MED - 1FPO NY 09524
NAVSHORE ELEC ENG ACT - 1FPO Seattle WA 97862
NAVSHORE ELEC ENG ACT - 1FPO San Francisco CA 96630
NAVCOMMSYSTECH SCHOOL - 1San Diego, CA 92133
NAVSHORE ELEC ENG ACT - PAC - 1Pearl Harbor, HI 96860
ECAC/CAA - IAnnapolis, MD 21402
RADC/DCCT - IGriffiss AFB, NY 13441
CINCPAC/J6121 - IFPO San Francisco 96558