Embed Size (px)
Citation preview
KCS Achievement Data
District-wide Achievement

District Achievement Achievement plots will be included for the
following subjects Algebra I Algebra II English I English II 6-8 Math 6-8 ELA
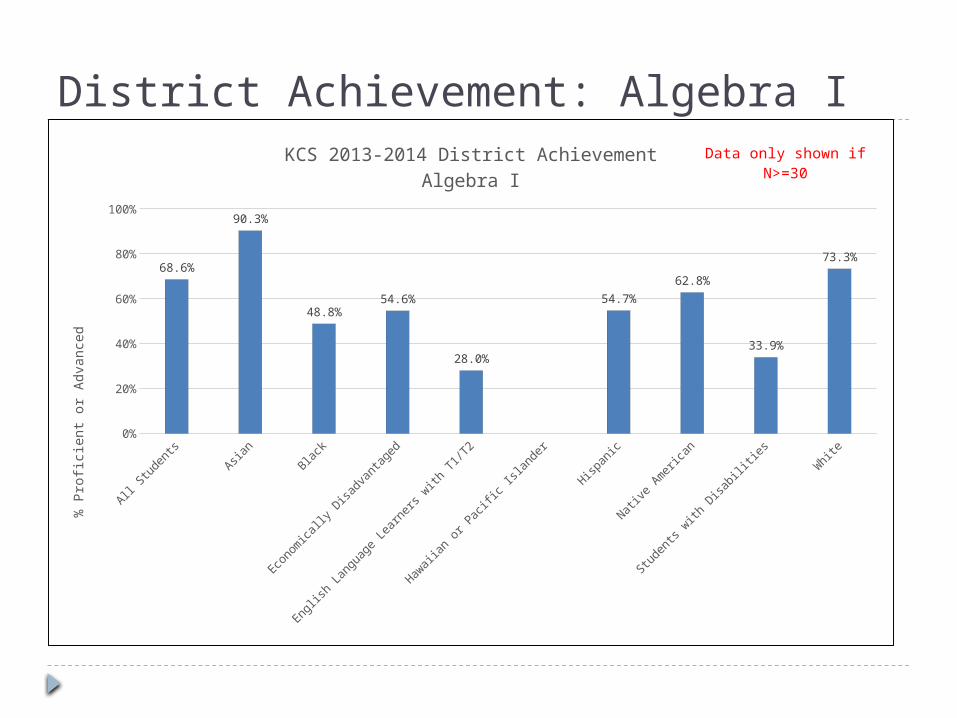
District Achievement: Algebra I
All Students
Asian
Black
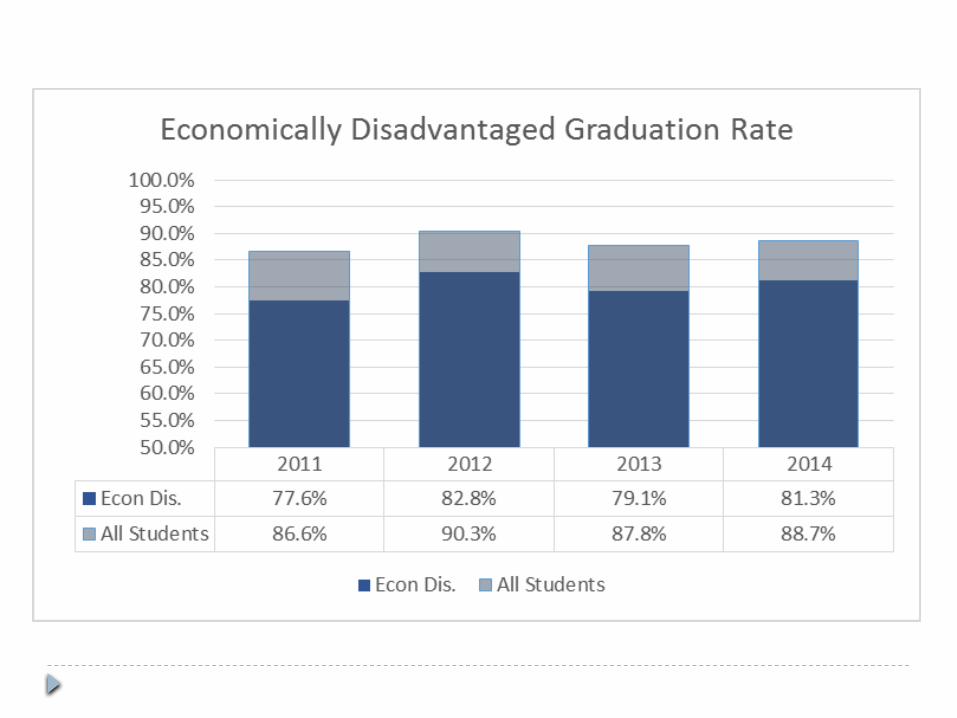
Economica
lly Disa
dvantaged
English La
nguage Learners
with T1/T
2
Hawaiian or P
acific I
slander
Hispanic
Native Americ
an
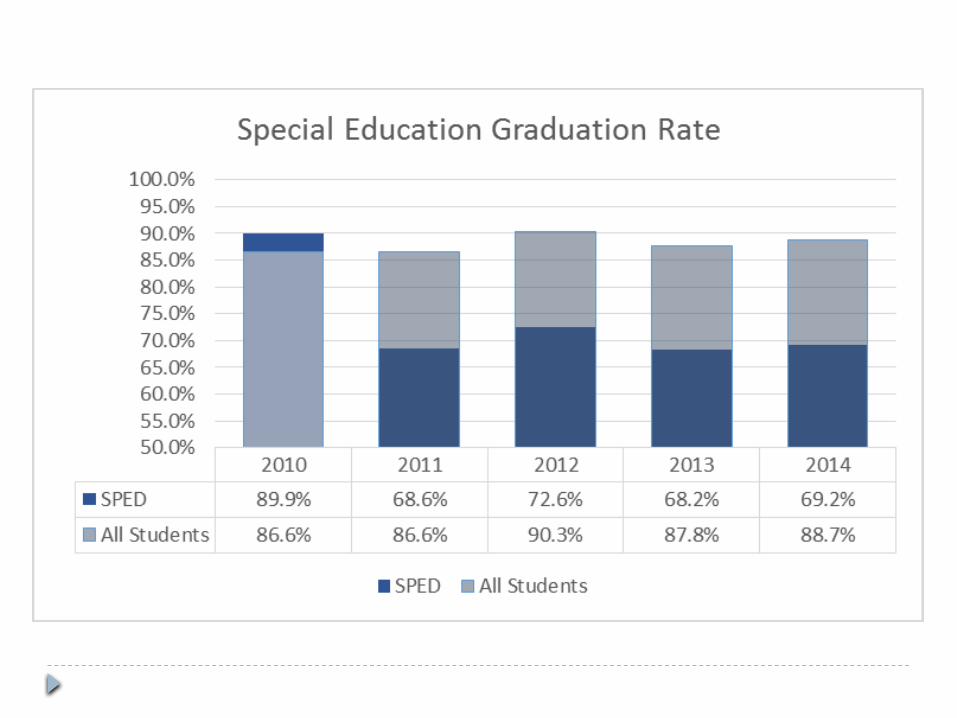
Students with
Disabiliti
esW
hite0%
20%
40%
60%
80%
100%
68.6%
90.3%
48.8%54.6%
28.0%
54.7%
62.8%
33.9%
73.3%
KCS 2013-2014 District AchievementAlgebra I
% P
rofic
ient
or A
dvan
ced
Data only shown if N>=30
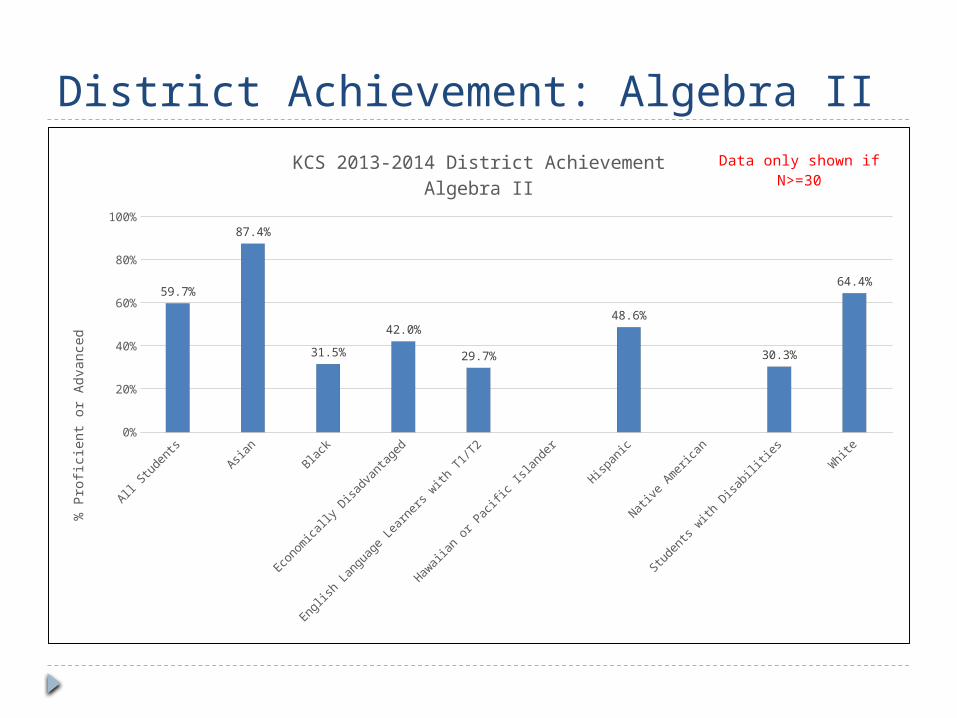
District Achievement: Algebra II
All Students
Asian
Black
Economica
lly Disa
dvantaged
English La
nguage Learners
with T1/T
2
Hawaiian or P
acific I
slander
Hispanic
Native Americ
an
Students with
Disabiliti
esW
hite0%
20%
40%
60%
80%
100%
59.7%
87.4%
31.5%
42.0%
29.7%
48.6%
30.3%
64.4%
KCS 2013-2014 District AchievementAlgebra II
% P
rofic
ient
or A
dvan
ced
Data only shown if N>=30
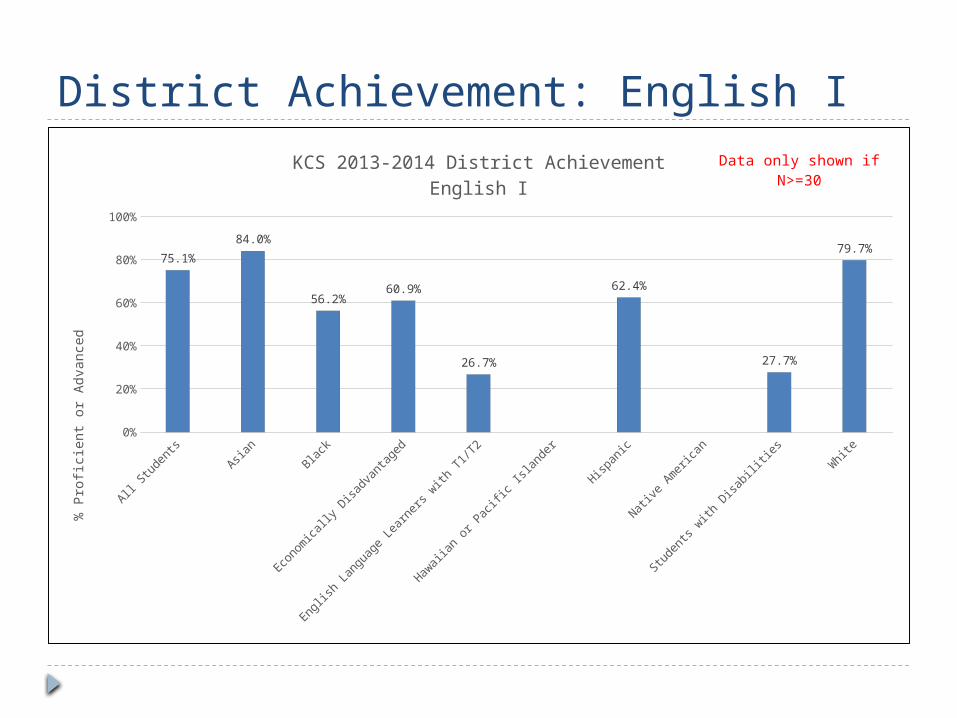
District Achievement: English I
All Students
Asian
Black
Economica
lly Disa
dvantaged
English La
nguage Learners
with T1/T
2
Hawaiian or P
acific I
slander
Hispanic
Native Americ
an
Students with
Disabiliti
esW
hite0%
20%
40%
60%
80%
100%
75.1%
84.0%
56.2%60.9%
26.7%
62.4%
27.7%
79.7%
KCS 2013-2014 District AchievementEnglish I
% P
rofic
ient
or A
dvan
ced
Data only shown if N>=30
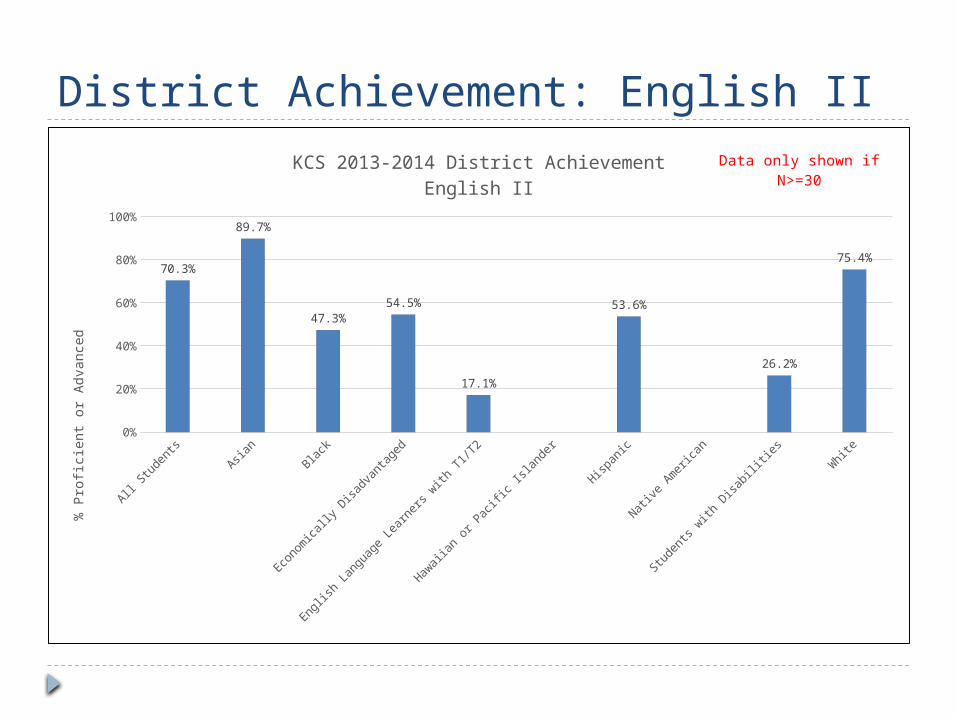
District Achievement: English II
All Students
Asian
Black
Economica
lly Disa
dvantaged
English La
nguage Learners
with T1/T
2
Hawaiian or P
acific I
slander
Hispanic
Native Americ
an
Students with
Disabiliti
esW
hite0%
20%
40%
60%
80%
100%
70.3%
89.7%
47.3%
54.5%
17.1%
53.6%
26.2%
75.4%
KCS 2013-2014 District AchievementEnglish II
% P
rofic
ient
or A
dvan
ced
Data only shown if N>=30
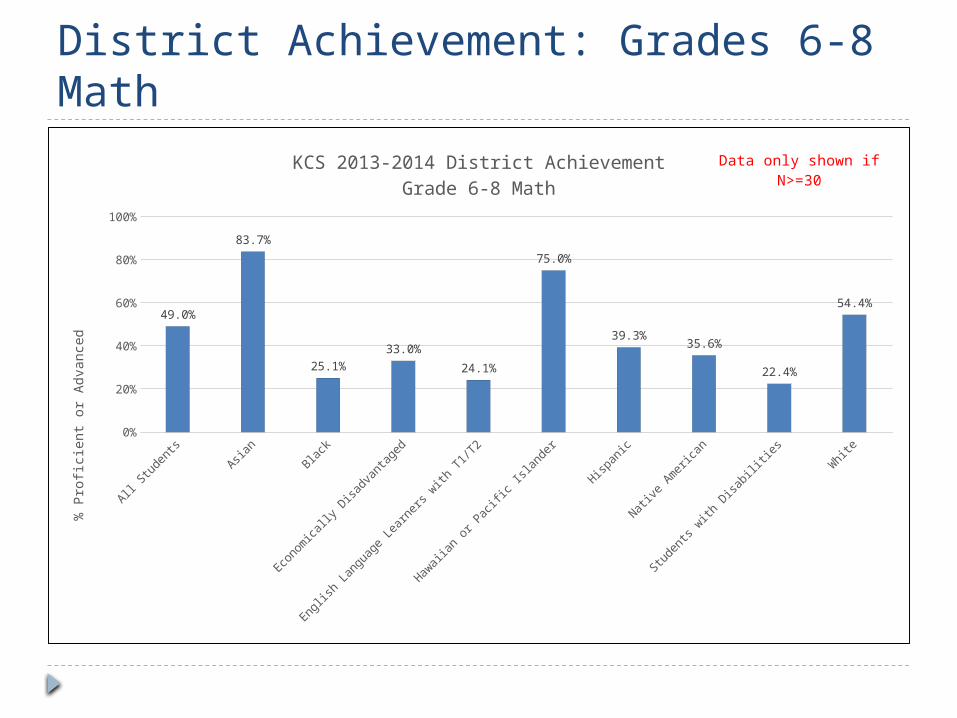
District Achievement: Grades 6-8 Math
All Students
Asian
Black
Economica
lly Disa
dvantaged
English La
nguage Learners
with T1/T
2
Hawaiian or P
acific I
slander
Hispanic
Native Americ
an
Students with
Disabiliti
esW
hite0%
20%
40%
60%
80%
100%
49.0%
83.7%
25.1%
33.0%
24.1%
75.0%
39.3%35.6%
22.4%
54.4%
KCS 2013-2014 District AchievementGrade 6-8 Math
% P
rofic
ient
or A
dvan
ced
Data only shown if N>=30
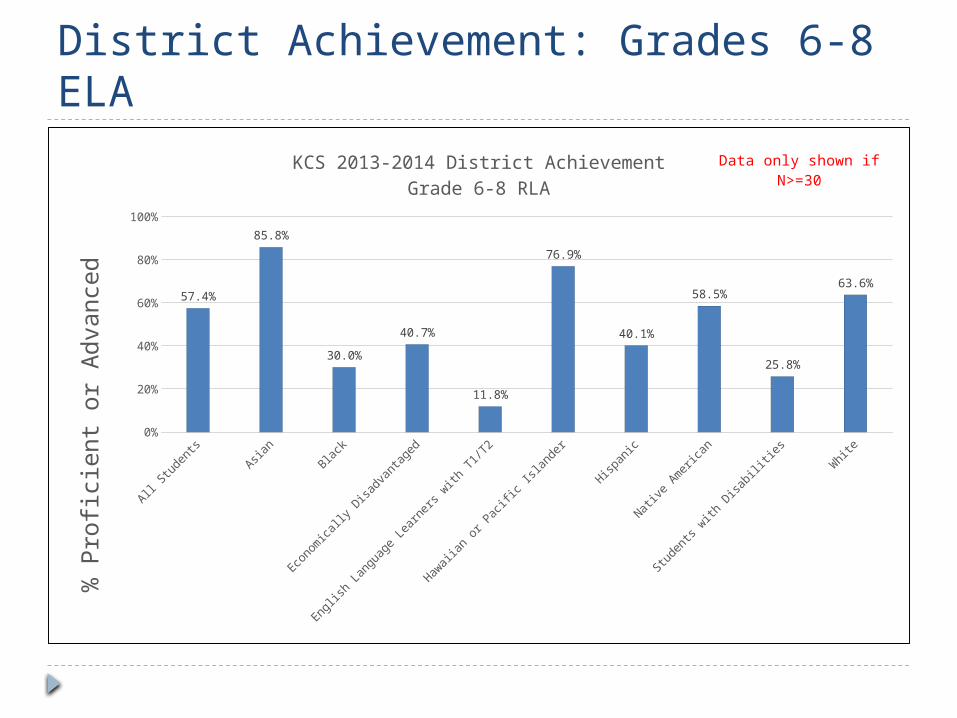
District Achievement: Grades 6-8 ELA
All Students
Asian
Black
Economica
lly Disa
dvantaged
English La
nguage Learners
with T1/T
2
Hawaiian or P
acific I
slander
Hispanic
Native Americ
an
Students with
Disabiliti
esW
hite0%
20%
40%
60%
80%
100%
57.4%
85.8%
30.0%
40.7%
11.8%
76.9%
40.1%
58.5%
25.8%
63.6%
KCS 2013-2014 District AchievementGrade 6-8 RLA
% P
rofic
ient
or A
dvan
ced
Data only shown if N>=30
District-wide Achievement Gaps

Subgroup Gap Data: 2013-14
AreasKCS Gap Actual 2013-2014
(difference in %P/A)
ELL vs. non-ELL
SWD vs. non-SWD
ED vs. non-ED
BHN vs. All Students
3-8 Aggregate Math 24.7% 35.1% 33.7% 21.1%3-8 Aggregate RLA 38.2% 35.1% 34.0% 22.8%HS Algebra I/II (Combined) 38.9% 31.1% 26.1% 17.5%
HS English II/III (Combined) 59.6% 43.8% 29.2% 21.0%
Green indicates that the performance gap decreased from the previous year
Red indicates that the performance gap widened from the previous year
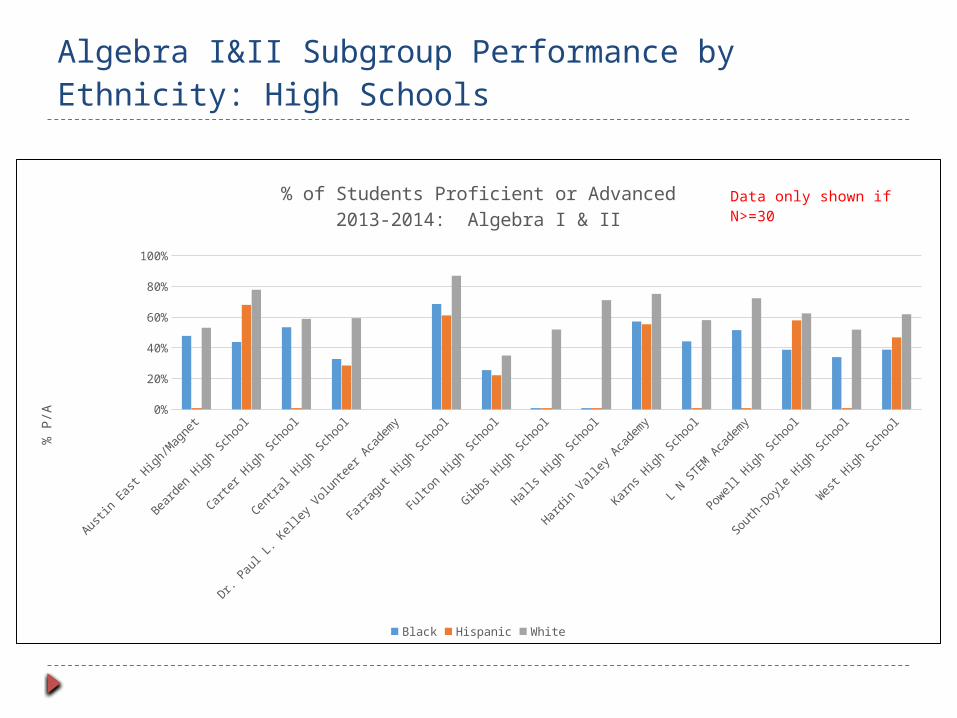
Algebra I&II Subgroup Performance by Ethnicity: High Schools
Austin East
High/Magnet
Bearden High School
Carter H
igh School
Central H
igh School
Dr. Paul L
. Kelle
y Volunteer A
cademy
Farragut H
igh School
Fulton High Sch
ool
Gibbs High Sch
ool
Halls High Sch
ool
Hardin Valley A
cademy
Karns High Sch
ool
L N STEM Aca
demy
Powell High Sch
ool
South-Doyle
High School
West
High School
0%
10%
20%
30%
40%
50%
60%
70%
80%
90%
100%
% of Students Proficient or Advanced2013-2014: Algebra I & II
Black Hispanic White
% P
/A
Data only shown if N>=30
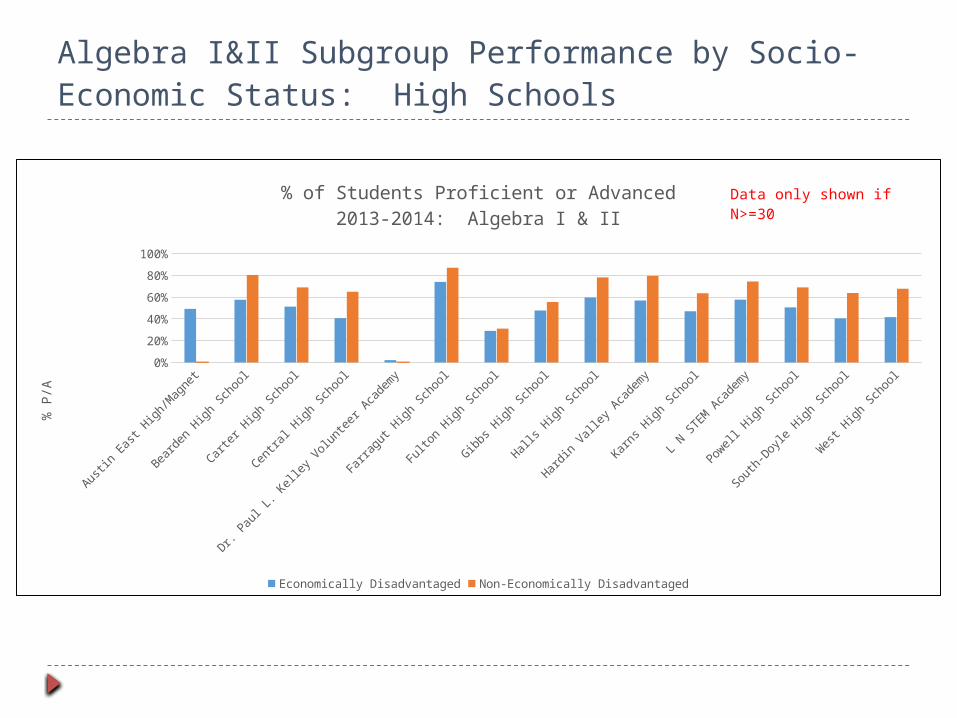
Algebra I&II Subgroup Performance by Socio-Economic Status: High Schools
Austin East
High/Magnet
Bearden High School
Carter H
igh School
Central H
igh School
Dr. Paul L
. Kelle
y Volunteer A
cademy
Farragut H
igh School
Fulton High Sch
ool
Gibbs High Sch
ool
Halls High Sch
ool
Hardin Valley A
cademy
Karns High Sch
ool
L N STEM Aca
demy
Powell High Sch
ool
South-Doyle
High School
West
High School
0%
10%
20%
30%
40%
50%
60%
70%
80%
90%
100%
% of Students Proficient or Advanced2013-2014: Algebra I & II
Economically Disadvantaged Non-Economically Disadvantaged
% P
/A
Data only shown if N>=30
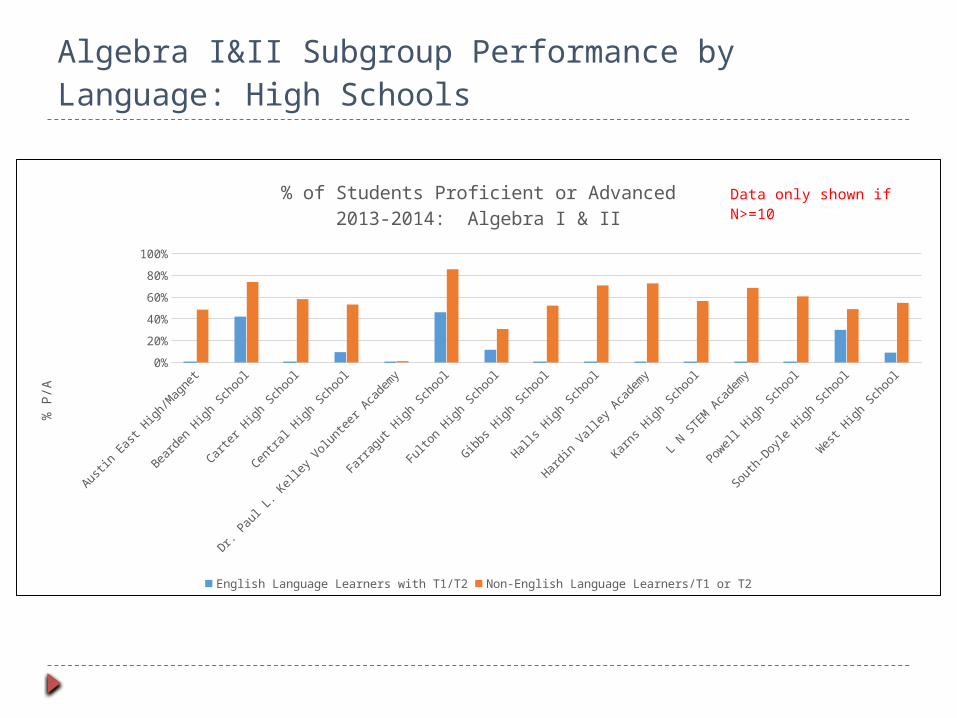
Algebra I&II Subgroup Performance by Language: High Schools
Austin East
High/Magnet
Bearden High School
Carter H
igh School
Central H
igh School
Dr. Paul L
. Kelle
y Volunteer A
cademy
Farragut H
igh School
Fulton High Sch
ool
Gibbs High Sch
ool
Halls High Sch
ool
Hardin Valley A
cademy
Karns High Sch
ool
L N STEM Aca
demy
Powell High Sch
ool
South-Doyle
High School
West
High School
0%
10%
20%
30%
40%
50%
60%
70%
80%
90%
100%
% of Students Proficient or Advanced2013-2014: Algebra I & II
English Language Learners with T1/T2 Non-English Language Learners/T1 or T2
% P
/A
Data only shown if N>=10
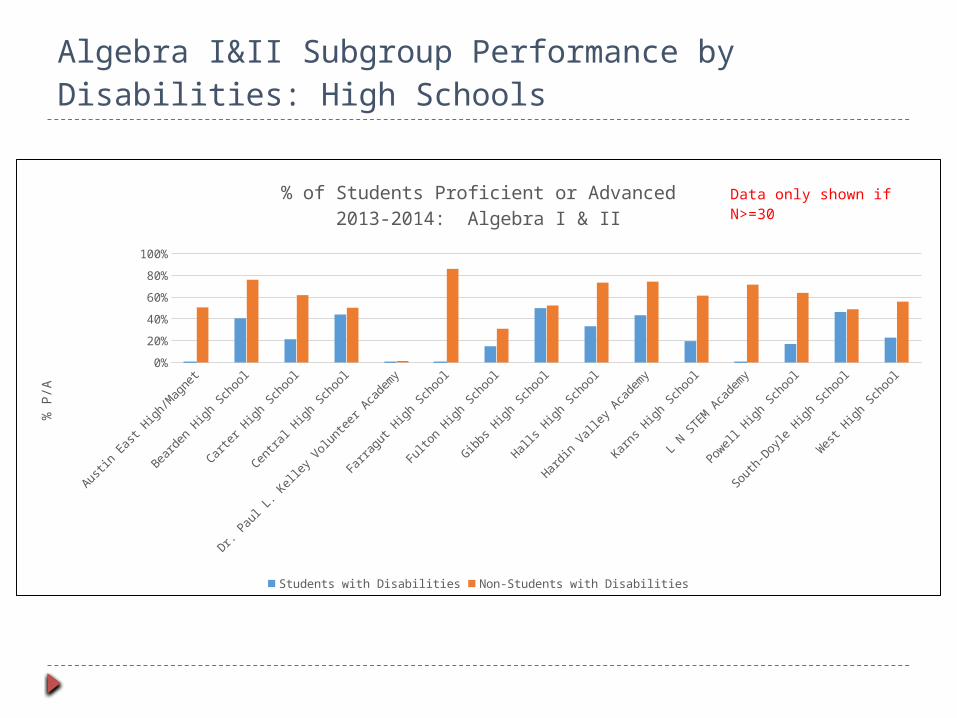
Algebra I&II Subgroup Performance by Disabilities: High Schools
Austin East
High/Magnet
Bearden High School
Carter H
igh School
Central H
igh School
Dr. Paul L
. Kelle
y Volunteer A
cademy
Farragut H
igh School
Fulton High Sch
ool
Gibbs High Sch
ool
Halls High Sch
ool
Hardin Valley A
cademy
Karns High Sch
ool
L N STEM Aca
demy
Powell High Sch
ool
South-Doyle
High School
West
High School
0%
10%
20%
30%
40%
50%
60%
70%
80%
90%
100%
% of Students Proficient or Advanced2013-2014: Algebra I & II
Students with Disabilities Non-Students with Disabilities
% P
/A
Data only shown if N>=30
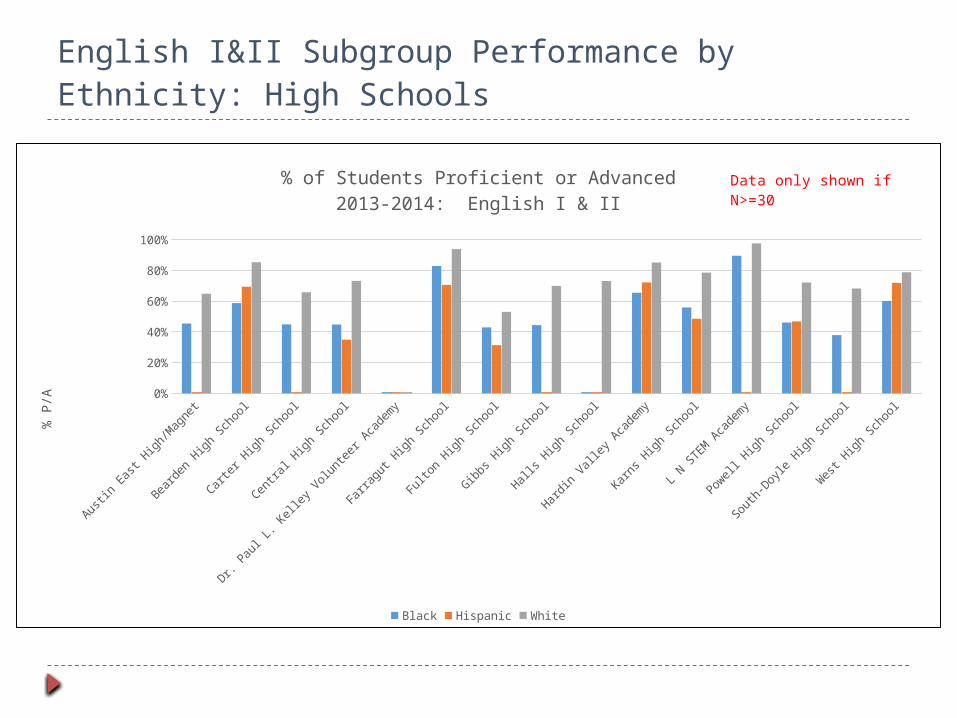
English I&II Subgroup Performance by Ethnicity: High Schools
Austin East
High/Magnet
Bearden High School
Carter H
igh School
Central H
igh School
Dr. Paul L
. Kelle
y Volunteer A
cademy
Farragut H
igh School
Fulton High Sch
ool
Gibbs High Sch
ool
Halls High Sch
ool
Hardin Valley A
cademy
Karns High Sch
ool
L N STEM Aca
demy
Powell High Sch
ool
South-Doyle
High School
West
High School
0%
10%
20%
30%
40%
50%
60%
70%
80%
90%
100%
% of Students Proficient or Advanced2013-2014: English I & II
Black Hispanic White
% P
/A
Data only shown if N>=30

English I&II Subgroup Performance by Socio-Economic Status: High Schools
Austin East
High/Magnet
Bearden High School
Carter H
igh School
Central H
igh School
Dr. Paul L
. Kelle
y Volunteer A
cademy
Farragut H
igh School
Fulton High Sch
ool
Gibbs High Sch
ool
Halls High Sch
ool
Hardin Valley A
cademy
Karns High Sch
ool
L N STEM Aca
demy
Powell High Sch
ool
South-Doyle
High School
West
High School
0%
10%
20%
30%
40%
50%
60%
70%
80%
90%
100%
% of Students Proficient or Advanced2013-2014: English I & II
Economically Disadvantaged Non-Economically Disadvantaged
% P
/A
Data only shown if N>=30
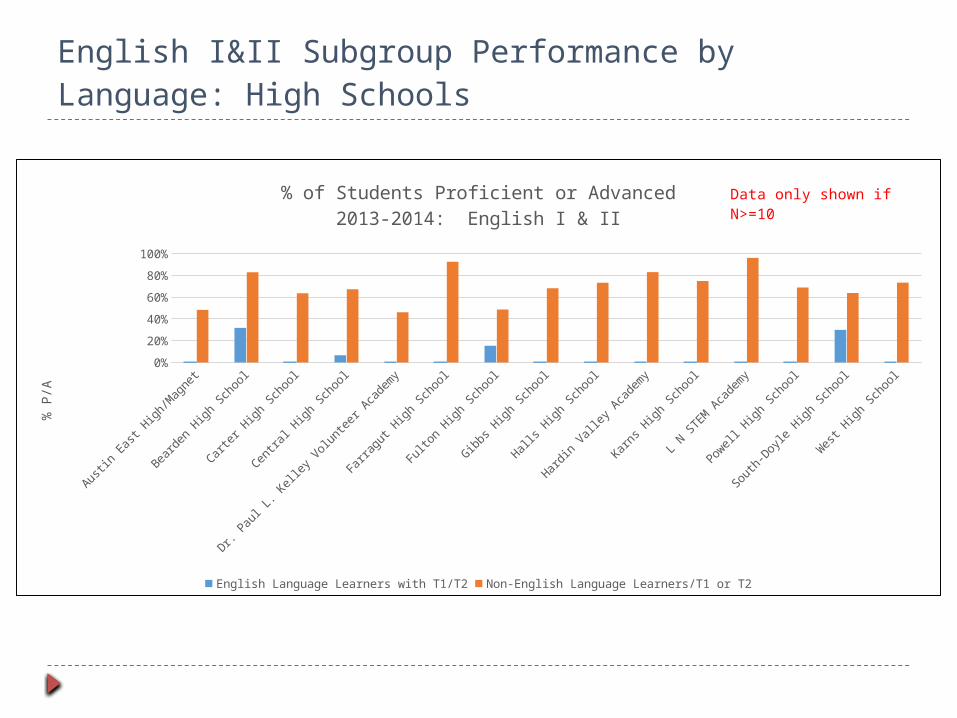
English I&II Subgroup Performance by Language: High Schools
Austin East
High/Magnet
Bearden High School
Carter H
igh School
Central H
igh School
Dr. Paul L
. Kelle
y Volunteer A
cademy
Farragut H
igh School
Fulton High Sch
ool
Gibbs High Sch
ool
Halls High Sch
ool
Hardin Valley A
cademy
Karns High Sch
ool
L N STEM Aca
demy
Powell High Sch
ool
South-Doyle
High School
West
High School
0%
10%
20%
30%
40%
50%
60%
70%
80%
90%
100%
% of Students Proficient or Advanced2013-2014: English I & II
English Language Learners with T1/T2 Non-English Language Learners/T1 or T2
% P
/A
Data only shown if N>=10
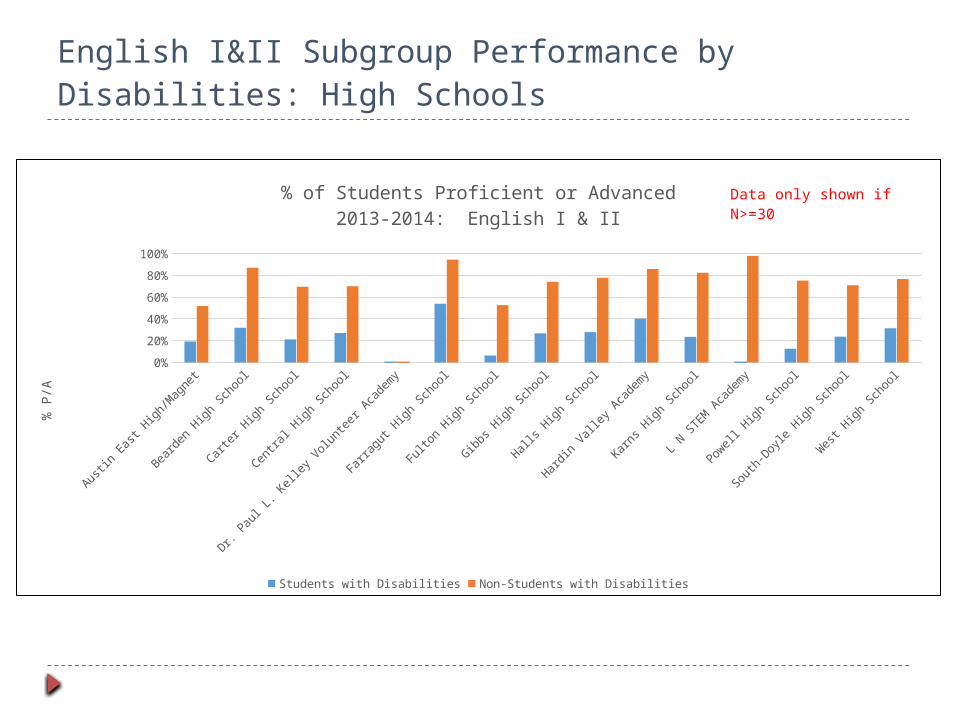
English I&II Subgroup Performance by Disabilities: High Schools
Austin East
High/Magnet
Bearden High School
Carter H
igh School
Central H
igh School
Dr. Paul L
. Kelle
y Volunteer A
cademy
Farragut H
igh School
Fulton High Sch
ool
Gibbs High Sch
ool
Halls High Sch
ool
Hardin Valley A
cademy
Karns High Sch
ool
L N STEM Aca
demy
Powell High Sch
ool
South-Doyle
High School
West
High School
0%
10%
20%
30%
40%
50%
60%
70%
80%
90%
100%
% of Students Proficient or Advanced2013-2014: English I & II
Students with Disabilities Non-Students with Disabilities
% P
/A
Data only shown if N>=30
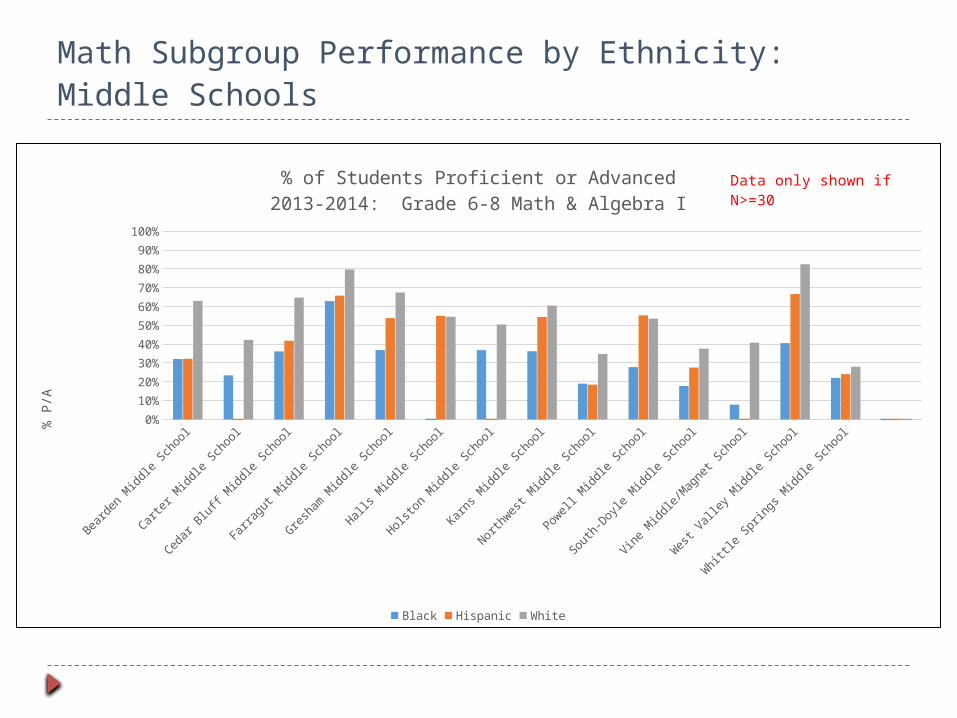
Math Subgroup Performance by Ethnicity:Middle Schools
Bearden Middle Sch
ool
Carter M
iddle School
Cedar Bluff M
iddle School
Farragut M
iddle School
Gresham M
iddle School
Halls M
iddle School
Holston M
iddle School
Karns Middle Sch
ool
Northwest
Middle School
Powell Middle Sch
ool
South-Doyle
Middle Sch
ool
Vine Middle/M
agnet Sch
ool
West
Valley M
iddle School
Whitt
le Springs M
iddle School
0%
10%
20%
30%
40%
50%
60%
70%
80%
90%
100%
% of Students Proficient or Advanced2013-2014: Grade 6-8 Math & Algebra I
Black Hispanic White
% P
/A
Data only shown if N>=30

Math Subgroup Performance by Socio-Economic Status: Middle Schools
Bearden Middle Sch
ool
Carter M
iddle School
Cedar Bluff M
iddle School
Farragut M
iddle School
Gresham M
iddle School
Halls M
iddle School
Holston M
iddle School
Karns Middle Sch
ool
Northwest
Middle School
Powell Middle Sch
ool
South-Doyle
Middle Sch
ool
Vine Middle/M
agnet Sch
ool
West
Valley M
iddle School
Whitt
le Springs M
iddle School
0%
10%
20%
30%
40%
50%
60%
70%
80%
90%
100%
% of Students Proficient or Advanced2013-2014: Grade 6-8 Math & Algebra I
Black Hispanic White
% P
/A
Data only shown if N>=30

Math Subgroup Performance by Language:Middle Schools
Bearden Middle Sch
ool
Carter M
iddle School
Cedar Bluff M
iddle School
Farragut M
iddle School
Gresham M
iddle School
Halls M
iddle School
Holston M
iddle School
Karns Middle Sch
ool
Northwest
Middle School
Powell Middle Sch
ool
South-Doyle
Middle Sch
ool
Vine Middle/M
agnet Sch
ool
West
Valley M
iddle School
Whitt
le Springs M
iddle School
0%
10%
20%
30%
40%
50%
60%
70%
80%
90%
100%
% of Students Proficient or Advanced2013-2014: Grade 6-8 Math & Algebra
English Language Learners with T1/T2 Non-English Language Learners/T1 or T2
% P
/A
Data only shown if N>=10
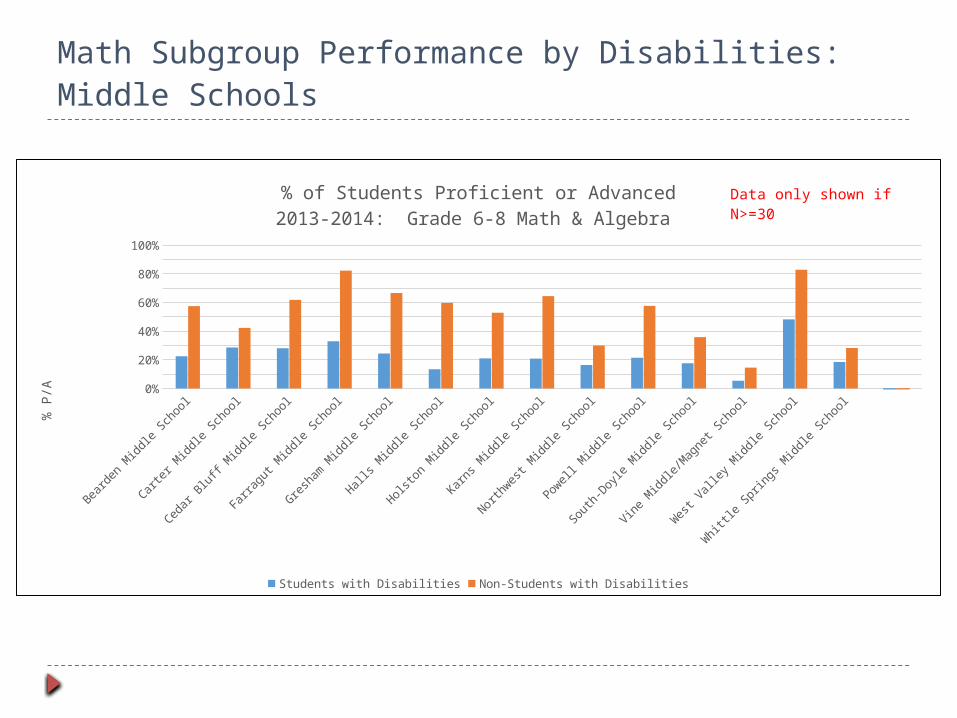
Math Subgroup Performance by Disabilities:Middle Schools
Bearden Middle Sch
ool
Carter M
iddle School
Cedar Bluff M
iddle School
Farragut M
iddle School
Gresham M
iddle School
Halls M
iddle School
Holston M
iddle School
Karns Middle Sch
ool
Northwest
Middle School
Powell Middle Sch
ool
South-Doyle
Middle Sch
ool
Vine Middle/M
agnet Sch
ool
West
Valley M
iddle School
Whitt
le Springs M
iddle School
0%
10%
20%
30%
40%
50%
60%
70%
80%
90%
100%
% of Students Proficient or Advanced2013-2014: Grade 6-8 Math & Algebra
Students with Disabilities Non-Students with Disabilities
% P
/A
Data only shown if N>=30
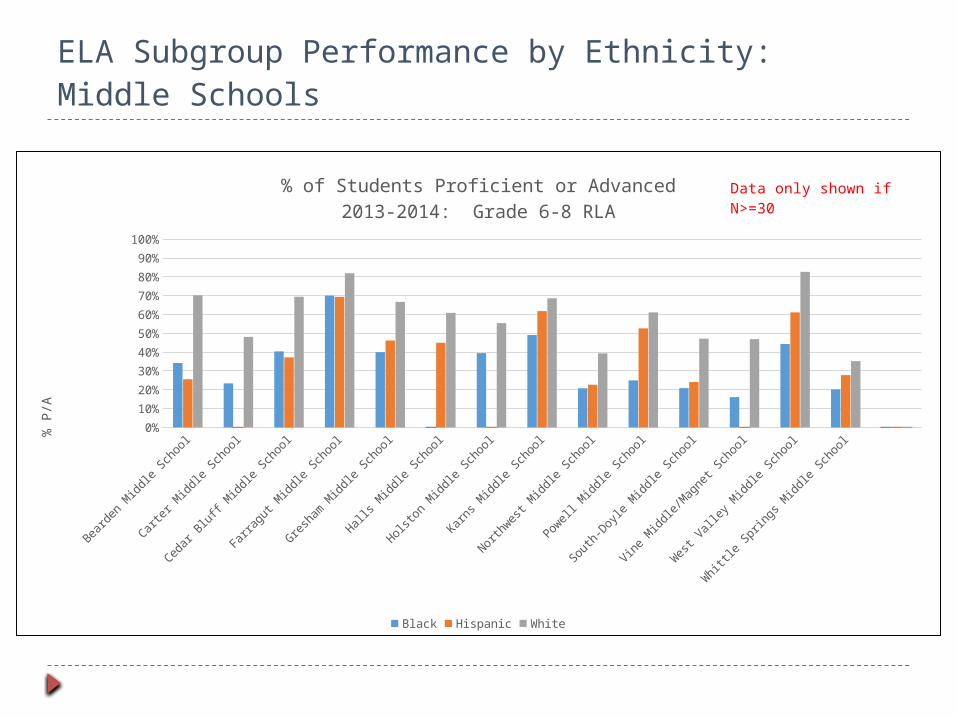
ELA Subgroup Performance by Ethnicity: Middle Schools
Bearden Middle Sch
ool
Carter M
iddle School
Cedar Bluff M
iddle School
Farragut M
iddle School
Gresham M
iddle School
Halls M
iddle School
Holston M
iddle School
Karns Middle Sch
ool
Northwest
Middle School
Powell Middle Sch
ool
South-Doyle
Middle Sch
ool
Vine Middle/M
agnet Sch
ool
West
Valley M
iddle School
Whitt
le Springs M
iddle School
0%
10%
20%
30%
40%
50%
60%
70%
80%
90%
100%
% of Students Proficient or Advanced2013-2014: Grade 6-8 RLA
Black Hispanic White
% P
/A
Data only shown if N>=30
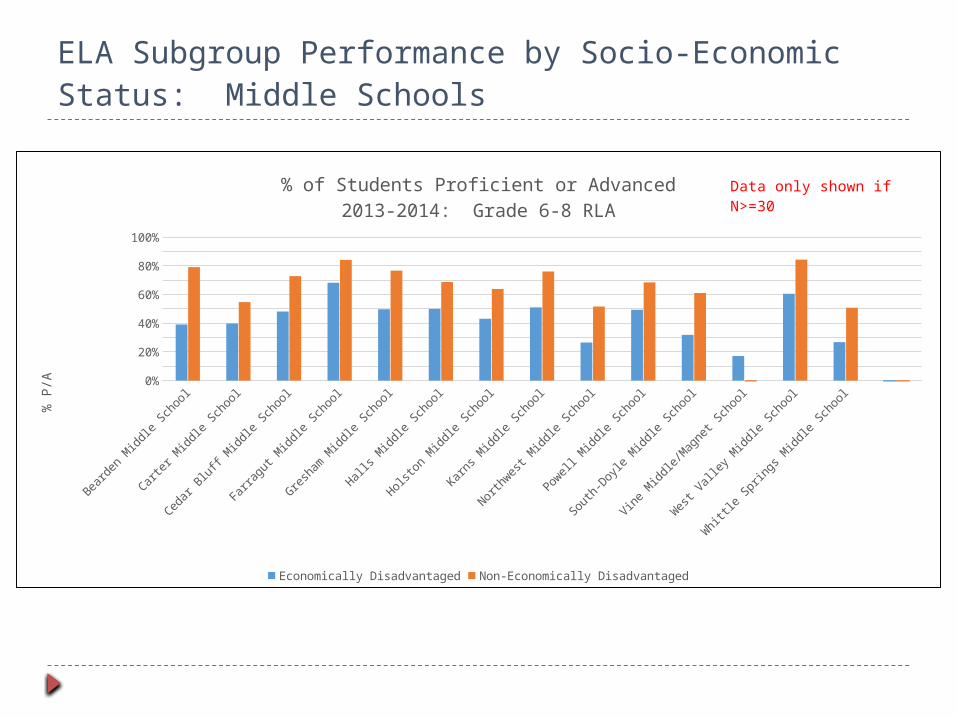
ELA Subgroup Performance by Socio-Economic Status: Middle Schools
Bearden Middle Sch
ool
Carter M
iddle School
Cedar Bluff M
iddle School
Farragut M
iddle School
Gresham M
iddle School
Halls M
iddle School
Holston M
iddle School
Karns Middle Sch
ool
Northwest
Middle School
Powell Middle Sch
ool
South-Doyle
Middle Sch
ool
Vine Middle/M
agnet Sch
ool
West
Valley M
iddle School
Whitt
le Springs M
iddle School
0%
10%
20%
30%
40%
50%
60%
70%
80%
90%
100%
% of Students Proficient or Advanced2013-2014: Grade 6-8 RLA
Economically Disadvantaged Non-Economically Disadvantaged
% P
/A
Data only shown if N>=30
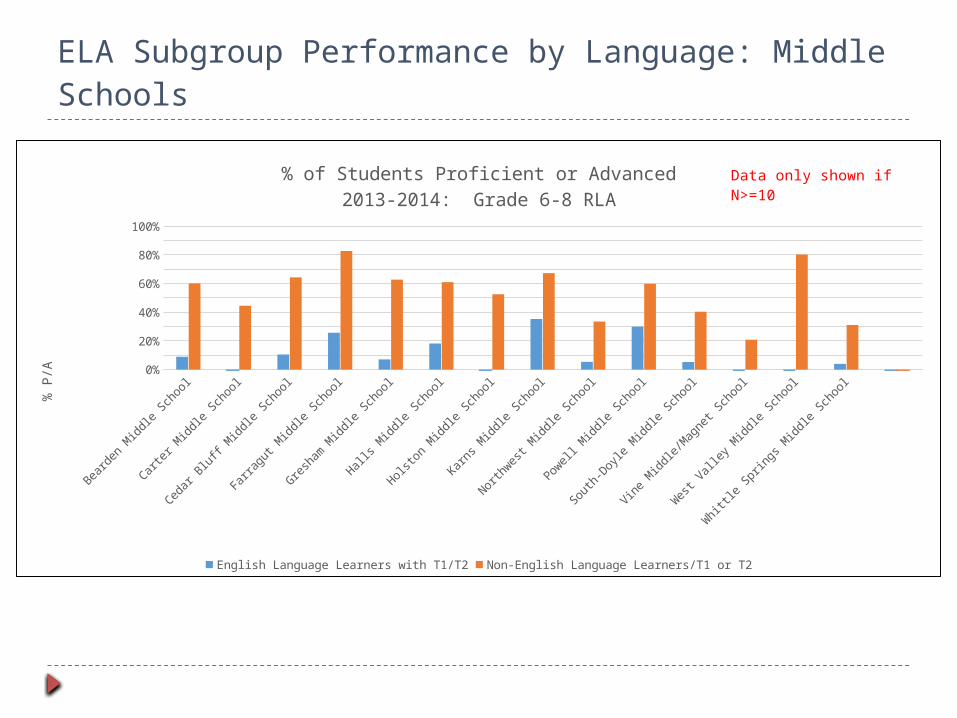
ELA Subgroup Performance by Language: Middle Schools
Bearden Middle Sch
ool
Carter M
iddle School
Cedar Bluff M
iddle School
Farragut M
iddle School
Gresham M
iddle School
Halls M
iddle School
Holston M
iddle School
Karns Middle Sch
ool
Northwest
Middle School
Powell Middle Sch
ool
South-Doyle
Middle Sch
ool
Vine Middle/M
agnet Sch
ool
West
Valley M
iddle School
Whitt
le Springs M
iddle School
0%
10%
20%
30%
40%
50%
60%
70%
80%
90%
100%
% of Students Proficient or Advanced2013-2014: Grade 6-8 RLA
English Language Learners with T1/T2 Non-English Language Learners/T1 or T2
% P
/A
Data only shown if N>=10
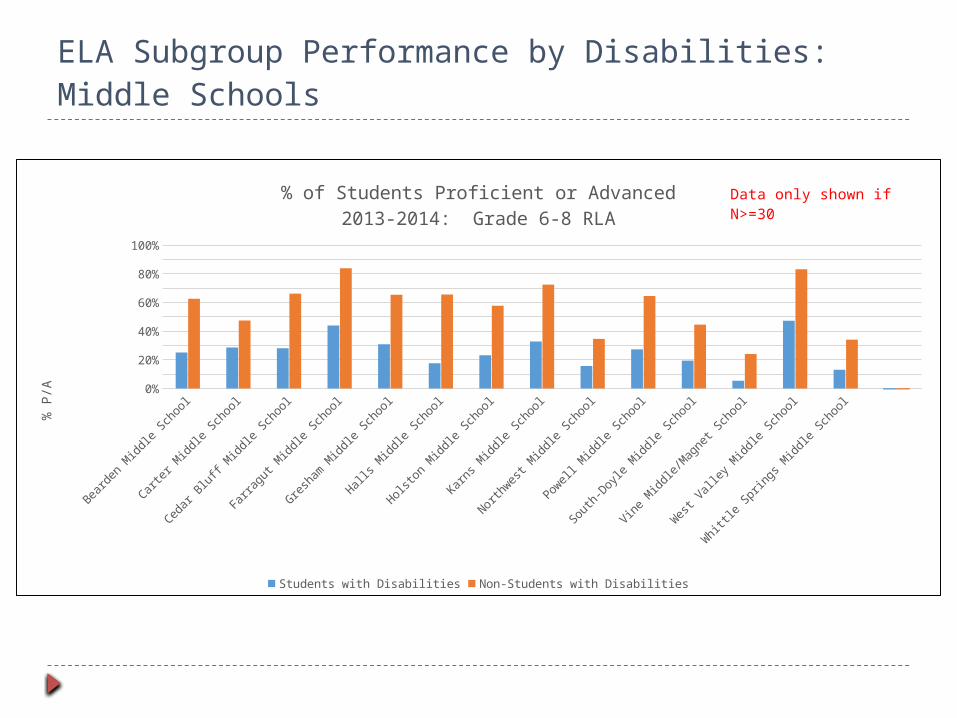
ELA Subgroup Performance by Disabilities: Middle Schools
Bearden Middle Sch
ool
Carter M
iddle School
Cedar Bluff M
iddle School
Farragut M
iddle School
Gresham M
iddle School
Halls M
iddle School
Holston M
iddle School
Karns Middle Sch
ool
Northwest
Middle School
Powell Middle Sch
ool
South-Doyle
Middle Sch
ool
Vine Middle/M
agnet Sch
ool
West
Valley M
iddle School
Whitt
le Springs M
iddle School
0%
10%
20%
30%
40%
50%
60%
70%
80%
90%
100%
% of Students Proficient or Advanced2013-2014: Grade 6-8 RLA
Students with Disabilities Non-Students with Disabilities
% P
/A
Data only shown if N>=30
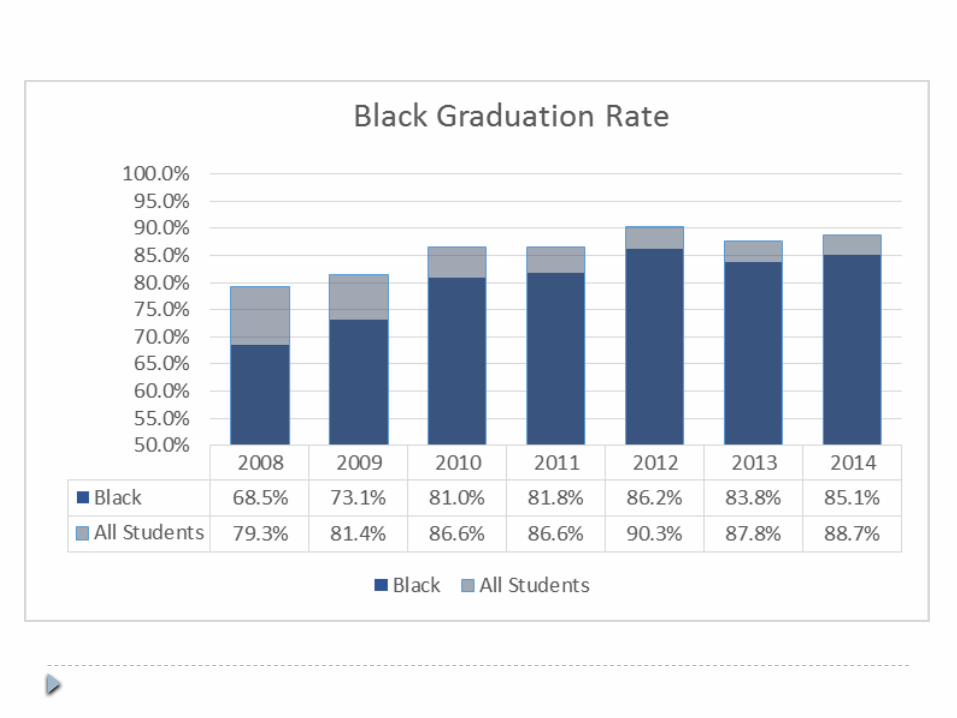
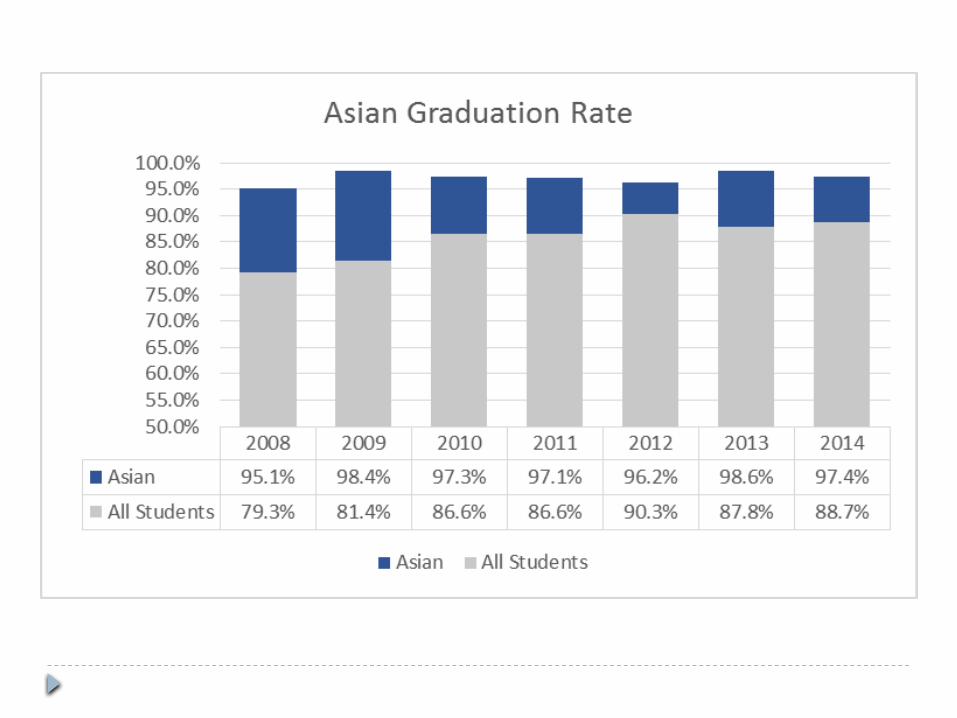
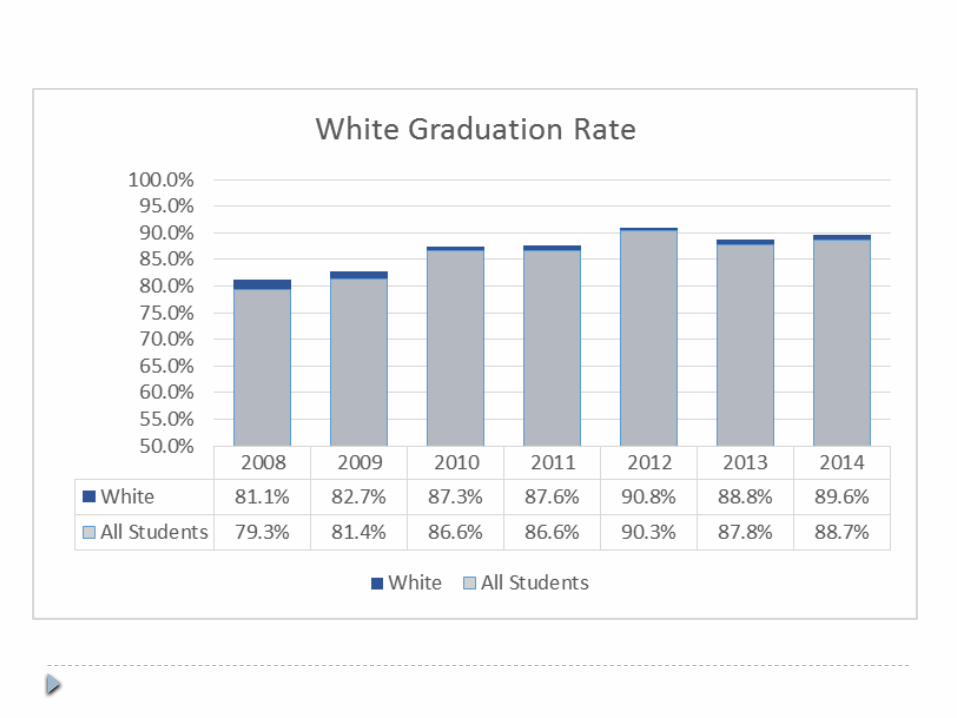
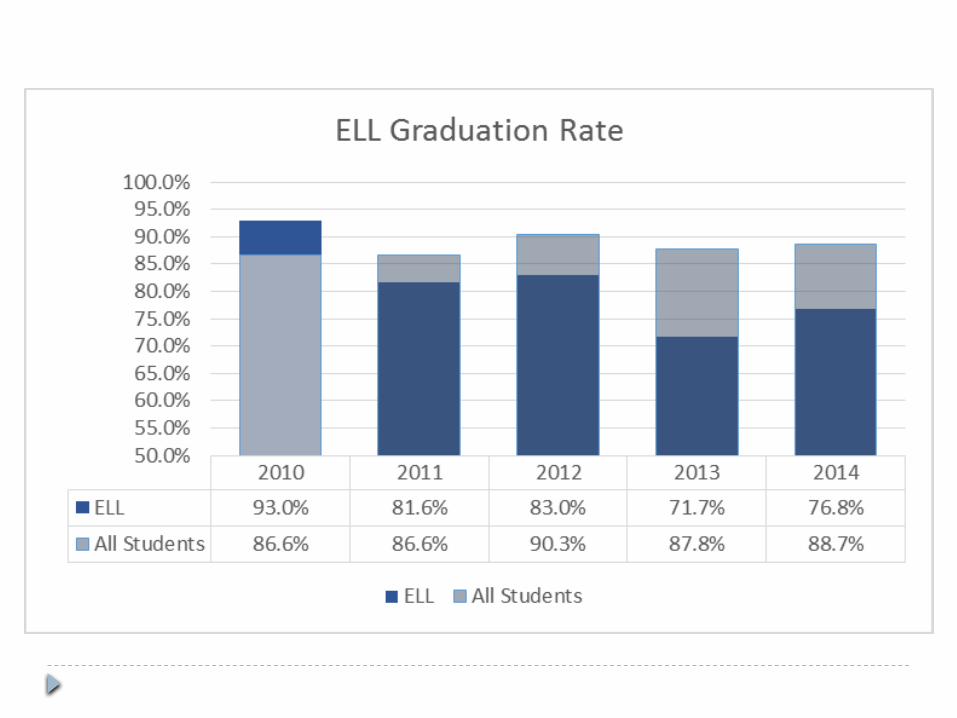
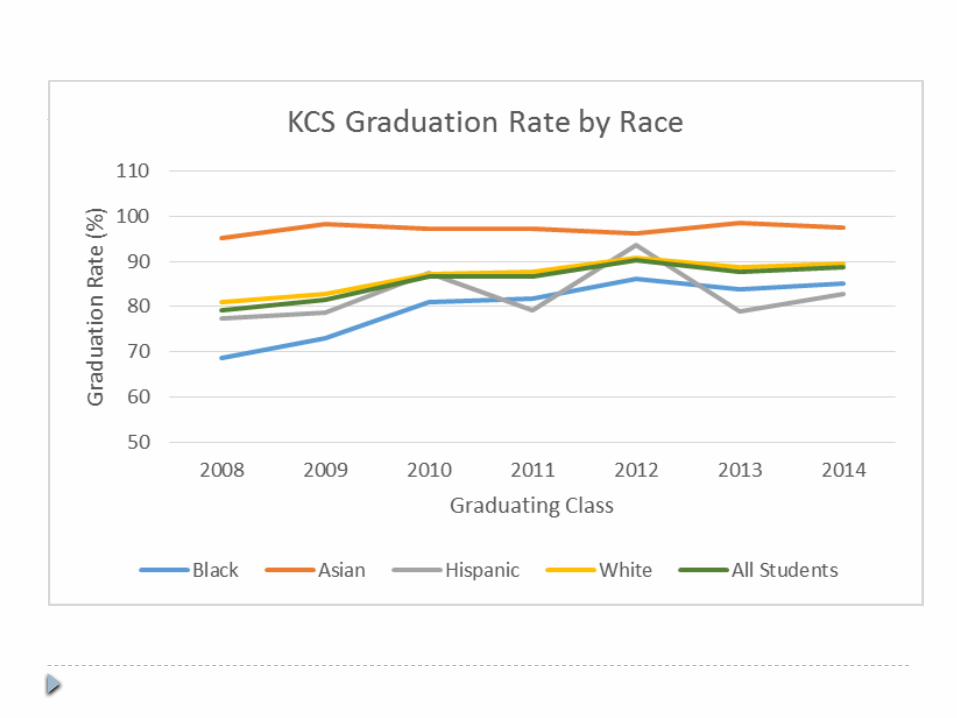
Graduation Rates

Class of 2008 Class of 2009 Class of 2010 Class of 2011 Class of 2012 Class of 2013 Class of 201450%
55%
60%
65%
70%
75%
80%
85%
90%
95%
100%
79.3%81.4%
86.6% 86.6%
90.3%
87.8% 88.7%
Knox County Graduation Rates