Embed Size (px)
Citation preview
KCB INVESTOR PRESENTATION1H2016
GROUP FINANCIAL RESULTSAUGUST, 2016
JOSHUA OIGARAGROUP CEO
LAWRENCE KIMATHIGROUP CFO
OPERATING ENVIRONMENT
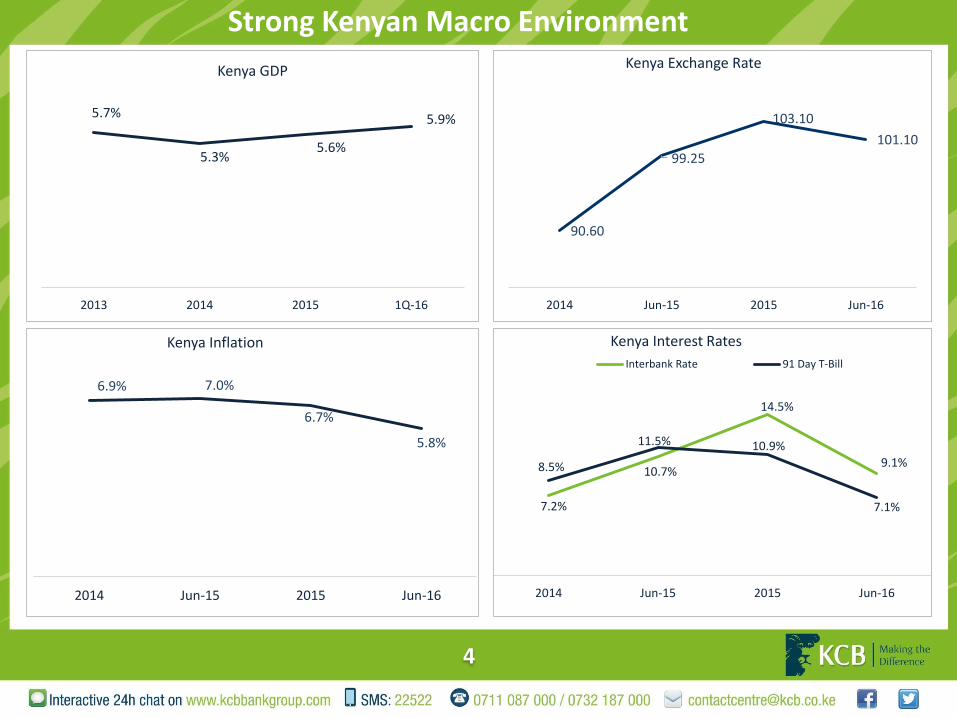
Strong Kenyan Macro Environment
4
90.60
99.25
103.10
101.10
2014 Jun-15 2015 Jun-16
Kenya Exchange Rate
6.9% 7.0%
6.7%
5.8%
2014 Jun-15 2015 Jun-16
Kenya Inflation
7.2%
10.7%
14.5%
9.1%8.5%
11.5% 10.9%
7.1%
2014 Jun-15 2015 Jun-16
Kenya Interest Rates
Interbank Rate 91 Day T-Bill
5.7%
5.3%5.6%
5.9%
2013 2014 2015 1Q-16
Kenya GDP
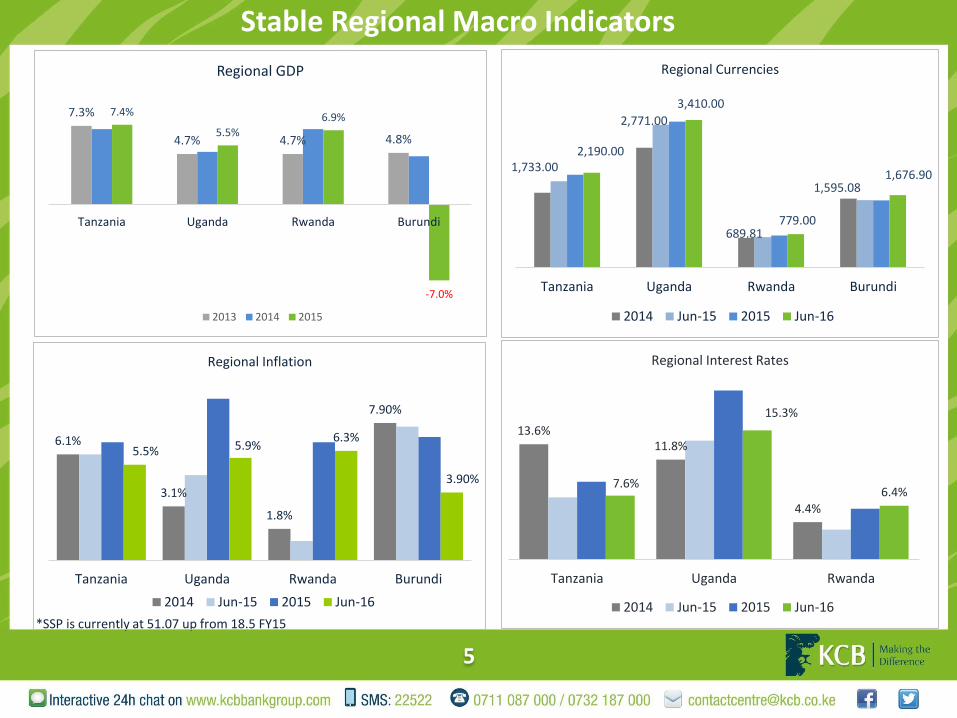
Stable Regional Macro Indicators
5
*SSP is currently at 51.07 up from 18.5 FY15
6.1%
3.1%
1.8%
7.90%
5.5% 5.9%6.3%
3.90%
Tanzania Uganda Rwanda Burundi
Regional Inflation
2014 Jun-15 2015 Jun-16
13.6%11.8%
4.4%
7.6%
15.3%
6.4%
Tanzania Uganda Rwanda
Regional Interest Rates
2014 Jun-15 2015 Jun-16
1,733.00
2,771.00
689.81
1,595.08
2,190.00
3,410.00
779.00
1,676.90
Tanzania Uganda Rwanda Burundi
Regional Currencies
2014 Jun-15 2015 Jun-16
7.3%
4.7% 4.7% 4.8%
7.4%
5.5%
6.9%
-7.0%
Tanzania Uganda Rwanda Burundi
Regional GDP
2013 2014 2015
BANKING SECTOR
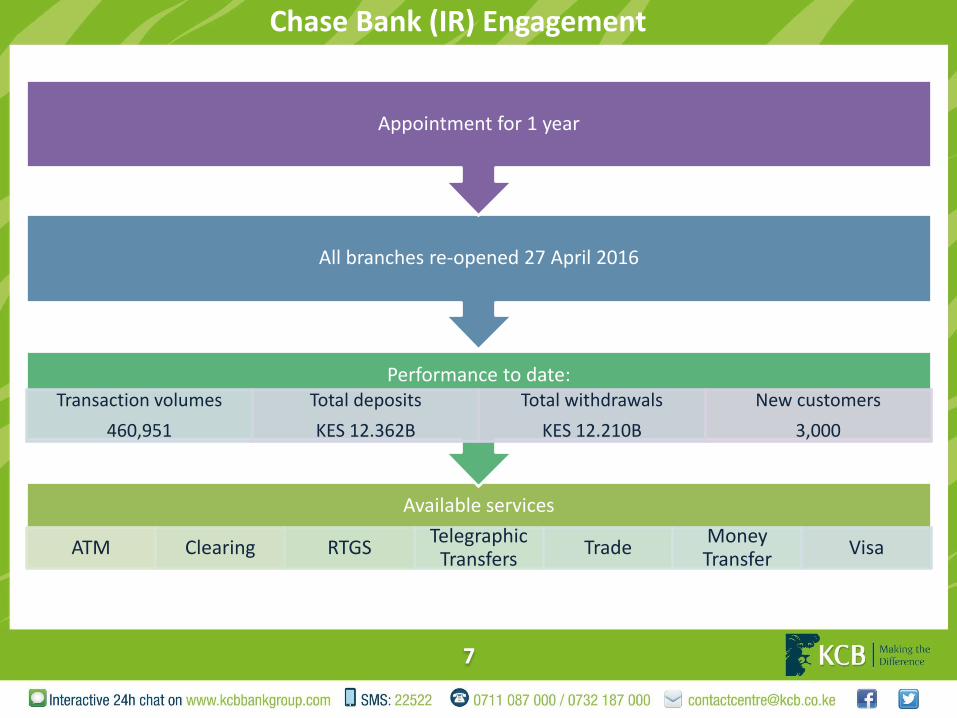
Chase Bank (IR) Engagement
7
Available services
ATM Clearing RTGSTelegraphic
TransfersTrade
Money Transfer
Visa
Performance to date:Transaction volumes
460,951
Total deposits
KES 12.362B
Total withdrawals
KES 12.210B
New customers
3,000
All branches re-opened 27 April 2016
Appointment for 1 year
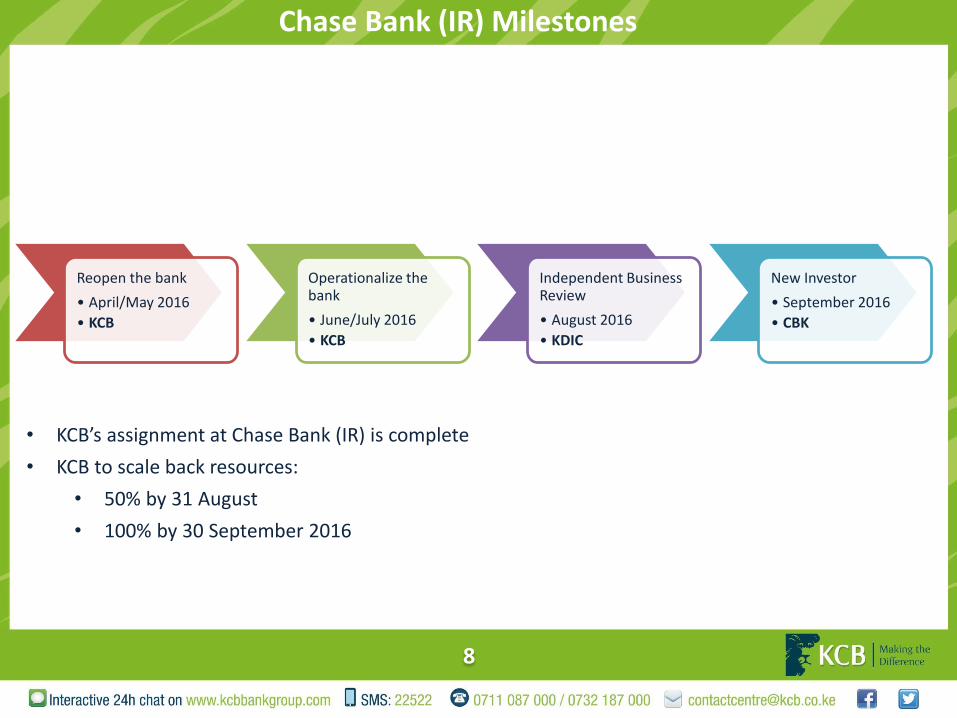
Chase Bank (IR) Milestones
8
Reopen the bank
• April/May 2016
• KCB
Operationalize the bank
• June/July 2016
• KCB
Independent Business Review
• August 2016
• KDIC
New Investor
• September 2016
• CBK
• KCB’s assignment at Chase Bank (IR) is complete
• KCB to scale back resources:
• 50% by 31 August
• 100% by 30 September 2016
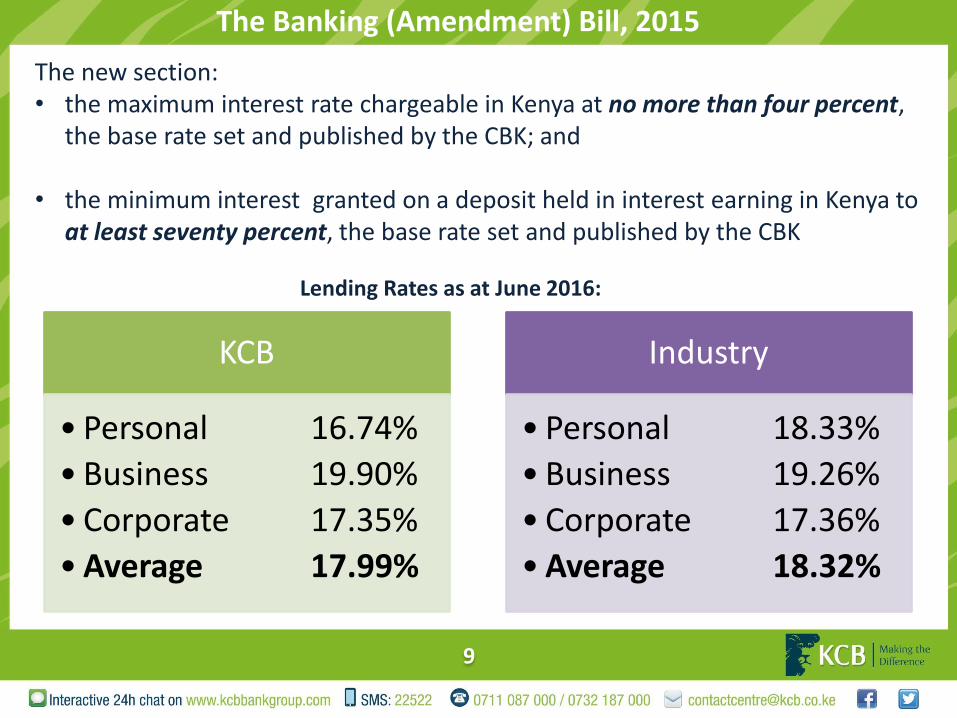
The Banking (Amendment) Bill, 2015
9
The new section:• the maximum interest rate chargeable in Kenya at no more than four percent,
the base rate set and published by the CBK; and
• the minimum interest granted on a deposit held in interest earning in Kenya to at least seventy percent, the base rate set and published by the CBK
KCB
• Personal 16.74%
• Business 19.90%
• Corporate 17.35%
• Average 17.99%
Industry
• Personal 18.33%
• Business 19.26%
• Corporate 17.36%
• Average 18.32%
Lending Rates as at June 2016:
CAPITAL RAISE
Capital Raise
11
• Scrip performance - 54% participation by shareholders in the issue
•Strong cash flow expected for the FY 2016 leading to the rescheduling of the Rights Issue
• Debt capital exercise to close in Q3-16
DIGITAL CHANNEL PERFORMANCE
13
Branch Transactions
22%
Non Branch Transactions
78%
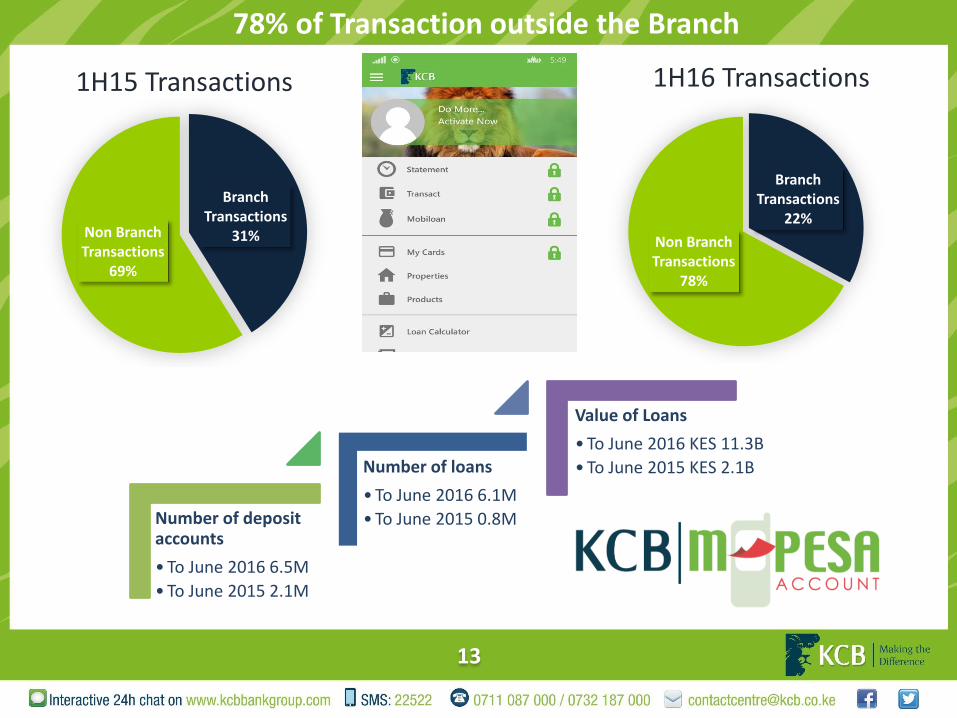
1H16 Transactions
Branch Transactions
31%Non Branch Transactions
69%
1H15 Transactions
78% of Transaction outside the Branch
Number of deposit accounts
• To June 2016 6.5M
• To June 2015 2.1M
Number of loans
• To June 2016 6.1M
• To June 2015 0.8M
Value of Loans
• To June 2016 KES 11.3B
• To June 2015 KES 2.1B
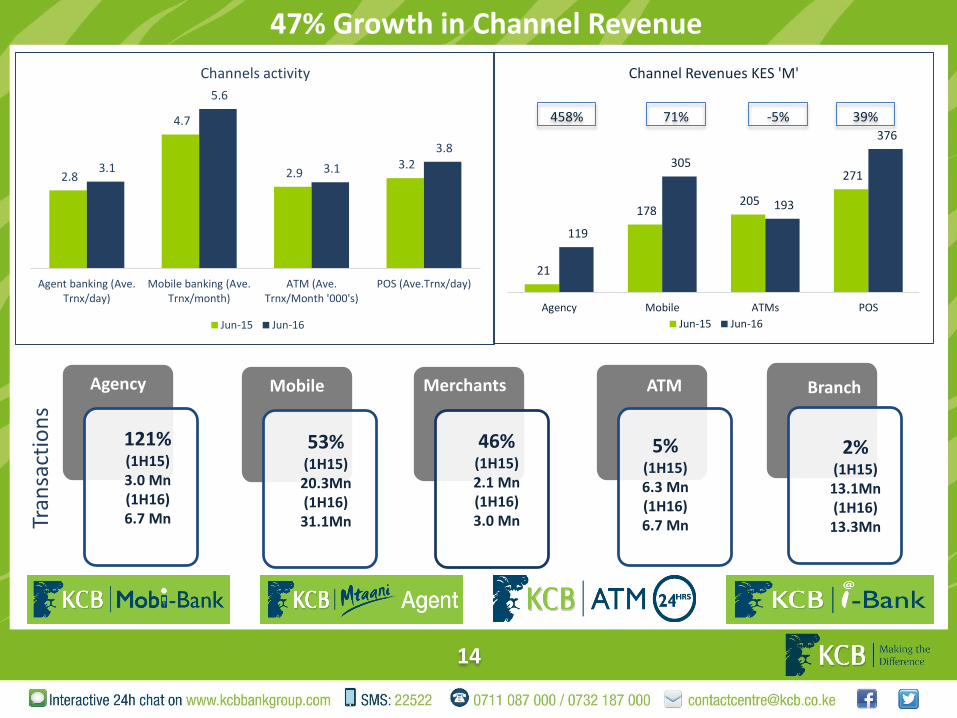
14
47% Growth in Channel Revenue
21
178 205
271
119
305
193
376
Agency Mobile ATMs POS
Channel Revenues KES 'M'
Jun-15 Jun-16
458% 71% -5% 39%
Agency MerchantsMobile
121% (1H15) 3.0 Mn(1H16)6.7 Mn
46%(1H15) 2.1 Mn(1H16)3.0 Mn
53%(1H15) 20.3Mn(1H16)31.1Mn
2%(1H15) 13.1Mn(1H16)13.3Mn
5%(1H15) 6.3 Mn(1H16)6.7 Mn
Branch ATM
Tran
sact
ion
s
2.8
4.7
2.9 3.2 3.1
5.6
3.1
3.8
Agent banking (Ave.Trnx/day)
Mobile banking (Ave.Trnx/month)
ATM (Ave.Trnx/Month '000's)
POS (Ave.Trnx/day)
Channels activity
Jun-15 Jun-16
OUR PERFORMANCE TO DATE
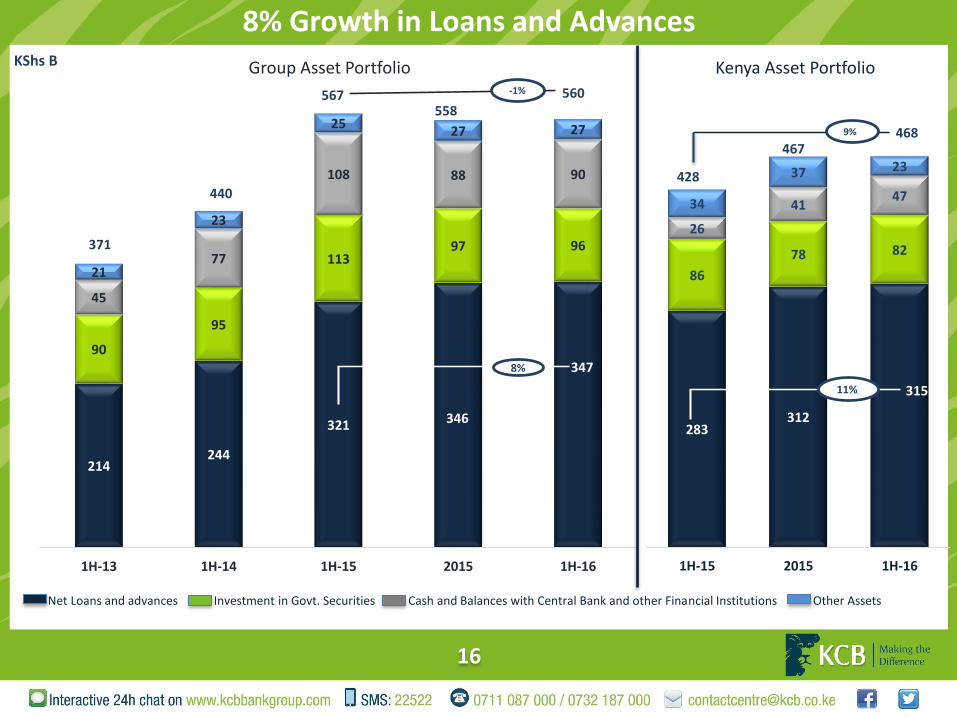
8% Growth in Loans and Advances
16
KShs B
214244
321 346
34790
95
11397 96
45
77
108 88 90
21
23
2527 27
1H-13 1H-14 1H-15 2015 1H-16
Group Asset Portfolio
440
560558
567
371
-1%
8%
283312
315
86
78 82
26
4147
34
37 23
1H-15 2015 1H-16
Kenya Asset Portfolio
9%
Net Loans and advances Investment in Govt. Securities Cash and Balances with Central Bank and other Financial Institutions Other Assets
11%
428
467468
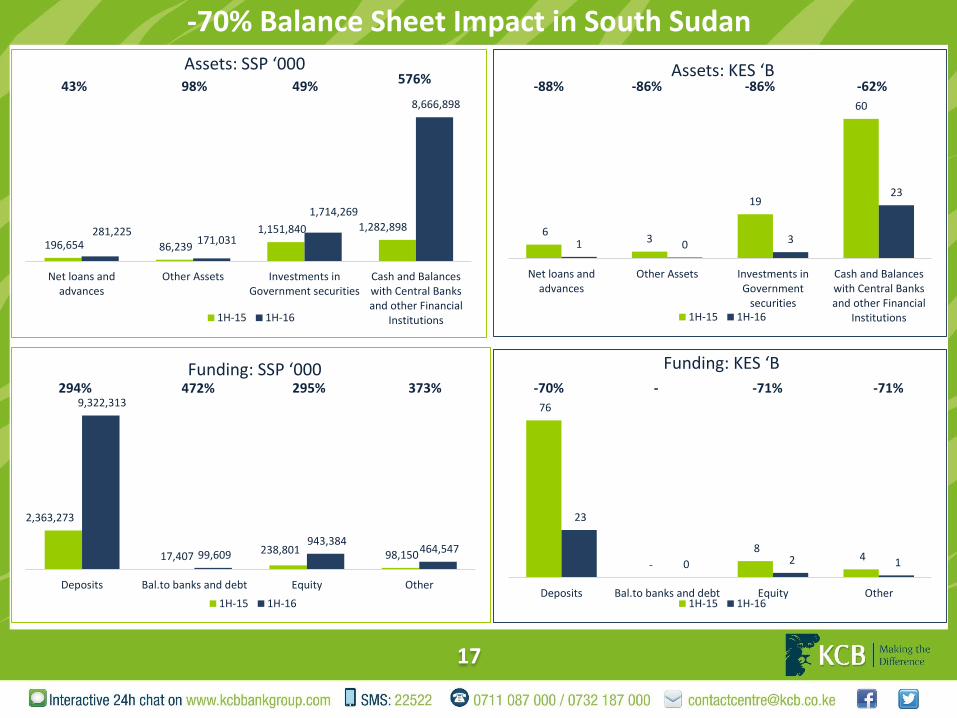
196,654 86,239
1,151,840 1,282,898 281,225 171,031
1,714,269
8,666,898
Net loans andadvances
Other Assets Investments inGovernment securities
Cash and Balanceswith Central Banksand other Financial
Institutions
Assets: SSP ‘000
1H-15 1H-16
576%49%98%43%
-70% Balance Sheet Impact in South Sudan
17
2,363,273
17,407 238,801 98,150
9,322,313
99,609 943,384
464,547
Deposits Bal.to banks and debt Equity Other
Funding: SSP ‘000
1H-15 1H-16
6 3
19
60
1 0 3
23
Net loans andadvances
Other Assets Investments inGovernment
securities
Cash and Balanceswith Central Banksand other Financial
Institutions
Assets: KES ‘B
1H-15 1H-16
-88% -86% -86% -62%
76
-
8 4
23
0 2 1
Deposits Bal.to banks and debt Equity Other
Funding: KES ‘B
1H-15 1H-16
-70% -71%-71%-294% 472% 295% 373%
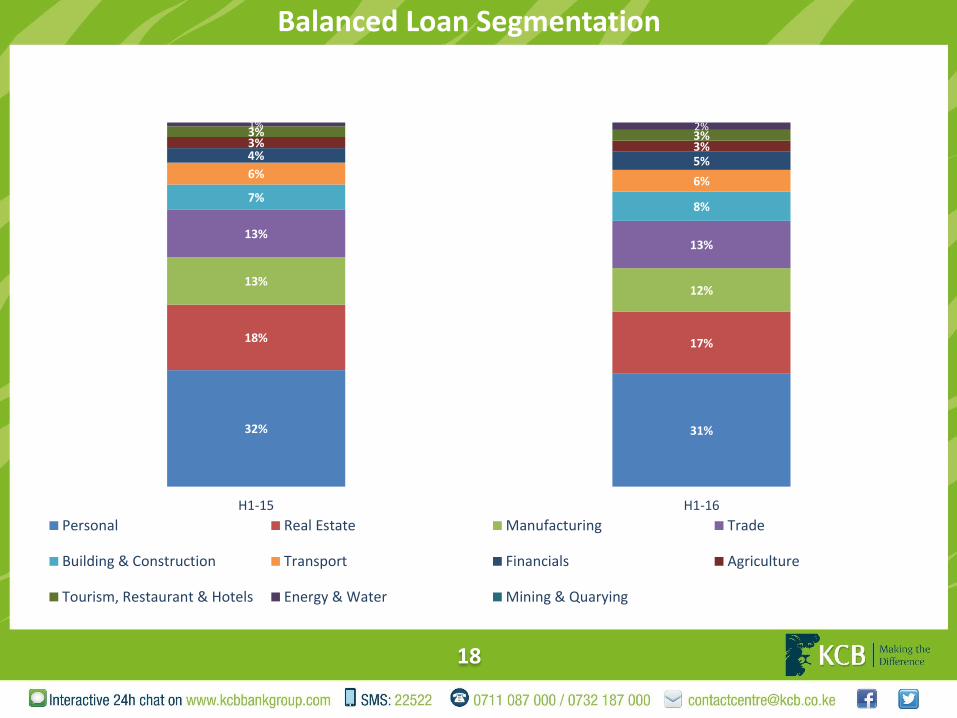
Balanced Loan Segmentation
18
32% 31%
18% 17%
13%12%
13%13%
7%8%
6%6%
3% 3%4% 5%
1% 2%3% 3%
H1-15 H1-16
Personal Real Estate Manufacturing Trade
Building & Construction Transport Financials Agriculture
Tourism, Restaurant & Hotels Energy & Water Mining & Quarying
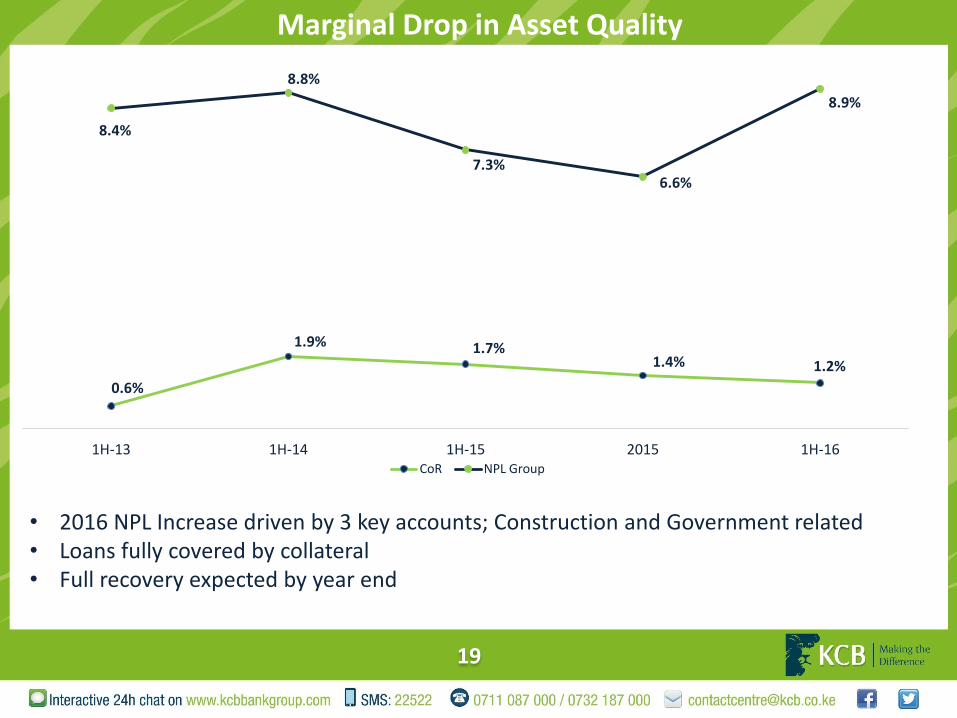
Marginal Drop in Asset Quality
19
0.6%
1.9% 1.7%1.4% 1.2%
8.4%
8.8%
7.3%6.6%
8.9%
1H-13 1H-14 1H-15 2015 1H-16CoR NPL Group
• 2016 NPL Increase driven by 3 key accounts; Construction and Government related• Loans fully covered by collateral• Full recovery expected by year end
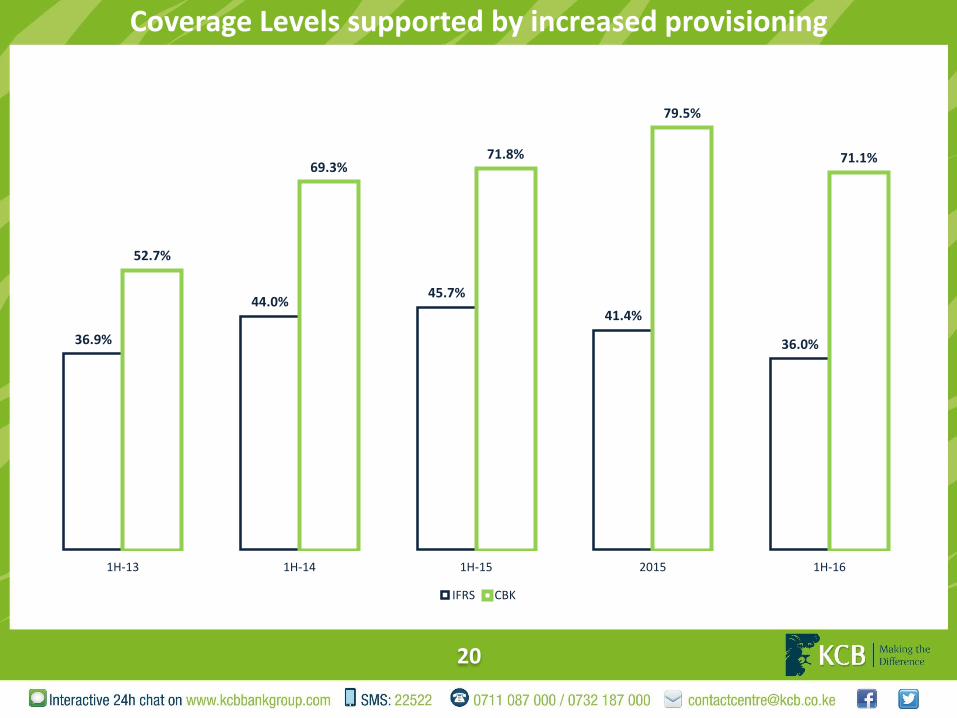
Coverage Levels supported by increased provisioning
20
36.9%
44.0%45.7%
41.4%
36.0%
52.7%
69.3%71.8%
79.5%
71.1%
1H-13 1H-14 1H-15 2015 1H-16
IFRS CBK
288
352
443
424
433
22
17
35 44 26
56
65
78 81 91
6
6
11 9 10
1H-13 1H-14 1H-15 2015 1H-16
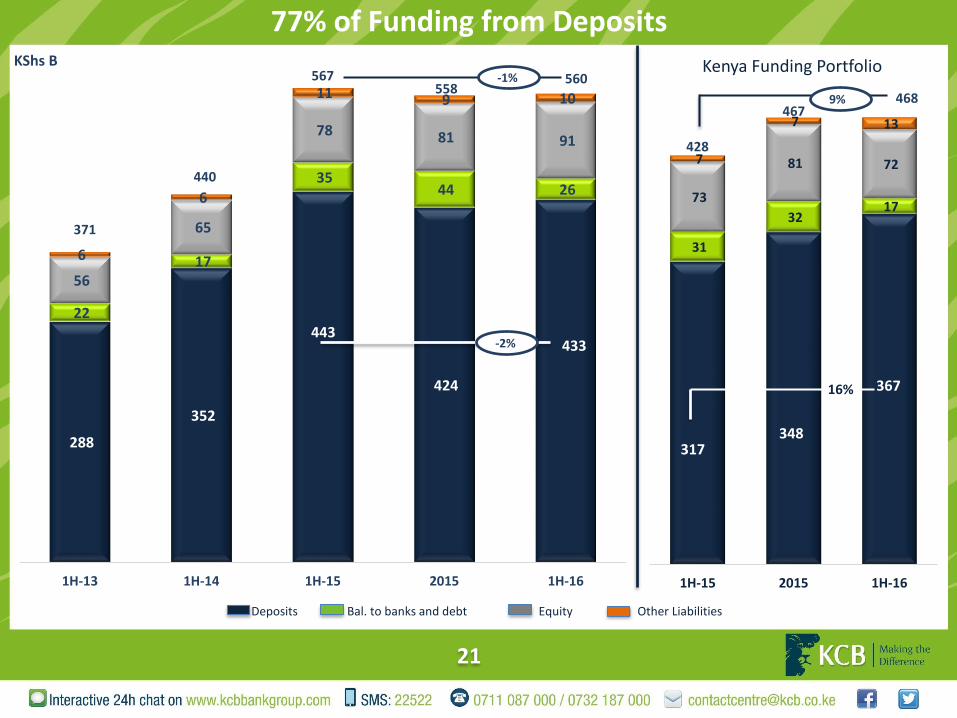
77% of Funding from Deposits
21
KShs B
-2%
-1%
317 348
367
31
32 17
73
81 72 7
7 13
1H-15 2015 1H-16
Kenya Funding Portfolio
16%
428
4674689%
Deposits Bal. to banks and debt Equity Other Liabilities
371
440
567558
560
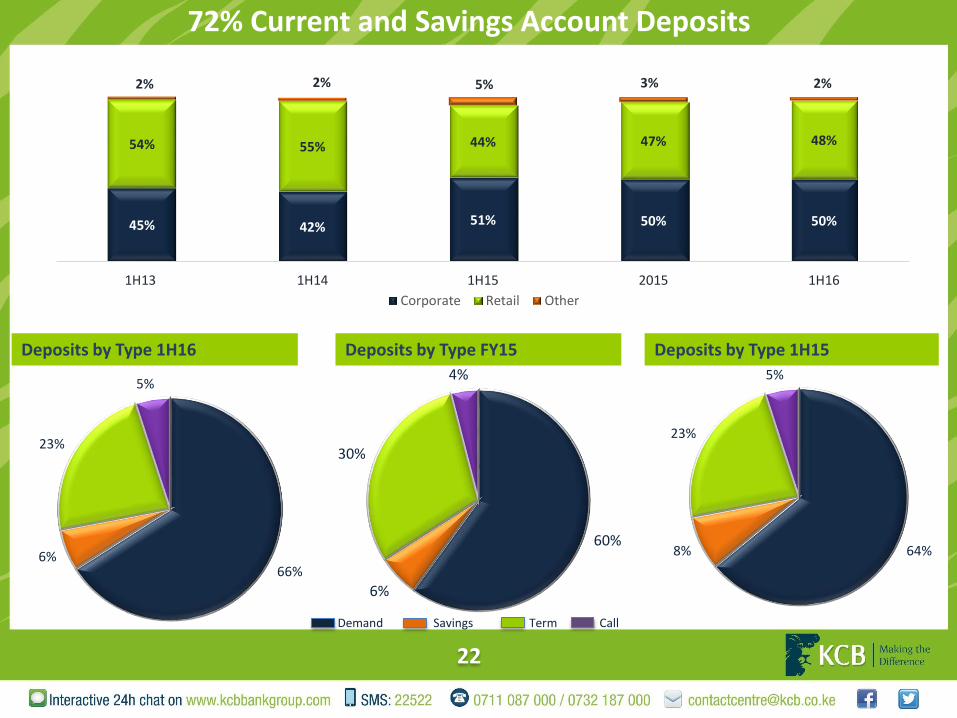
72% Current and Savings Account Deposits
22
Deposits by Type 1H16 Deposits by Type 1H15
64%8%
23%
5%
66%6%
23%
5%
45% 42% 51% 50% 50%
54% 55% 44% 47% 48%
2% 2% 5% 3% 2%
1H13 1H14 1H15 2015 1H16
Corporate Retail Other
60%
6%
30%
4%
Deposits by Type FY15
Demand Savings Term Call
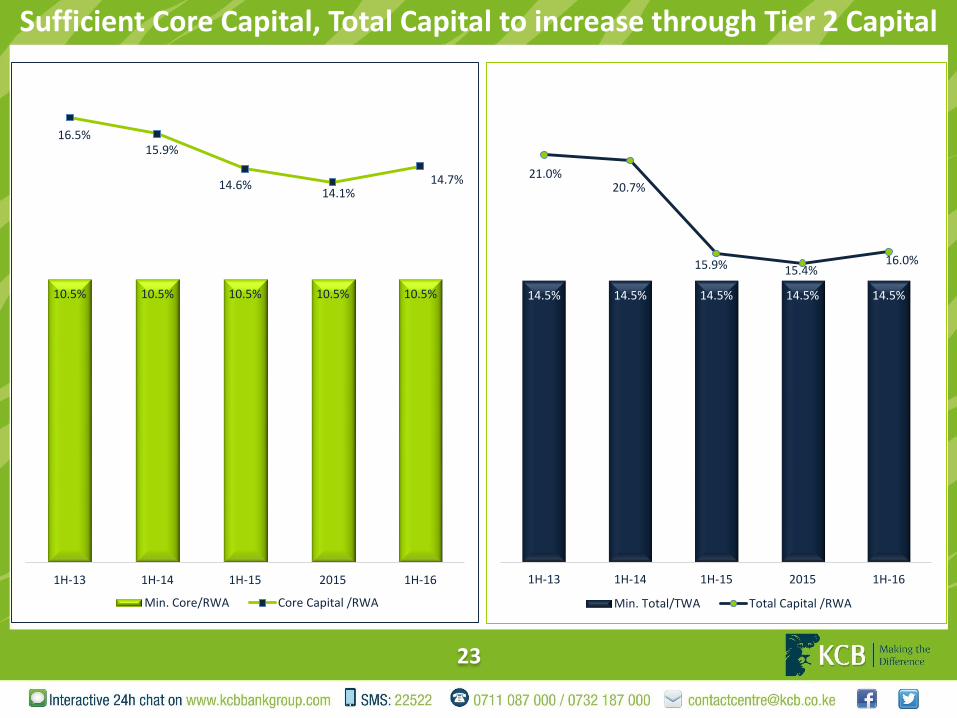
Sufficient Core Capital, Total Capital to increase through Tier 2 Capital
23
10.5% 10.5% 10.5% 10.5% 10.5%
16.5%15.9%
14.6%14.1%
14.7%
1H-13 1H-14 1H-15 2015 1H-16
Min. Core/RWA Core Capital /RWA
14.5% 14.5% 14.5% 14.5% 14.5%
21.0%20.7%
15.9% 15.4%16.0%
1H-13 1H-14 1H-15 2015 1H-16
Min. Total/TWA Total Capital /RWA
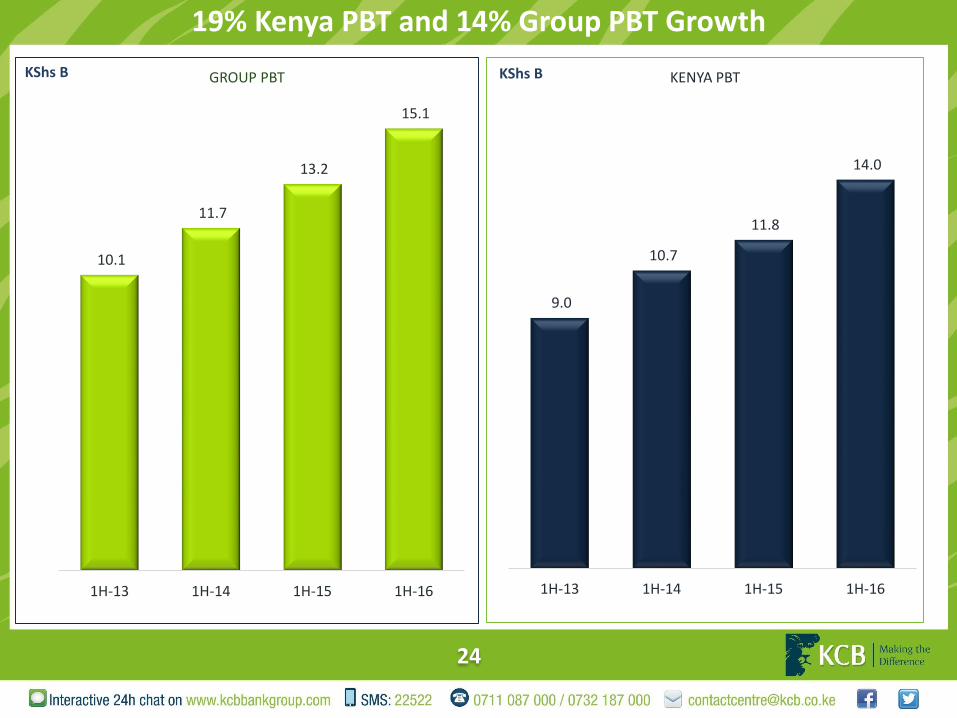
19% Kenya PBT and 14% Group PBT Growth
24
9.0
10.7
11.8
14.0
1H-13 1H-14 1H-15 1H-16
KENYA PBTKShs B
10.1
11.7
13.2
15.1
1H-13 1H-14 1H-15 1H-16
GROUP PBTKShs B
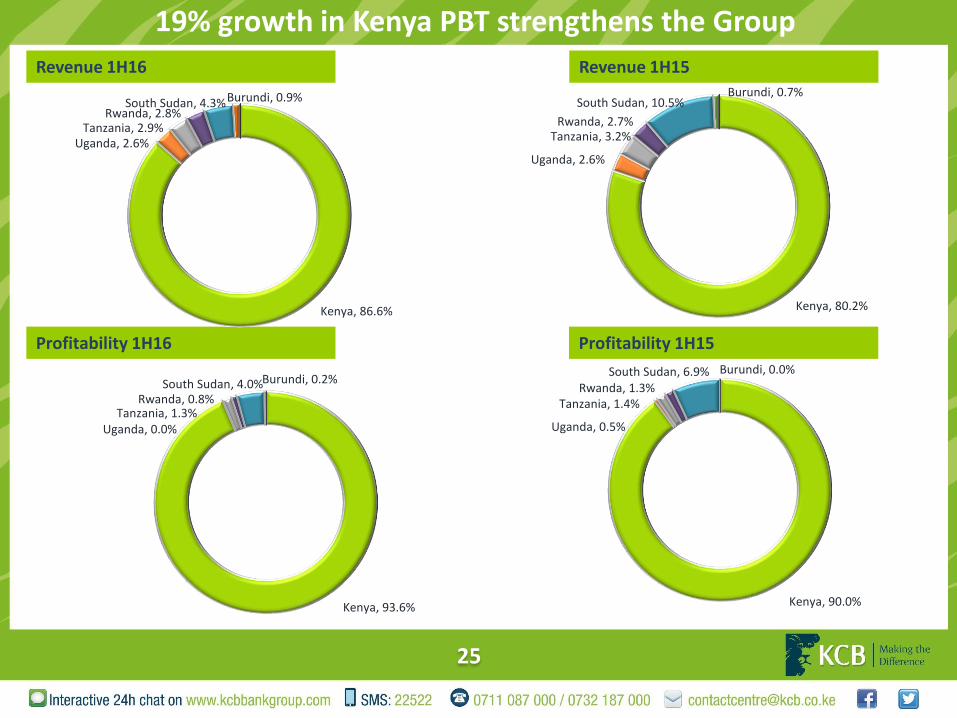
19% growth in Kenya PBT strengthens the Group
25
Profitability 1H15
Revenue 1H15Revenue 1H16
Profitability 1H16
Kenya, 93.6%
Uganda, 0.0%Tanzania, 1.3%
Rwanda, 0.8%South Sudan, 4.0%Burundi, 0.2%
Kenya, 86.6%
Uganda, 2.6%Tanzania, 2.9%
Rwanda, 2.8%South Sudan, 4.3%Burundi, 0.9%
Kenya, 80.2%
Uganda, 2.6%
Tanzania, 3.2%Rwanda, 2.7%
South Sudan, 10.5%Burundi, 0.7%
Kenya, 90.0%
Uganda, 0.5%
Tanzania, 1.4%Rwanda, 1.3%
South Sudan, 6.9% Burundi, 0.0%
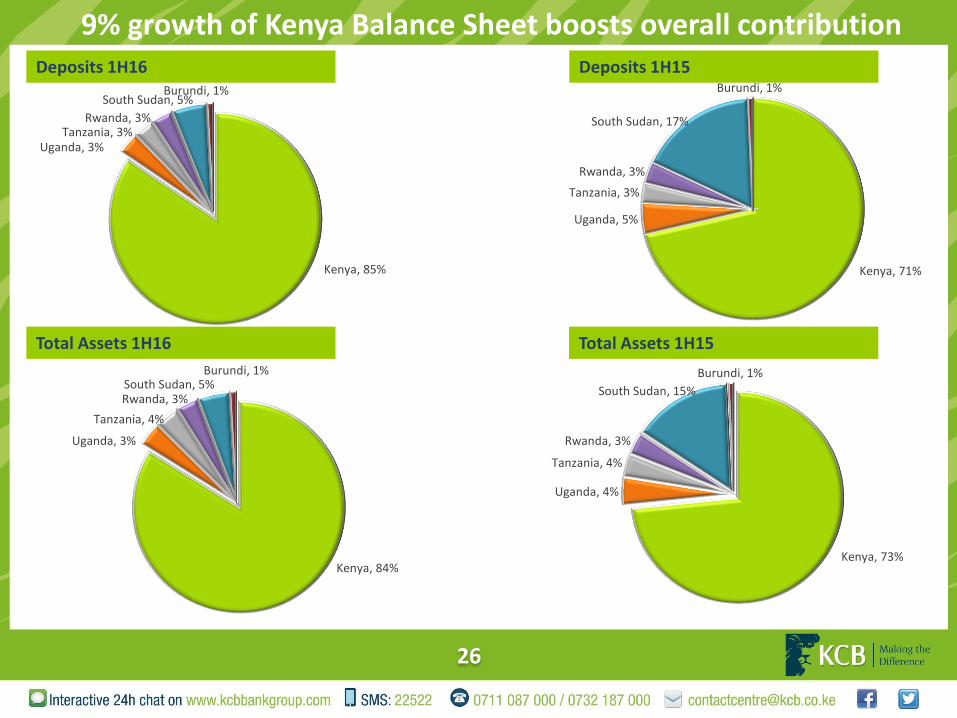
9% growth of Kenya Balance Sheet boosts overall contribution
26
Total Assets 1H15
Deposits 1H15Deposits 1H16
Total Assets 1H16
Kenya, 84%
Uganda, 3%
Tanzania, 4%
Rwanda, 3%South Sudan, 5%
Burundi, 1%
Kenya, 85%
Uganda, 3%Tanzania, 3%
Rwanda, 3%
South Sudan, 5%Burundi, 1%
Kenya, 73%
Uganda, 4%
Tanzania, 4%
Rwanda, 3%
South Sudan, 15%
Burundi, 1%
Kenya, 71%
Uganda, 5%
Tanzania, 3%
Rwanda, 3%
South Sudan, 17%
Burundi, 1%
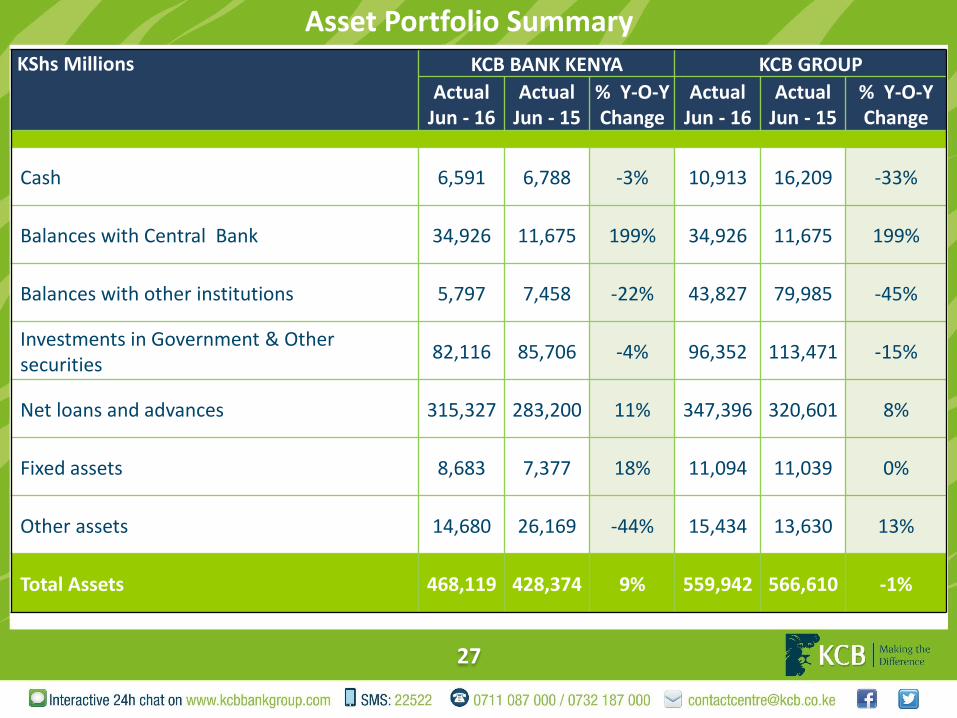
Asset Portfolio Summary
27
KShs Millions KCB BANK KENYA KCB GROUP
Actual Jun - 16
ActualJun - 15
% Y-O-Y Change
Actual Jun - 16
ActualJun - 15
% Y-O-Y Change
Cash 6,591 6,788 -3% 10,913 16,209 -33%
Balances with Central Bank 34,926 11,675 199% 34,926 11,675 199%
Balances with other institutions 5,797 7,458 -22% 43,827 79,985 -45%
Investments in Government & Other securities
82,116 85,706 -4% 96,352 113,471 -15%
Net loans and advances 315,327 283,200 11% 347,396 320,601 8%
Fixed assets 8,683 7,377 18% 11,094 11,039 0%
Other assets 14,680 26,169 -44% 15,434 13,630 13%
Total Assets 468,119 428,374 9% 559,942 566,610 -1%
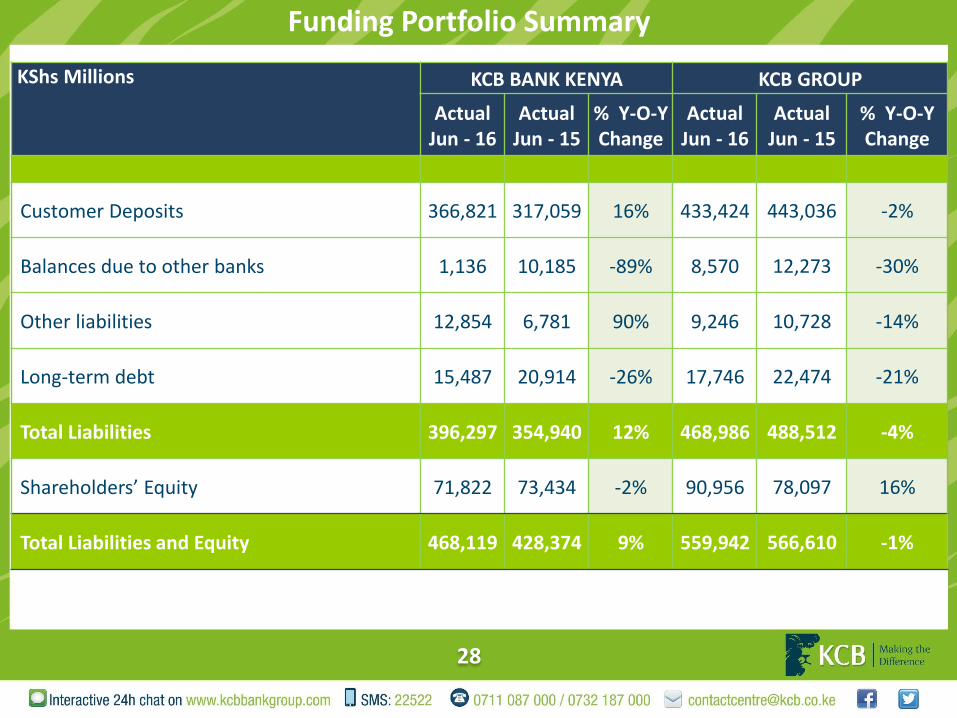
Funding Portfolio Summary
28
KShs Millions KCB BANK KENYA KCB GROUP
Actual Jun - 16
ActualJun - 15
% Y-O-Y Change
Actual Jun - 16
ActualJun - 15
% Y-O-Y Change
Customer Deposits 366,821 317,059 16% 433,424 443,036 -2%
Balances due to other banks 1,136 10,185 -89% 8,570 12,273 -30%
Other liabilities 12,854 6,781 90% 9,246 10,728 -14%
Long-term debt 15,487 20,914 -26% 17,746 22,474 -21%
Total Liabilities 396,297 354,940 12% 468,986 488,512 -4%
Shareholders’ Equity 71,822 73,434 -2% 90,956 78,097 16%
Total Liabilities and Equity 468,119 428,374 9% 559,942 566,610 -1%
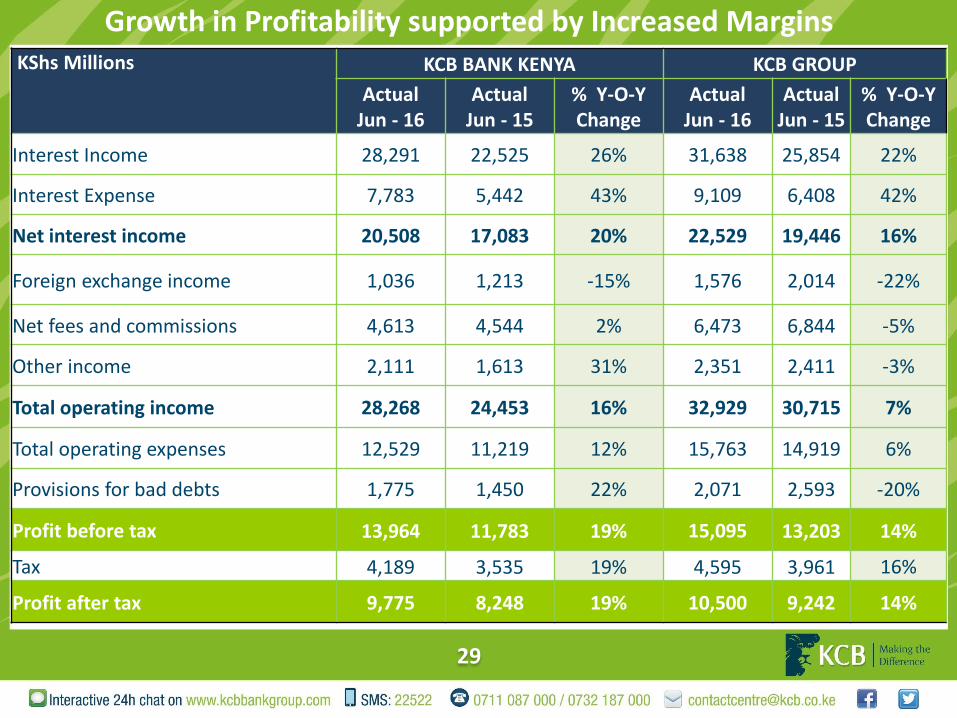
Growth in Profitability supported by Increased Margins
29
KShs Millions KCB BANK KENYA KCB GROUP
Actual Jun - 16
ActualJun - 15
% Y-O-Y Change
Actual Jun - 16
ActualJun - 15
% Y-O-Y Change
Interest Income 28,291 22,525 26% 31,638 25,854 22%
Interest Expense 7,783 5,442 43% 9,109 6,408 42%
Net interest income 20,508 17,083 20% 22,529 19,446 16%
Foreign exchange income 1,036 1,213 -15% 1,576 2,014 -22%
Net fees and commissions 4,613 4,544 2% 6,473 6,844 -5%
Other income 2,111 1,613 31% 2,351 2,411 -3%
Total operating income 28,268 24,453 16% 32,929 30,715 7%
Total operating expenses 12,529 11,219 12% 15,763 14,919 6%
Provisions for bad debts 1,775 1,450 22% 2,071 2,593 -20%
Profit before tax 13,964 11,783 19% 15,095 13,203 14%
Tax 4,189 3,535 19% 4,595 3,961 16%
Profit after tax 9,775 8,248 19% 10,500 9,242 14%
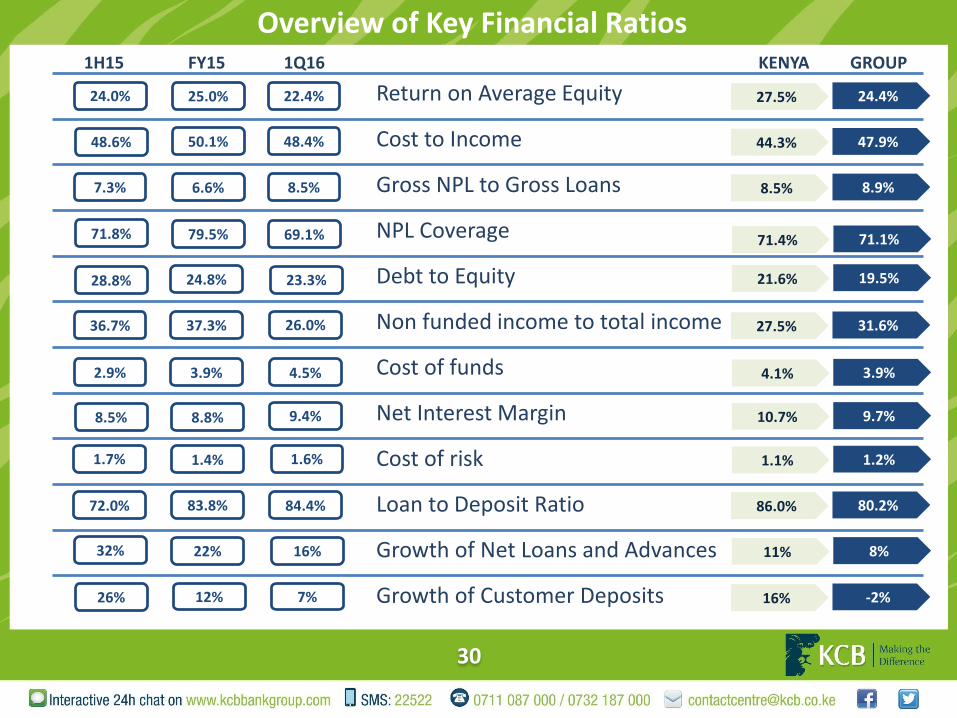
Overview of Key Financial Ratios
30
Return on Average Equity
Cost to Income
Gross NPL to Gross Loans
NPL Coverage
Debt to Equity
Non funded income to total income
Cost of funds
Net Interest Margin
Cost of risk
Loan to Deposit Ratio
Growth of Net Loans and Advances
Growth of Customer Deposits
25.0% 22.4%
50.1% 48.4%
6.6% 8.5%
79.5% 69.1%
24.8% 23.3%
37.3% 26.0%
3.9% 4.5%
8.8% 9.4%
1.4% 1.6%
83.8% 84.4%
22% 16%
12% 7%
24.4%
47.9%
8.9%
71.1%
19.5%
31.6%
3.9%
9.7%
1.2%
80.2%
8%
-2%
1H15 FY15 1Q16 KENYA GROUP
24.0%
48.6%
7.3%
71.8%
28.8%
36.7%
2.9%
8.5%
1.7%
72.0%
32%
26%
27.5%
44.3%
8.5%
71.4%
21.6%
27.5%
4.1%
10.7%
1.1%
86.0%
11%
16%
For further information please contact
Investor Relations departmentEmail: [email protected]
www.kcbbankgroup.com